An abundant quiescent stem cell population in Drosophila Malpighian tubules protects principal cells from kidney stones
- Howard Hughes Medical Institute Research Laboratories, Department of Embryology, Carnegie Institution for Science, United States
Figures
Figure 1 with 1 supplement
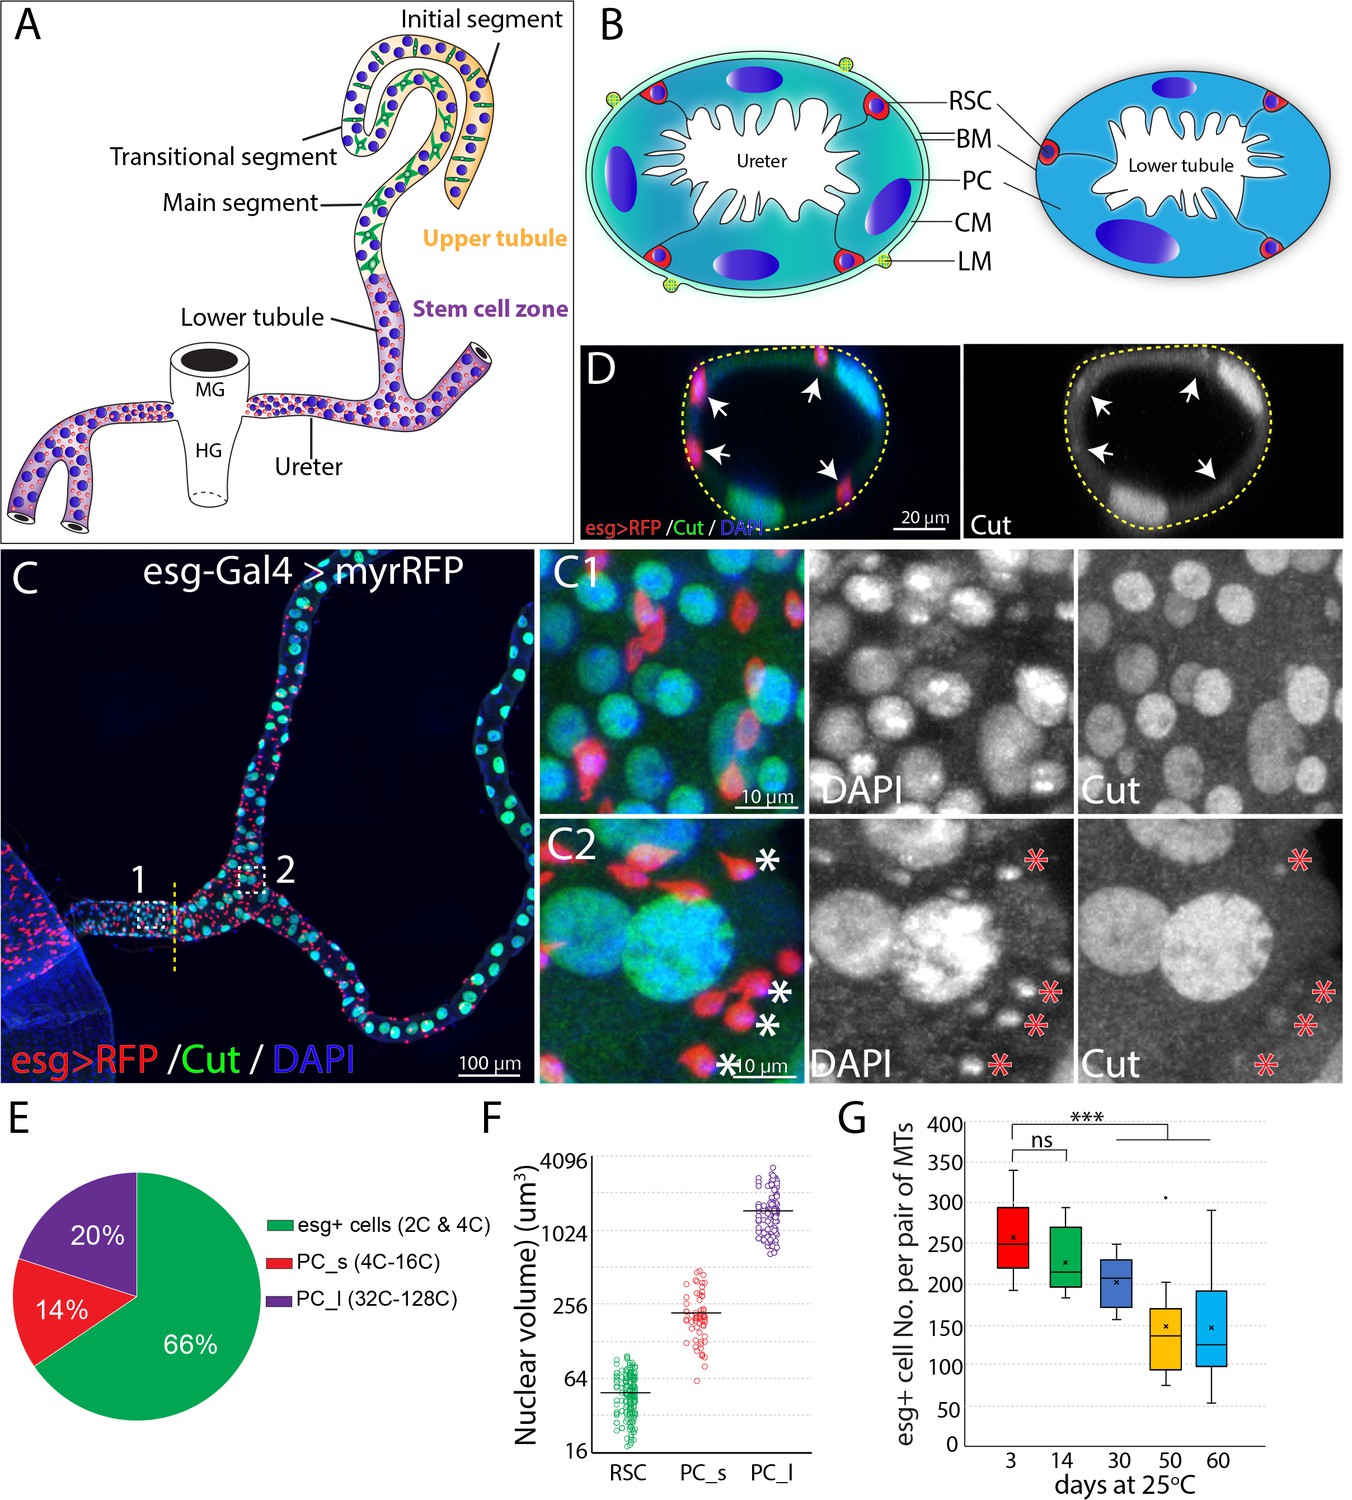
Adult Drosophila renal stem cells reside in the ureter and lower tubules.
(A) Drawing showing an adult Drosophila Malpighian tubule with its connection at the midgut (MG)/hindgut (HG) junction. Stem cell zone (purple) comprises the ureter and lower tubules, upper tubules (yellow) consist of main segment, transitional segment and initial segment. Renal stem cells (red), principal cells (blue) and stellate cells (green) are indicated. (B) Drawing of cross section of the ureter (left) and lower tubule (right). RSC: renal stem cell; BM: basement membrane; PC: principal cell; CM: circular muscle; LM: longitudinal muscle. (C) Z-stacked immunofluorescence micrograph of the ureter and lower tubules from a 3 day old esg-Gal4 >UAS myrRFP female. The lower ureter containing smaller PCs joins with the upper ureter containing large PCs as indicted by a dotted line. Regions of both C1 and C2 are shown at high magnification on the right. Note relatively weak staining of Cut was seen in RSCs (denoted by asterisks). (D) A cross section view of lower tubule. RSCs are indicated by arrows. (E) Graph summarizing the relative numbers of the major cell types in the ureter and lower tubules. PC_s: small principal cells located at the lower ureter; PC_l: large principal cells located at the upper ureter and lower tubules. n = 10 3–5 days old animals. (F) Plot of nuclear volume of the indicated cells from the stem cell zone, showing differences that strongly correlate with ploidy. (G) Box plot showing the number of RSCs per pair of Malpighian tubules in 3,14,30,50 and 60 day-old animals. n = 8–29 animals.. *** denotes Student’s t test p<0.001, ns denotes not significant with p>0.05. For (E), (F) and (G), see also Figure 1—source data 1.
-
Figure 1—source data 1
Source data for Figure 1E-G.
- https://cdn.elifesciences.org/articles/54096/elife-54096-fig1-data1-v2.xlsx
Figure 1—figure supplement 1
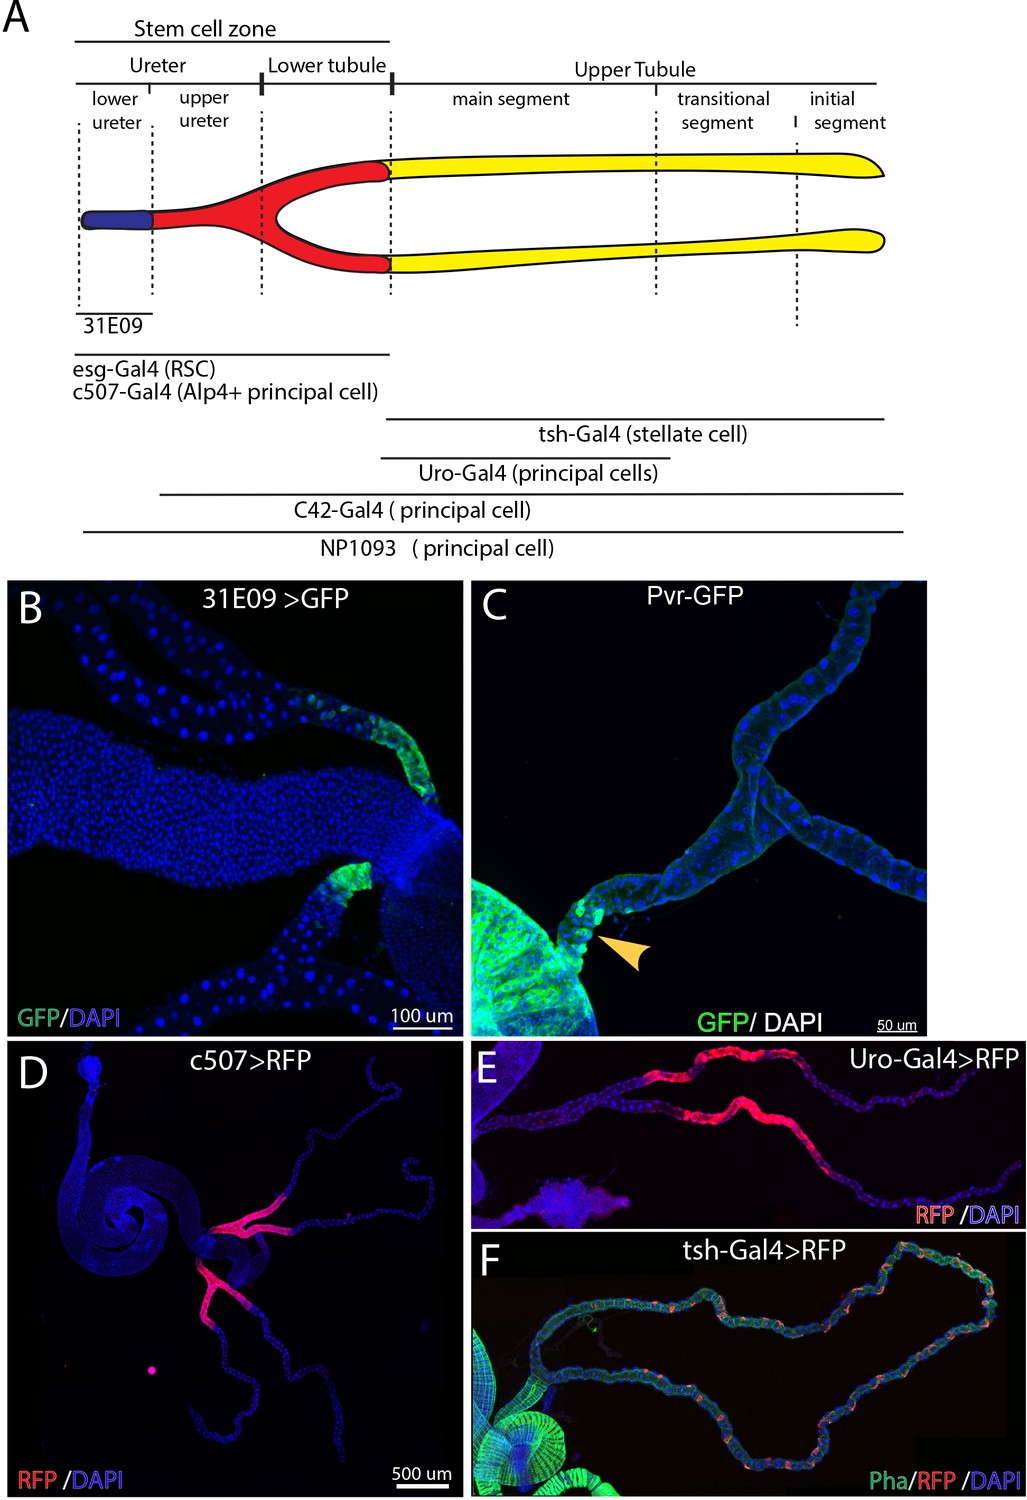
Adult Drosophila Malpighian tubules are organized into different compartments.
(A) Schematic drawing of adult Malpighian tubules showing the compartments and some useful Gal4 drivers. (B) 31E09-Gal4 > GFP marks the lower ureter. (C) Pvr-GFP is expressed in PCs of lower ureter. (D) c507 >RFP marks the ureter as well as lower tubules. (E) Uro >RFP marks main segment. (F) Stellate cells marked by the expression of tsh-Gal >RFP are only present in the upper tubules. Drosophila ureter is surrounded by circular muscle and longitudinal muscle as revealed by phalloidin staining (green).
Figure 2
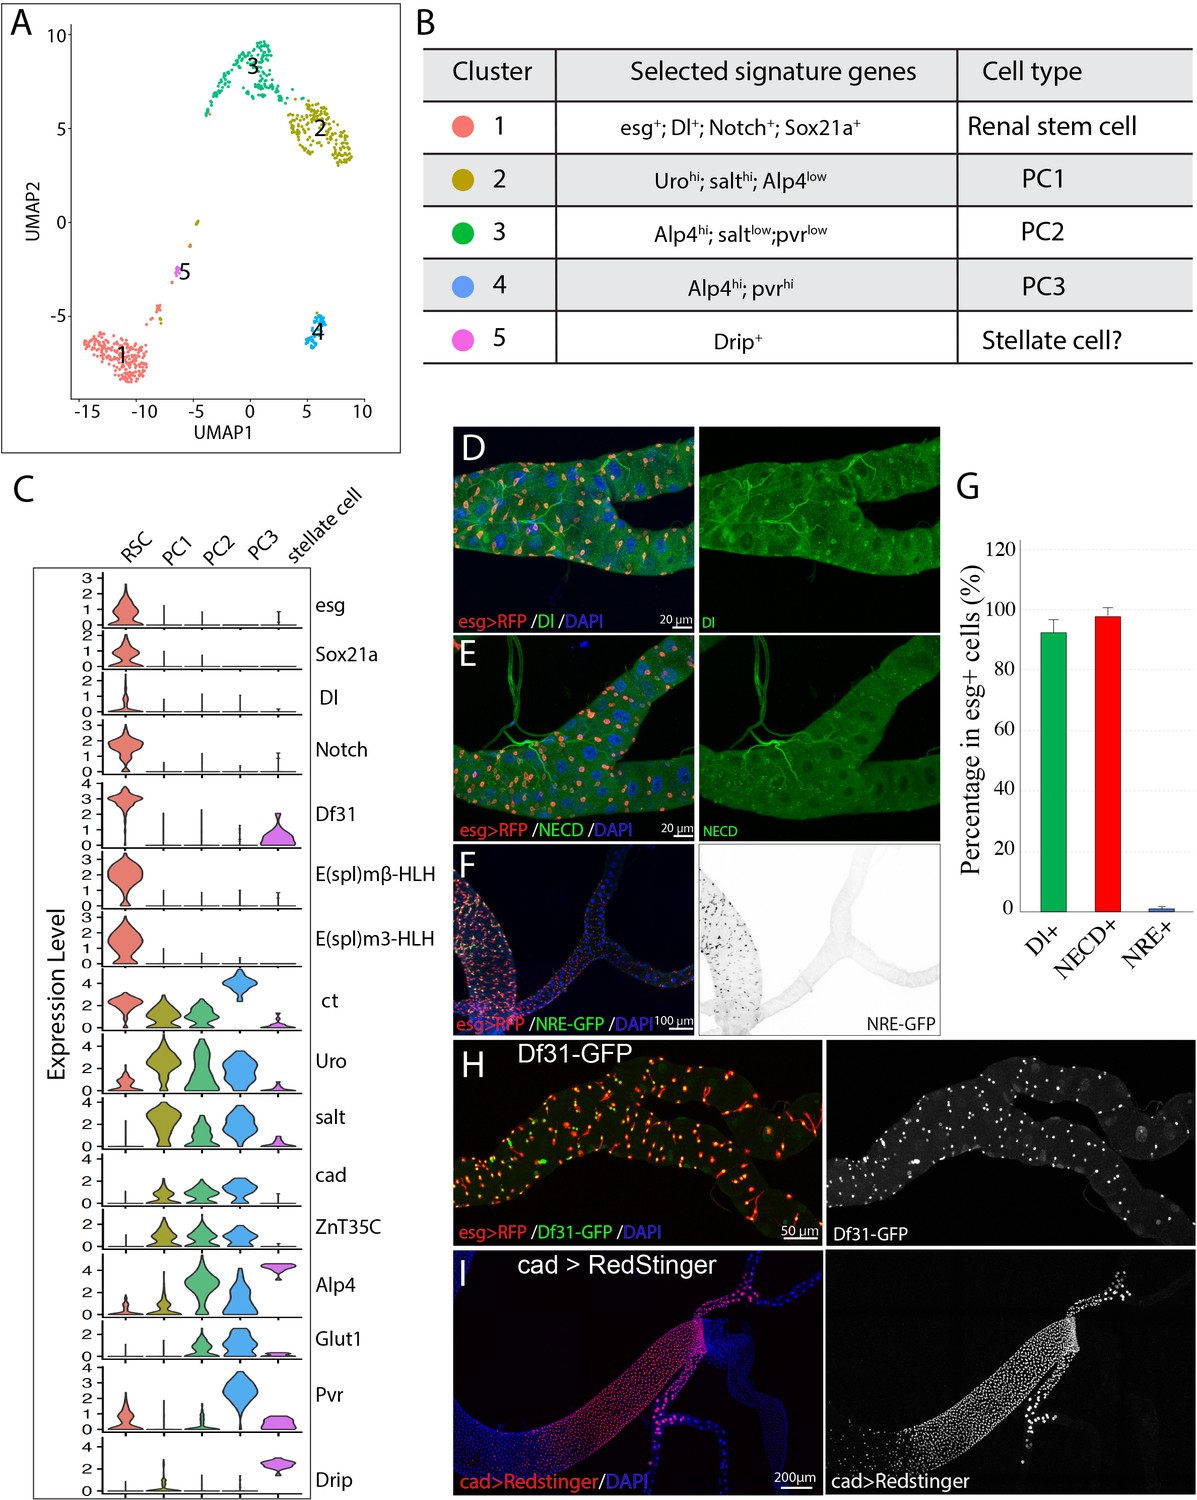
Single cell gene expression of the SCZ in adult Malpighian tubule.
(A). Uniform Manifold Approximation and Projection (UMAP) plot of tubule cells in the SCZ of adult Malpighian tubules. (B) Cell types are identified based on differentially expressed marker genes. (C) Violin plots showing the expression of selected genes among the five cell types. (D). Immunostaining of Dl showing Dl is expressed in RSCs. (E) Immunostaining of the Notch extracellular domain (NECD) showing Notch is expressed in RSCs. (F) Immunofluorescence micrograph showing NRE-GFP is barely detectable in adult Malpighian tubules. (G) Quantification of percentage of RSCs that express Dl, Notch and NRE-GFP, respectively. Data are means ± SD, n = 10–11 animals. See Figure 2—source data 1. (H) Expression of Df31-GFP is highly enriched in RSCs. (I) Expression of cad visualized using cad-Gal4 driven UAS-RedStinger expression.
-
Figure 2—source data 1
Source data for Figure 2G.
- https://cdn.elifesciences.org/articles/54096/elife-54096-fig2-data1-v2.xlsx
Figure 3 with 3 supplements
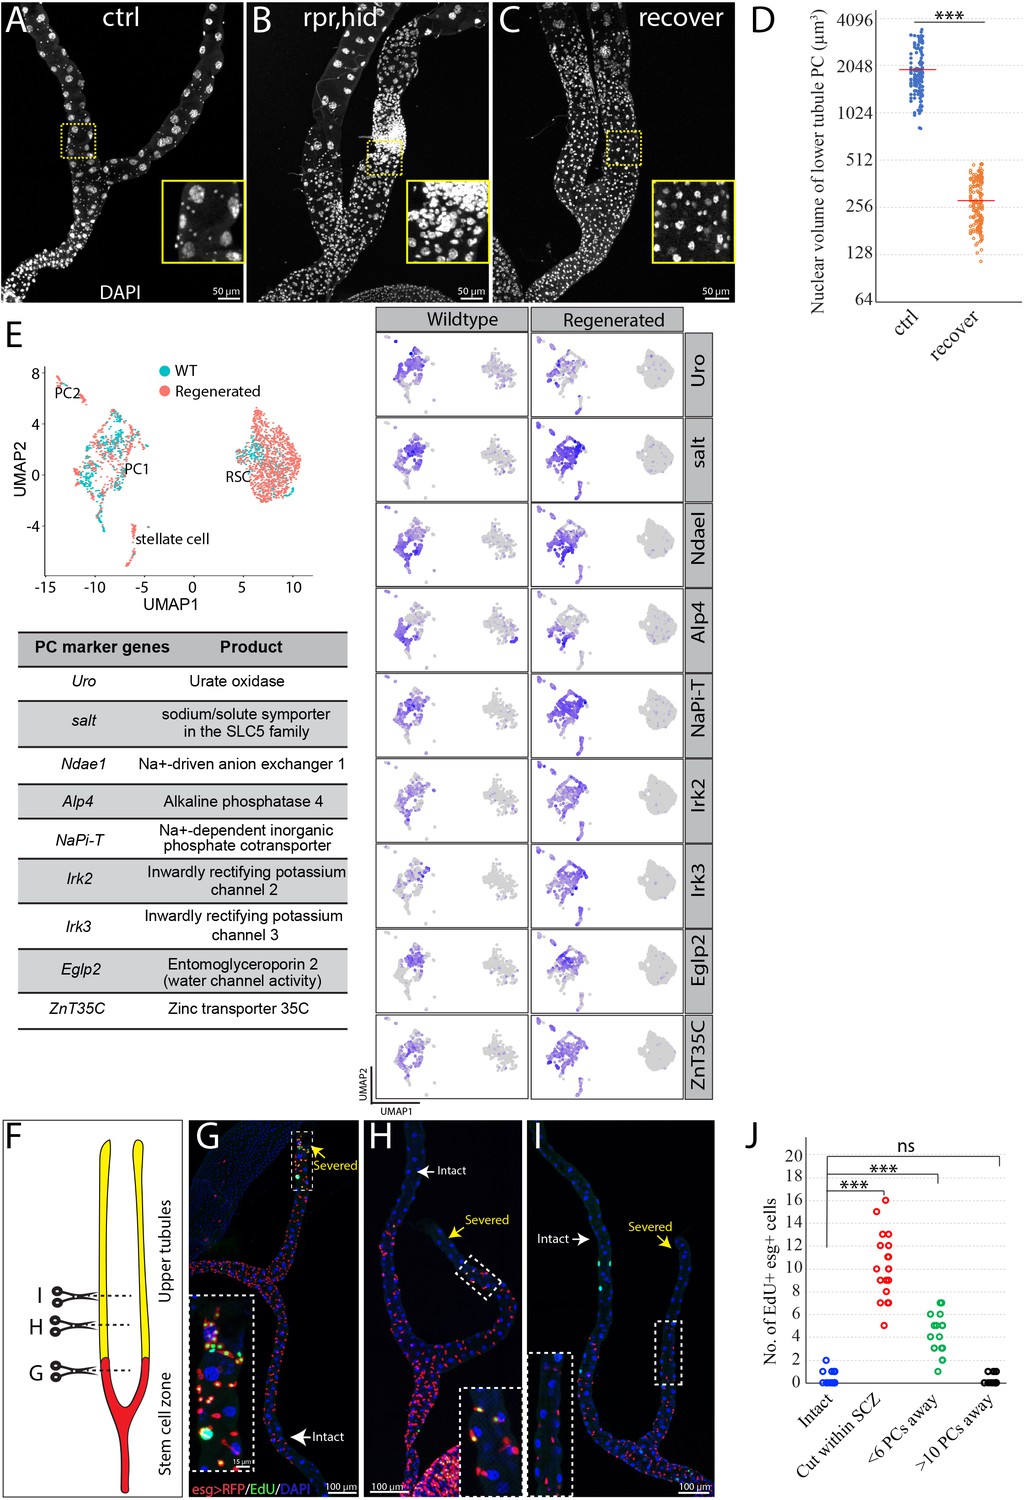
RSCs replenish principal cells in the SCZ upon damage.
(A) Control (c507-Gal4ts>RFP ). (B) Expression of UAS-rpr, hid with c507-Gal4ts at 29°C for 7 days ablated preexisting PCs in the SCZ. (C) Recovery at 18°C for 21 days following PC-ablation. (D) Quantification of nuclear volume of preexisting PCs and replacement PCs in the SCZ from control animals and recovered animals, respectively. Bar denotes the average value. (E) Integrated analysis of scRNA-seq data from wild type and regenerated SCZ following PC-ablation. 710 cells from wild type and 1499 cells from regenerated tissues were retained and integrated. Same cell types in wild type and regenerated SCZ were clustered together. The presence of stellate cell cluster is most likely due to contamination during dissection (upper tubule cells were not completely removed). Examination of nine highly expressed genes physiologically important for principal cells further indicates that the smaller replacement principal cells resemble the large pre-existing principal cells based on gene expression. (F) Schematic drawing depicting the surgical procedures to remove part of Malpighian tubules (See Materials and methods). Surgical sites in (G–I) are shown by dashed lines. (G) Surgical injury in the lower tubule promoted EdU incorporation into esg >RFP+ RSCs near the surgical site. (H) Surgical injury in the upper tubule 5 PCs away from the SCZ slightly increased EdU incorporation in the RSCs at the most distal SCZ. (I) Surgical injury in the upper tubule 10 PCs away from the SCZ did not increase EdU incorporation in the RSCs. (J) Quantification of EdU+ esg+ cell number per lower tubule after surgical resection at different sites. *** denotes Student’s t test p<0.001, ns denotes not significant with p>0.05. For (D) and (J), see also Figure 3—source data 1.
-
Figure 3—source data 1
Source data for Figure 3D and J.
- https://cdn.elifesciences.org/articles/54096/elife-54096-fig3-data1-v2.xlsx
Figure 3—figure supplement 1
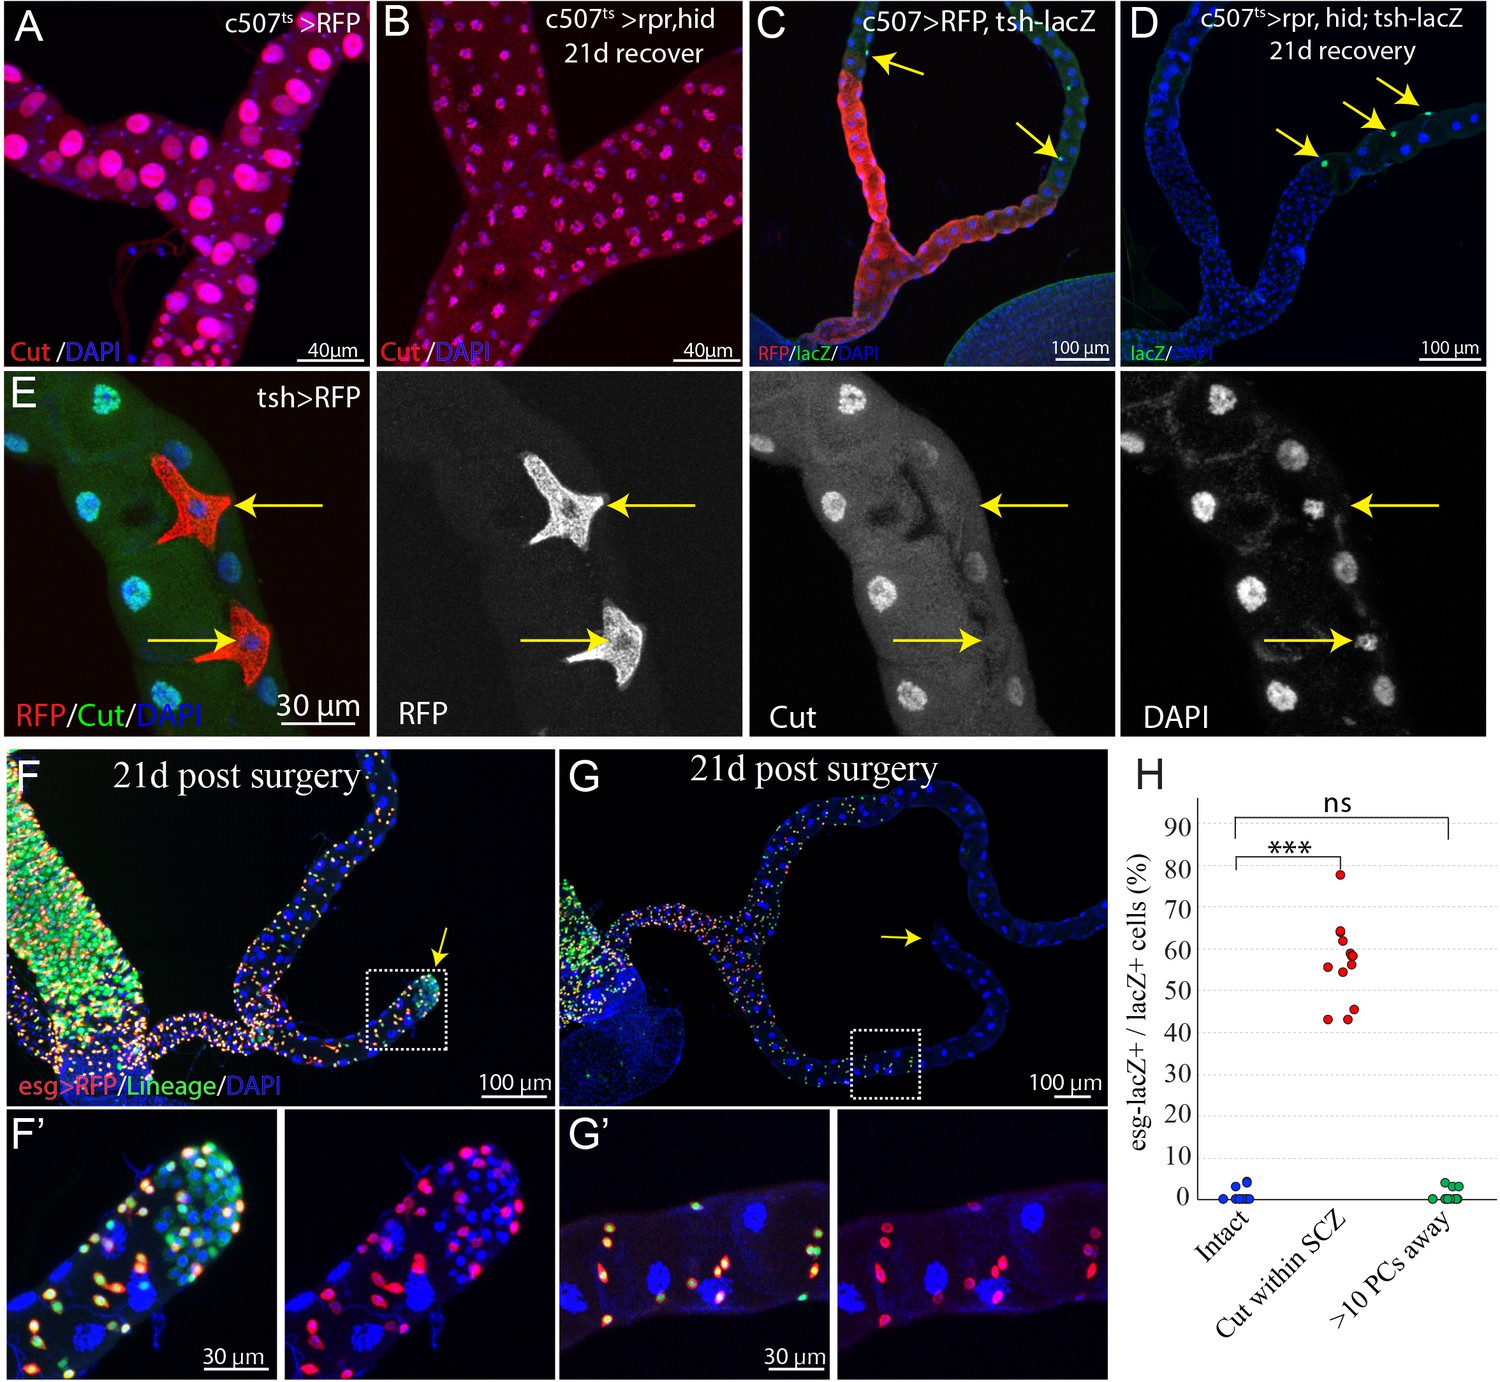
Ablation of principal cells in the ureter and lower tubules leads to formation of replacement principal cells.
(A–B) Expression of rpr and hid with c507-Gal4ts led to stem cell zone (SCZ) regeneration. (A) Control. (B) Principal cells in the SCZ were ablated by the expression of rpr and hid at 29°C for 7 days. After recovery at 18°C for 21 days, all big preexisting principal cells (marked by high expression levels of Cut, in red) were gone and replaced by smaller principal cells. (C–D) Stellate cells (marked by tsh-lacZ, indicated by yellow arrows) were not found in either the control SCZ (C) or regenerated SCZ following PC-ablation. (E) Cut protein is not detectable in stellate cells (indicated by yellow arrows). (F–G) Lineage tracing of RSCs after surgical injury (See Materials and methods). On day 21 post surgery, the cut end within the SCZ had healed up. (F) Injury in the lower tubule led to significant formation of new tubule cells(marked by esg- lacZ+) derived from RSCs. (G) Injury in the upper tubule (about 10 principal cells away from SCZ) did not promote formation of new tubule cells. (F’) and (G’) are enlarged images corresponding to the dashed box in (F) and (G) respectively. (H) Quantification of the percentage of esg-lacZ+ cells among the lacZ+ cells in the posterior-most 200 µm region of the SCZ 21 days post surgery. *** denotes Student’s t test p<0.001, ns denotes not significant with p>0.05.
Figure 3—figure supplement 2
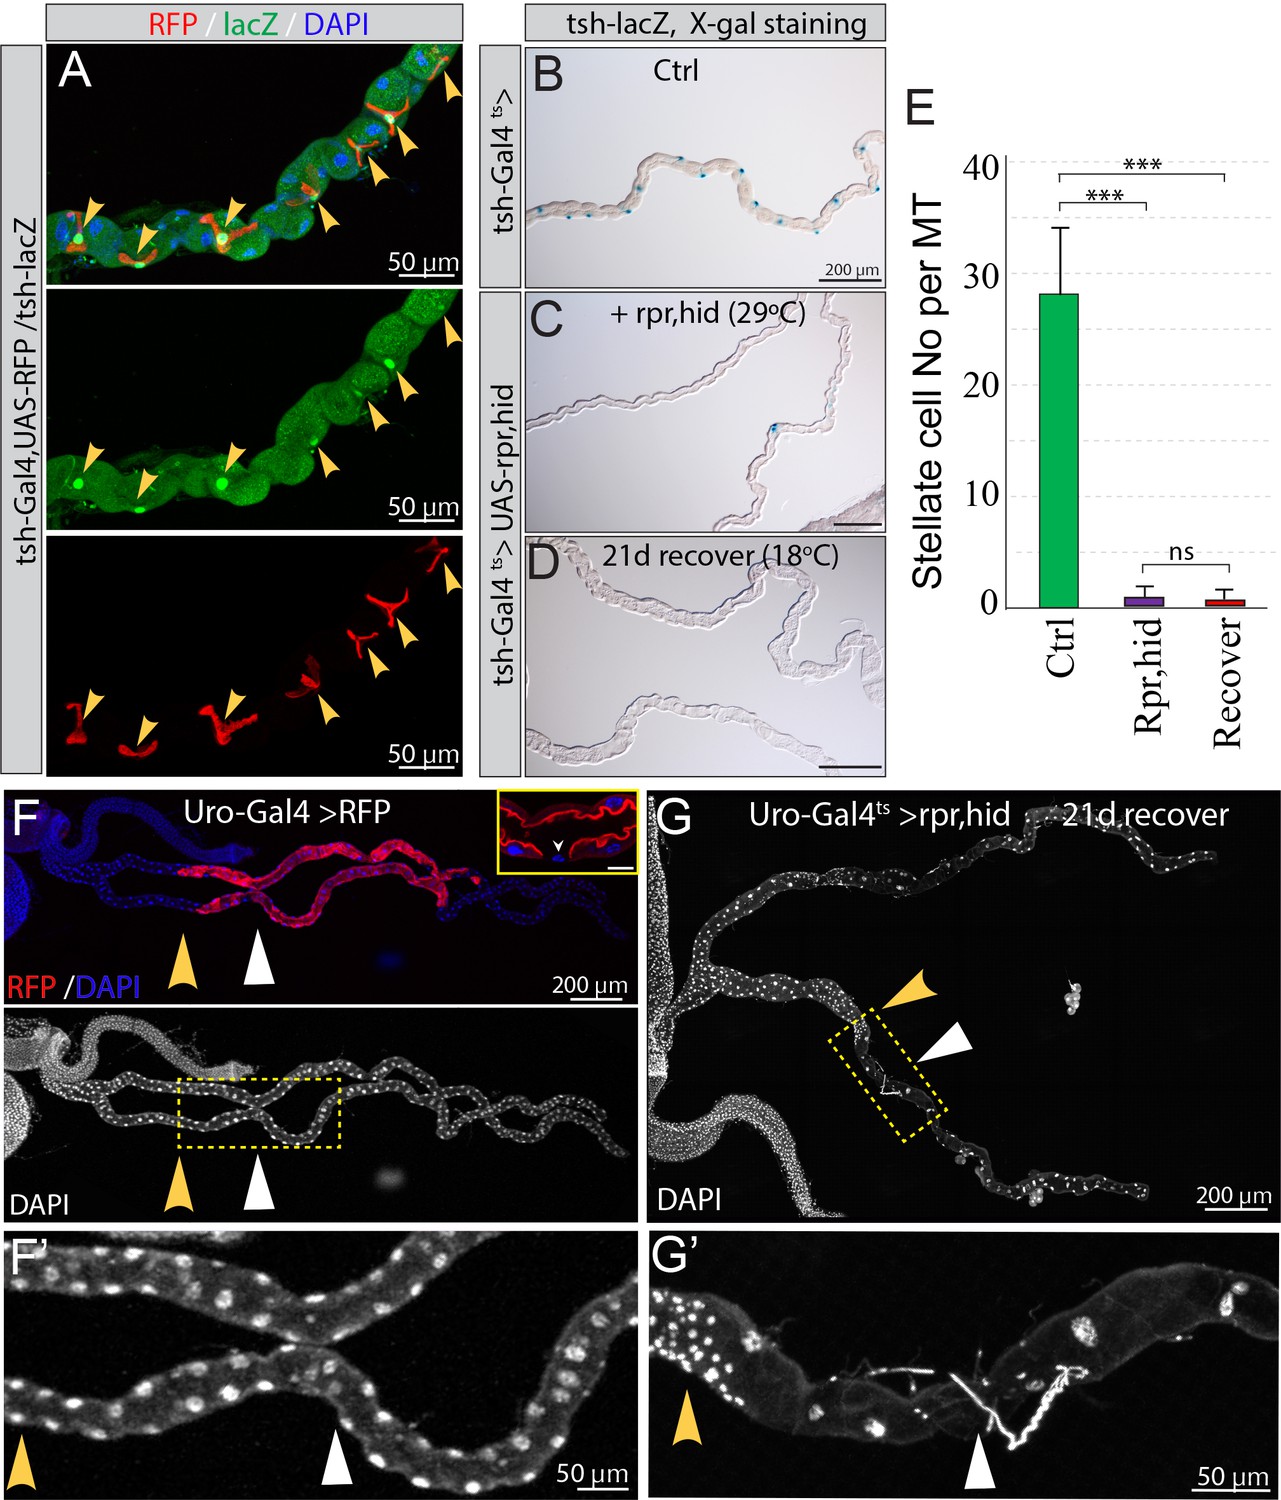
No replenishment of either stellate cells or principal cells in the upper tubules after ablation.
(A) Both tsh-Gal4 >RFP (red) and tsh-lacZ (green) are expressed in stellate cells. (B–E) Stellate cell ablation and recovery. Stellate cells were readily present in control animals (B) as revealed by the expression of tsh-lacZ with X-gal staining. After expression of UAS-hid,rpr driven by tsh-Gal4ts for 7 days at 29°C (C), most stellate cells were ablated. (D) No replenishment of stellate cells was detected at day 21 after shifting stellate-cell ablated animals back to 18°C for recovery. (E) Quantification of the stellate cell number in each upper tubule. Data represent means ± SD, n = 20–30 animals. *** denotes Student’s t test p<0.001, ns denotes not significant with p>0.05. (F–G) Main segment principal cell ablation and recovery. (F) Uro-Gal4 driven UAS-RFP was specifically expressed in the principal cells at the main segment. Inset: sagittal section view showing Uro-Gal4 driven UAS-RFP was not expressed in stellate cells (arrowhead). Scale bar in inset: 20 µm. (G) Adults with the genotype of UAS-rpr,UAS-hid/+; tub-Gal80ts/Uro-Gal4,UAS-myrRFP were shifted to 29°C for 7 days and then shifted back to 18°C for recovery for 21 days. Increased cell density was observed near the boundary (indicated by yellow arrowheads) between lower tubule and main segment, whereas drastically reduced cell density was observed in the distal tubule (indicated by white triangles).
Figure 3—figure supplement 3
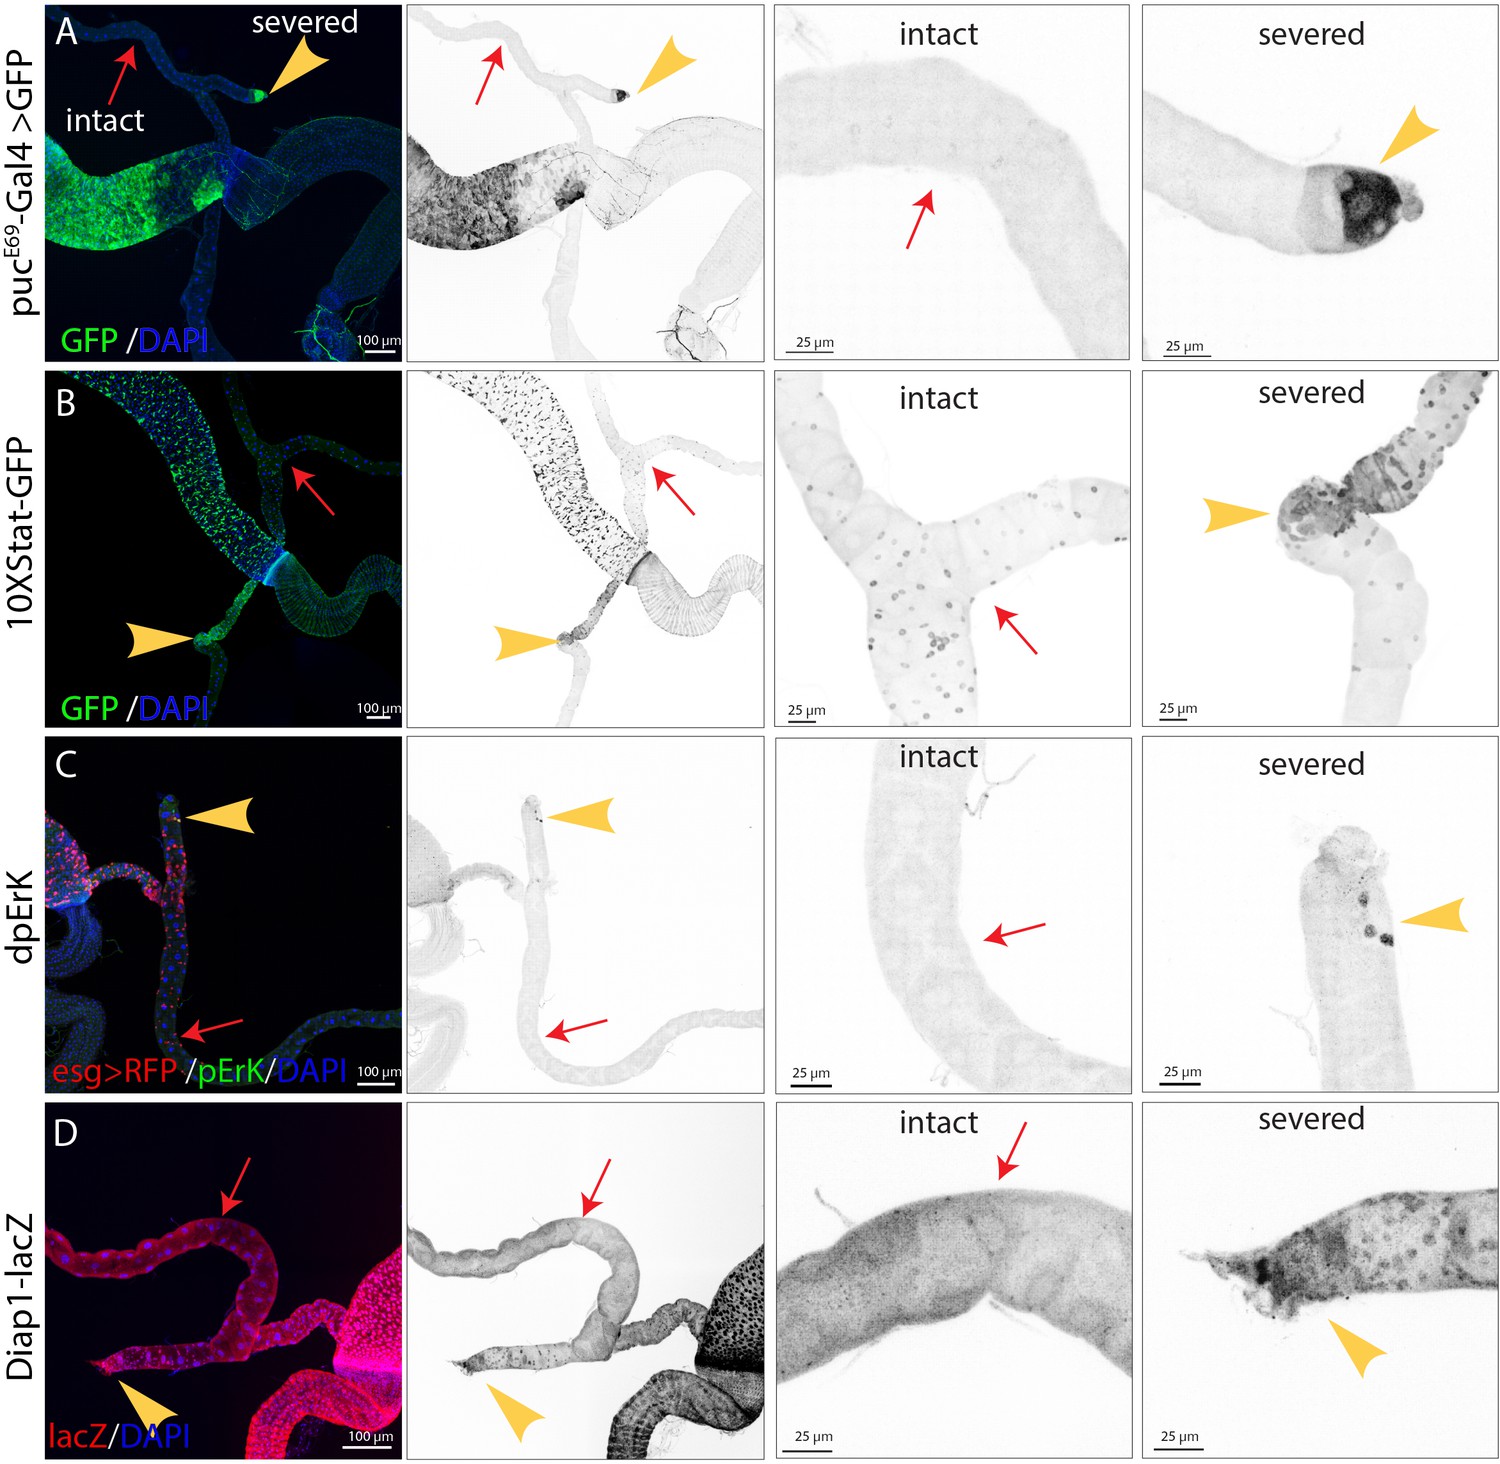
Damage activates multiple proliferation pathways.
(A–D) Surgical resection of one Malpighian tubule (yellow arrowheads) was used to induce damage prior to assaying various signaling pathway activity. The intact Malpighian tubules (red arrows) were used to serve as an internal control. (A) Expression of pucE69-Gal4 > UAS GFP was induced in cells near the surgical site 24 hr after surgery. (B) Expression of 10XStat-GFP was upregulated in cells near the surgical site 2 days after surgery. (C) dpErK expression was specifically upregulated in RSCs near the surgical site 2 days after surgery. (D) Diap1-lacZ was upregulated near the surgical site 4 days after surgery.
Figure 4 with 1 supplement

Damage activates Notch signaling which in turn regulates differentiation of RSCs.
(A) Expression of NRE-GFP was barely detectable in the SCZ under normal conditions. In contrast, surgical resection of a Malpighian tubule induced the expression of NRE-GFP near the surgical site (indicated by red triangle). (B) Expression of Cut is upregulated in the esg >RFP+ cells around the surgical site (red triangles) compared to esg >RFP+ cells in the intact Malpighian tubules (indicated by yellow arrowhead). (C–D) Lineage analysis of control (C) and Notch-depleted (D) RSCs following surgical resection of Malpighian tubule (See Materials and methods). Expression of NRNAi driven by esgts for 14 days resulted in accumulation of RSCs near the surgical site. (E–H) MARCM clones showing that N55e11 mutant cells (F,H) express Dl and fail to polyploidize and turn on the PC differentiation marker Cut. Control in (E) and (G). MARCM clones were induced in animals fed on Allopurinol food for 7–10 days prior to heatshock. (I) Model for quiescent RSC-mediated homeostasis maintenance of the ureter and lower tubules. In normal conditions, RSCs are in a quiescent state. Damage to the ureter and lower tubules promotes the exit from quiescence through upregulation of multiple pathways including JNK, Jak/Stat and EGFR/MAPK etc. Meanwhile, damage also upregulates Notch signaling pathway which in turn upregulates Cut to ensure that activated RSCs (RSCA) only differentiate into replacement principal cells.
Figure 4—figure supplement 1
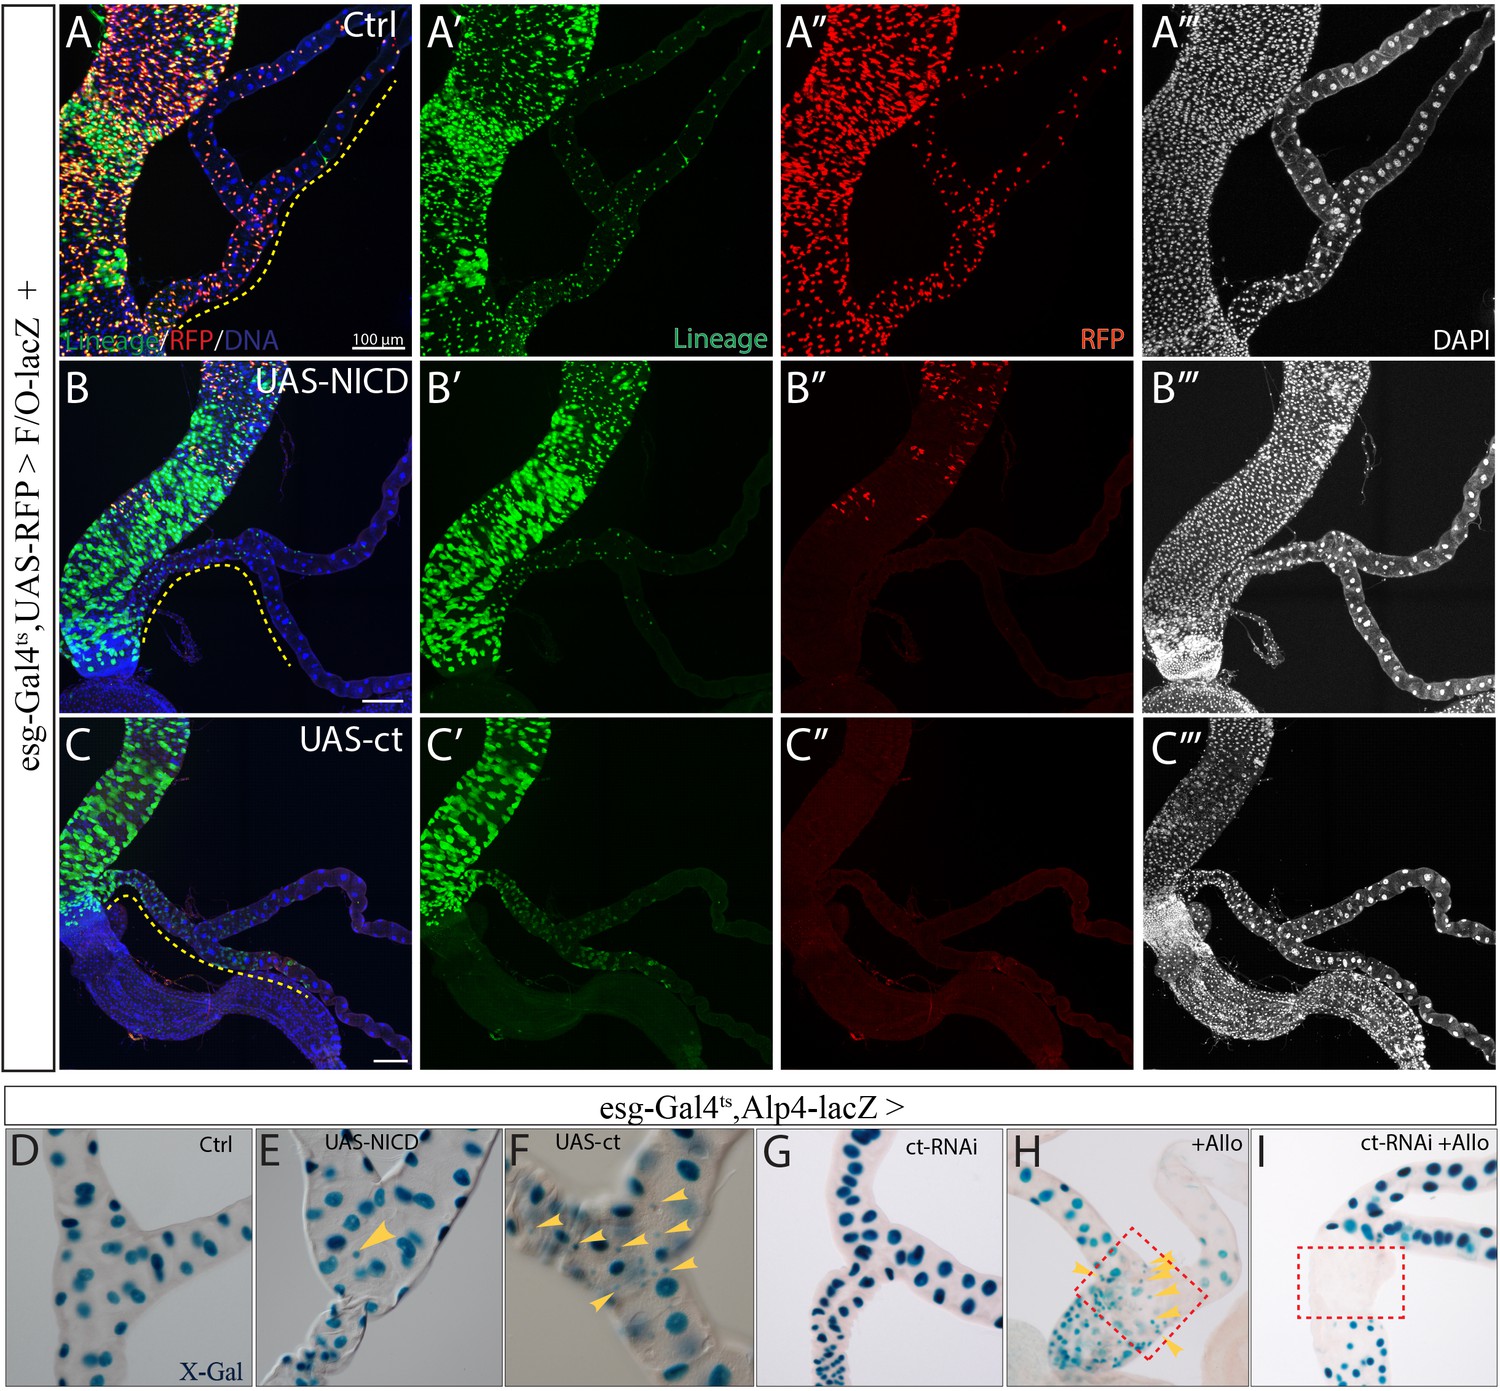
Forced expression of NICD or ct is sufficient to drive RSC differentiation.
(A–C) esg-Gal4ts directed Flp-out lacZ marked lineage tracing in control (A), and following expression of NICD (B) or ct (C) for 14 days. RFP marks esg+ cells, lacZ marks all the cells derived from esg+ cells. Dashed line denotes the SCZ of Malpighian tubules. (D–E) X-gal staining showing expression of Alp4-lacZ in control Malpighian tubules (D), and following expression of NICD (E) or ct (F) driven by esg-Gal4ts for 7 days. Note the small ectopic Alp4+ cells (denoted by yellow arrowheads) in (E) and (F). (G) RNAi-mediated knockdown of ct driven by esg-Gal4ts alone had little effect on the expression of Alp4-lacZ. (H) Upon nephrotoxic drug Allopurinol treatment which led to regional loss of pre-existing PCs (dashed red box), Alp4+ replacement PCs (yellow arrowheads) with small nuclei were produced. (I) RNAi-mediated knockdown of ct inhibited the formation of Alp4+ replacement PCs upon Allopurinol treatment.
Figure 5

Activated RSCs can undergo both symmetric and asymmetric division upon damage.
(A–C) Expression of rpr and hid driven by c507-Gal4ts for 7 days at 29°C was used to ablate PCs in the SCZ. (A) NRE-GFP+ cells and mitotic cells were barely detectable in MTs of control animals (NRE-GFP;c507-Gal4ts, 7 days at 29°C). (B) Mitotic cells (marked by PH3 staining, green) expressed the RSC marker Dl (red) in regenerating Malpighian tubules. (C) Mitotic cells (red) were negative for renoblast (RB) marker NRE-GFP (green) in regenerating Malpighian tubules. (D–F) Twin-spot MARCM system was used to generate RFP and GFP-labeled twin spots. One day before clone induction, animals with appropriate genotype were subjected to surgical resection of upper tubules to activate the quiescent RSCs. (D) Predicted twin-spot fates after asymmetric or symmetric division. (E) Example of an RSC/RSC pair of twin spots at day seven after clone induction. (F) Example showing an RSC/RSC of pair twin spots (F1) and an RSC/RB pair of twin spots (F2). (G) Observed percentage of symmetric division and asymmetric division.
Figure 6 with 2 supplements
RSCs are normally quiescent.
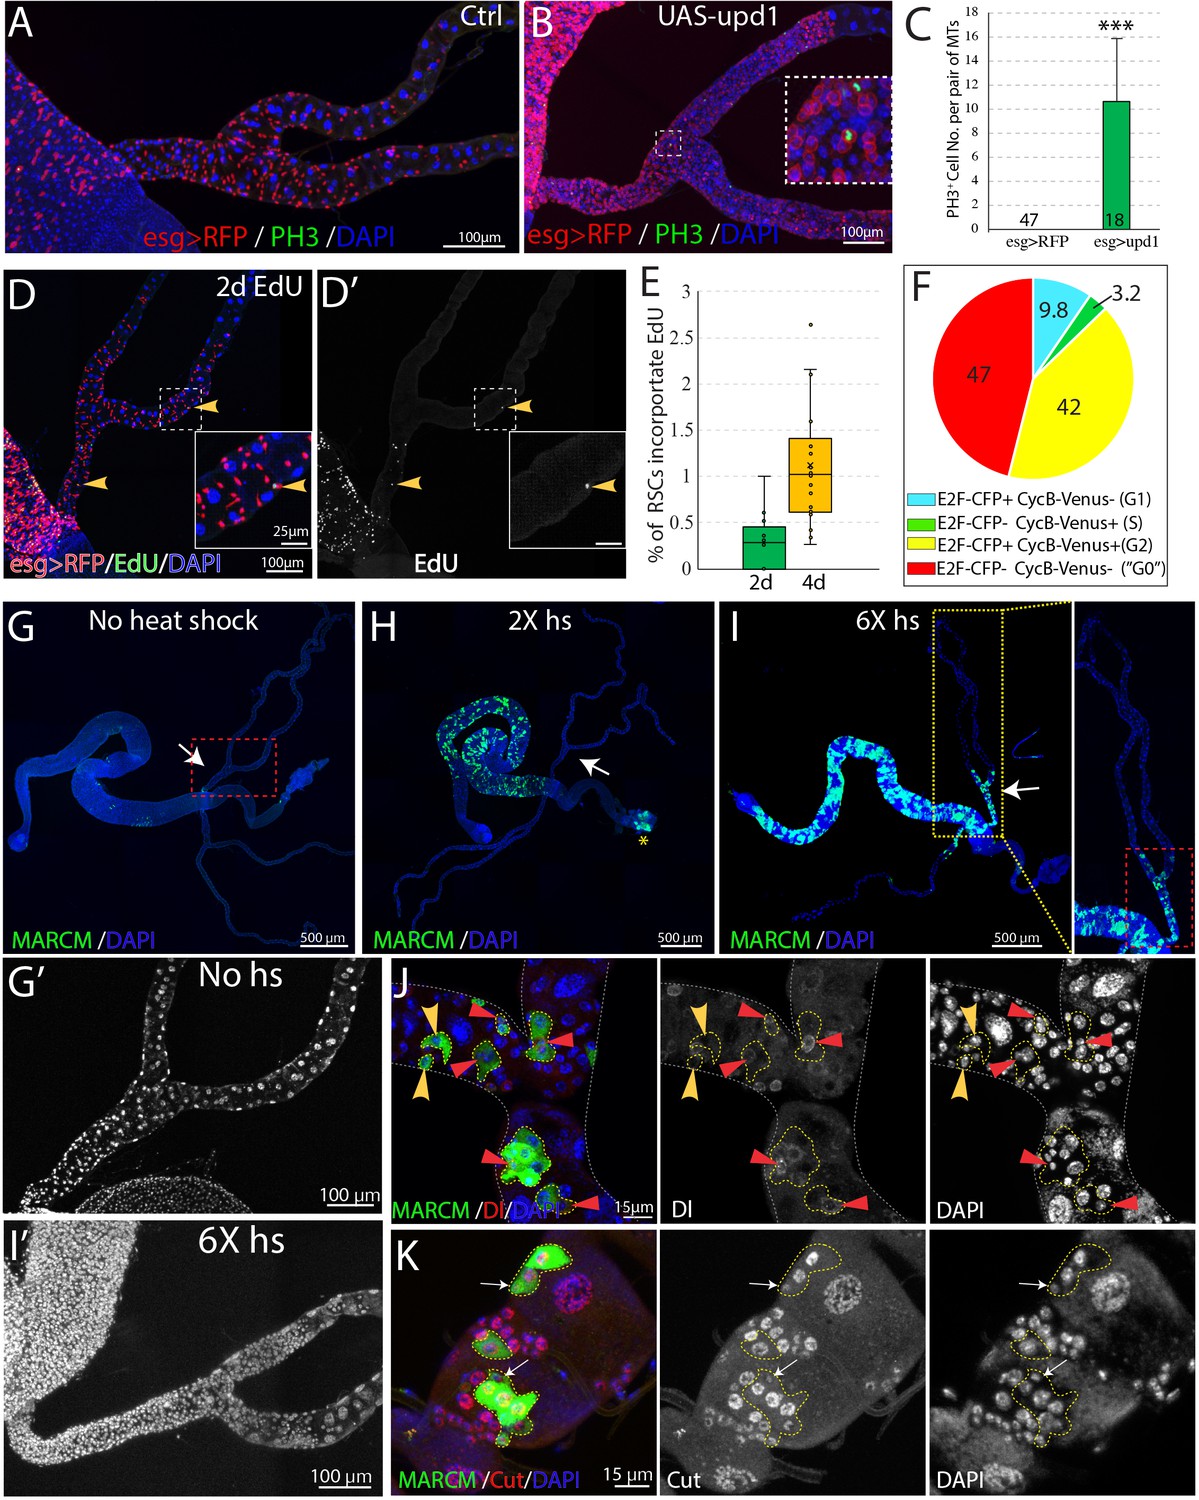
(A and B) Phospho-histone H3 (Ser10) (PH3) staining was done to indicate mitoses in esg-Gal4ts > RFP (A) and esg-Gal4ts > RFP+UAS-upd1 (B) Malpighian tubules. After 6 days of expression of Upd1, mitoses were readily present. Inset: enlarged image of the dashed box showing PH3+ cells are esg >RFP+ RSCs. (C) Quantification of RSCs proliferation induced by expression of UAS-upd1. Data represent means ± SD, *** denotes Student’s t test p<0.001. (D) Representative image of EdU labeling after 2d in wild type Malpighian tubules. Yellow arrowheads denote esg >RFP+ RSCs labeled with EdU. Insets are enlarged images of dashed boxes. (E) Quantified percentage of EdU-positive RSCs after continuous EdU labeling for 2 days and 4 days, n > 10 female flies. (F) Cell cycle phase distribution of RSCs as assessed by FUCCI. (G–J) MARCM clones induced by different heat shock dose. Compared to no heat shock control (G), there was a significant increase in the GFP marked clones in the midgut but not Malpighian tubules after 2X heat shocks (H); the yellow asterisk denotes the autofluorescence from fecal contents in the rectum. (I) Induced clones were seen in the SCZ with 6X heat shocks. As expected, labeling was restricted to the ureter and lower tubules, where RSCs are located. (G’ and I’) Enlarged DAPI channels of the SCZ (dashed red box) corresponding to G and I, respectively. (J) Representative image showing both single cell transient clones (outlined in dashes; the single cell is denoted by yellow arrowhead) and multi-cell RSC clones (outlined in dashes), containing a single Dl+ RSC (denoted by red triangle). No Dl+ cells were detected in the single-cell transient clones. (K) Representative image of GFP marked clones in the lower tubules showing the differential expression levels of Cut in different cell types in RSC clones (outlined by yellow dashes). Cut is expressed at a low level in a single 2 C cell in each clone that is presumably an RSC (white arrows). Downstream cells that are often of higher ploidy show higher Cut expression. For (C), (E) and (F), see also Figure 6—source data 1.
-
Figure 6—source data 1
Source data for Figure 6E-F.
- https://cdn.elifesciences.org/articles/54096/elife-54096-fig6-data1-v2.xlsx
Figure 6—figure supplement 1
esg+ cells are largely arrested at G0 and G2 phases in normal condition.
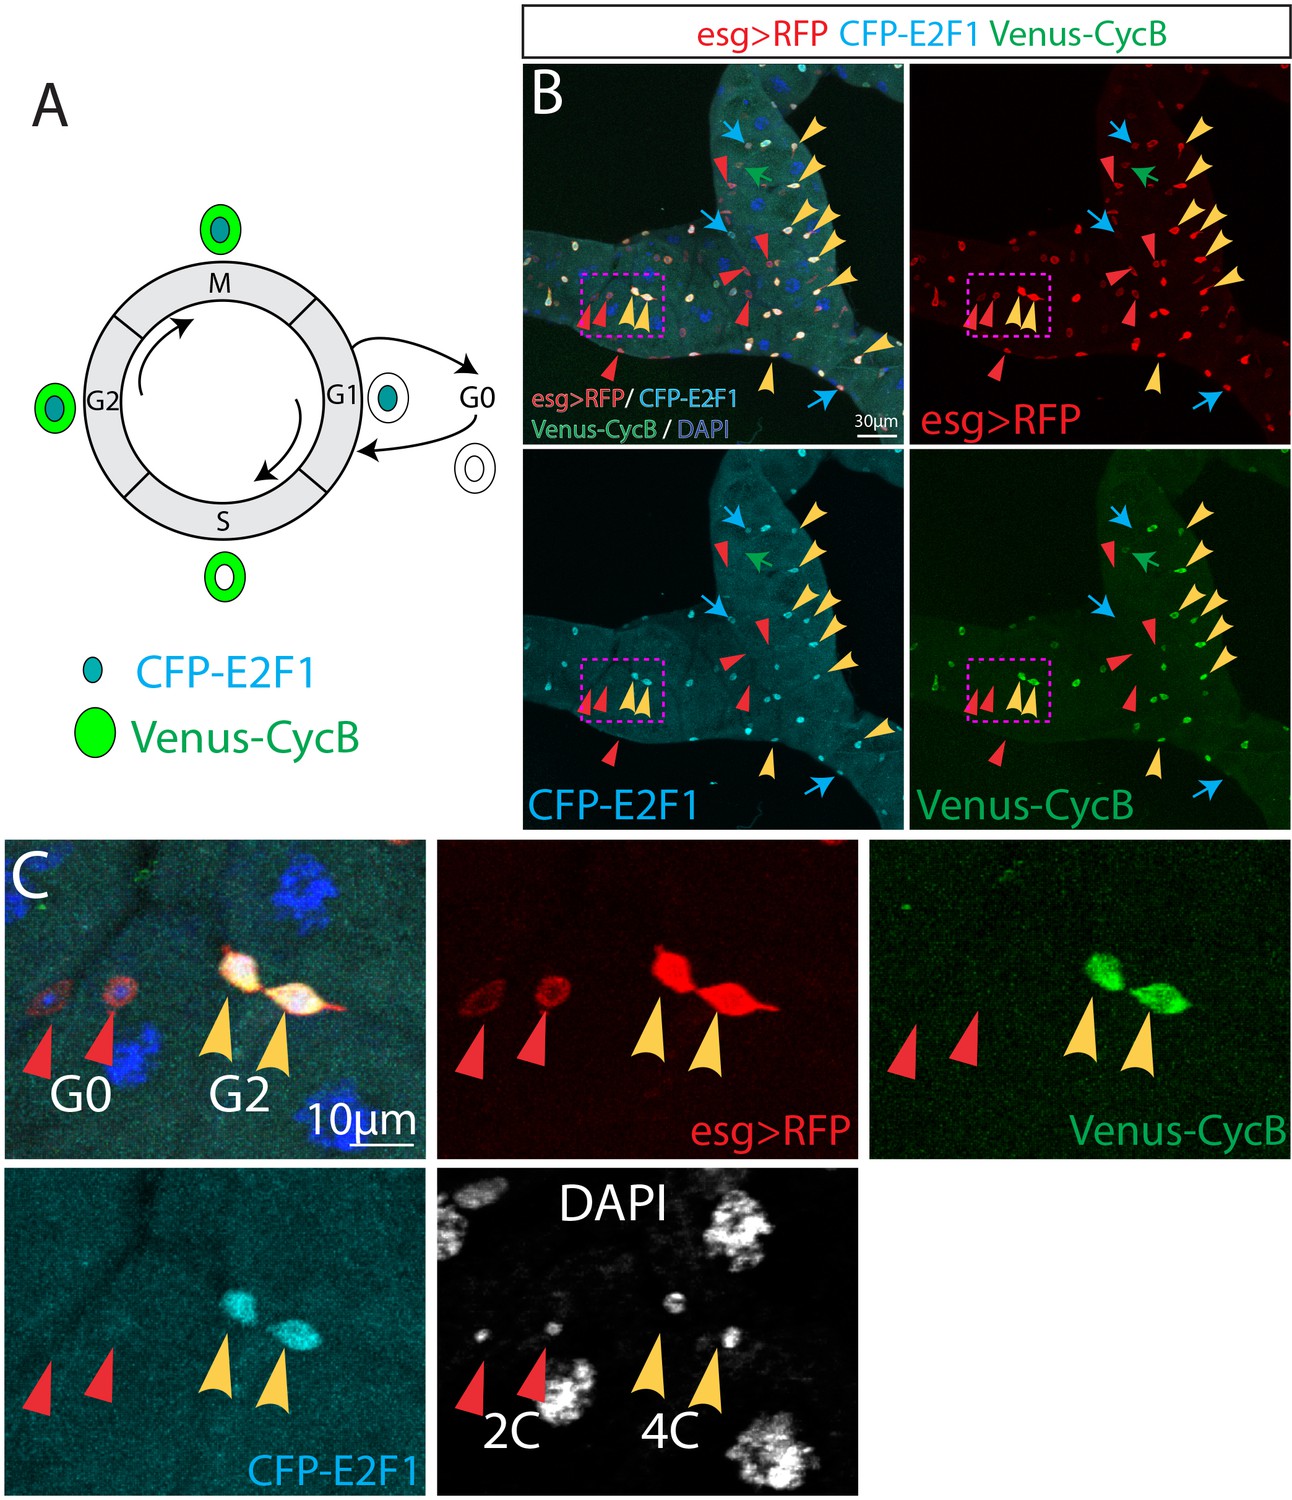
(A) The Fly-FUCCI system consists of fluorescently tagged E2F1 and CycB degrons. Predicted expression of Fly-FUCCI in different cell cycle phases is shown. (B) Expression of Fly-FUCCI (CFP-E2F11-230;Venus-CycB1-266) driven by esg-Gal4,UAS-myrRFP. The red triangles denote the G0 esg >RFP+ cells that are double-negative for CFP-E2F11-230 and Venus-CycB1-266, and the yellow arrowheads denote the G2 esg >RFP+ cells that are double-positive for CFP-E2F11-230 and Venus-CycB1-266. Cyan arrows denote G1 esg >RFP+ cells that are positive for CFP-E2F11-230 and negative for Venus-CycB1-266. Green arrow denotes an S phase esg >RFP+ cells that is positive for Venus-CycB1-266 and negative for CFP-E2F11-230. (C) Enlarged view of boxed regions in (B). Note the G0 cells have a 2C DNA content while G2 cells have a 4C DNA content.
Figure 6—figure supplement 2
Excessive heat stress activates JNK pathway and promotes clone labeling and growth.
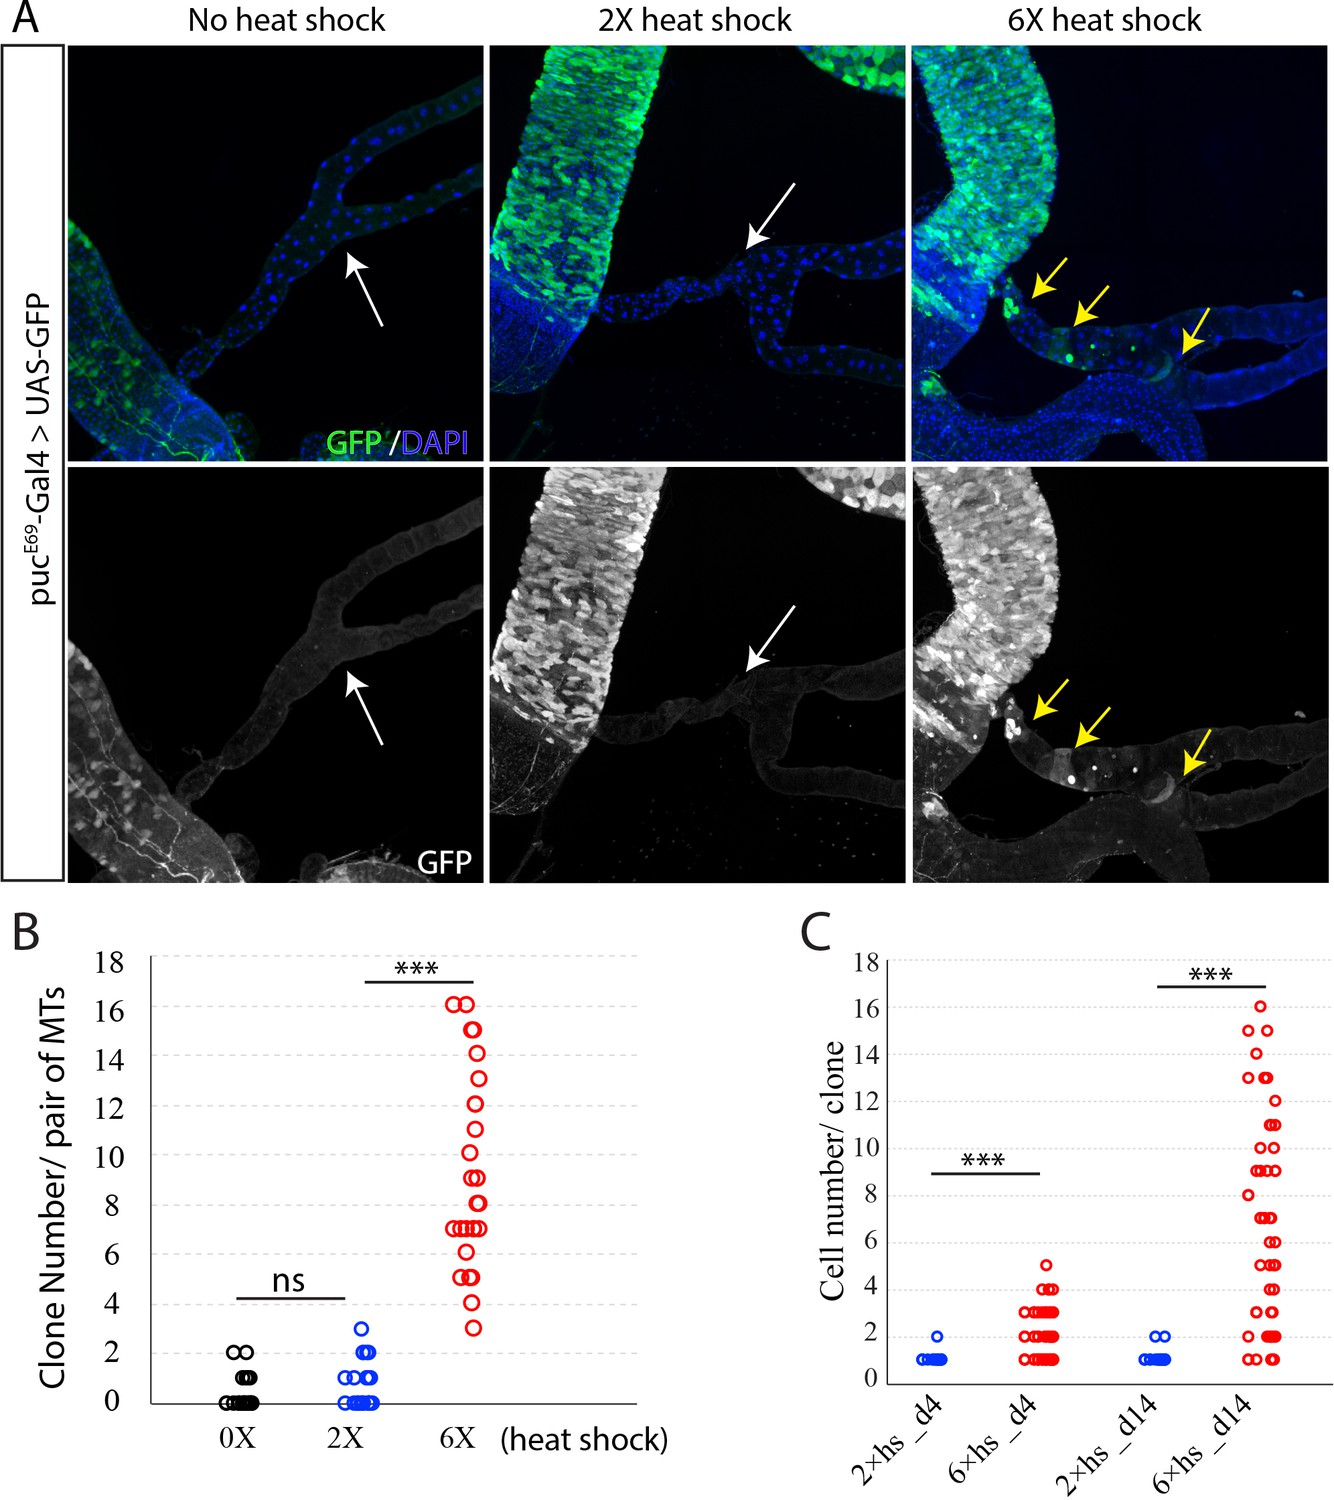
(A) Expression of pucE69-Gal4 > UAS GFP was barely detectable in Malpighian tubules (white arrows) with no heat shock and low dose of heat stress. However, it was induced by high dose of heat shock in tubule cells (yellow arrows). (B) Quantification of MARCM clone number that in Malpighian tubules with different dose of heat shock on day four after clone induction. (C) Quantification of cell number per clone. *** denotes Student’s t test p<0.001, ns denotes not significant with p>0.05.
Figure 7 with 2 supplements
RSCs respond to stone formation.
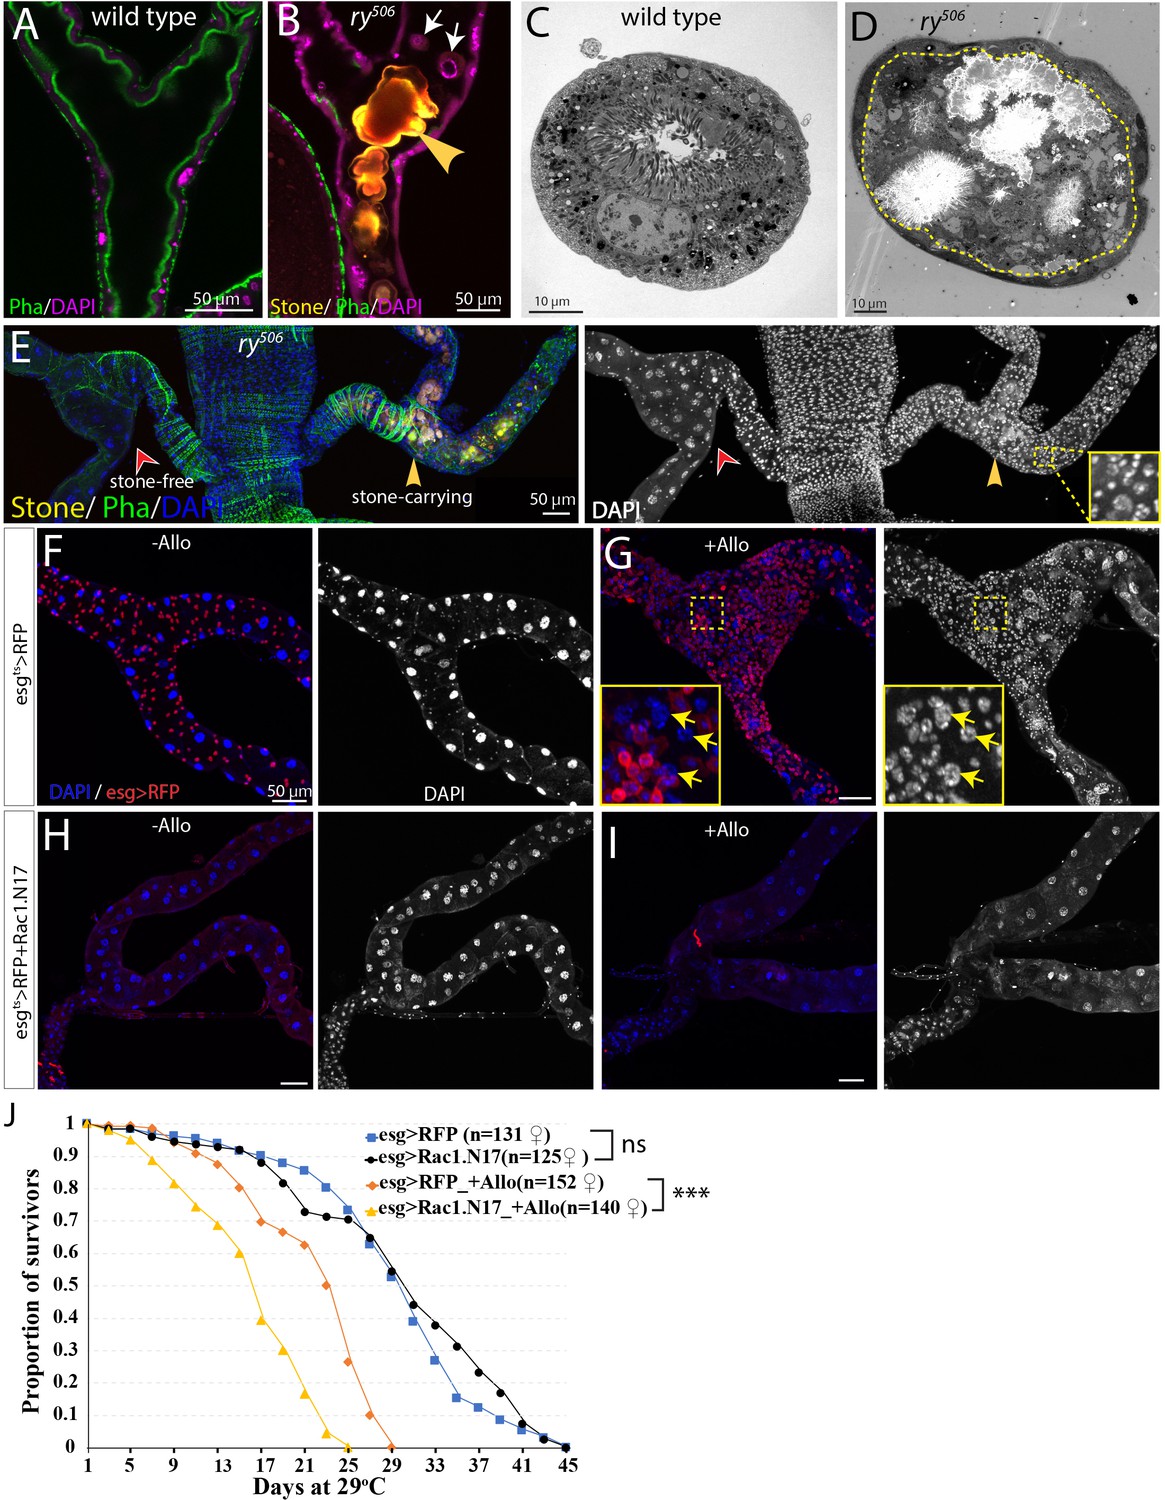
(A) Longitudinal optical section view of the ureter and lower tubules from a wild-type (Oregon-R) animal. The surrounding muscles and brush borders of principal cells are marked by phalloidin staining (green). (B) Longitudinal section view of the ureter and lower tubules from ry506 mutant bearing stones (yellow arrowhead) in tubule lumen. Note that detached principal cells (white arrows) were found in tubule lumen. DAPI channel was consciously over-exposed to reveal the nuclei of the dying principal cells in the lumen. (C–D) Representative electron micrographs showing stones and cell debris were seen in the ry506 lower tubule (D) but not in the Oregon-R tubule (C). (E) Immunofluorescence image showing that supernumerary tubule cells were present in the stones-carrying tubules (yellow arrowheads) compared to the stone-free tubules (red arrowheads) in the same 14-day-old ry506 fly. Shown on the right is the greyscale DAPI channel with an inset (outlined with yellow square) showing an closeup view of DAPI staining. Note the polyploid cells are produced in the damaged tubules. (F–J) RSCs are essential for ureter and lower tubule repair. Representative images showing that ureter and lower tubules from esgts > RFP flies cultured on normal food (F) and allopurinol food (G) as well as those from esgts > RFP+Rac1.N17 flies cultured on normal food (H) and allopurinol food (I) for 14 days after eclosion. Insets (outlined by yellow boxes) showing the presence of polyploid cells (yellow arrows) are shown in (G). Flies were shifted to 29°C since late L3 to induce the expression of Rac1.N17. Expression of Rac1.N17 inhibited formation of RSCs in the ureter and lower tubules and completely blocked allopurinol induced production of supernumerary tubule cells. (J) RSCs-depleted flies showed a shortened lifespan compared to control flies when reared on allopurinol food. ns denotes log-rank test p>0.05, *** denotes log-rank test p<0.001. See also Figure 7—source data 1.
-
Figure 7—source data 1
Source data for Figure 7J.
- https://cdn.elifesciences.org/articles/54096/elife-54096-fig7-data1-v2.xlsx
Figure 7—figure supplement 1
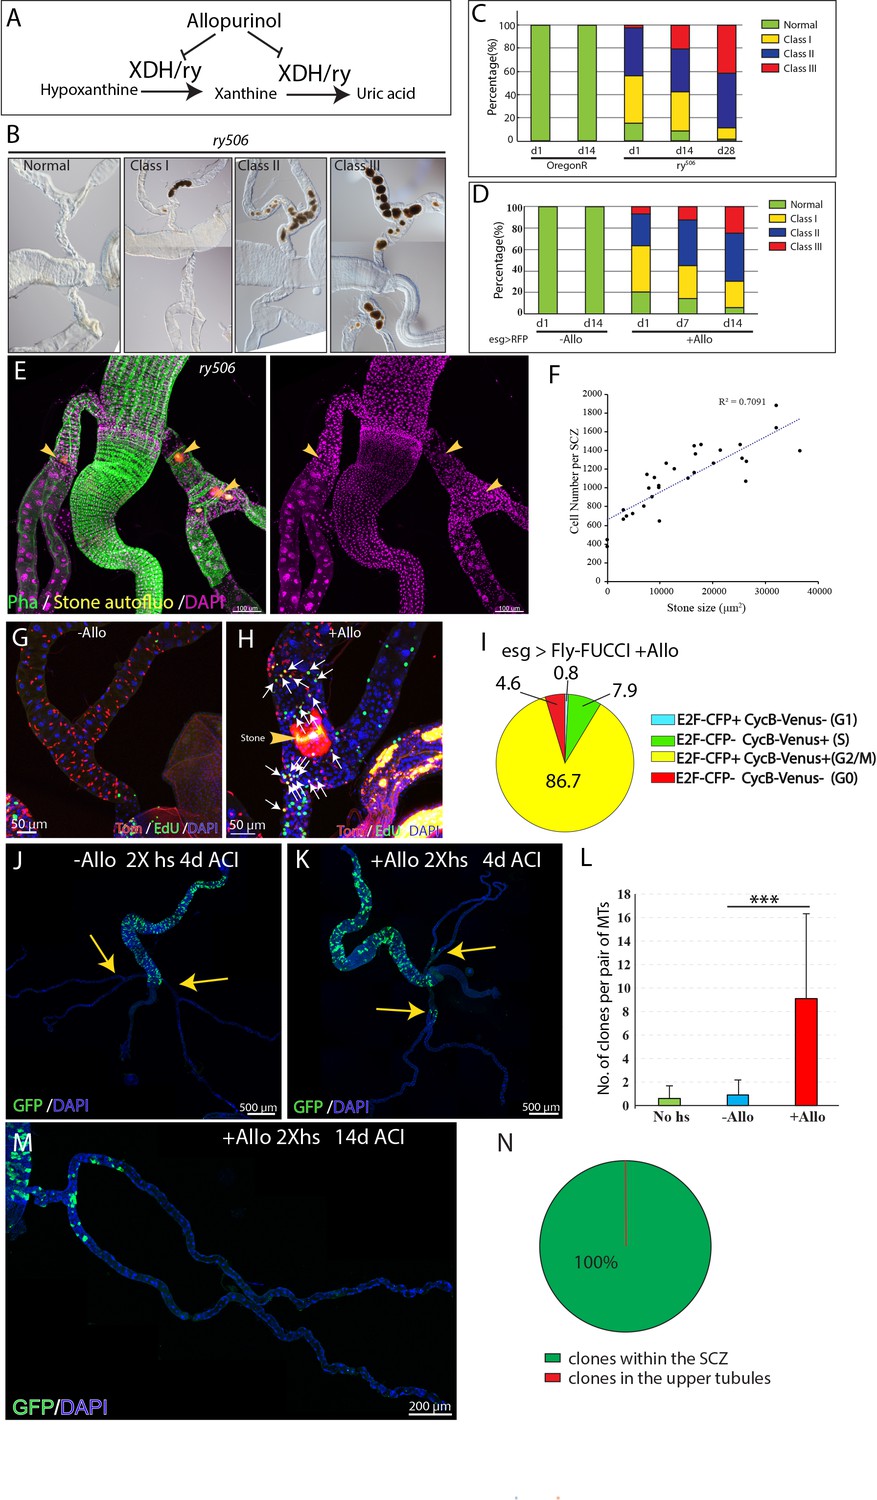
RSCs respond to stone formation.
(A) Drosophila ry gene encodes xanthine dehydrogenase (XDH), which catalyzes the conversion of hypoxanthine and xanthine to uric acid. Allopurinol is an inhibitor of XDH. (B–D) Stones progressively developed in ry506 flies and in flies reared on allopurinol food. (B) Representative DIC images of ry506 ureter and lower tubules. Note the stones do not transmit light and hence appear dark. (C and D) Allopurinol feeding recapitulated stone development caused by loss of ry. n = 44–70 animals analyzed. (E) Immunofluorescence micrograph showing a 7 day-old ry506 fly carrying stones (indicated by yellow arrowheads) in the lower tubules and ureters. Note that the SCZ bearing larger stones and more stones contains significantly more cells. (F) Scatter plot showing the correlation between stone sizes (area) and the number of cells present in the SCZ from 7 day-old ry506 flies. (G–H) EdU incorporation in esg+ cells from esg >RFP flies fed on control diet (G) and allopurinol augmented food (H). Note significantly more esg+ cells are EdU+ in allopurinol-treated flies. (I) Fly-FUCCI system was used to assess cell cycle phase distribution of esg+ cells after allopurinol treatment. (J–K) MARCM clones showing clones were barely detectable in control animals with a low dose of heat shock (J), Allopurinol administration increased clone induction in the SCZ with a low dose of heat shock (K). (L) Quantification of MARCM clone numbers in the SCZ with 2X heat shocks 4 days ACI. Data are means ± SD, *** denotes Student’s t test p<0.001. n = 20–49. (M) Representative image showing GFP marked clones 14 days ACI (N) Distribution of clones that were found within the SCZ versus upper tubules. n = 34 animals analyzed. ACI: after clone induction.
Figure 7—figure supplement 2
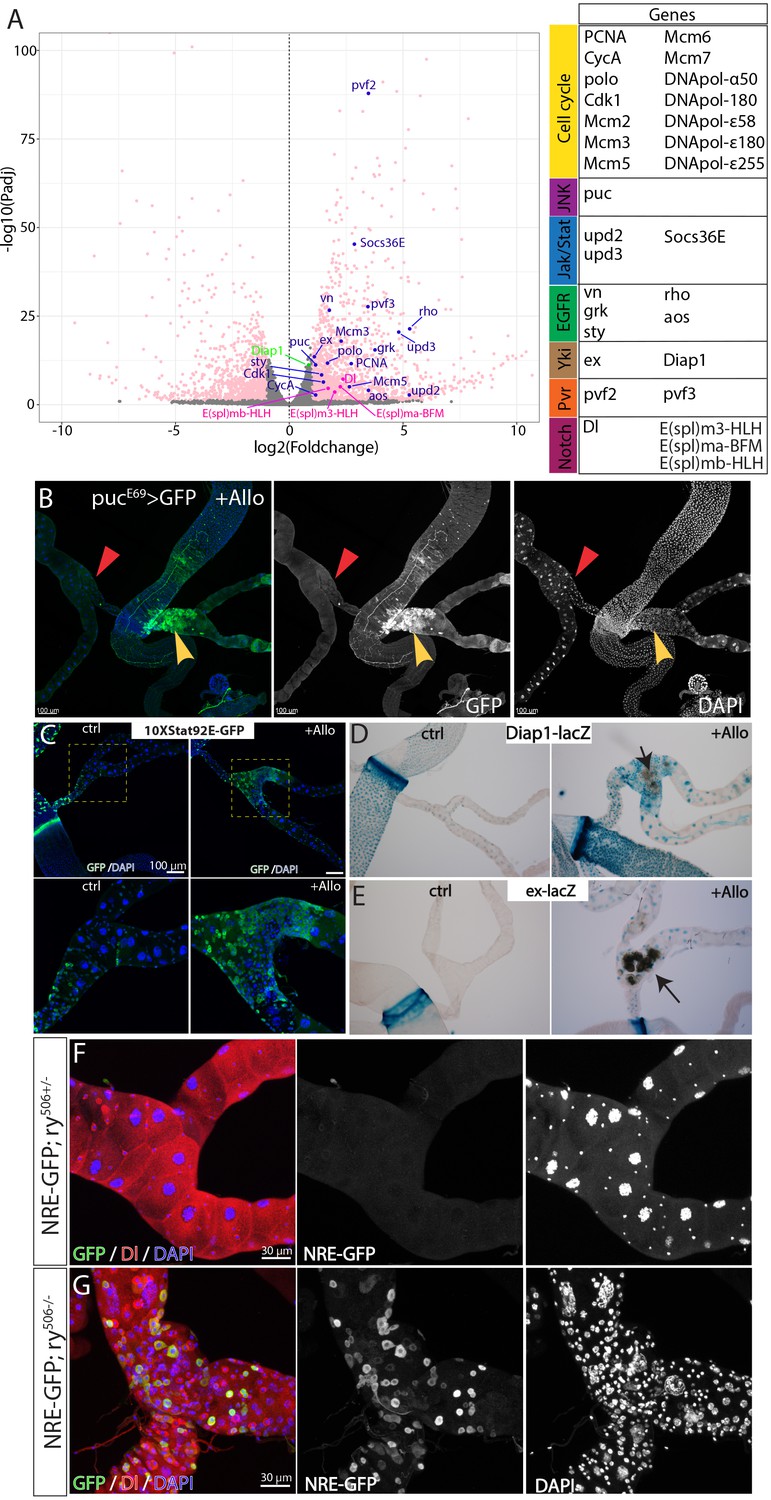
Stone-induced damage causes activation of multiple proliferation pathways.
(A) Volcano plot showing differentially expressed genes between ry mutant lower tubules carrying stones and wild-type lower tubules. Genes with fold change more than two and Padj <0.05 are in pink. The table on the right shows the pathways that the highlighted genes are involved in the volcano plot. (B) Expression of pucE69-Gal4 > GFP in one pair of Malpighian tubules carrying stones (denoted by yellow arrowhead) and the other pair of Malpighian tubules without stones (red triangle) from the same animal after allopurinol treatment. (C) Expression of Jak/Stat pathway reporter, 10XStat92E-GFP in control Malpighian tubules (left panels) and in Malpighian tubules carrying stones induced by allopurinol (right panels). (D–E) X-gal staining showing the expression of Diap1-lacZ (D) and ex-lacZ (E) in normal and stone-carrying Malpighian tubules. Both Diap1-lacZ and ex-lacZ are widely used reporters for Yki activity. (F–G) Expression of Notch signaling reporter, NRE-GFP in ry+/- Malpighian tubules (F) and in ry506 Malpighian tubules bearing stones.
Author response image 1
Kidney stones lead to regeneration of the SCZ.
Additional files
-
Supplementary file 1
Key resources table.
- https://cdn.elifesciences.org/articles/54096/elife-54096-supp1-v2.docx
-
Transparent reporting form
- https://cdn.elifesciences.org/articles/54096/elife-54096-transrepform-v2.docx
Download links
A two-part list of links to download the article, or parts of the article, in various formats.
Downloads (link to download the article as PDF)
Open citations (links to open the citations from this article in various online reference manager services)
Cite this article (links to download the citations from this article in formats compatible with various reference manager tools)
An abundant quiescent stem cell population in Drosophila Malpighian tubules protects principal cells from kidney stones
eLife 9:e54096.
https://doi.org/10.7554/eLife.54096


