Contextual and cross-modality modulation of auditory cortical processing through pulvinar mediated suppression
- Zilkha Neurogenetic Institute, University of Southern California, United States
- Graduate Program in Neuroscience, University of Southern California, United States
- Department of Physiology and Neuroscience, Keck School of Medicine, University of Southern California, United States
Figures
Figure 1 with 4 supplements
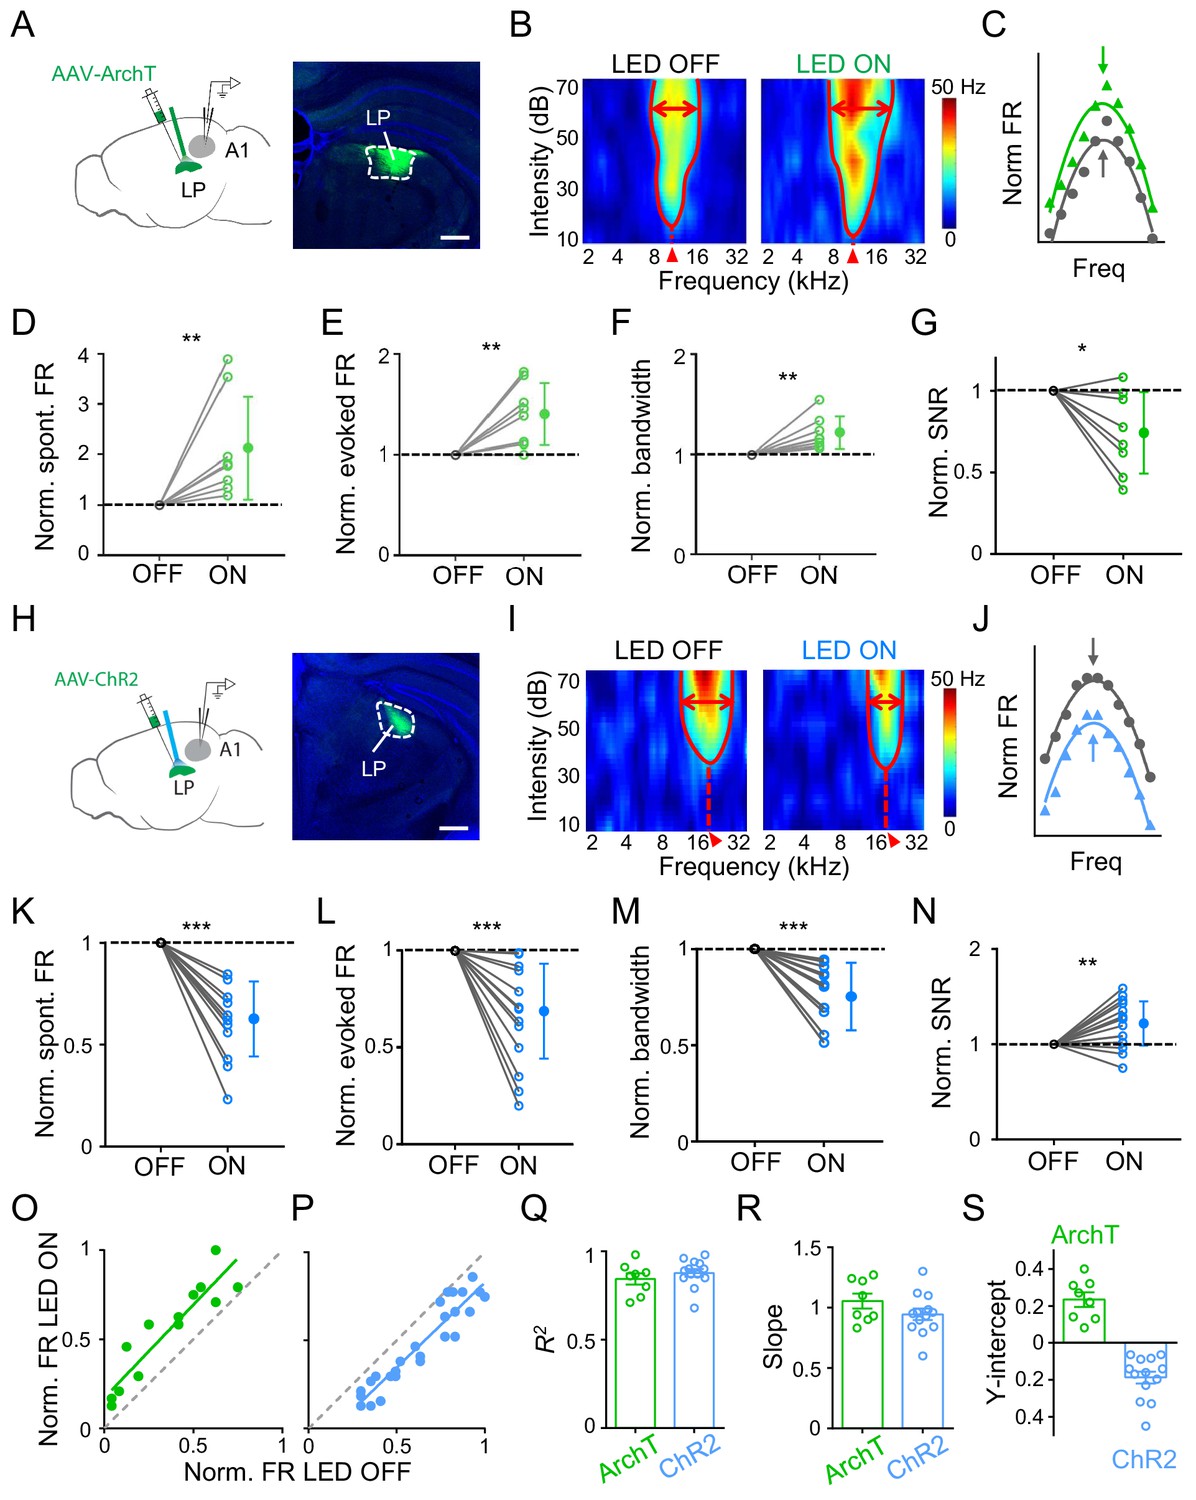
Effects of bidirectional manipulation of LP activity on A1 response properties.
(A) Left, schematic experimental condition. AAV-ArchT was injected into LP and green LED was applied via an implanted optic fiber to silence LP neurons. Loose-patch recordings were made from A1 neurons on the same side. Right, confocal image showing the expression of ArchT within LP (marked by white dashed curve). Scale bar, 500 μm. (B) Reconstructed tonal receptive field (TRF) of an example A1 L2/3 pyramidal neuron without (left) and with (right) optogenetic silencing of LP. Color scale indicates evoked firing rate. Red curve marks the TRF boundary. Red double arrows depict the frequency tuning bandwidth at 60 dB SPL. Red arrowhead marks the characteristic frequency (CF). (C) Normalized frequency tuning curves (at 60 dB SPL) without (black) and with (green) LP silencing. Arrows mark the best frequency. (D–G) Normalized spontaneous firing rate (D, p=0.0078, Wilcoxon signed-rank test), evoked firing rate (E, p=0.0079, paired t-test), tuning bandwidth at 60 dB SPL (F, p=0.0069, paired t-test) and signal-to-noise ratio (G, p=0.022, paired t-test) of recorded A1 L2/3 neurons without (OFF) and with (ON) LP silencing. **p<0.01, *p<0.05, n = 8 cells in 4 animals. Data points for the same cell are connected with a line. (H) Left, experimental condition. AAV-ChR2 was injected into LP and blue LED was delivered to activate LP neurons. Right, example image showing the expression of ChR2 within LP. Scale bar, 500 μm. (I) TRF of an example A1 L2/3 pyramidal neuron without (left) and with (right) optogenetic activation of LP neurons. (J) Normalized frequency tuning curves without (black) and with (blue) LP activation. (K–N) Normalized spontaneous firing rate (K, ***p<0.001, paired t-test), evoked firing rate (L, p<0.001, paired t-test), tuning bandwidth at 60 dB SPL (M, p<0.001, paired t-test), and SNR (N, p=0.0059, paired t-test) of A1 L2/3 neurons without and with LP activation (n = 13 cells in 5 animals). (O–P) Plot of normalized firing rates evoked by effective tones (at 60 dB SPL) with vs. without LP silencing (O) or LP activation (P) for the example cells shown above. Green and blue lines are the best fit linear regression line. Gray dashed line is the identity line. (Q–S) Summary of parameters of linear fitting for all neurons in LP silencing (ArchT) and activation (ChR2) groups, respectively. R2 (Q): 0.84 ± 0.09 (mean ± SD, n = 8 cells) vs. 0.88 ± 0.08 (n = 13 cells); slope (R): 1.05 ± 0.17 (not significantly different from 1, p=0.41, Z-test) vs. 0.94 ± 0.17 (not significantly different from 1, p=0.26, Z-test); y-intercept (S): 0.23 ± 0.11 (significantly >0, p<0.001, Z-test) vs. −0.19 ± 0.12 (significantly <0, p<0.001, Z-test); Bar = SEM.
-
Figure 1—source data 1
Data for Figure 1 and Figure 1—figure supplements 1–4.
- https://cdn.elifesciences.org/articles/54157/elife-54157-fig1-data1-v2.xlsx
Figure 1—figure supplement 1
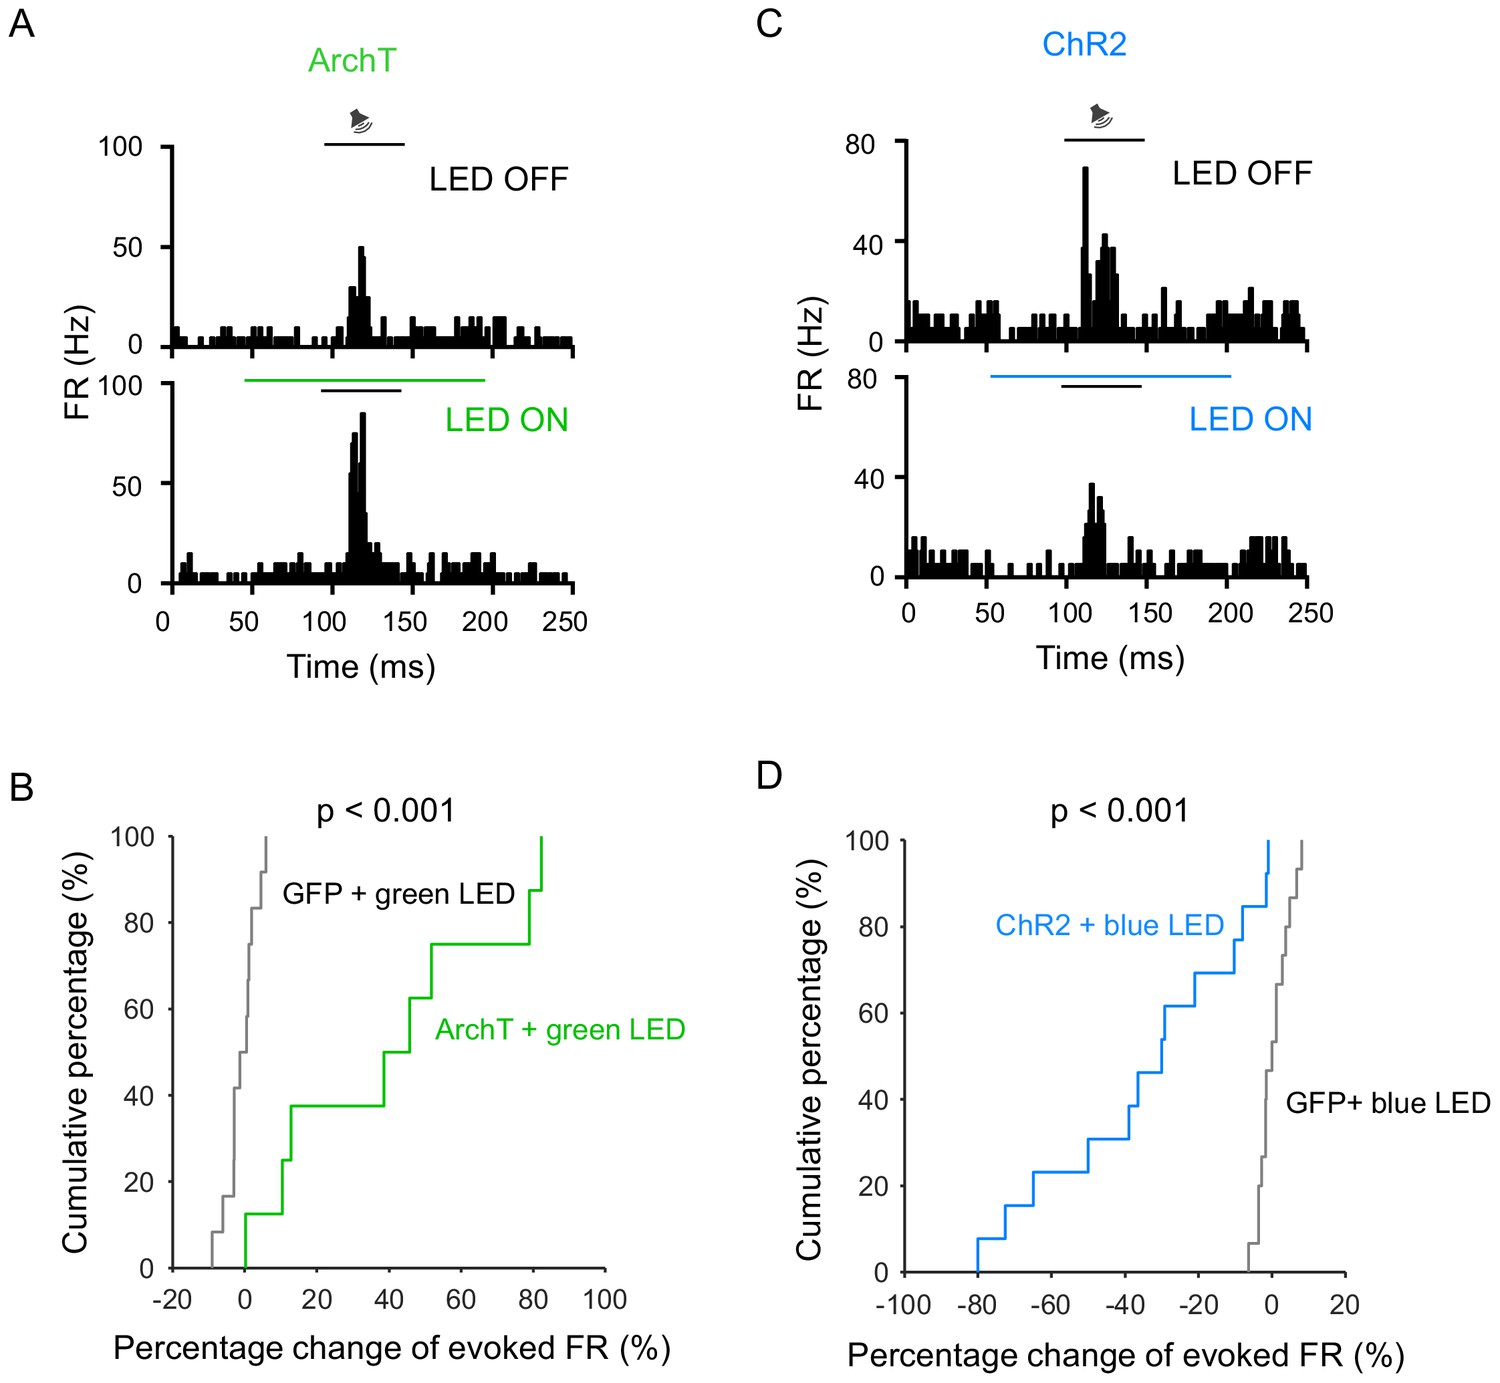
LED illumination had no effect on auditory response.
(A) PSTH for responses of an example A1 L2/3 neuron to tone (best frequency) stimulation without (top) and with (bottom) optical silencing of LP. Black and green horizontal lines mark the duration of tone and LED stimulation, respectively. (B) Cumulative distribution of percentage changes in tone-evoked responses in optogenetic inactivation and GFP-control (n = 12 cells) groups. The difference is significant: p<0.001, two-sample Kolmogorov–Smirnov test. (C) PSTH for responses of an example A1 L2/3 neuron without (top) and with (bottom) optical activation of LP (marked by blue line). (D) Cumulative distribution of percentage changes in tone-evoked responses in optogenetic activation and GFP-control (n = 13 cells) groups. The difference is significant: p<0.001, two-sample Kolmogorov–Smirnov test.
Figure 1—figure supplement 2
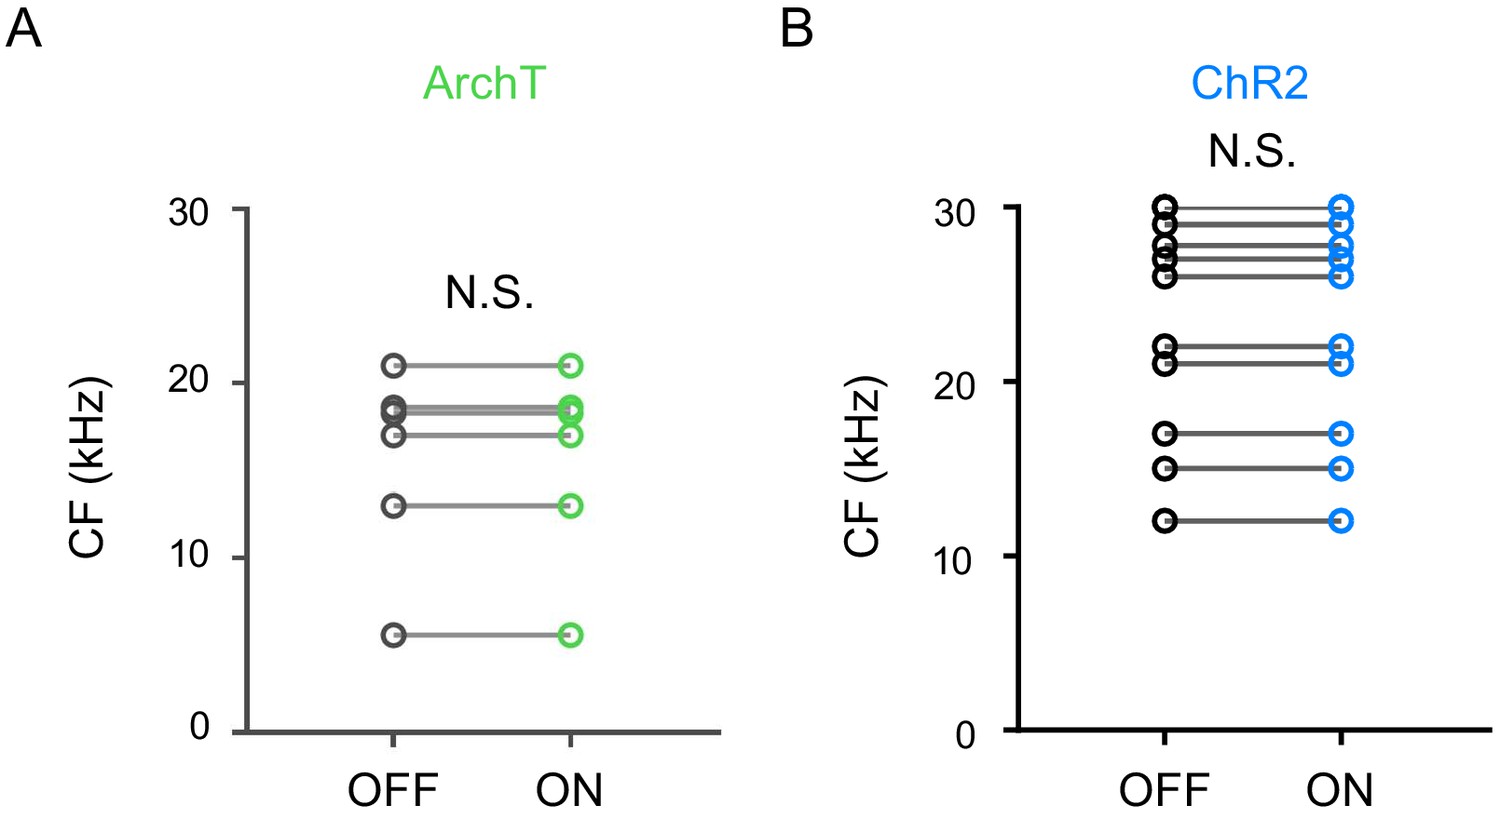
LP activity manipulation did not change CF of TRF.
(A–B) Summary of the CF values of A1 L2/3 neurons without (OFF) and with (ON) optical LP silencing (A, p=1.0, paired t-test, n = 8 cells) or activation (B, p=1.0, paired t-test, n = 13 cells). N.S., not significant.
Figure 1—figure supplement 3
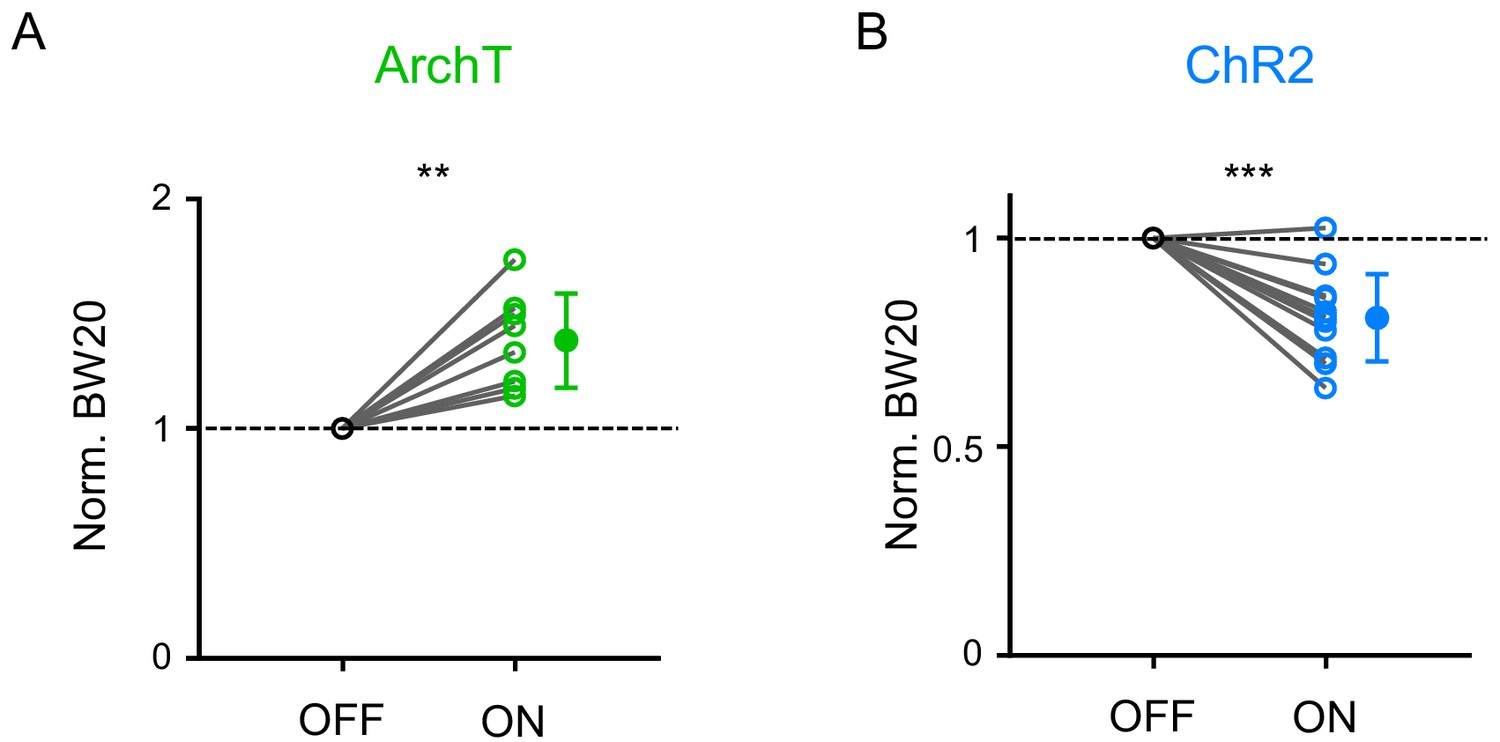
Effects on BW20.
(A–B) Normalized bandwidth of frequency tuning curves 20 dB above the intensity threshold (BW20) without and with LP silencing (A, p=0.0012, paired t-test, n = 8 cells) or activation (B, p<0.001, paired t-test, n = 13 cells). ***p<0.001, **p<0.01.
Figure 1—figure supplement 4
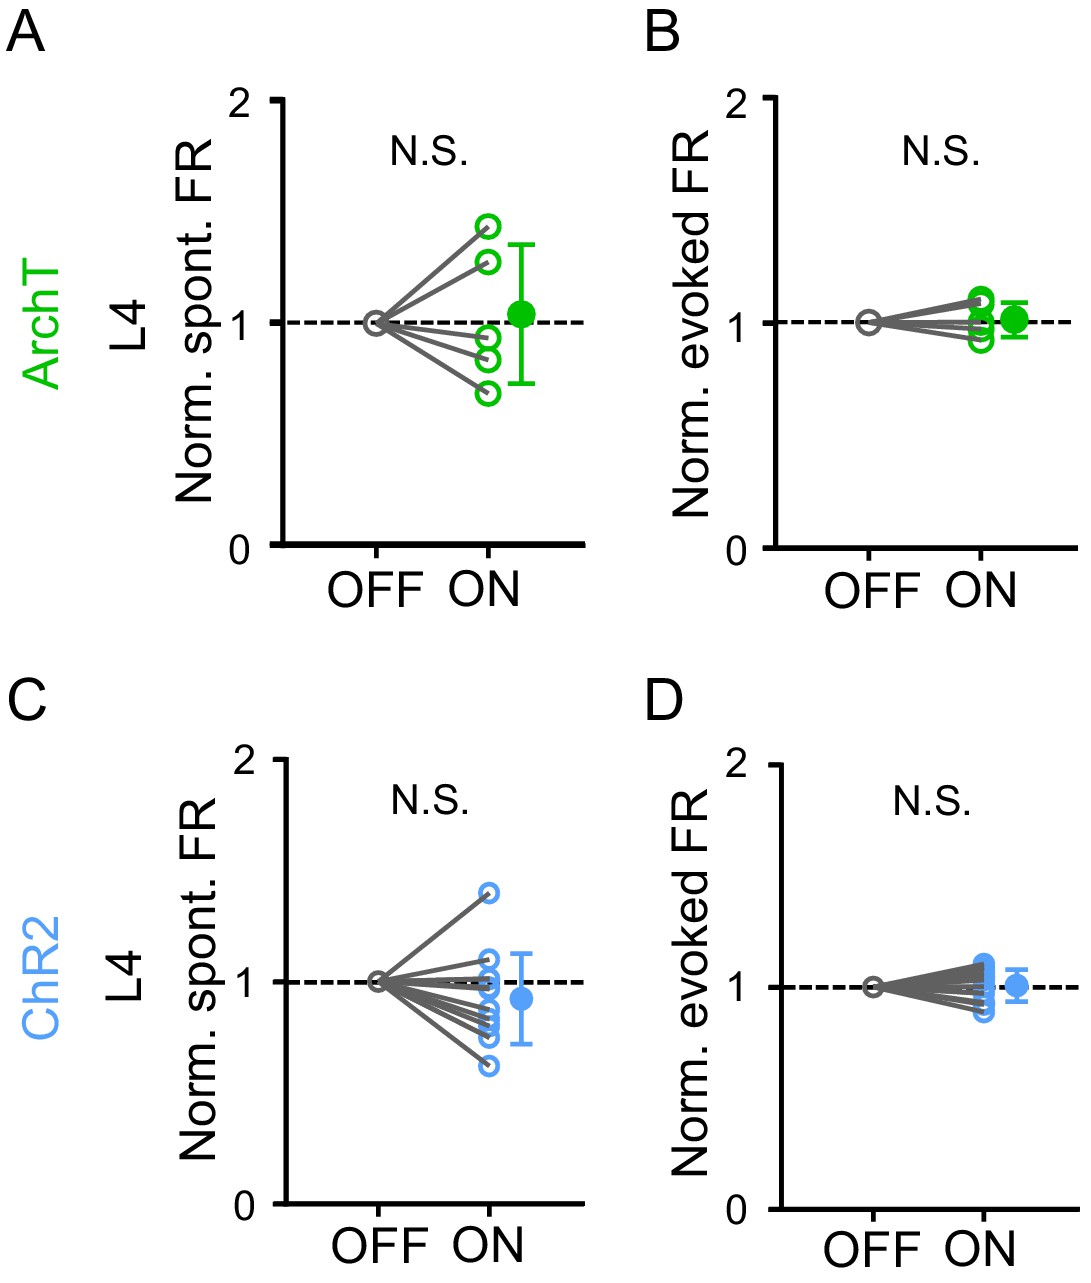
No effects in L4 of A1.
(A–B) Normalized spontaneous (A, p=1.0, Wilcoxon signed-rank test, n = 5 cells) and evoked firing rates (B, p=0.62, Wilcoxon signed-rank test, n = 5 cells) in A1 L4 neurons without (OFF) and with (ON) LP silencing. (C–D) Normalized spontaneous (C, p=0.23, paired t-test, n = 12 cells) and evoked firing rates (D, p=0.70, paired t-test, n = 12 cells) in A1 L4 neurons without and with LP activation.
Figure 2 with 2 supplements
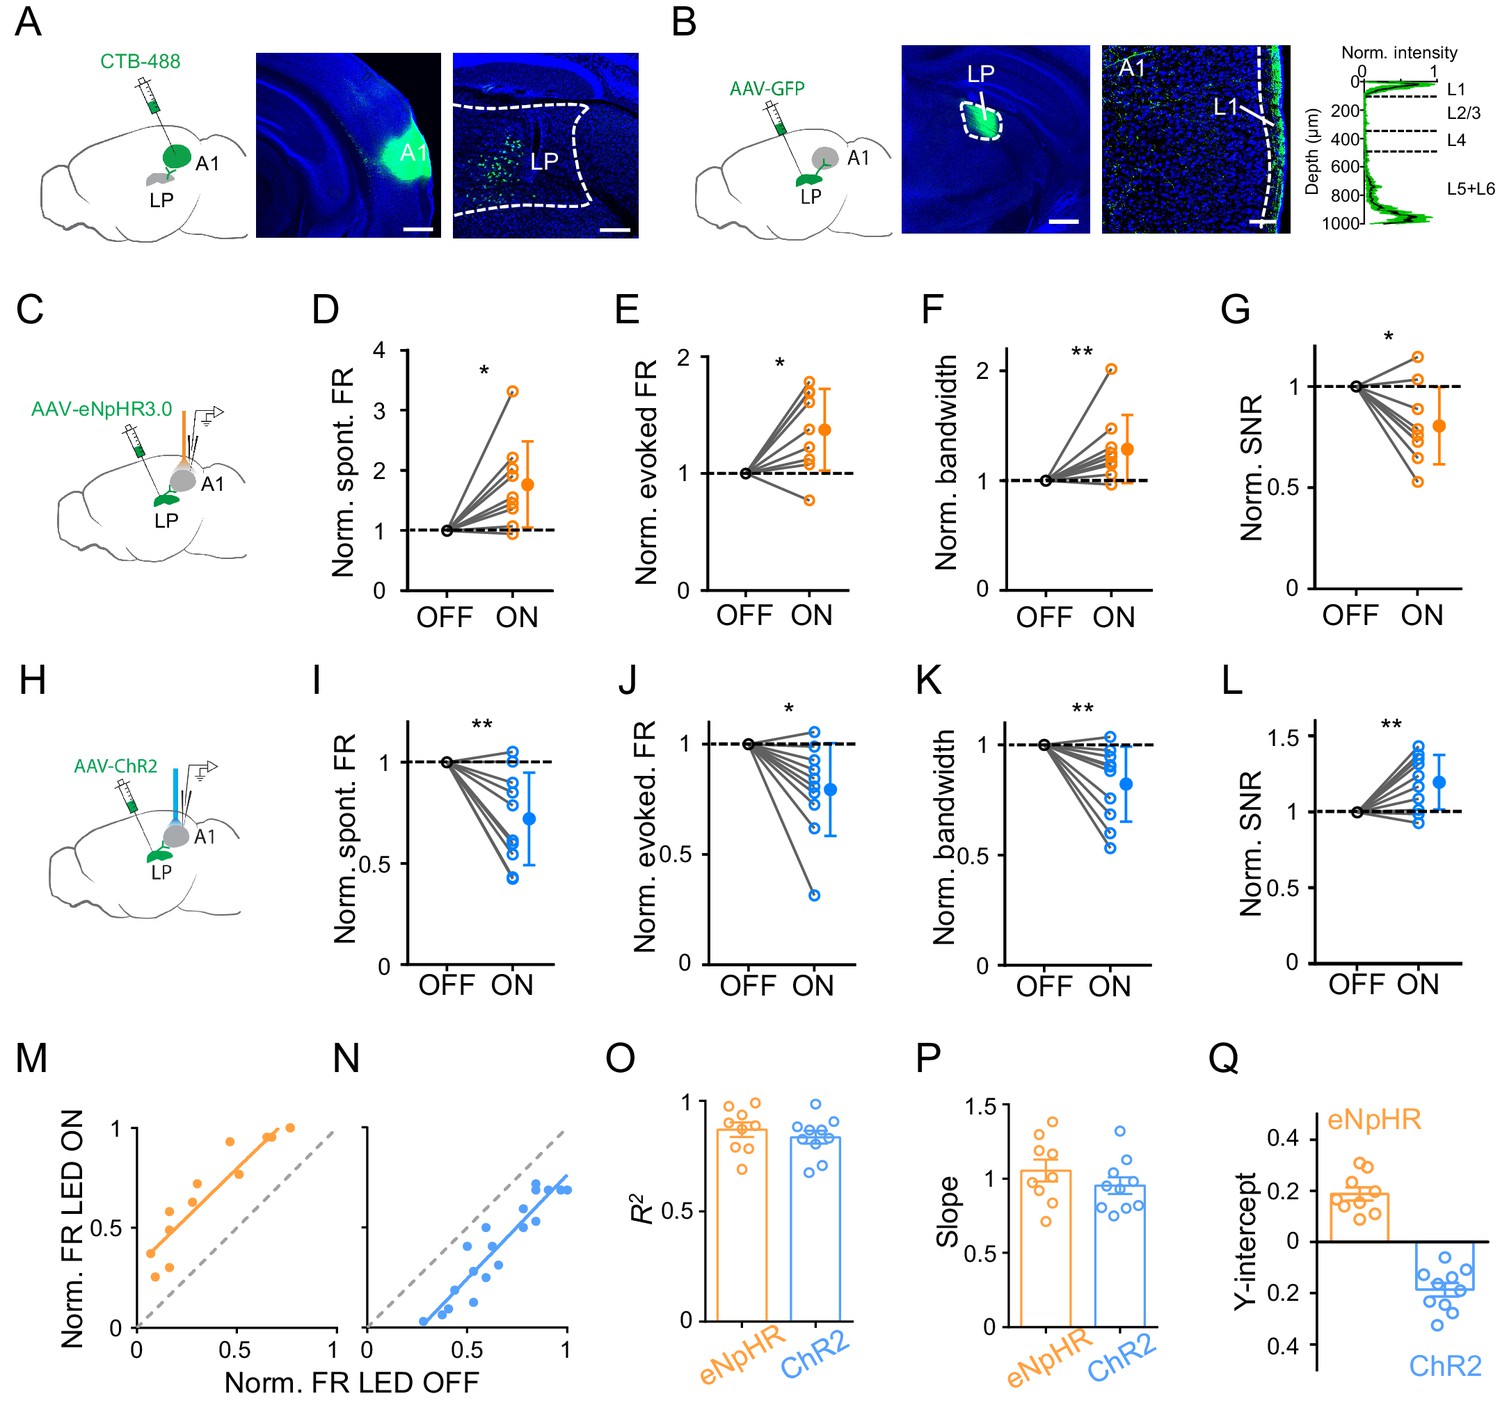
Bidirectional activity manipulations of the LP-A1 projection.
(A) Left, injection of CTB-488 into A1. Middle, image showing fluorescence at the injection site. Scale bar, 500 μm. Right, retrogradely labeled neurons in LP. Scale bars, 200 μm. (B) Left, injection of AAV-GFP into LP. Middle, expression of GFP at the injection site. Scale bar, 500 μm. Right, GFP-labeled LP axons in A1 and average normalized fluorescence intensity across cortical depths (n = 6 brain sections, black line and green shade represent mean ± SD respectively). Scale bar, 100 μm. Cortical layers are marked. (C) Injection of AAV-eNpHR3.0 into LP and optical silencing of LP-A1 axon terminals by placing the optic fiber over A1. (D–G) Normalized spontaneous firing rate (D, p=0.013, paired t-test, n = 9 cells in 4 animals), evoked firing rate (E, p=0.012, paired t-test), tuning bandwidth (F, p=0.0078, Wilcoxon signed-rank test), and SNR (G, p=0.015, paired t-test) of A1 L2/3 neurons without and with LP-A1 axon terminal silencing. **p<0.01, *p<0.05. (H) Injection of AAV-ChR2 into LP and optical activation of LP-A1 axon terminals. (I–L) Normalized spontaneous firing rate (I, p=0.0038, paired t-test, n = 10 cells in 4 animals), evoked firing rate (J, p=0.013, paired t-test), tuning bandwidth (K, p=0.009, paired t-test), and SNR (L, p=0.0081, paired t-test) of A1 L2/3 neurons without and with LP-A1 axons terminal activation. (M–N) Plot of normalized firing rates evoked by effective tones (at 60 dB SPL) with vs. without LP-A1 axon terminal silencing (M) or activation (N) for two example cells. (O–Q) Summary of parameters of linear fitting in terminal silencing (eNpHR3.0) and activation (ChR2) groups, respectively. R2 (O): 0.87 ± 0.098 (n = 9 cells) vs. 0.84 ± 0.091 (n = 10 cells); slope (P): 1.05 ± 0.22 (not significantly different from 1, p=0.48, Z-test) vs. 0.95 ± 0.18 (not significantly different from 1, p=0.42, Z-test); y-intercept (Q): 0.19 ± 0.077 (significantly >0, p<0.001, Z-test) vs. −0.19 ± 0.083 (significantly <0, p<0.001, Z-test). Bar = SEM.
-
Figure 2—source data 1
Data for Figure 2.
- https://cdn.elifesciences.org/articles/54157/elife-54157-fig2-data1-v2.xlsx
Figure 2—figure supplement 1
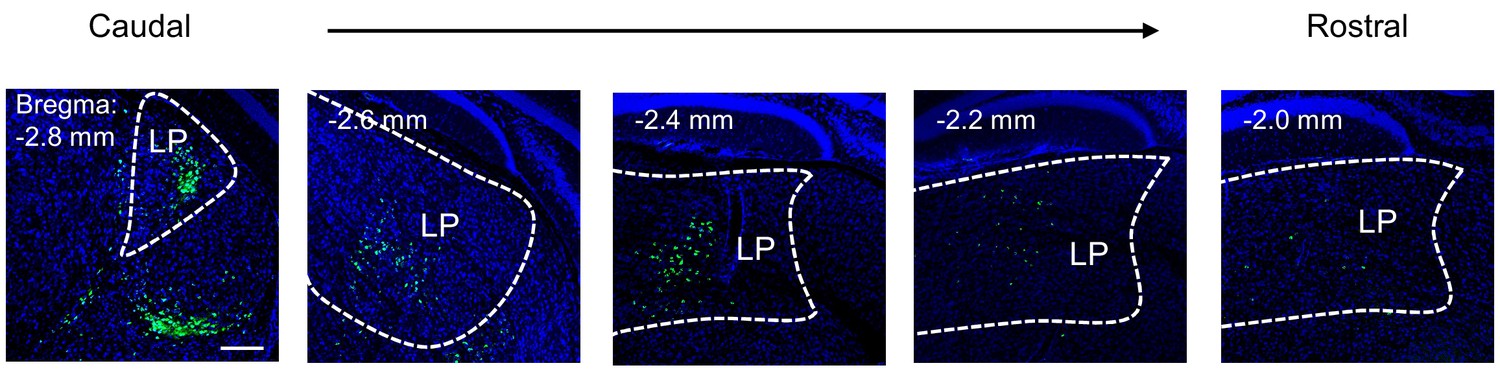
Projection from LP to A1.
Images showing distribution of retrogradely labeled A1-prejecting LP neurons across rostral-caudal axis. Scale bar, 200 μm.
Figure 2—figure supplement 2
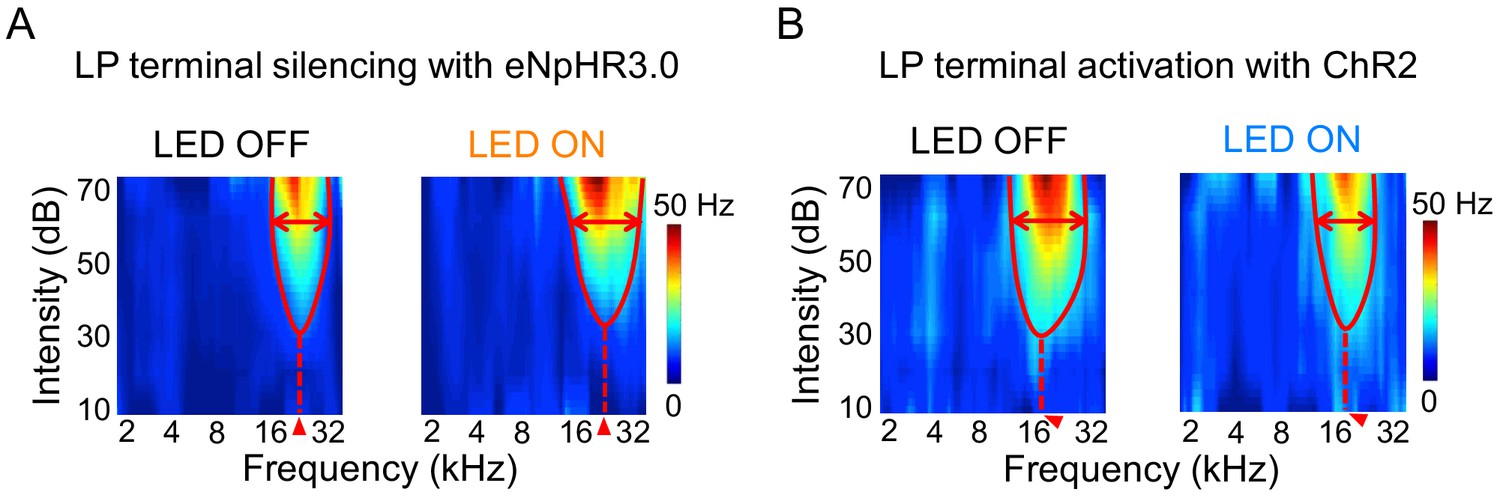
Effects of LP-A1 terminal manipulations on the TRF.
(A–B) TRFs of two example A1 L2/3 neurons without (left) and with (right) LP-A1 terminal silencing (A) or activation (B).
Figure 3
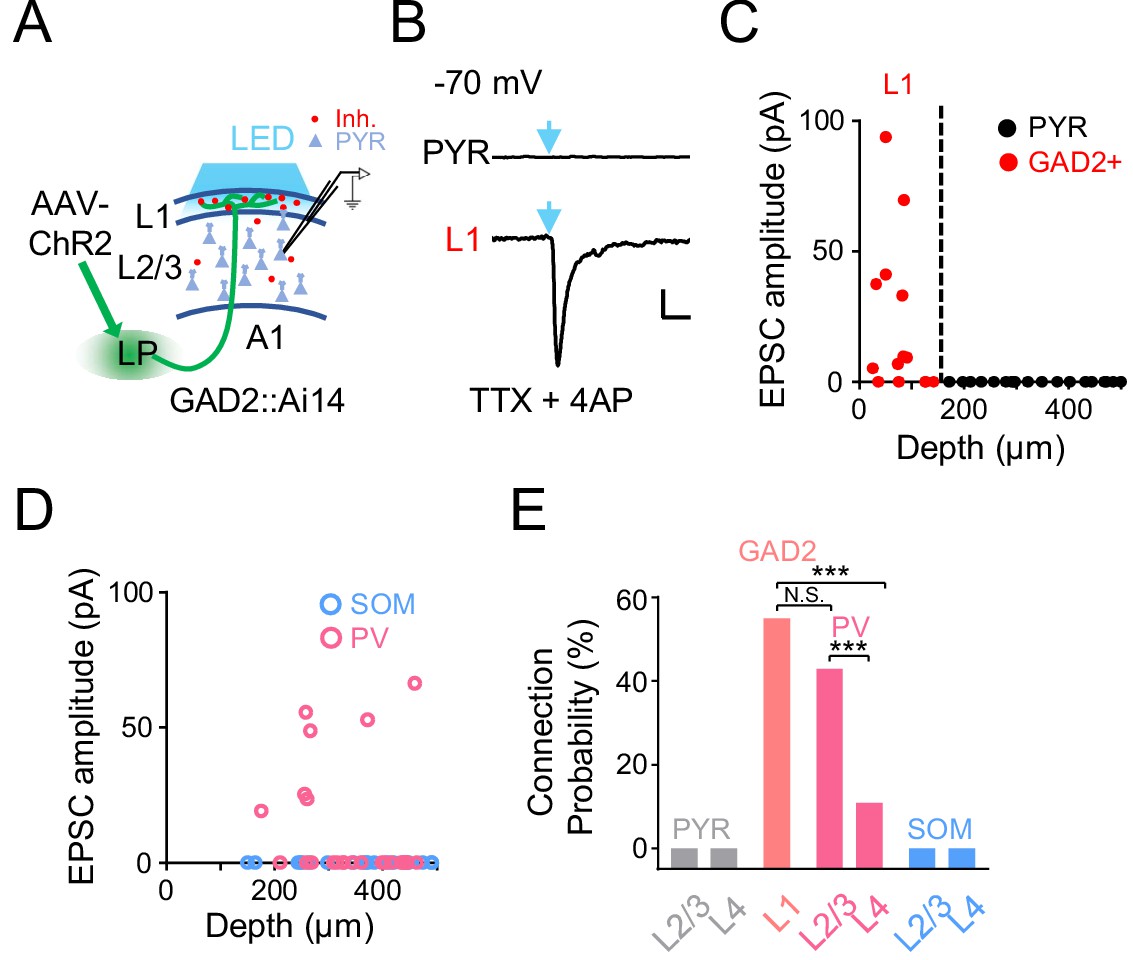
A1 cell types innervated by LP axons.
(A) Slice recording paradigm. AAV-ChR2 was injected into LP. Blue LED light was applied to A1 to active LP-A1 axon terminals. Whole-cell recordings were made from A1 neurons. (B) Light-evoked monosynaptic EPSC (average trace) recorded (at −70 mV) in an example L2/3 pyramidal (PYR, top) and L1 inhibitory neuron (bottom). TTX and 4AP were present in the bath solution. Blue arrow marks the onset of 5 ms light pulse. Scale: 200 ms and 20 pA. (C) Plot of average amplitude of light-evoked monosynaptic EPSCs against the cell’s cortical depth for all the recorded L1 inhibitory neurons (red, GAD2+) and pyramidal cells (black). Dashed line marks the boundary between L1 and L2/3. (D) Plot of average amplitude of light-evoked monosynaptic EPSCs against the cell’s cortical depth for the recorded PV (magenta) and SOM (blue) neurons. (E) Summary of connection probability between LP-A1 axons and L1 GAD2+ neurons, as well as pyramidal, PV and SOM neurons in different layers. L1 vs. L2/3 PV, p=0.12; L1 vs. L4 PV, ***p<0.001; L2/3 PV vs. L4 PV, ***p<0.001, Fisher’s exact test. N.S., not significant.
-
Figure 3—source data 1
Data for Figure 3.
- https://cdn.elifesciences.org/articles/54157/elife-54157-fig3-data1-v2.xlsx
Figure 4
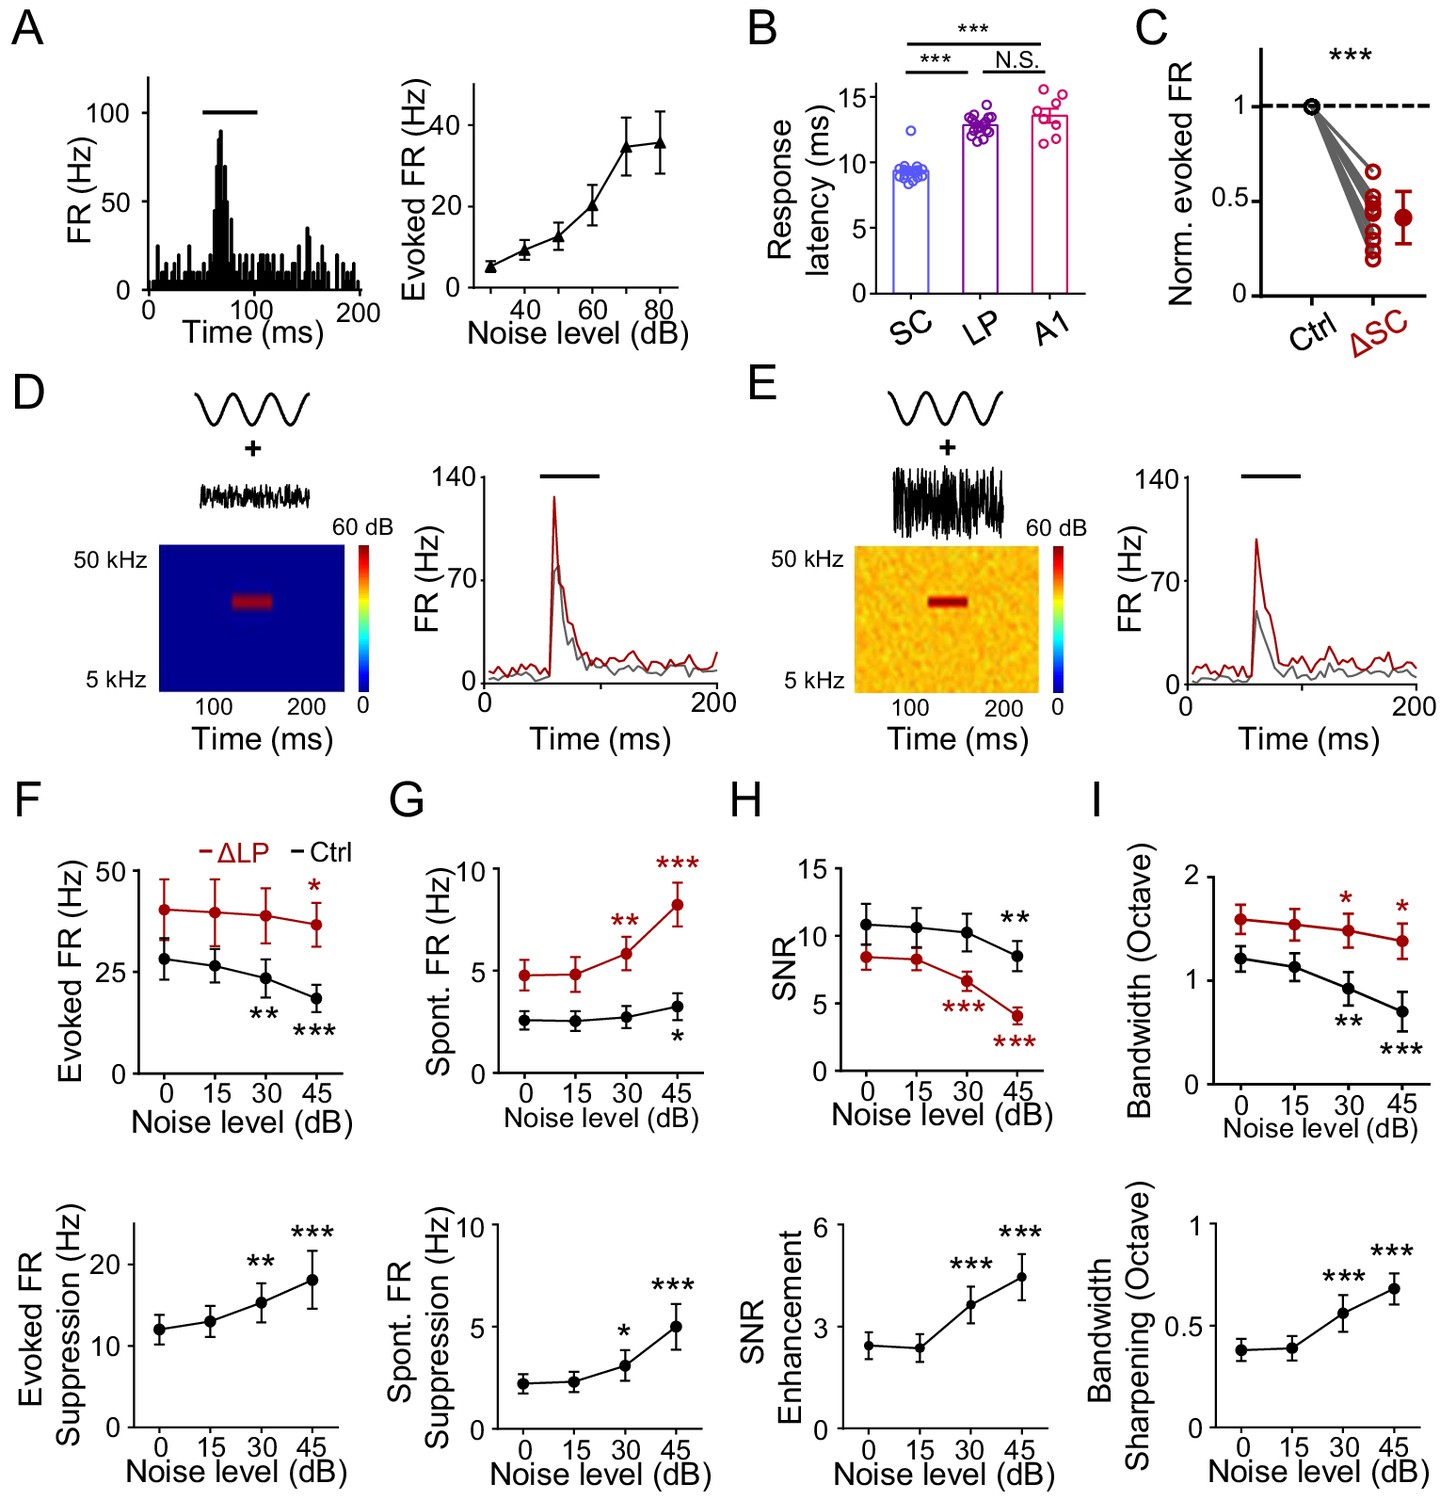
LP plays a role in noise-related contextual modulation of A1 responses.
(A) Left, PSTH for responses of an example neuron in the caudal LP to white noise sound (marked by black line). Right, mean noise-evoked firing rate plotted against noise intensity (n = 10 LP neurons). Bar = SD. (B) Left, onset latency of noise (at 60 dB SPL) evoked responses in SC (n = 17 cells), LP (n = 17) and A1 L4 (n = 8) neurons. ***p<0.001, One-way ANOVA with Bonferroni's multiple comparisons test. N.S., not significant. (C) Normalized noise-evoked firing rate of LP neurons before (Ctrl) and after silencing SC (ΔSC). ***p<0.001, paired t-test, n = 12 cells in 2 animals. (D) Left, spectrogram of the stimulus: a 50 ms CF tone (at 60 dB SPL) embedded in low-level noise (at 0 dB SPL, 250 ms duration). Right, PSTHs for responses of an example A1 L2/3 neuron to the tone embedded in noise before (black) and after (red) silencing LP with bupivacaine. Black line marks the tone duration. (E) Response of the same cell to the same tone (60 dB SPL) embedded in higher-level noise (45 dB SPL) before and after silencing LP. (F) Upper, summary of evoked firing rates of A1 neurons at different noise levels before (black) and after (red) silencing LP. Lower, change in evoked firing rate by LP silencing at different noise levels. ***p<0.001, **p<0.01, *p<0.05, paired t-test, compared to the values under 0 dB noise condition, n = 9 cells from 4 animals. Bar = SD. (G) Summary of spontaneous firing rates before and after silencing LP. (H) Summary of SNR before and after silencing LP. (I) Summary of tuning bandwidths before and after silencing LP.
-
Figure 4—source data 1
Data for Figure 4.
- https://cdn.elifesciences.org/articles/54157/elife-54157-fig4-data1-v2.xlsx
Figure 5 with 1 supplement
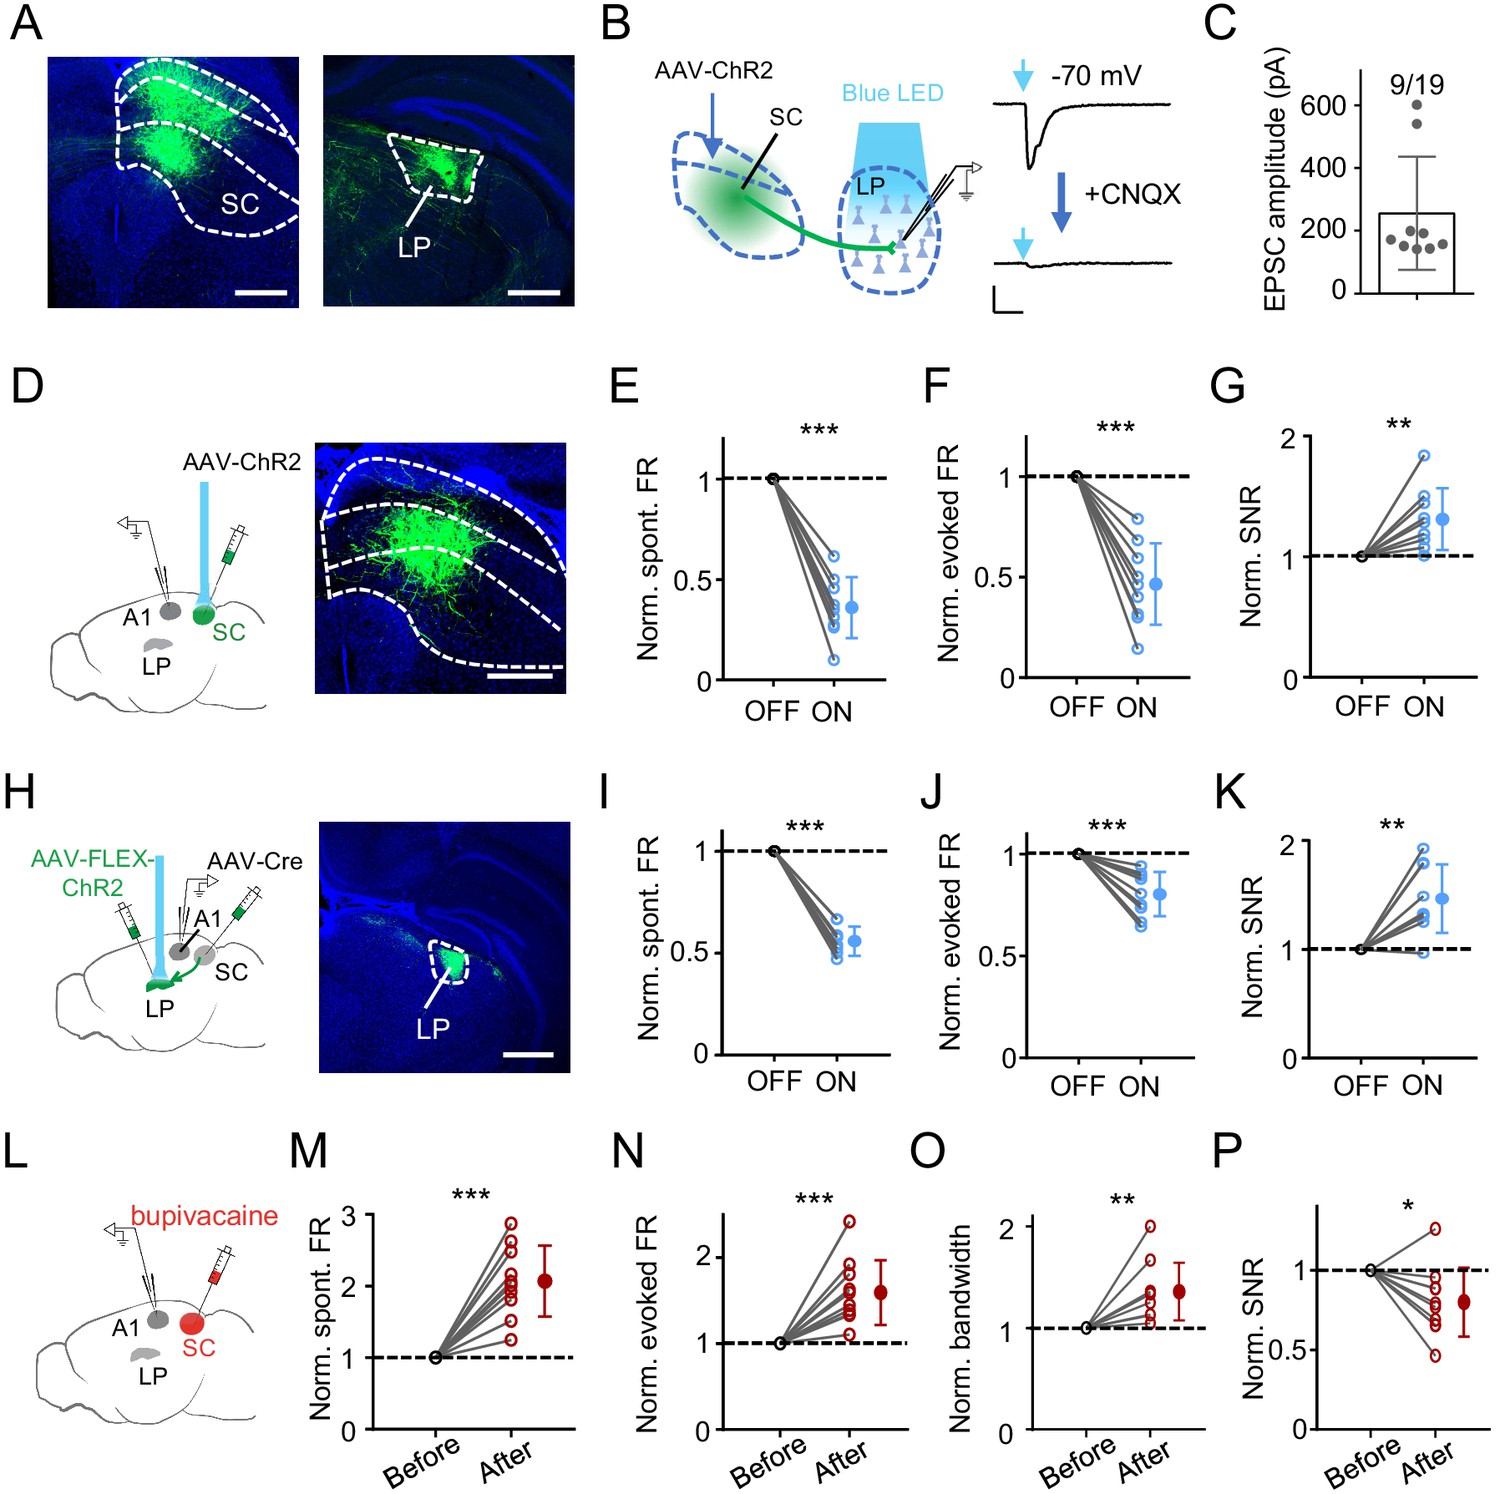
SC can drive LP-mediated modulation of A1 responses.
(A) Injection of AAV-GFP into intermediate and deep layers of SC. Left, expression of GFP in SC. Boundaries between superficial, intermediate and deep layers are marked by dashed curves. Right, GFP labeled SC axons within LP. Scale bar, 500 μm. (B) Left, slice recording paradigm: expressing ChR2 in SC and whole-cell recording from LP neurons. Right, light-evoked monosynaptic EPSC (average trace) in an example LP neuron before and after perfusing in CNQX. Scale: 100 pA and 50 ms. (C) Average amplitudes of light-evoked monosynaptic EPSCs in LP neurons. Neurons not showing a light-evoked EPSC were excluded. (D) Left, illustration of optic activation of SC and recording in A1. Right, expression of ChR2 in SC. Scale bar, 500 μm. (E–G) Normalized spontaneous FR (E), evoked FR (F), and SNR (G) of A1 neurons without and with optical SC activation. ***p<0.001, **p=0.0065, paired t-test, n = 9 cells in 4 animals. (H) Transsynaptic labeling of SC-recipient LP neurons by first injection of AAV-Cre into intermediate and deep layers of SC and second injection of Cre-dependent ChR2 virus in LP. Right, expression of ChR2-EYFP in LP. Scale bar, 500 μm. (I–K) Normalized spontaneous FR (I), evoked FR (J), and SNR (K) of A1 L2/3 neurons without and with optical activation of SC-recipient LP neurons. ***p<0.001, **p=0.0022, paired t-test, n = 9 cells in 5 animals. (L) Experimental paradigm: silencing SC by infusing bupivacaine and recording in A1. (M–P) Normalized spontaneous FR (M), evoked FR (N), tuning bandwidth at 60 dB SPL (O) and SNR (P) of A1 L2/3 neurons before and after SC silencing. ***p<0.001, **p=0.0030, *p=0.017, paired t-test, n = 10 cells in 7 animals.
-
Figure 5—source data 1
Data for Figure 5.
- https://cdn.elifesciences.org/articles/54157/elife-54157-fig5-data1-v2.xlsx
Figure 5—figure supplement 1
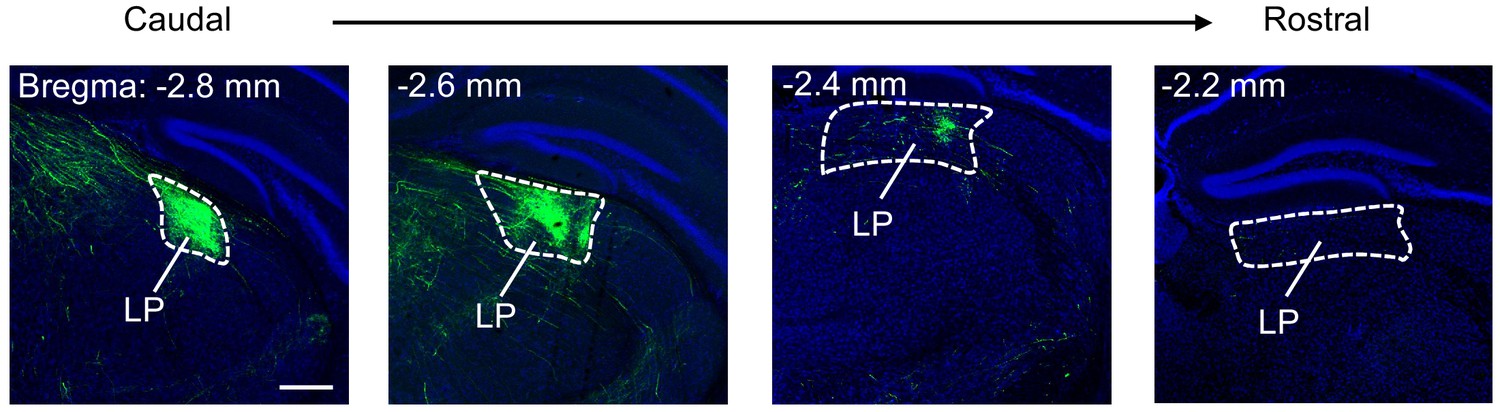
SC projection to LP.
Images showing anterogradely labeled SC axons in LP across rostral-caudal axis. Scale bar, 500 μm.
Figure 6 with 1 supplement
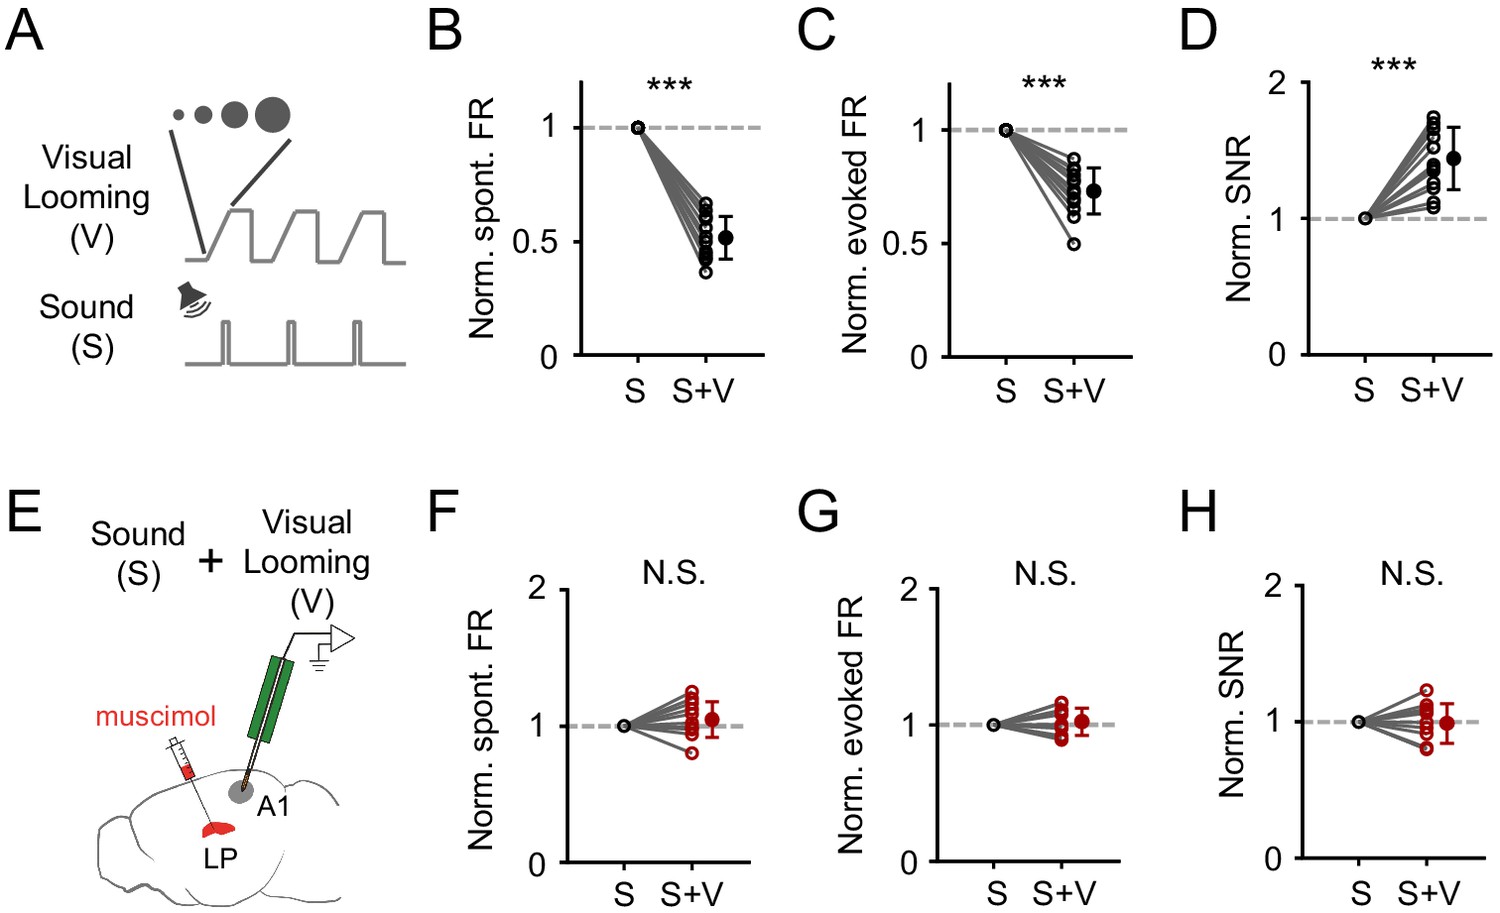
Visual looming stimuli modulate A1 auditory responses via LP.
(A) Pairing of visual looming (V) and sound (S) stimulation. (B–D) Normalized spontaneous FR (B), evoked FR (C), and SNR (D) of A1 L2/3 neurons under sound only (S) and sound plus visual looming (S+V) condition. ***p<0.001, paired t-test, n = 12 cells from 2 animals. (E) Testing the effect of visual looming on A1 responses under condition of silencing LP with muscimol. (F–H) Normalized spontaneous FR (E, p=0.25, paired t-test, n = 12 cells from 2 animals), evoked FR (F, p=0.42, paired t-test, n = 12 cells), and SNR (G, p=0.79, paired t-test, n = 12 cells) of A1 neurons when LP was silenced. N.S., not significant.
-
Figure 6—source data 1
Data for Figure 6 and Figure 6—figure supplement 1.
- https://cdn.elifesciences.org/articles/54157/elife-54157-fig6-data1-v2.xlsx
Figure 6—figure supplement 1
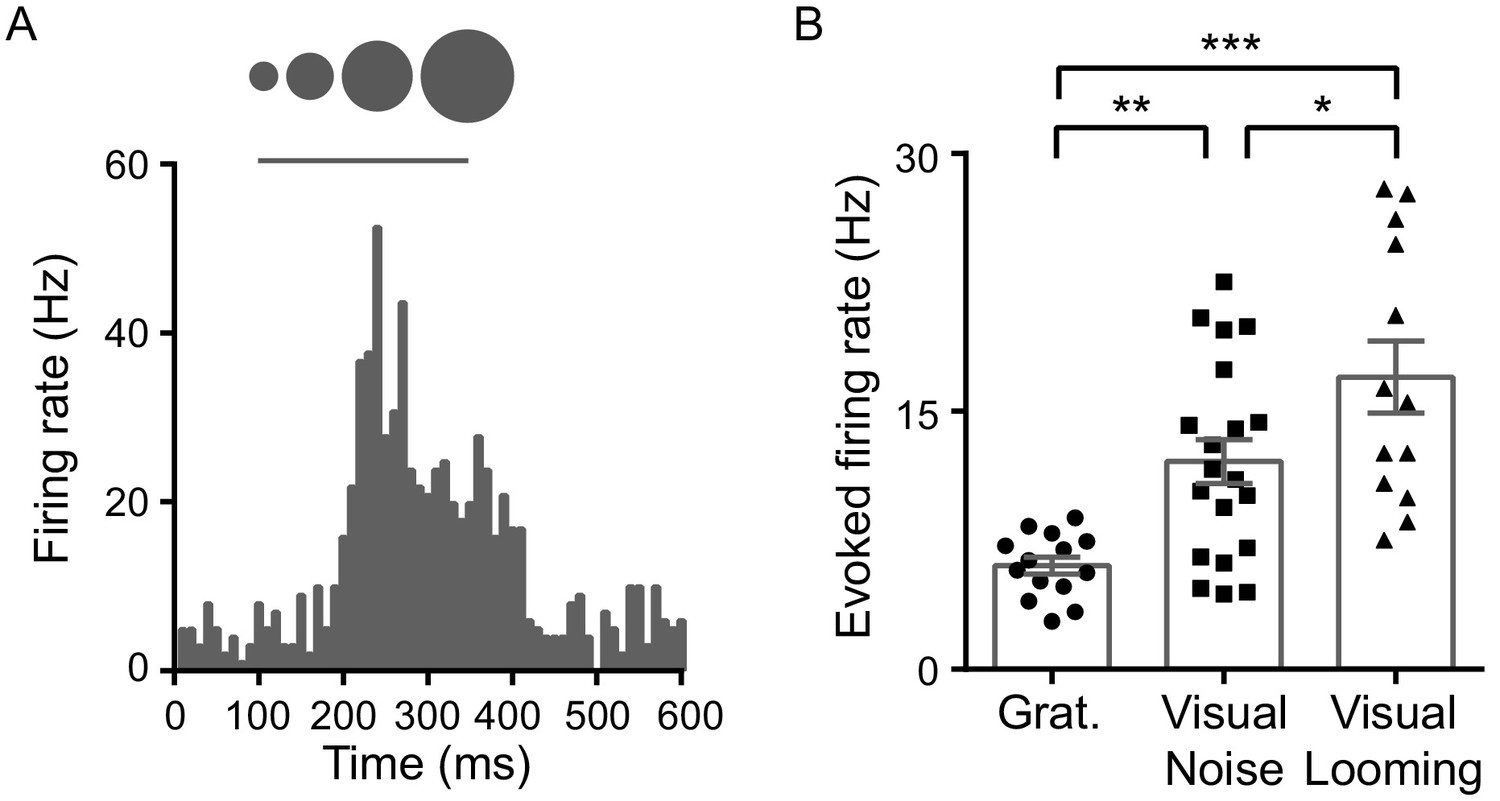
LP neurons are activated strongly by visual looming stimuli.
(A) PSTH for responses of an example LP neuron to visual looming stimuli. (B) Evoked firing rates of LP neurons to visual moving gratings, flash white-noise patterns and looming stimuli, assayed by single-unit recording (n = 14, 20, and 13 cells from 2 animals, respectively). *p=0.049, **p=0.0090, ***p<0.001, unpaired t-test with Bonferroni’s correction. Bar represents mean ± SEM.
Tables
Key resources table
| Reagent type (species) or resource | Designation | Source or reference | Identifiers | Additional information |
|---|---|---|---|---|
| Strain, strain background (Mus musculus) | C57BL/6J | Jachson Laboratory | RRID:IMSR_JAX:000664 | |
| Genetic reagent (Mus musculus) | Ai14 | Jachson Laboratory | RRID:IMSR_JAX:007914 | |
| Genetic reagent (Mus musculus) | GAD2-IRES-Cre | Jachson Laboratory | RRID:IMSR_JAX:010802 | |
| Genetic reagent (Mus musculus) | PV-IRES-Cre | Jachson Laboratory | RRID:IMSR_JAX:008069 | |
| Genetic reagent (Mus musculus) | SOM-IRES-Cre | Jachson Laboratory | RRID:IMSR_JAX:013044 | |
| Recombinant DNA reagent | AAV1-CAMKII-hChR2-eYFP | UPenn Vector Core | Addgene #26969 | |
| Recombinant DNA reagent | AAV1-CAG-ArchT-GFP | UPenn Vector Core | Addgene #29777 | |
| Recombinant DNA reagent | AAV1-hSyn-eNpHR3.0-mCherry | UPenn Vector Core | Addgene #26972 | |
| Recombinant DNA reagent | AAV2/1-CB7-Cl-eGFP-WPRE-rBG | UPenn Vector Core | Addgene #105542 | |
| Recombinant DNA reagent | AAV2/1-hSyn-Cre-WPRE-hGH | UPenn Vector Core | Addgene #105553 | |
| Recombinant DNA reagent | AAV2/1-EF1a-DIO-hChR2-eYFP | UPenn Vector Core | Addgene #105553 | |
| Chemical compound, drug | Cholera Toxin Subunit B (Recombinant), Alexa Fluor 488 Conjugate | ThermoFisher | C22841 | |
| Chemical compound, drug | NeuroTrace 640/660 Deep-Red Fluorescent Nissl Stain | ThermoFisher | N21483 | |
| Chemical compound, drug | Muscimol | ThermoFisher | M23400 | |
| Chemical compound, drug | Bupivacaine | Sigma-Aldrich | B1160000 | |
| Chemical compound, drug | Tetrodotoxin (TTX) | Torcris | Cat. No. 1078 | 1 µM |
| Chemical compound, drug | 4-Aminopyridine (4-AP) | Torcris | Cat. No. 0940 | 1 mM |
| Chemical compound, drug | Cyanquixaline (CNQX) | Sigma-Aldrich | C239 | 20 µM |
| Software, algorithm | Offline Sorter | Plexon | https://plexon.com | |
| Software, algorithm | MATLAB | Mathworks | https://www.mathworks.com/; RRID:SCR_001622 | |
| Software, algorithm | Prism | GraphPad | https://www.graphpad.com/scientific-software/prism/; RRID:SCR_00279 | |
| Software, algorithm | Fiji | NIH | https://fiji.sc/; RRID:SCR_002285 |
Additional files
Download links
A two-part list of links to download the article, or parts of the article, in various formats.
Downloads (link to download the article as PDF)
Open citations (links to open the citations from this article in various online reference manager services)
Cite this article (links to download the citations from this article in formats compatible with various reference manager tools)
Contextual and cross-modality modulation of auditory cortical processing through pulvinar mediated suppression
eLife 9:e54157.
https://doi.org/10.7554/eLife.54157


