Epigenetic inheritance of circadian period in clonal cells
- Department of Neuroscience, Peter O’Donnell Jr. Brain Institute, University of Texas Southwestern Medical Center, United States
- Howard Hughes Medical Institute, University of Texas Southwestern Medical Center, United States
Figures
Figure 1
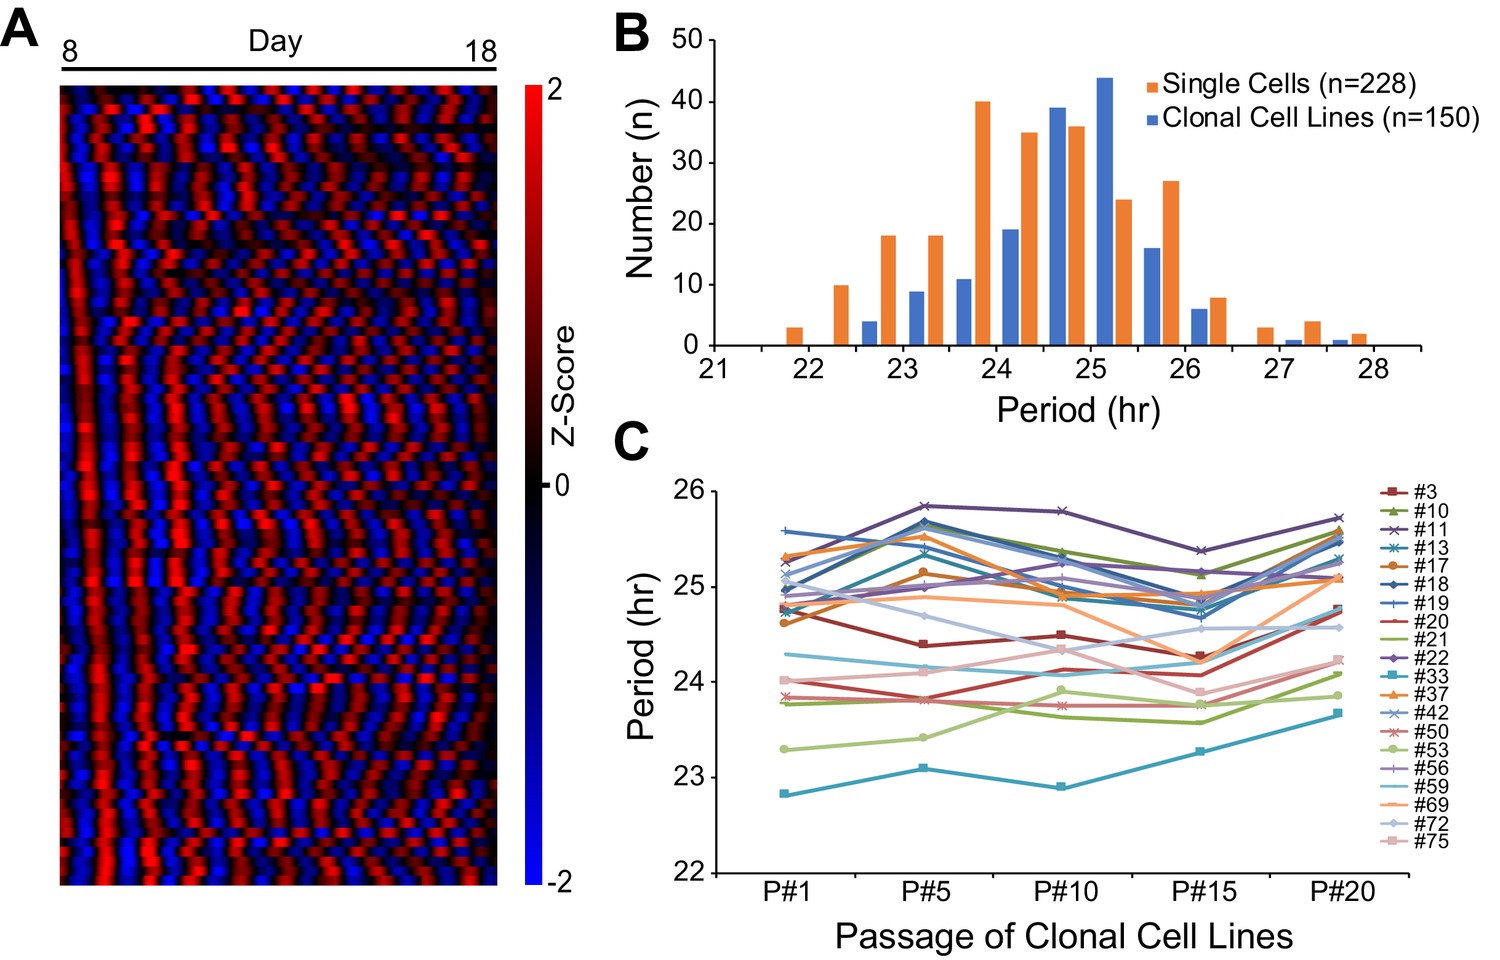
Heritable Circadian Periodicity in Clonal Cell Lines.
(A) Heatmap showing circadian oscillations of 83 single cells from parent culture tracked continuously for 10 days (sorted by phase at day 8). (B) Histogram showing circadian period distributions of single cells compared to clonal cell lines generated from the same parent culture. Single cells: 24.38 ± 1.20 hr (mean ± SD), ranged 21.55–27.82 hr. Clonal cell lines: 24.81 ± 0.83 hr, ranged 22.76–27.65 hr. Clonal cell lines were measured as a whole culture. Data are replotted from Li et al., 2020 and presented as averages from ≥3 experiments. (C) Periods of individual clonal cell lines of different generations. Periods were analyzed for the whole culture at passages 1, 5, 10, 15, and 20. Data are presented as averages from ≥3 experiments.
Figure 2
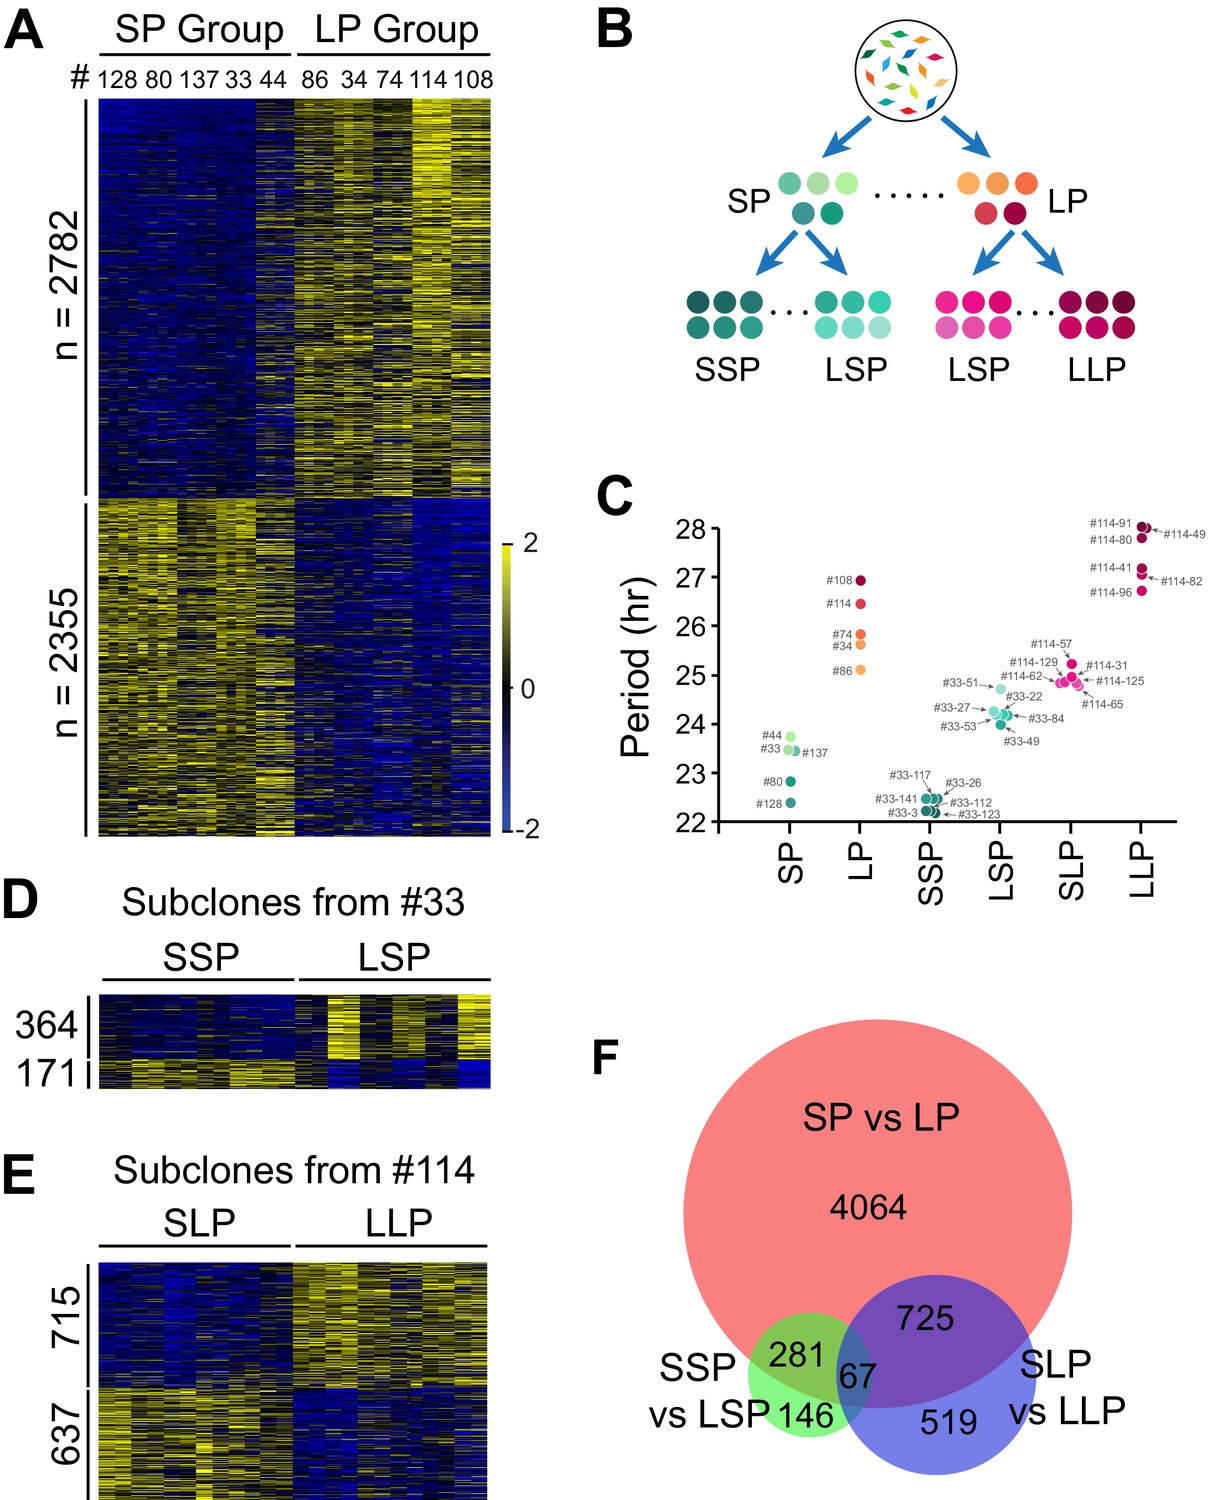
Differentially Expressed Genes Correlated with Circadian Period Heterogeneity.
(A) Heatmap of 5,137 period-correlated differentially expressed (DE) genes identified between two groups of clonal cell lines. SP: short period. LP: long period. Clones were sorted based on period length. Clone IDs shown at top. Four columns for each clone indicate two time-points, two replicates. From left to right: replicate1_T1, replicate1_T2, replicate2_T1 and replicate2_T2. Color scale represents z-score. (B) Experimental scheme for establishing subgroups of clonal cell lines carrying different circadian periods. SSP: shorter period subgroup from short period clone. LSP: longer period subgroup from short period clone. SLP: shorter period subgroup from long period clone. LLP: longer period subgroup from long period clone. (C) Scatter plot showing period length of different groups. Each dot represents a clonal cell line. (D) Heatmap of 535 period-correlated DE genes identified between two groups of subclones derived from SP clone#33. Each group include six subclones sorted based on period length. From left to right: #33–123, #33–112, #33–3, #33–26, #33–117, #33–141, #33–49, #33–84, #33–22, #33–53, #33–27, #33–51. Two columns for each sample indicate two time-points. (E) Heatmap of 1,352 period-correlated DE genes identified between two groups of subclones derived from LP clone#114. Each group include six subclones sorted based on period length. From left to right: #114–65, #114–125, #114–62, #114–129, #114–31, #114–57, #114–96, #114–82, #114–41, #114–80, #114–49, #114–91. Two columns for each sample indicate two time-points. (F) Area-proportional Venn diagram comparing DE genes identified above. For more information, see Figure 2—source data 1.
-
Figure 2—source data 1
RNA-seq of All Clonal Cell Lines; List of Period-correlated DE Genes.
- https://cdn.elifesciences.org/articles/54186/elife-54186-fig2-data1-v2.xlsx
Figure 3
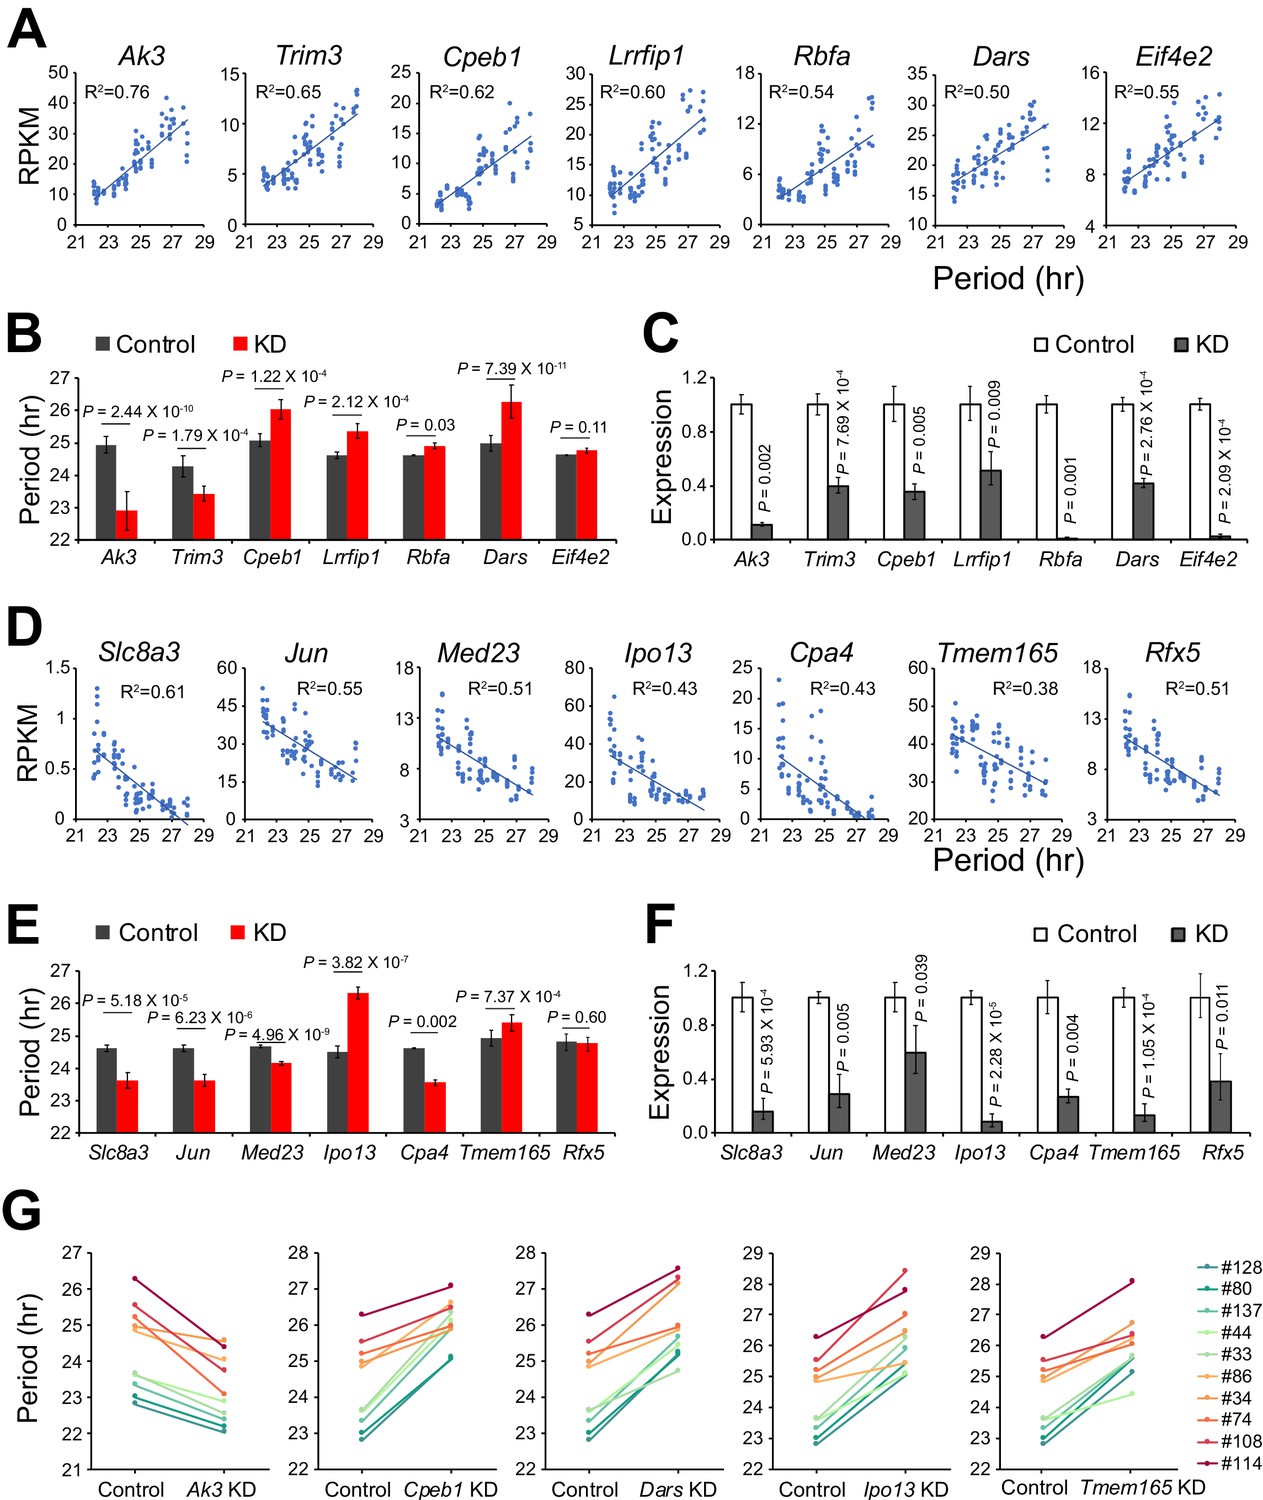
Validation of Novel Candidate Genes Regulating Circadian Periodicity.
(A) Scatter plot of seven novel candidate genes showing positive correlation between gene expression and period length across all 88 samples. (B) Histogram comparing periods after knocking down seven positively correlated genes in parent culture. n ≥ 3 for each gene. Error bar indicates SD. (C) QPCR results showing knockdown efficiency of seven positively correlated genes. Error bar indicates SD. (D) Scatter plot of seven novel candidate genes showing negative correlation between gene expression and period length across all 88 samples. (E) Histogram comparing periods after knocking down seven negatively correlated genes in parent culture. n ≥ 3 for each gene. Error bar indicates SD. (F) QPCR results showing knockdown efficiency of seven negatively correlated genes. Error bar indicates SD. (G) Knockdown of five representative candidate genes in 10 clonal cell lines. For more information, see Figure 3—source data 1.
-
Figure 3—source data 1
Gene Knockdown in Parent Culture; Gene Knockdown in 10 Clonal Cell lines.
- https://cdn.elifesciences.org/articles/54186/elife-54186-fig3-data1-v2.xlsx
Figure 4
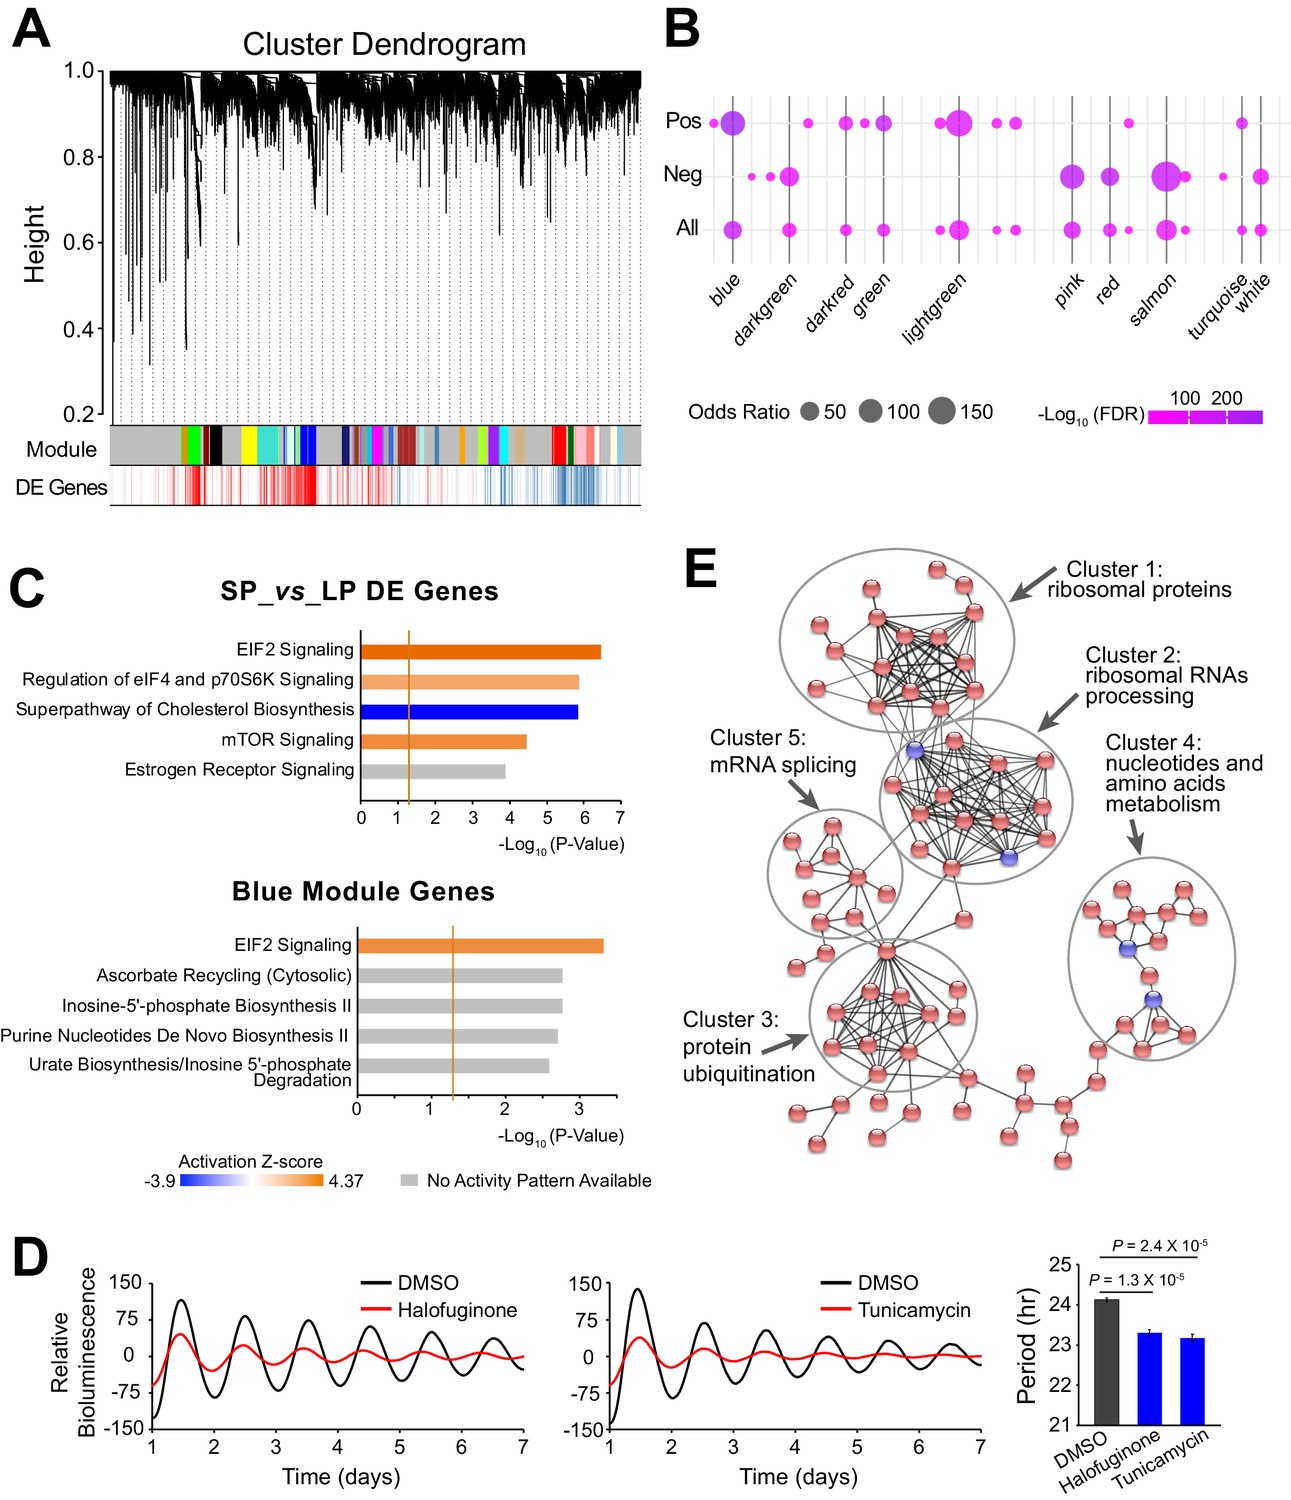
Large-scale Co-expressed Gene Networks Associated with Period-correlated DE Genes.
(A) Gene co-expression modules identified via WGCNA for 10 clonal cell lines. Each branch in the dendrogram on top represents a cluster of highly correlated genes. Thirty-one modules were identified and marked by colors on the horizontal bar. Bottom row shows period-correlated DE genes identified in Figure 2a. Red bars indicate positive correlation (Pearson correlation coefficient >0.5). Blue bars indicate negative correlation (Pearson correlation coefficient <−0.5). (B) Bubble plot showing enrichment of period-correlated DE genes in each module. Rows from top to bottom indicate enrichment of positively correlated, negatively correlated, and all period-correlated DE genes, respectively. Dark grey bars highlight the top 10 enriched modules. (C) Top five Ingenuity pathways associated with 5,137 period-correlated DE genes comparing SP and LP groups (top) or blue module (bottom). Brown threshold line refers to p-value=0.05. (D) Two small molecule activators of EIF2 signaling pathway, halofuginone and tunicamycin, significantly shortened circadian period in parent culture. Error bar indicates SD. (E) The main PPI network of genes in blue module. Disconnected nodes were hidden. Red indicates period-correlated DE genes. Line thickness indicates confidence. For more information, see Figure 4—source data 1.
-
Figure 4—source data 1
WGCNA Module Lists and Enrichment Analysis Results; IPA Canonical Pathway Analysis of DE Genes and WGCNA Modules.
- https://cdn.elifesciences.org/articles/54186/elife-54186-fig4-data1-v2.xlsx
Figure 5 with 1 supplement
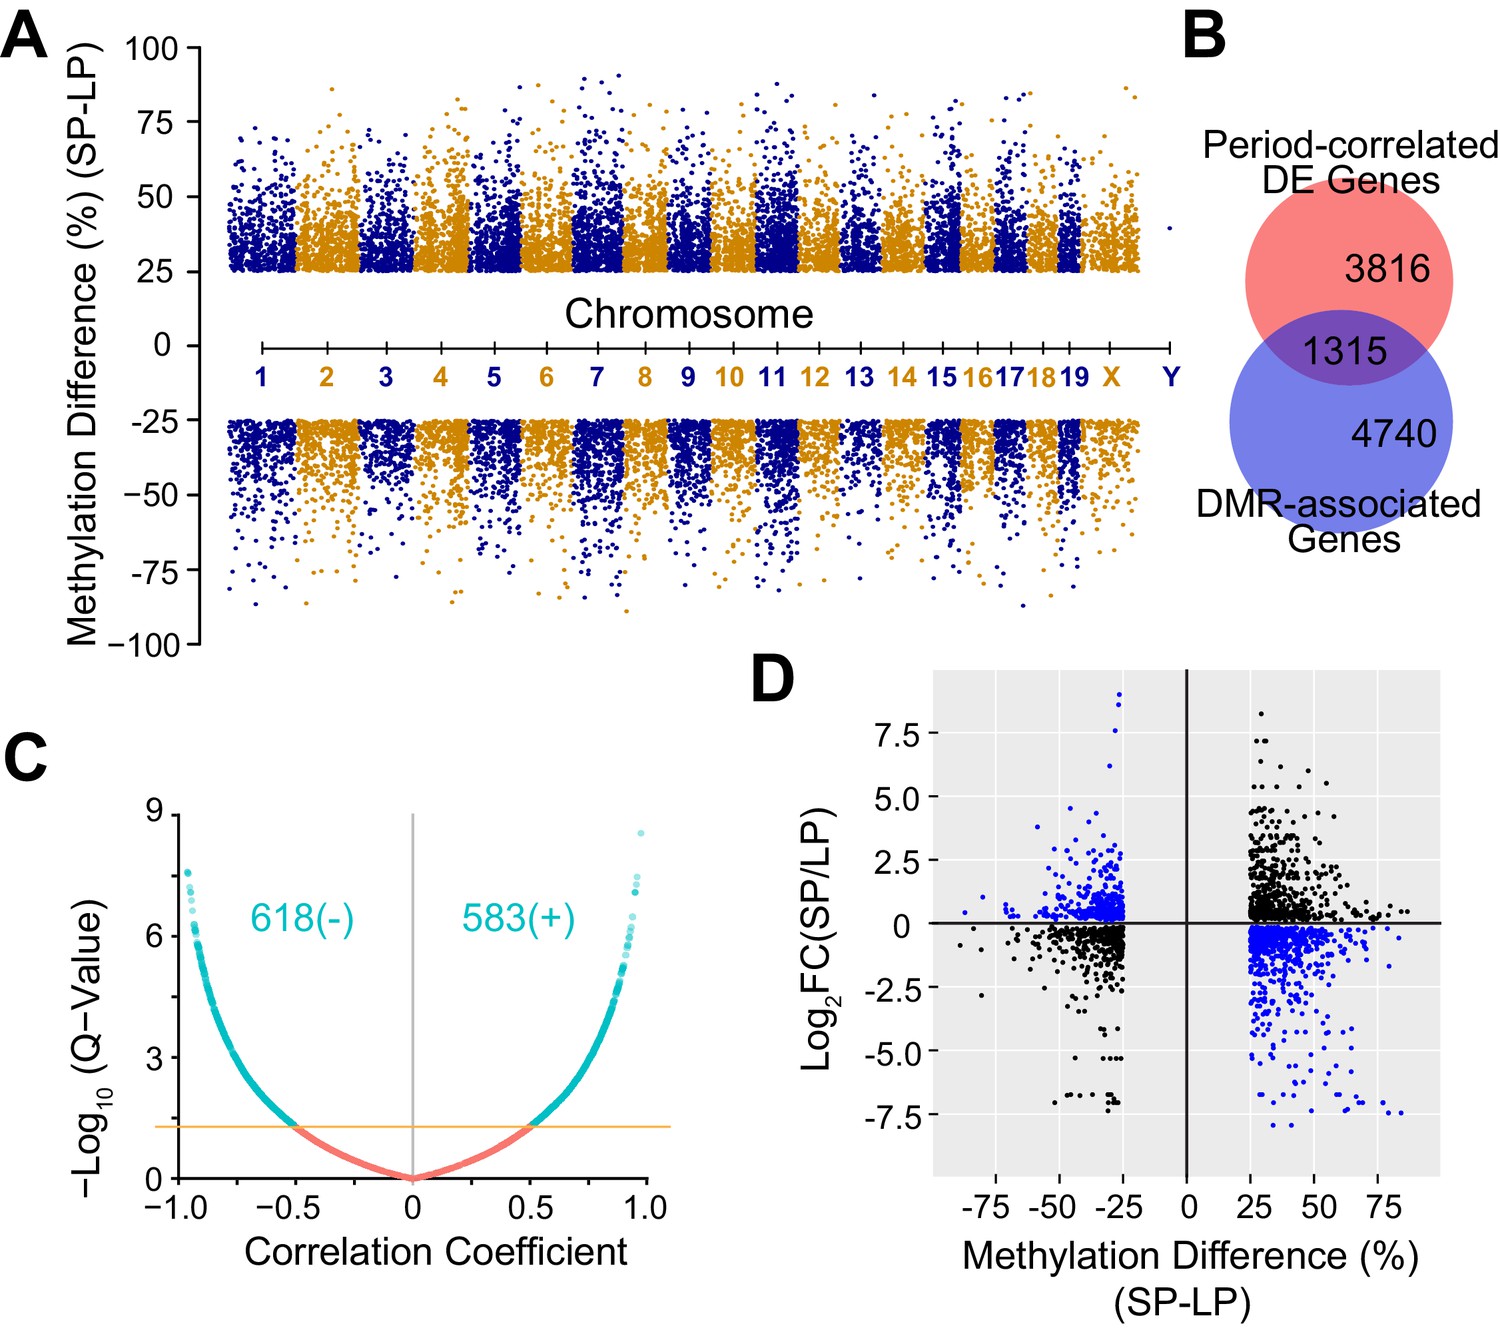
DNA Methylation Landscape Associated with Heterogeneous Circadian Periods.
(A) Manhattan plot showing 16,520 significant DMRs with 1 kb bins. 10,212 DMRs were up-regulated and 6,308 DMRs were down-regulated in the SP group. (B) Area-proportional Venn diagram showing overlap between period-correlated DE genes and DMR-associated genes comparing SP and LP groups. Red indicates 5,131 period-correlated DE genes. Blue indicates 6,055 genes associated with significant DMRs. Overlapping area represents 1,315 period-correlated DE genes associated with significant DMRs. (C) Volcano plot showing correlation coefficients (Pearson’s r) between gene expression and DMR methylation for 1,315 DMR-associated DE genes. X axis indicates Pearson’s r. Yellow line indicates q-value = 0.05. Turquoise indicates all significant correlations, including 618 negative and 583 positive correlations. (D) Quadrant plot showing relationship between gene expression and DNA methylation. There were 1,915 significant DMRs associated with 1,315 period-correlated DE genes. X axis indicates methylation difference of the associated DMRs. Y axis indicates fold change of averaged gene expression. Blue indicates negative correlations. Black indicates positive correlations. See also Figure 5—figure supplement 1 and Figure 5—source data 1.
-
Figure 5—source data 1
DMRs Comparing SP and LP Groups.
- https://cdn.elifesciences.org/articles/54186/elife-54186-fig5-data1-v2.xlsx
Figure 5—figure supplement 1
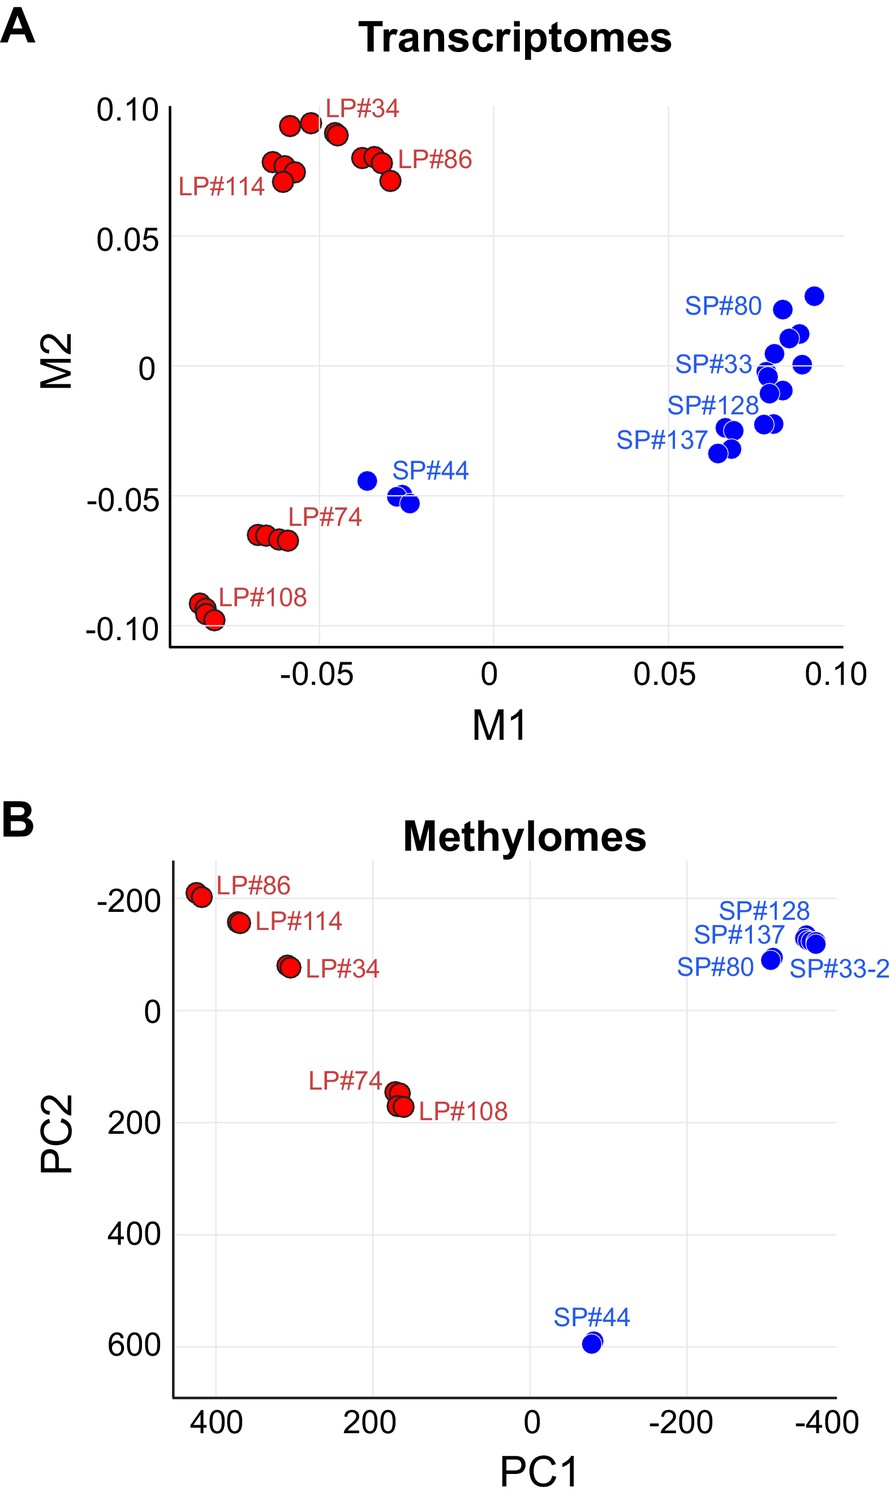
Clustering of Methylomes Resembles Transcriptomes.
(A) MDS plot with Euclidean distance of RNA-seq for 10 clonal cell lines. Blue indicates SP group. Red indicates LP group. (B) PCA plot of RRBS seq for 10 clonal cell lines. Blue indicates SP group. Red indicates LP group.
Figure 6 with 1 supplement
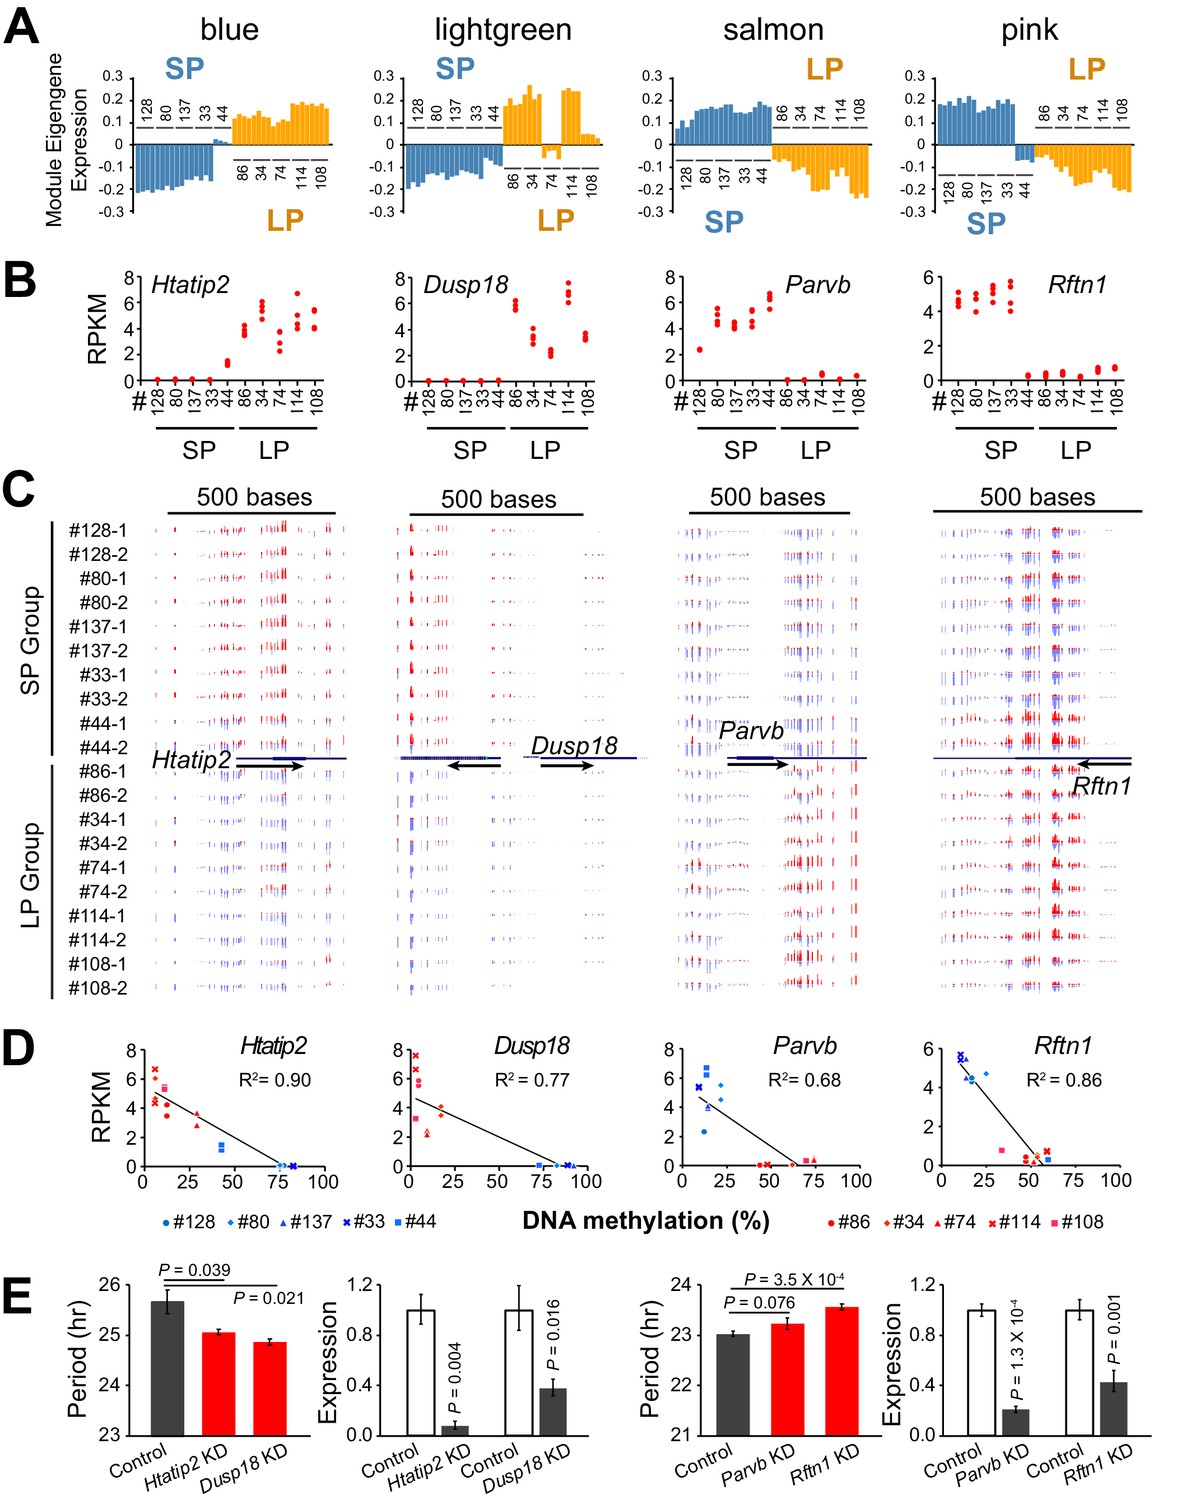
DNA Methylation Regulates Expression of Hub Genes from Period-associated Modules.
(A) Eigengene expression patterns in four top period-associated modules. Blue and lightgreen modules are enriched in positively correlated DE genes with up-regulated gene expression in LP group. Salmon and pink modules are enriched in negatively correlated DE genes with down-regulated gene expression in the LP group. (B) Gene expression plot for hub genes of four modules shown in a): Htatip2, Dusp18, Parvb and Rftn1. Each clonal cell line includes four data points (two time-points, two replicates). (C) UCSC genome browser view of DNA methylation at promoter regions of the four hub genes. Red indicates methylated C. Blue indicates unmethylated C. Arrows indicate the direction of transcription. Track height from left to right: 50,–50; 100,–80; 45,–60; 70,–80. (D) Scatter plot showing correlation between gene expression and DNA methylation at the promoter regions of the four hub genes. X axis indicates average methylation level of the associated DMRs for each clonal cell line. Y axis indicates gene expression level of two replicates at timepoint T1. Trendline and R2 of Pearson correlation coefficient are shown. Blue indicates SP group. Red indicates LP group. DMR loci for each gene are listed as below: Htatip2: chr7:49759001–49760000; Dusp18: chr11:3894001–3896000. Parvb: chr15:84232001–84233000; Rftn1: chr17:50190001–50191000. (E) Knockdown effect of four DMR associated DE genes in different clonal cells. Left: Htatip2 and Dusp18 knockdown in LP clone#114. Right: Parvb and Rftn1 knockdown in SP clone#128. n ≥ 3 for each experiment. Error bar indicates SD. See also Figure 6—figure supplement 1.
Figure 6—figure supplement 1
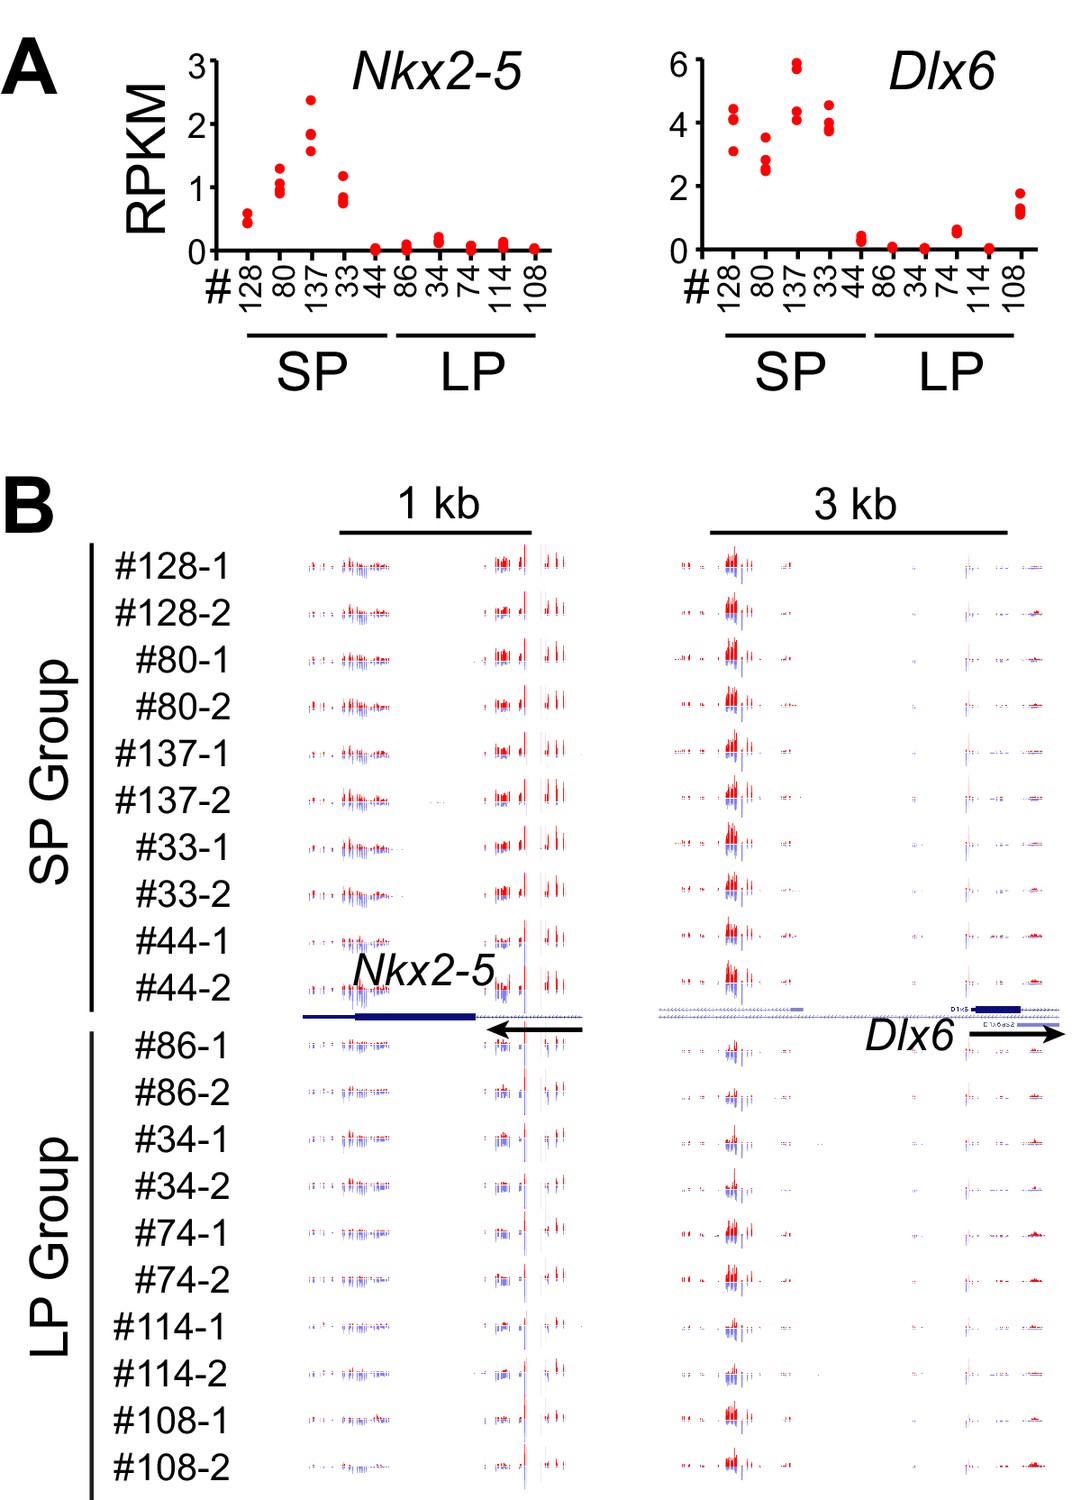
Example Genes Associated with Positively Correlated DMRs.
(A) Gene expression plot for Nkx2-5 and Dlx6. Each clonal cell line includes four data points (two time-points, two replicates). (B) UCSC genome browser view of DNA methylation at their promoter regions. Red indicates methylated C. Blue indicates unmethylated C. Arrows indicate the direction of transcription. Track height from left to right:150,–180; 150,–300.
Figure 7

Deficiency of Different DNMTs Reveal Opposite Effects on Circadian Period.
(A) Effects of knockdown of DNMT1 in parent culture. Left: baseline-subtracted LumiCycle traces of a typical experiment; middle: comparison of average period from ≥3 experiments; right: qPCR results showing knockdown efficiency. Error bar indicates SD. (B) Effects of knockdown of DNMT3A. (C) Effects of knockdown of DNMT1 and DNMT3A in 10 clonal cell lines. Left: comparison of period length from ≥3 experiments. Right: qPCR results showing knockdown efficiency. Error bar indicates SD. (D) Administration of different DNA methyltransferase inhibitors in parent culture altered period length. Left: SGI-1027. Right: zebularine. n ≥ 3 for each experiment. Error bar indicates SD. (E) Administration of different DNA methyltransferase inhibitors in primary mouse embryonic fibroblasts (MEFs) or NIH3T3 cells altered period length. Left: MEF. Right: NIH3T3. n ≥ 3 for each experiment. Error bar indicates SD.
Tables
Table 1
Period of Clonal Cell Lines
| Group | Clone # | Period (hr)* | STDEV | Group | Clone # | Period (hr)* | STDEV |
|---|---|---|---|---|---|---|---|
| SP | #128 | 22.35 | 0.13 | LP | #86 | 25.07 | 0.12 |
| #80 | 22.78 | 0.10 | #34 | 25.60 | 0.50 | ||
| #137 | 23.42 | 0.21 | #74 | 25.80 | 0.50 | ||
| #33 | 23.43 | 0.07 | #114 | 26.43 | 0.15 | ||
| #44 | 23.70 | 0.10 | #108 | 26.90 | 0.14 | ||
| SSP | #33–123 | 22.15 | 0.43 | SLP | #114–65 | 24.74 | 0.20 |
| #33–112 | 22.18 | 0.18 | #114–125 | 24.80 | 0.14 | ||
| #33–3 | 22.20 | 0.21 | #114–62 | 24.81 | 0.21 | ||
| #33–26 | 22.43 | 0.21 | #114–129 | 24.82 | 0.16 | ||
| #33–117 | 22.43 | 0.27 | #114–31 | 24.93 | 0.35 | ||
| #33–141 | 22.44 | 0.38 | #114–57 | 25.19 | 0.13 | ||
| LSP | #33–49 | 23.95 | 0.27 | LLP | #114–96 | 26.69 | 0.68 |
| #33–84 | 24.13 | 0.27 | #114–82 | 27.02 | 0.47 | ||
| #33–22 | 24.16 | 0.13 | #114–41 | 27.16 | 0.45 | ||
| #33–53 | 24.16 | 0.20 | #114–80 | 27.77 | 0.44 | ||
| #33–27 | 24.22 | 0.32 | #114–49 | 27.97 | 0.99 | ||
| #33–51 | 24.68 | 0.13 | #114–91 | 28.00 | 0.66 |
-
* Average of ≥3 experiments.
SP: short period group.
-
LP: long period group.
SSP: shorter period subgroup from short period clone#33.
-
LSP: longer period subgroup from short period clone#33.
SLP: shorter period subgroup from long period clone#114.
-
LLP: longer period subgroup from long period clone#114.
Table 2
Summary of Sequencing Results of Clock Genes
| Gene | DE gene (SP vs LP) | Fold change (LP/SP) | Adjusted P-Value | DE gene (SSP vs LSP) | DE gene (SLP vs LLP) | Coding mutation | DMR (SP vs LP) |
|---|---|---|---|---|---|---|---|
| Clock | Yes | 0.83 | 6.30E-07 | No | No | No | No |
| Bmal1 | No | N/A | N/A | No | No | No | No |
| Per1 | Yes | 1.49 | 4.14E-05 | No | No | No | Yes |
| Per2 | Yes | 1.74 | 0.05 | No | No | No | No |
| Per3 | No | N/A | N/A | No | No | No | No |
| Cry1 | No | N/A | N/A | No | No | No | No |
| Cry2 | No | N/A | N/A | No | No | No | No |
| Dbp | No | N/A | N/A | No | No | No | No |
| Npas2 | No | N/A | N/A | No | No | No | No |
| Fbxl3 | No | N/A | N/A | No | No | No | No |
| Fbxl21 | No | N/A | N/A | No | No | No | No |
| Nr1d1 | No | N/A | N/A | No | No | No | No |
| Nr1d2 | Yes | 0.63 | 1.56E-04 | No | No | No | No |
| Csnk1a1 | Yes | 1.29 | 5.38E-03 | No | No | No | No |
| Csnk1d | No | N/A | N/A | No | No | No | No |
| Csnk1e | Yes | 1.16 | 0.05 | No | No | No | No |
| Csnk2a1 | No | N/A | N/A | No | No | No | No |
| Csnk2a2 | No | N/A | N/A | No | No | No | No |
Key resources table
| Reagent type (species) or resource | Designation | Source or reference | Identifiers | Additional information |
|---|---|---|---|---|
| Cell line (M. musculus, male) | Per2::lucSV EF | (Chen et al., 2012; Yoo et al., 2017) | Immortalized mouse ear fibroblast cells carrying PER2::LUCsv bioluminescence reporter | |
| Cell line (Human) | HEK293T | ATCC | CRL-3216 | |
| Cell line (M. musculus) | Per2::lucSV MEF | This paper | Primary mouse embryonic fibroblast cells carrying PER2::LUCsv bioluminescence reporter | |
| Cell line (M. musculus) | NIH3T3/E2LB | This paper | NIH3T3 cells carrying Per2 E-box (E2)-driven luciferase bioluminescence reporter | |
| Recombinant DNA reagent | pLKO.1-TRC | (Moffat et al., 2006) Addgene | Plasmid #10878 | |
| Commercial assay or kit | RRBS kit | Diagenode | Cat#C02030033 | |
| Other | RNA-seq for all clonal cell lines | This paper | https://www.ncbi.nlm.nih.gov/geo/query/acc.cgi?acc=GSE132663 | |
| Other | RRBS-seq for 10 clonal cell lines | This paper | https://www.ncbi.nlm.nih.gov/geo/query/acc.cgi?acc=GSE132665 | |
| Other | Exome sequencing for clone#33 and #114 | This paper | https://www.ncbi.nlm.nih.gov/sra/PRJNA548837 | |
| Software, algorithm | FastQC | other | https://www.bioinformatics.babraham.ac.uk/projects/fastqc/ | |
| Software, algorithm | TopHat | (Trapnell et al., 2009) | http://ccb.jhu.edu/software/tophat/index.shtml | |
| Software, algorithm | Samtools | (Li et al., 2009) | http://www.htslib.org/ | |
| Software, algorithm | HOMER | (Heinz et al., 2010) | http://homer.ucsd.edu/homer/ | |
| Software, algorithm | DESeq2 | (Love et al., 2014) | https://bioconductor.org/packages/release/bioc/html/DESeq2.html | |
| Software, algorithm | edgeR | (Robinson et al., 2010) | https://bioconductor.org/packages/release/bioc/html/edgeR.html | |
| Software, algorithm | featureCounts | (Liao et al., 2014) | http://bioinf.wehi.edu.au/featureCounts/ | |
| Software, algorithm | WGCNA | (Langfelder and Horvath, 2008) | https://cran.r-project.org/web/packages/WGCNA/index.html | |
| Software, algorithm | Trim Galore | other | https://www.bioinformatics.babraham.ac.uk/projects/trim_galore/ | |
| Software, algorithm | Bismark | (Krueger and Andrews, 2011) | https://www.bioinformatics.babraham.ac.uk/projects/bismark/ | |
| Software, algorithm | methylKit | (Akalin et al., 2012) | https://bioconductor.org/packages/release/bioc/html/methylKit.html | |
| Software, algorithm | STRING | (Szklarczyk et al., 2019) | https://string-db.org/ | |
| Software, algorithm | MeV | other | https://sourceforge. net/projects/mev-tm4/ | |
| Software, algorithm | ggplot2 | (Wickham, 2016) | https://github.com/tidyverse/ggplot2 | |
| Software, algorithm | qqman | (Turner, 2014) | https://github.com/stephenturner/qqman | |
| Software, algorithm | dplyr | (Wickham et al., 2018) | https://dplyr.tidyverse.org | |
| Software, algorithm | Ingenuity Pathway Analysis | Qiagen | https://www.qiagenbioinformatics.com/products/ingenuity-pathway-analysis | |
| Software, algorithm | ImageJ2 (Fiji) with trackmate | NIH | https://imagej.net/ImageJ2 | |
| Software, algorithm | BioVenn | (Hulsen et al., 2008) | http://www.biovenn.nl/ | |
| Software, algorithm | Prism | GraphPad Software | https://www.graphpad.com/scientific-software/prism/ |
Additional files
-
Supplementary file 1
Exome Sequencing of Clone#33 and Clone#114.
- https://cdn.elifesciences.org/articles/54186/elife-54186-supp1-v2.xlsx
-
Supplementary file 2
shRNA Target Sequences.
- https://cdn.elifesciences.org/articles/54186/elife-54186-supp2-v2.xlsx
-
Supplementary file 3
Primer Sequences.
- https://cdn.elifesciences.org/articles/54186/elife-54186-supp3-v2.xlsx
-
Transparent reporting form
- https://cdn.elifesciences.org/articles/54186/elife-54186-transrepform-v2.docx
Download links
A two-part list of links to download the article, or parts of the article, in various formats.
Downloads (link to download the article as PDF)
Open citations (links to open the citations from this article in various online reference manager services)
Cite this article (links to download the citations from this article in formats compatible with various reference manager tools)
Epigenetic inheritance of circadian period in clonal cells
eLife 9:e54186.
https://doi.org/10.7554/eLife.54186


