Competition between kinesin-1 and myosin-V defines Drosophila posterior determination
- Department of Cell and Developmental Biology, Feinberg School of Medicine, Northwestern University, United States
- Cell Biology and Physiology Center, National Heart, Lung and Blood Institute, National Institutes of Health, United States
- Department of Molecular Genetics and Cell Biology, University of Chicago, United States
Figures
Figure 1 with 1 supplement
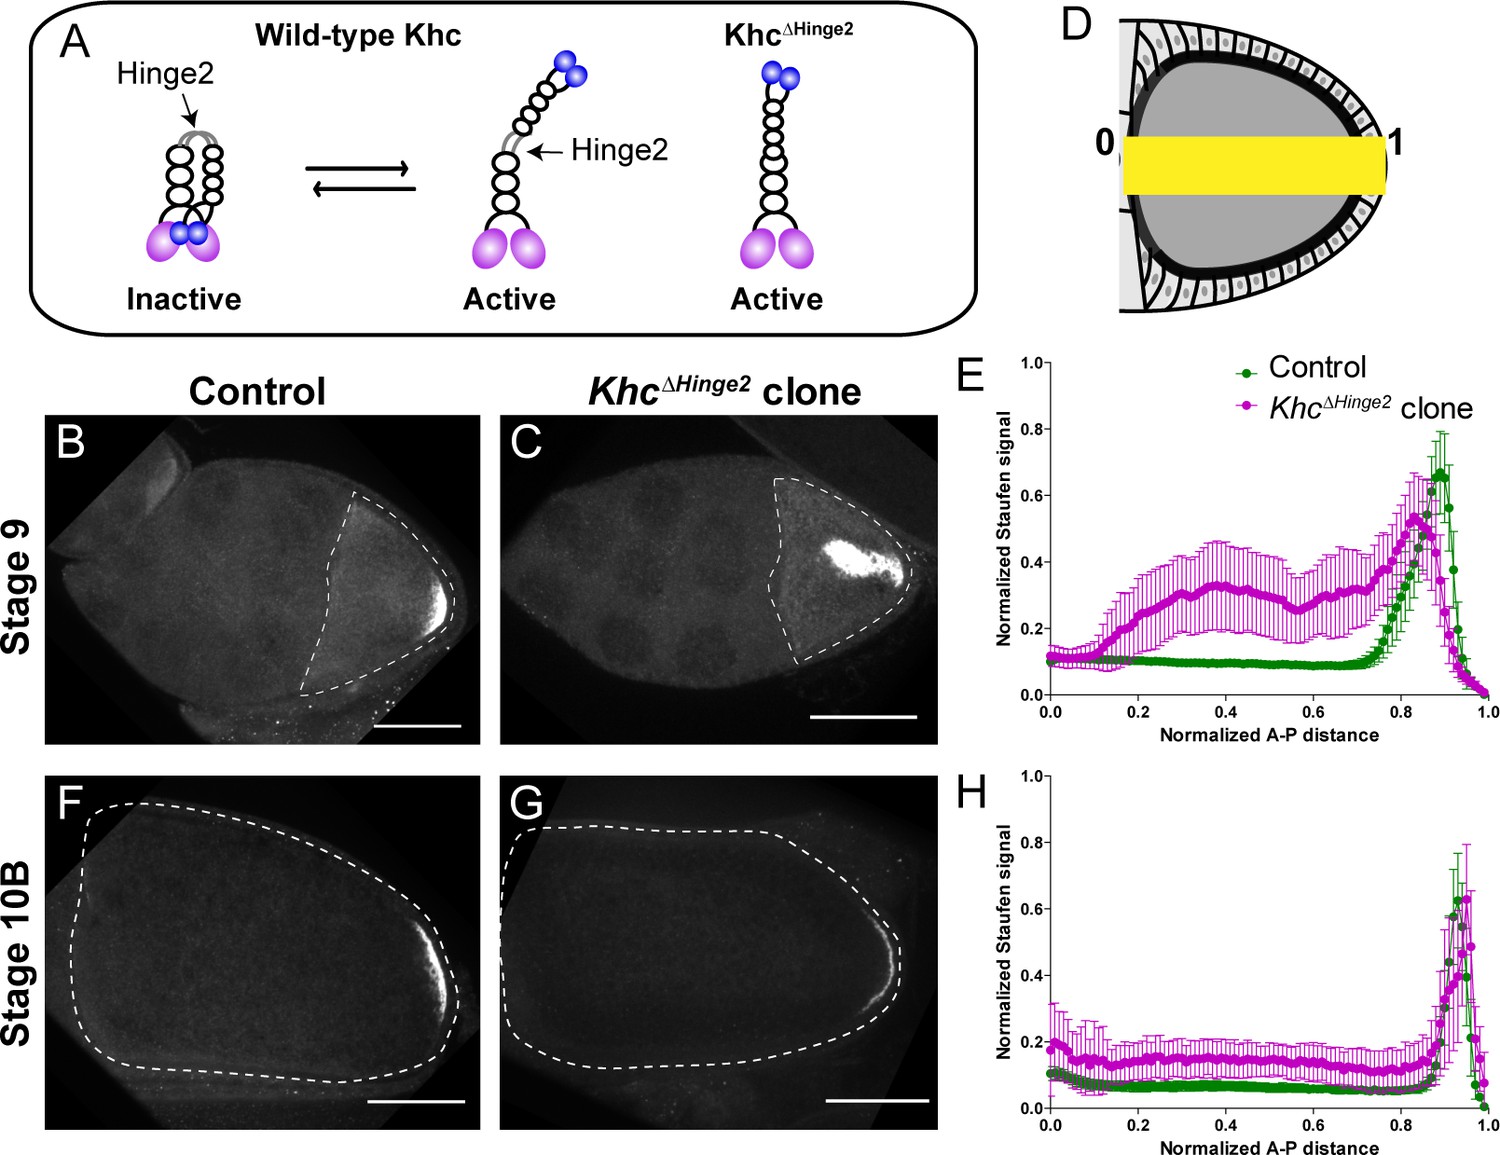
Constitutive activity of kinesin-1 leads to cytoplasmic localization of Staufen.
(A) A cartoon illustration of kinesin-1 heavy chain (KHC) auto-inhibition and constitutive activity of the KhcΔHinge2 mutant. (B–C) Representative images of Staufen staining in a stage 9 control oocyte (B) and a stage 9 KhcΔHinge2 homozygous mutant oocyte (C). (D) An illustration of the measurement of Staufen staining along the A-P axis (See more details in Materials and methods ‘Quantification of fluorescence intensity in the oocytes’). (E) Normalized Staufen staining signal (average ±95% confidence intervals) along A-P axis in stage 9 control oocytes and KhcΔHinge2 homozygous mutant oocytes. Control, N = 38; KhcΔHinge2 clone, N = 25. (F–G) Representative images of Staufen staining in a stage 10B control oocyte (F) and a stage 10B KhcΔHinge2 homozygous mutant oocyte (G). (H) Normalized Staufen staining signal (average ±95% confidence intervals) along A-P axis in stage 10B control oocytes and KhcΔHinge2 homozygous mutant oocytes. Control, N = 27; KhcΔHinge2 clone, N = 14. Scale bars, 50 μm.
Figure 1—figure supplement 1
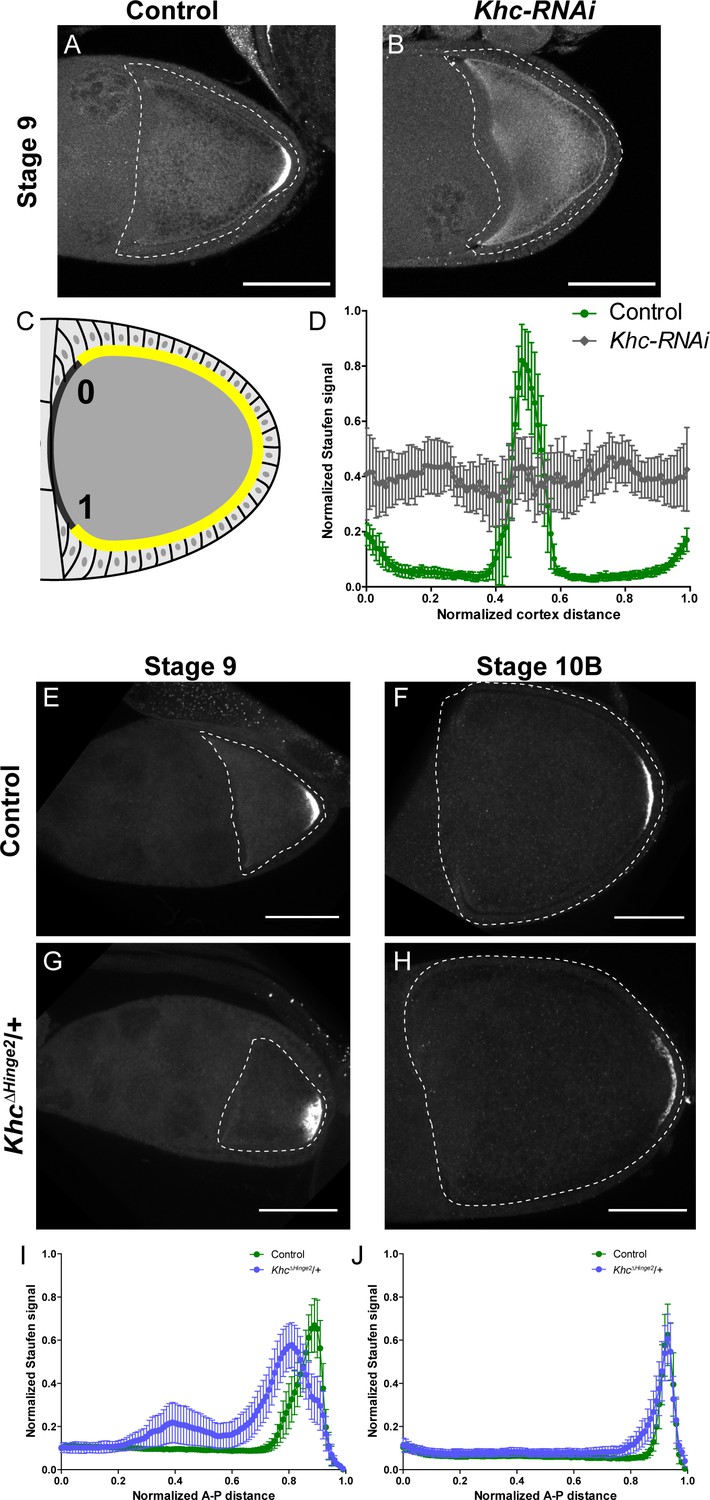
Kinesin-1 activity is essential for correct Staufen localization.
(A–B) Staufen staining in a stage 9 control oocyte and a stage 9 Khc-RNAi oocyte. (C) An illustration of the measurement of Staufen staining along the oocyte cortex (See more details in Materials and methods ‘Quantification of fluorescence intensity in the oocytes’). (D) Normalized Staufen staining signal (average ±95% confidence intervals) along the oocyte cortex in stage 9 control and Khc-RNAi oocytes. Control, N = 14; Khc-RNAi, N = 17. (E–F) Staufen staining in a stage 9 control oocyte (E) and a stage 10B control oocyte (F). (G–H) Staufen staining in a stage 9 KhcΔHinge2 heterozygous oocyte (G) and a stage 10B KhcΔHinge2 heterozygous oocyte (H). (I) Normalized Staufen staining signal (average ±95% confidence intervals) along A-P axis in stage 9 control and KhcΔHinge2/+ oocytes. Control, N = 38 (the same control plot as Figure 1E); KhcΔHinge2/+, N = 39. (J) Normalized Staufen staining signal (average ±95% confidence intervals) along A-P axis in stage 10B control and KhcΔHinge2/+ oocytes. Control, N = 27 (the same control plot as Figure 1H); KhcΔHinge2/+, N = 29. Scale bars, 50 μm.
Figure 2 with 1 supplement
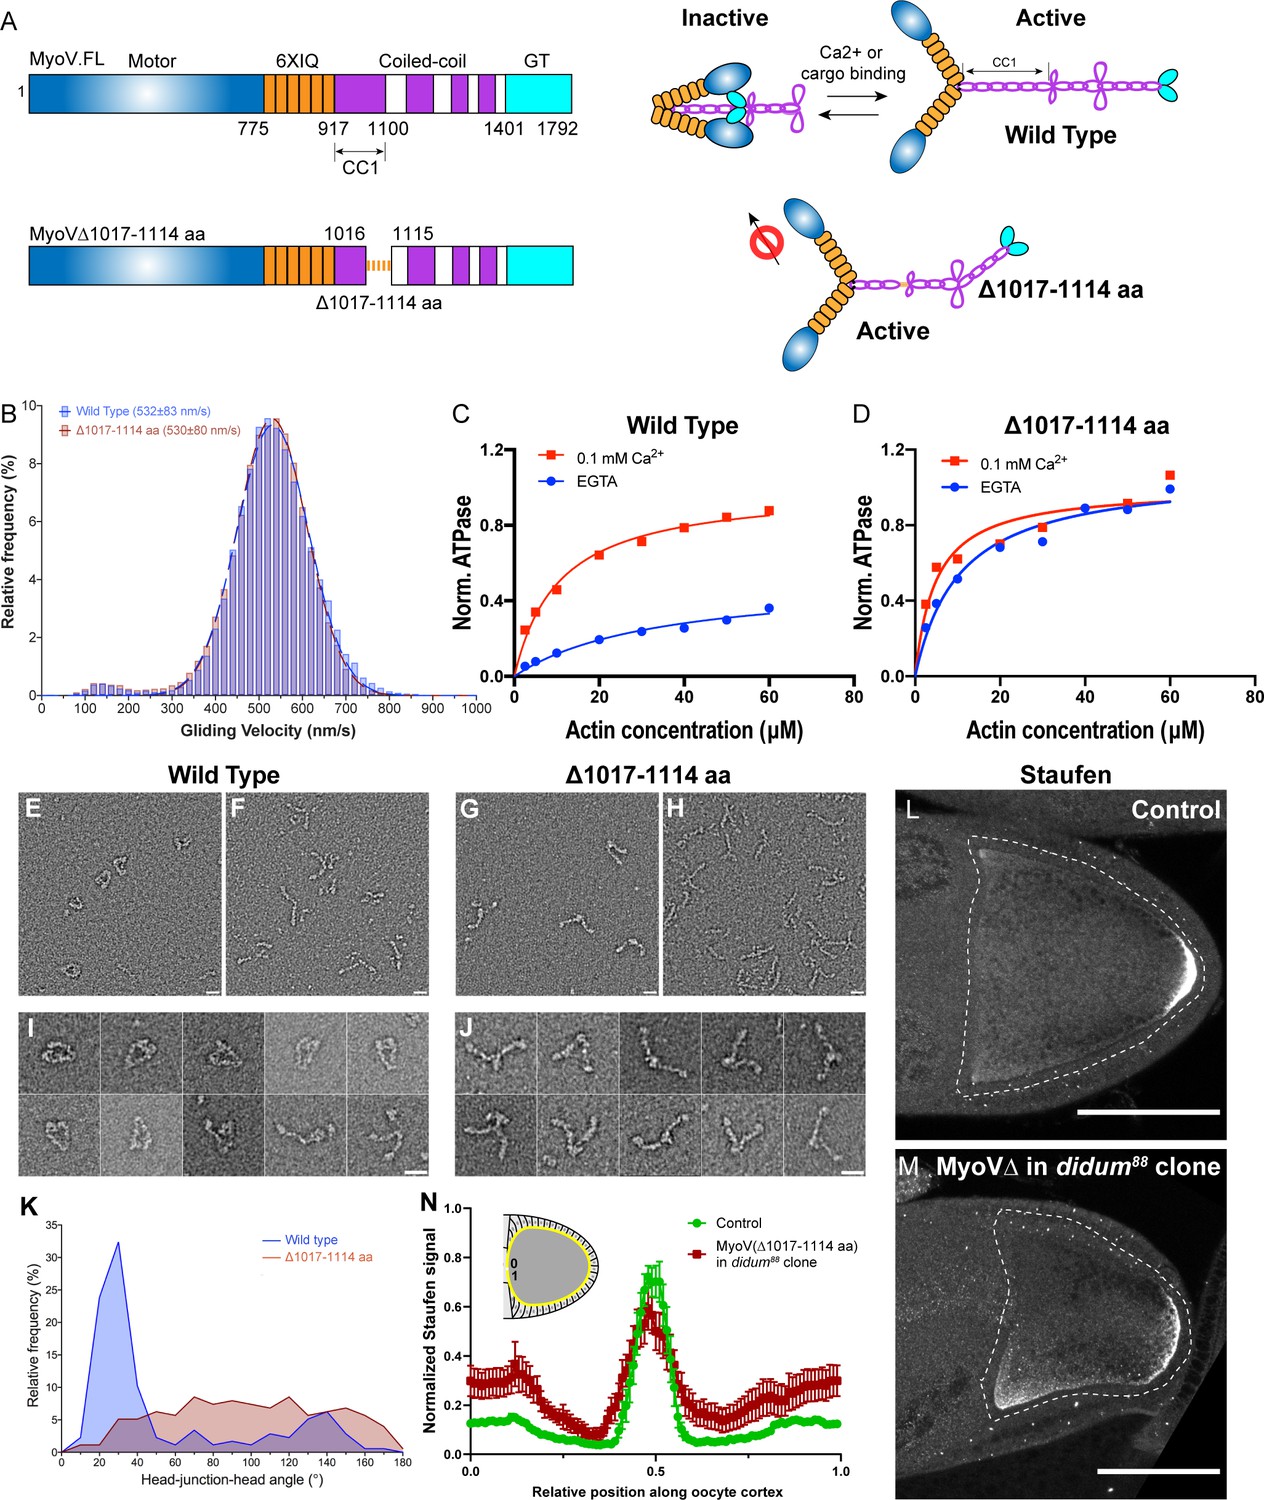
Constitutive activity of myosin-V leads to a broader cortical localization of Staufen.
(A) A schematic illustration of myosin-V domains and auto-inhibition. Globular tail (GT) causes auto-inhibition conformation of myosin-V by interacting with motor domain. This auto-inhibition can be relieved by cargo binding to the GT domain. The inhibitory function of GT domain requires the C-terminal region of the coiled-coil 1 region. (B) Gliding velocities of wild-type myosin-V (532 ± 83 nm/s, Mean ±95% Confidence Intervals) and myosin-V∆1017–1114 aa (530 ± 80 nm/s, Mean ±95% Confidence Intervals). (C–D) Steady-state ATPase activity analysis of wild-type myosin-V (C) and myosin-V∆1017–1114 aa (D). (E–J) Representative electron microscopic images of wild-type myosin-V (E–F, I) and myosin-V∆1017–1114 aa (G–H, J). (E, G) myosin-V in conditions which favor inhibited conformation (50 mM NaCl, 0.1 mM ATP, 0.1% glutaraldehyde); (F, H) myosin-V in high salt conditions (500 mM NaCl). (I–J) Individual examples of the wild-type myosin-V (I) and myosin-V∆1017–1114 aa (J) (50 mM NaCl, 0.1 mM ATP, 0.1% glutaraldehyde). Scale bars, 20 nm. (K) Quantification of the head-junction-head angle of wild-type myosin-V and myosin-V∆1017–1114 aa. (L–M) Staufen localization in control (L) and myosin-V∆1017–1114 aa-expressing didum[88] mutant (M) oocytes. (N) Normalized Staufen staining signal (average ± SEM) along oocyte cortex (illustrated as the yellow line in the inset) in stage 9 control oocytes and myosin-V∆1017–1114 aa-expressing didum[88] mutant oocytes. Control, N = 16; myosin-V∆1017–1114 expression in didum88 mutant clone, N = 14. Scale bars, 50 µm.
Figure 2—figure supplement 1

Myosin-V activity is essential for proper Staufen localization.
(A) Drosophila wild-type myosin-V heavy chain (FL) and myosin-V heavy chain ∆1017–1114 aa (Del) were co-expressed with Drosophila calmodulin and Drosophila cytoplasmic myosin light chain (Mlc-c) in Sf9 insect cells (see more details in Materials and methods ‘Recombinant protein production and purification’). (B) Selected class averages of the inhibited conformation of the wild-type myosin-V (50 mM NaCl, 0.1 mM ATP, 0.1% Glutaraldehyde). Scale bar, 20 nm. (C–F) F-actin and Myosin-V are not concentrated at the posterior pole. (C) An example of phalloidin staining in a control oocyte. (D) Normalized phalloidin staining signal (N = 52) and Staufen staining signal (peaks at the posterior pole, N = 30) (average ±95% confidence intervals) along the oocyte cortex (as shown in Figure 1—figure supplement 1C). (E) An example of GFP-tagged full-length myosin-V driven by maternal αtub-Gal4[V37]. (F) Normalized MyoV.FL-GFP signal (N = 30) and Staufen staining signal (the same data set shown in D) (average ±95% confidence intervals) along the oocyte cortex (as shown in Figure 1—figure supplement 1C). Scale bars, 50 µm.
Figure 3 with 1 supplement
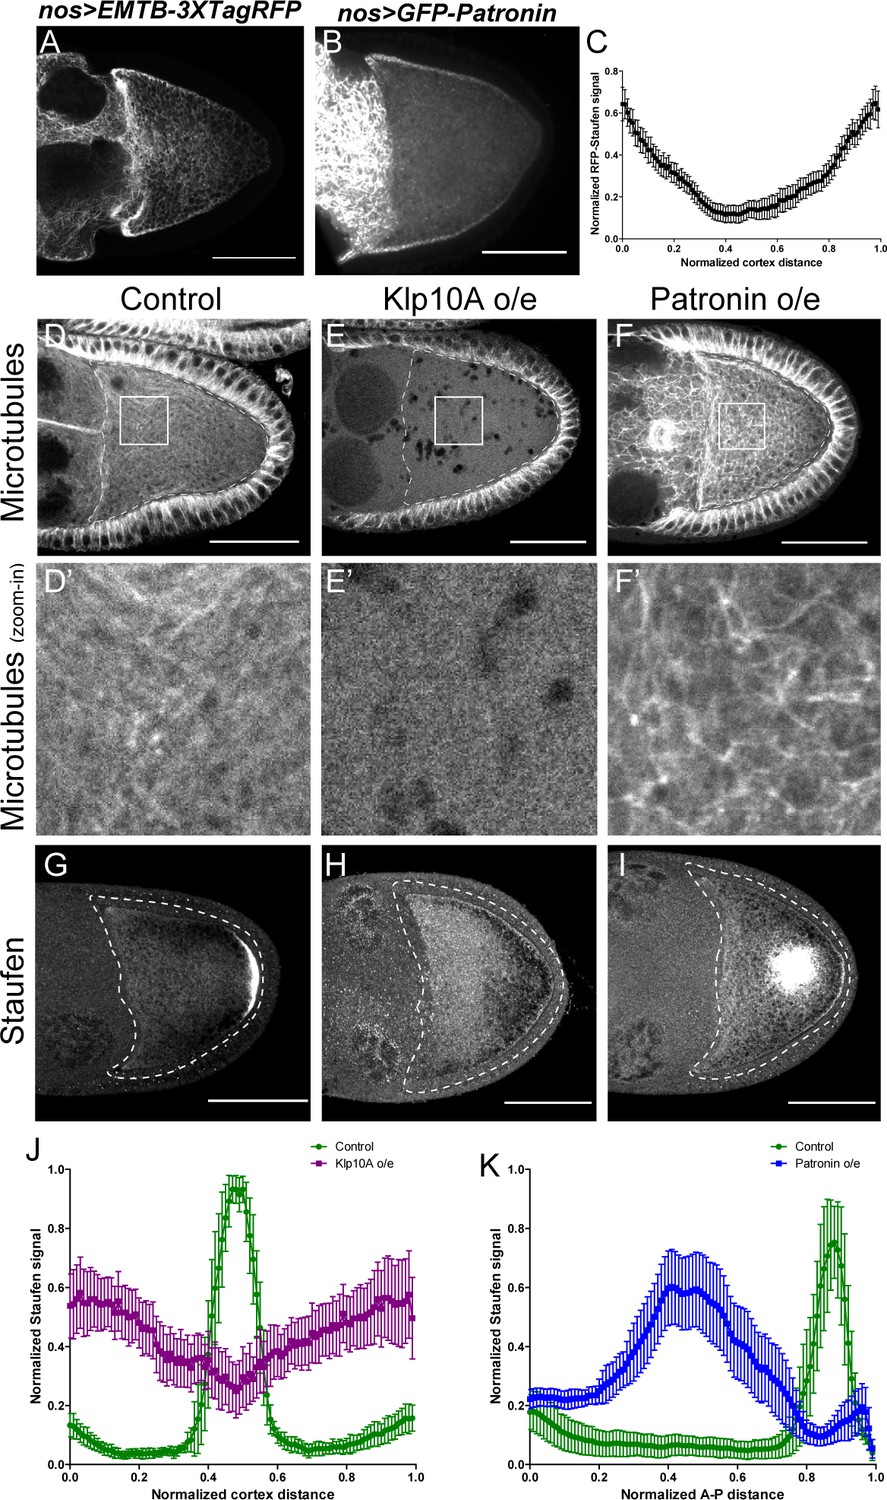
Anterior-posterior microtubule gradient is essential for correct Staufen posterior localization.
(A–B) EMTB-3XTagRFP (A) and GFP-Patronin (B) localization in stage 9 oocytes. (C) Normalized GFP-Patronin signal (average ±95% confidence intervals) along the oocyte cortex in stage 9 oocytes (as shown in Figure 1—figure supplement 1C; see more details in Materials and methods ‘Quantification of fluorescence intensity in the oocytes’; N = 42). (D–F) Representative images of microtubule staining (using 647nm-conjugated nanobody against tubulin after extraction) in stage 9 control (D), Klp10A-overexpressing (E), and Patronin-overexpressing (F) oocytes. (D’–F’) Zoom-ins of the boxed areas in (D–F). (G–I) Representative images of Staufen staining in stage 9 control (G), Klp10A-overexpressing (H), and Patronin-overexpressing (I) oocytes. (J) Normalized Staufen signal (average ±95% confidence intervals) along the oocyte cortex in stage 9 control and Klp10A-overexpressing oocytes (as shown in Figure 1—figure supplement 1C). Control, N = 13; Klp10A overexpression, N = 20. (K) Normalized Staufen signal (average ±95% confidence intervals) along the A-P axis in stage 9 control and Patronin-overexpressing oocytes (as shown in Figure 1D). Control, N = 12; Patronin overexpression, N = 30. Scale bars, 50 μm.
Figure 3—figure supplement 1
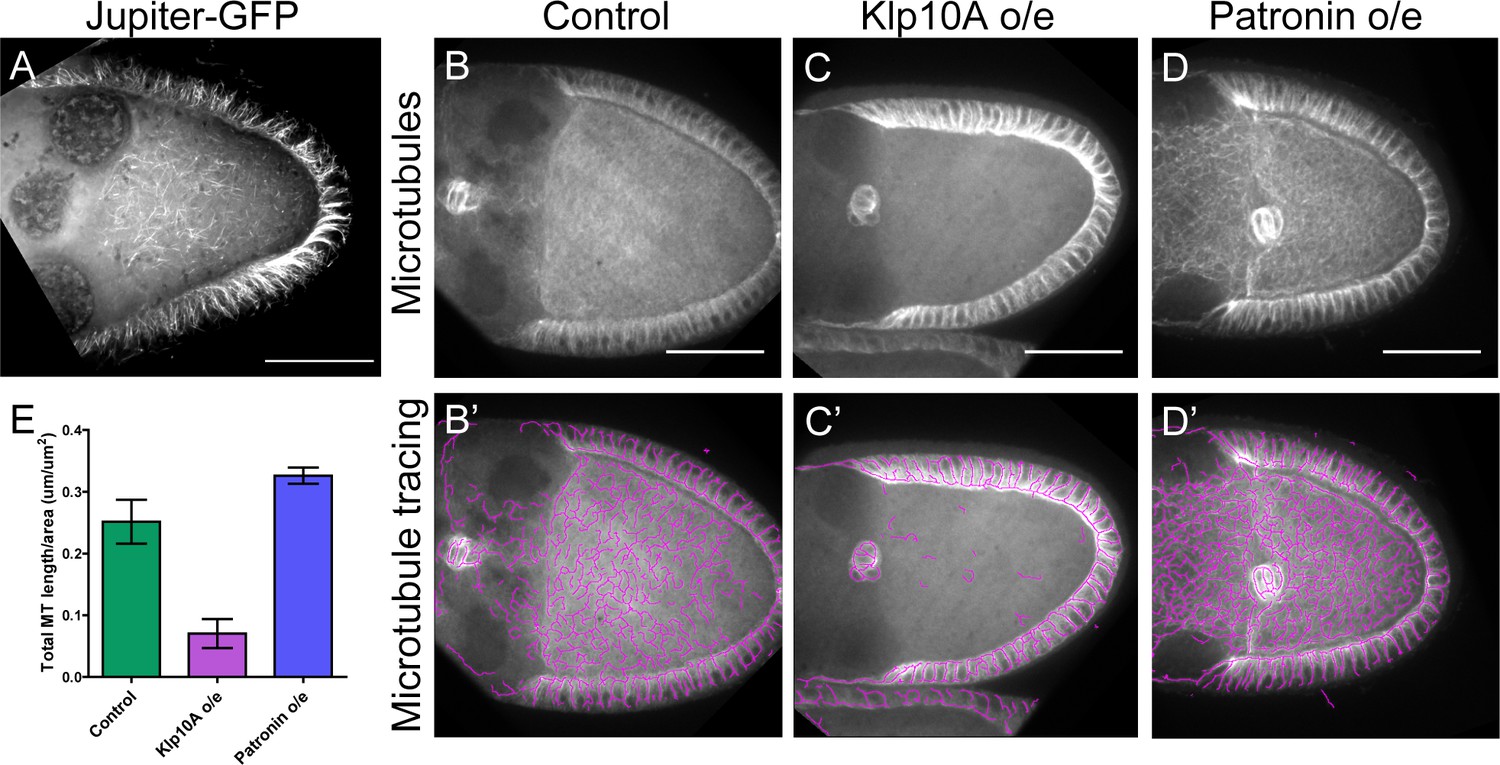
Disruptions of anterior-posterior microtubule gradient using genetic mutants.
(A) Anterior-posterior microtubule gradient is shown by a GFP-tagged endogenous MAP, Jupiter-GFP. (B–D) Representative images of microtubule staining (using 647nm-conjugated nanobody against tubulin after extraction) in stage 9 control (B), Klp10A-overexpressing (C), and Patronin-overexpressing (D) oocytes. (B’–D’) Microtubules were traced in (B–D) and presented as purple lines. To note: microtubules in the somatic follicle cells were not affected as the overexpression was driven by two germline-specific Gal4 lines (mat αtub-Gal4-VP16[V2H]; nos-Gal4-VP16). (E) Quantification of microtubule amount (total microtubule length/area) (average ±95% confidence intervals) in control (N = 12), Klp10A overexpression (N = 11) and Patronin overexpression (N = 15) (see more details in Materials and methods ‘Quantification of microtubule staining in oocytes’).
Figure 4 with 2 supplements
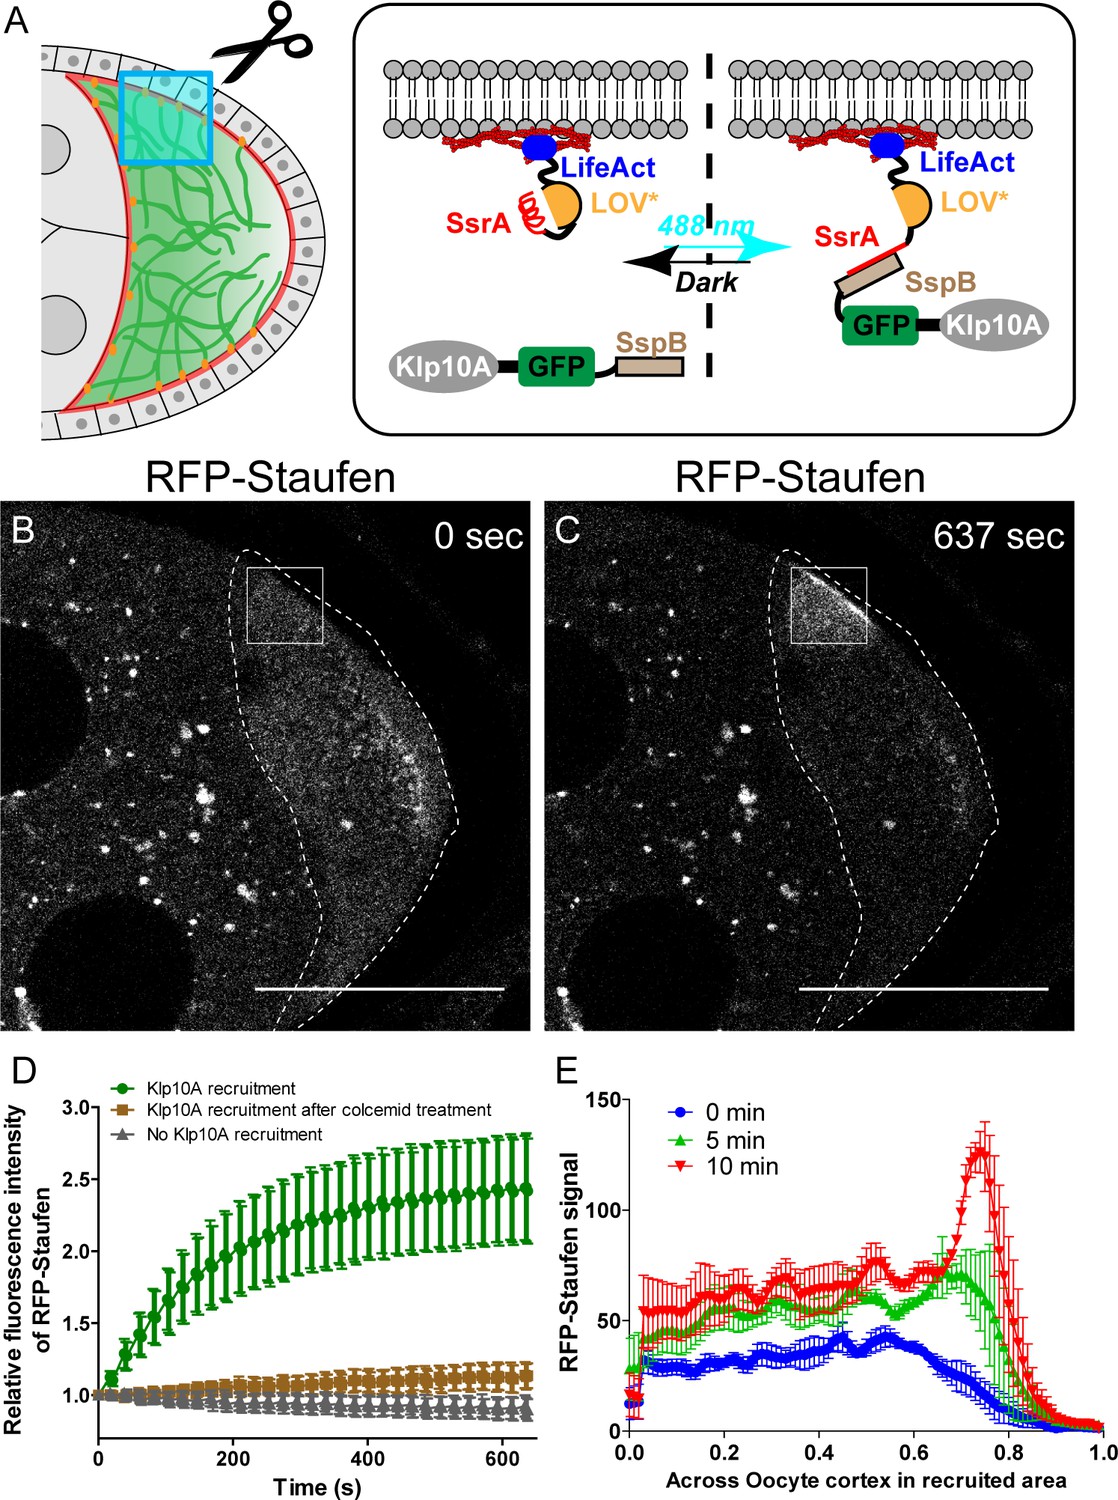
Local depolymerization of microtubules causes ectopic Staufen accumulation on the lateral cortex.
(A) iLID-mediated optogenetic strategy: manipulation of cortical microtubule density through recruiting a microtubule depolymerizer kinesin-13/Klp10A to LifeAct-labeled actin cortex by blue light. (B–C) Representative images of RFP-Staufen before (B) and after (C) local recruitment of Klp10A (square box) in late stage 8 oocytes. Scale bars, 50 μm. (D) Quantification of RFP-Staufen (average ±95% confidence intervals) in the Klp10A-recruited region (see more details in Material and methods ‘Optogenetic recruitment’). The RFP-Staufen fluorescence intensity in the recruitment region was normalized according to the ‘Before’ image. Klp10A recruitment, N = 25; Klp10A recruitment after colcemid treatment, N = 24; No Klp10A recruitment, N = 27. (E) RFP-Staufen signal (average ± SEM) was measured along a line (~6 μm width) across the cortex within the recruited area at 0 min, 5 min and 10 min of recruitment. Distance across the cortex was normalized (N = 4; see more details in ‘Quantification of fluorescence intensity in the oocytes’).
Figure 4—figure supplement 1
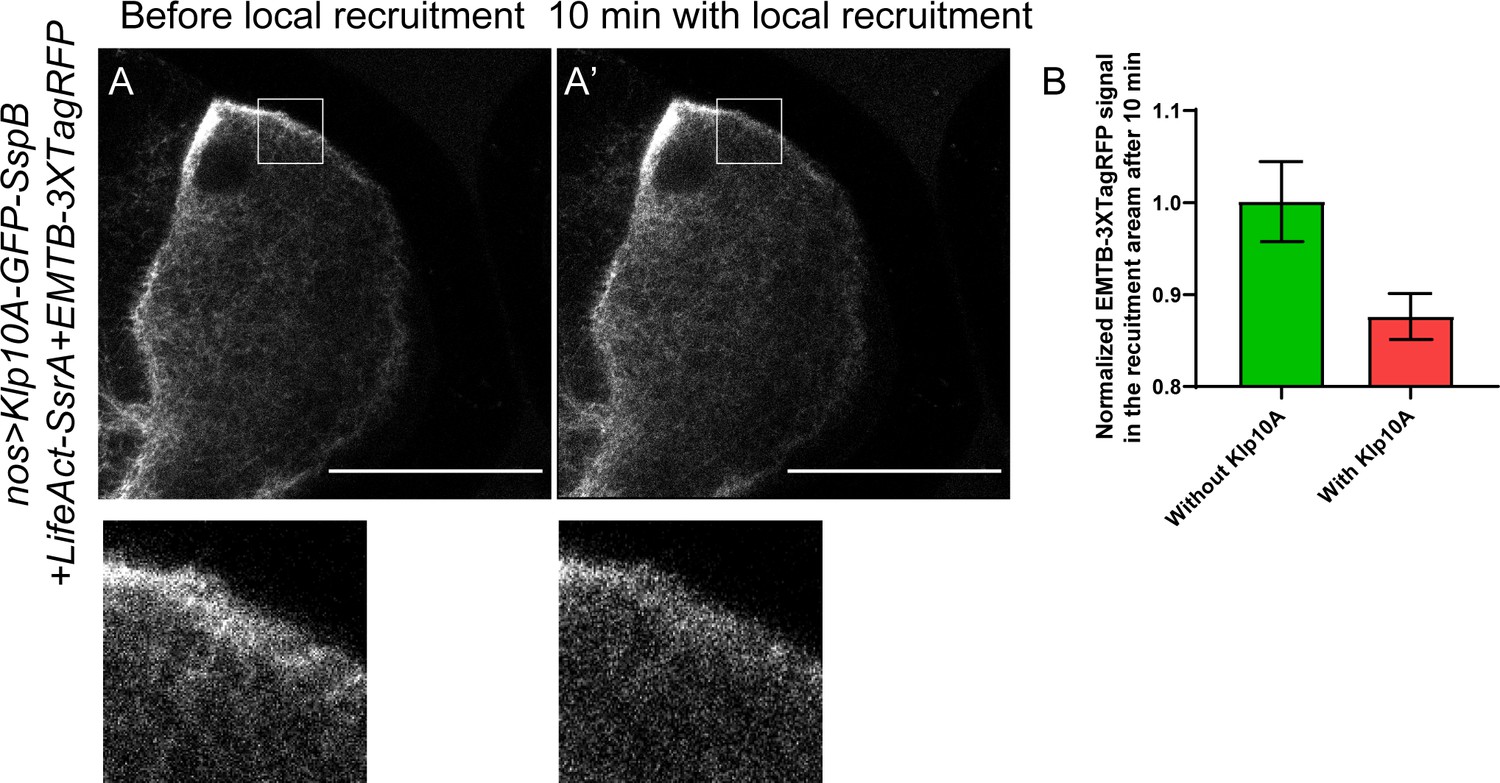
Decrease of cortical microtubule density using optogenetic tools.
(A–B) Local recruitment of Klp10A leads to decrease of EMTB-3XTagRFP-labeled microtubules. EMTB-3XTagRFP signal before (A) and after Klp10A local recruitment (A’) (outlined by the white box). (B) Quantification of EMTB-3XTagRFP fluorescence intensity in the recruiting area (normalized according to the ‘before’ images) with or without Klp10A-SspB after 10 min of recruitment (average ± SEM; with Klp10A, N = 11; without Klp10A, N = 11). Scale bars, 50 µm.
Figure 4—figure supplement 2
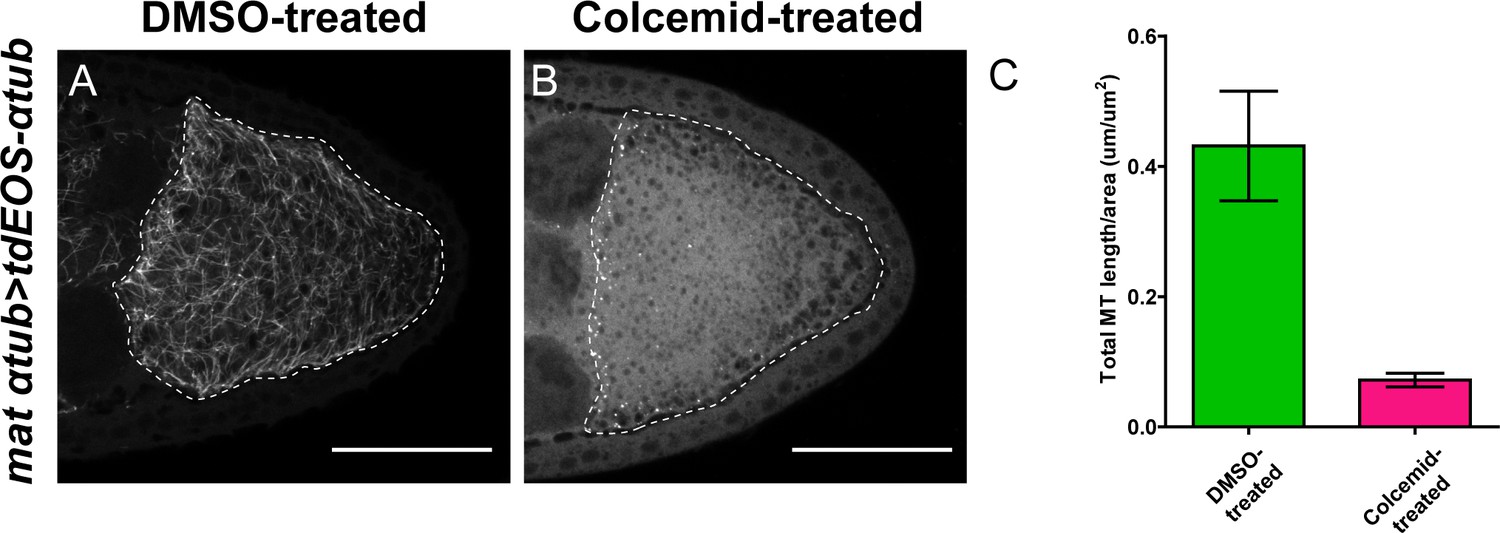
Colcemid treatment causes microtubule depolymerization.
(A–B) Microtubules labeled by tdEOS-tagged α-tubulin (green channel, after extraction, see more details in Materials and methods ‘Labeling of microtubules by tdEOS-αtub in Drosophila oocytes’) in DMSO-treated (A) and colcemid-treated (B) oocytes. DMSO-treated, N = 49; colcemid-treated, N = 19. Scale bars, 50 μm. (C) Quantification of microtubule density (by tdEOS-αtub after extraction) (average ±95% confidence intervals) in DMSO-treated and colcemid-treated oocytes (DMSO = treated, N = 15; colcemid-treated, N = 15) (see more details in Materials and methods ‘Quantification of microtubule staining in oocytes’).
Figure 5
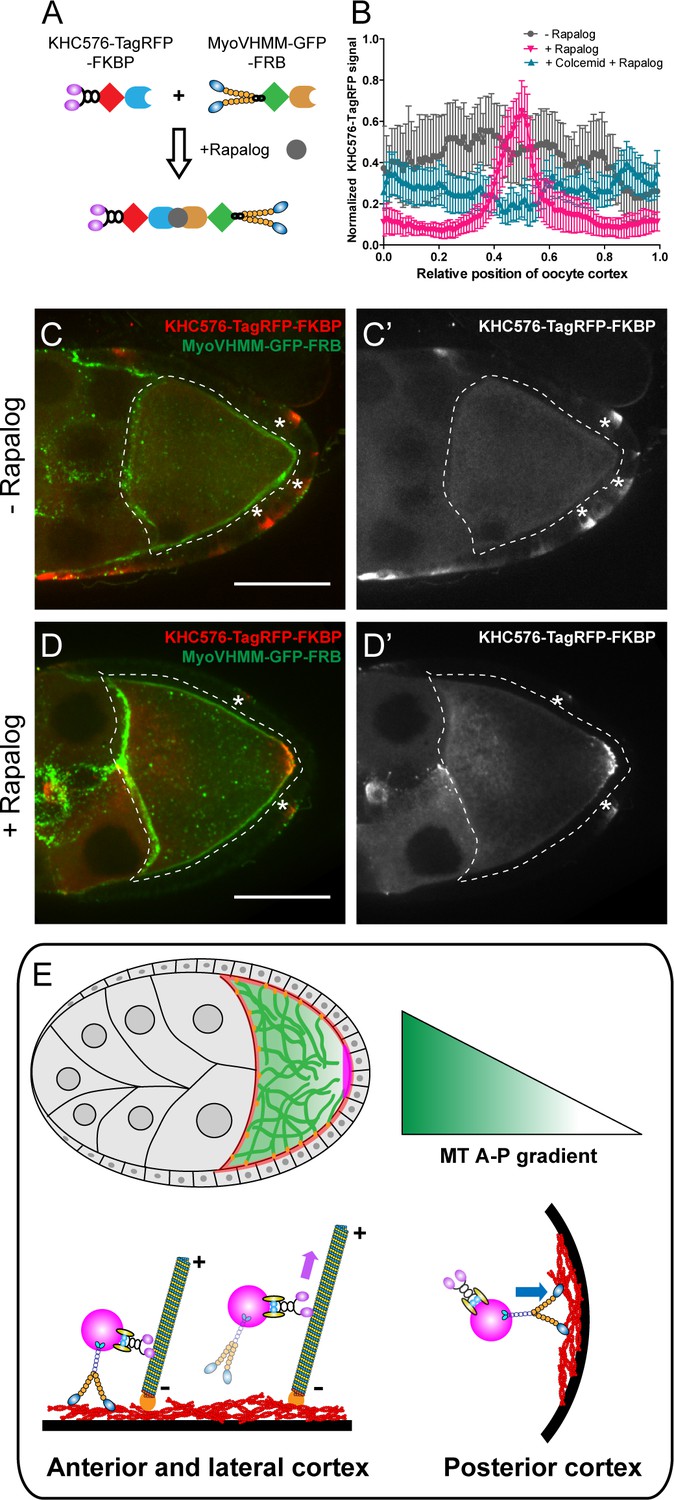
Direct competition between kinesin-1 and myosin-V results in the posterior localization.
(A) A schematic illustration of the rapalog-induced dimerization. Truncated kinesin-1 motor (KHC576, no cargo binding domains) and truncated myosin-V motor (MyoVHMM, no cargo binding domains) are recruited together by rapalog through the FKBP and FRB domains, respectively. (B) Normalized KHC576-TagRFP-FKBP signal (average ±95% confidence intervals) along the oocyte cortex (as shown in Figure 1—figure supplement 1C; see more details in Materials and methods ‘Quantification of fluorescence intensity in the oocytes’). ‘- Rapalog’ (+EtOH control, 1 hr incubation), N = 12; ‘+ Rapalog’ (10 μM a/c heterodimer, 1 hr incubation), N = 18; ‘+Colcemid +Rapalog’ (200 μM Colcemid fed for 13–14 hr; 10 μM a/c heterodimer, 1 hr incubation), N = 25. (C–D’) Representative images of KHC576-TagRFP-FKBP and MyoVHMM-GFP-FRB in stage 9 oocytes without rapalog treatment (C–C’), and with rapalog treatment (D–D’). To note: (1) As MyoVHMM-GFP-FRB was expressed at a higher level than KHC576-TagRFP-FKBP, residual MyoVHMM-GFP-FRB was observed throughout the cortex after rapalog treatment; (2) The vasa-Gal4 (II) line has some leakage in the follicle cells (marked as ‘*”). Within these follicle cells, KHC576-TagRFP was concentrated at the basal level (C’–D’), consistent with the known microtubule polarity in follicle cells (minus-ends binding protein Patronin concentrated at the apical side, while plus-ends EB1 comets grow towards to the basal side Nashchekin et al., 2016). Scale bars, 50 μm. (E) At mid-oogenesis (stage 8–9), posterior accumulation of osk/Staufen is mainly determined by kinesin-myosin competition. High cortical microtubule density at the anterior and lateral cortex allows kinesin-1 to win over myosin-V and exclude osk/Staufen particles away from the cortex, resulting in bulk movement of osk/Staufen particles towards the posterior area due to the slight bias of plus-ends direction (shown as the microtubules slightly tilted towards the posterior pole). Meanwhile, lower density of cortical microtubules at the posterior pole favors myosin-mediated cortical anchorage over kinesin-driven cortical exclusion, resulting in the cortical accumulation of osk/Staufen particles.
Author response image 1
Videos
Video 1
Global recruitment of Klp10A-GFP-SspB to actin cortex by LifeAct-SsrA.
488 nm laser was used to induce the recruitment between SsrA and SspB (shown as the blue box in the upper-right corner). Scale bar, 50 µm.
Video 2
Local recruitment of Klp10A-GFP-SspB causes decrease of microtubule signal.
Microtubules were labeled with EMTB-3XTagRFP. The white box indicates the local recruitment area. The 488 nm light recruitment parameters used in EMTB-3XTagRFP samples were identical to the ones applied to RFP-Staufen samples. Scale bar, 50 µm.
Video 3
Local recruitment of Klp10A-GFP-SspB causes decrease of microtubule signal.
Microtubules were labeled by EMTB-3XTagRFP. Zoom-in area of the local microtubule signal as shown in Video 2 (outlined by the white box).
Video 4
Local recruitment of Klp10A-GFP-SspB to F-actin results in RFP-Staufen accumulation at the local cortex.
The white box indicates the local recruitment area. Scale bar, 10 µm.
Video 5
Accumulation of RFP-Staufen at the cortex by Klp10A recruitment is reversible and repeatable.
The 2nd recruitment (outlined by the white box) was performed in the same sample as Video 4 after resting in complete dark for 30 min. Scale bar, 10 µm.
Video 6
Local recruitment of Klp10A-GFP-SspB results in RFP-Staufen accumulation in multiple sites of an oocyte.
The white boxes indicate the local recruitment areas. Three recruitments were performed sequentially (shown as ‘1’, ‘2’ and ‘3’). Scale bar, 10 µm.
Tables
Key resources table
| Reagent type (species) or resource | Designation | Source or reference | Identifiers | Additional information |
|---|---|---|---|---|
| Gene (Drosophila melanogaster) | Staufen (Stau) | DOI: 10.1083/jcb.201709174 | FBgn0003520; CG5753 | |
| Gene (Drosophila melanogaster) | kinesin heavy chain (khc) | Isabel Palacios lab; DOI: 10.1242/dev.097592 | FBgn0001308; CG7765 | |
| Gene (Drosophila melanogaster) | myosin-V (didum) | DOI: 10.1074/jbc.M505209200 | FBgn0261397; CG2146 | |
| Gene (Drosophila melanogaster) | oskar (osk) | DOI: 10.1083/jcb.201709174 | FBgn0003015; CG10901 | |
| Gene (Drosophila melanogaster) | Klp10A | DGRC cDNA clone, LD29208 | FBgn0030268; CG1453 | |
| Gene (Drosophila melanogaster) | Patronin | Uri Abdu lab (Ben Gurion University) | FBgn0263197; CG33130 | |
| Genetic reagent (Drosophila melanogaster) | khcΔhinge2 | Jill Wildonger lab (University of Wisconsin-Madison); DOI: 10.1083/jcb.201708096 | ||
| Genetic reagent (Drosophila melanogaster) | Khc-RNAi (GL00330, Valium22, attP2) | Bloomington stock center | BDSC: #35409 (GL00330) | |
| Genetic reagent (Drosophila melanogaster) | maternal α-tubulin67C-Gal4-VP16[V2H] | Bloomington stock center | BDSC: #7062 | |
| Genetic reagent (Drosophila melanogaster) | maternal α-tubulin67C-Gal4-VP16[V37] | Bloomington stock center | BDSC: #7063 | |
| Genetic reagent (Drosophila melanogaster) | nos-Gal4-VP16 (III) | Edwin Ferguson lab (University of Chicago); DOI: 10.1016/s0960-9822(98)70091-0 | ||
| Genetic reagent (Drosophila melanogaster) | hs-Flp[12]; Sco/CyO | Bloomington stock center | BDSC: #1929 | |
| Genetic reagent (Drosophila melanogaster) | FRTG13, Ubi-GFP.nls.2R1, Ubi-GFP.2R2 | Bloomington stock center | BDSC: #5826 | |
| Genetic reagent (Drosophila melanogaster) | FRTG13 | Bloomington stock center | BDSC: #1956 | |
| Genetic reagent (Drosophila melanogaster) | UASp-MyoV.FL-GFP (III) | Anne Ephrussi lab (EMBL); DOI: 10.1016/j.cub.2009.04.062 | ||
| Genetic reagent (Drosophila melanogaster) | FRT42B didum[88] | Anne Ephrussi lab (EMBL); DOI: 10.1016/j.cub.2009.04.062 | ||
| Genetic reagent (Drosophila melanogaster) | UASp-MyoV∆1017–1114 aa-FLAG (attP64) | Generated in this study | ||
| Genetic reagent (Drosophila melanogaster) | vasa-Gal4 (III) | Allan Spradling lab (Carnegie Institution for Science);DOI: 10.1534/genetics.118.300874 | ||
| Genetic reagent (Drosophila melanogaster) | UASp-EMTB-3XTagRFP (III) | Generated in this study | ||
| Genetic reagent (Drosophila melanogaster) | UASp-GFP-Patronin (II) | Uri Abdu lab (Ben Gurion University) | ||
| Genetic reagent (Drosophila melanogaster) | UASp-Klp10A-GFP-SspB (II) | Generated in this study | ||
| Genetic reagent (Drosophila melanogaster) | UASp-LifeAct-HA-SsrA (II) | Generated in this study | ||
| Genetic reagent (Drosophila melanogaster) | maternal α-tubulin67-RFP-Staufen (III) | Daniel St Johnston lab (University of Cambridge); DOI: 10.1083/jcb.201103160 | ||
| Genetic reagent (Drosophila melanogaster) | vasa-Gal4 (II) | Yukiko Yamashita lab (University of Michigan) | ||
| Genetic reagent (Drosophila melanogaster) | UASp-KHC576-TagRFP-FKBP (III) | Generated in this study | ||
| Genetic reagent (Drosophila melanogaster) | UASp-MyoVHMM-GFP-FRB (II) | Generated in this study | ||
| Genetic reagent (Drosophila melanogaster) | Jupiter-GFP | Yale GFP Protein Trap Database (ZCL2183); DOI: 10.1073/pnas.261408198 | ||
| Genetic reagent (Drosophila melanogaster) | UASp-tdEOS2-alpha-tubulin84B (II) | DOI: 10.1016/j.cub.2013.04.050 | BDSC: #51313 | |
| Cell line (Spodoptera frugiperda) | Sf9 cells | Invitrogen(Thermo fisher); DOI: 10.1074/jbc.M113.499848; DOI: 10.7554/eLife.32871 | Maintained in J. Sellers lab; used for recombinant baculovirus expression | |
| Antibody | Mouse anti-Drosophila Staufen antibody | Chris Q. Doe lab (University of Oregon); DOI: 10.1073/pnas.1522424113; DOI: 10.1083/jcb.201709174 | IF (1:50) | |
| Antibody | Fluorescein (FITC) AffiniPure Goat Anti-Mouse IgG (H+L) | Jackson ImmunoResearch | Cat# 115-095-062 | IF (1:100) |
| Antibody | Rhodamine (TRITC)-AffiniPure Goat Anti-Mouse IgG (H+L) | Jackson ImmunoResearch | Cat# 115-025-003 | IF (1:100) |
| Antibody | 647-conjugated anti-tubulin nanobody (llamas/E. coli) | Helge Ewers lab (Freie Universität Berlin); DOI: 10.1038/ncomms8933 | IF (1:50) | |
| Chemical compound, drug | Rhodamine-labeled phalloidin | Thermo Fisher Scientific | Cat # R415 | IF (1:5000) |
| Chemical compound, drug | Colcemid | Cayman Chemical | Item No. 15364 | 200 μM |
| Chemical compound, drug | Rapalog (A/C Heterodimerizer) | Clontech/Takara | Cat# 635055 | 10 μM |
| Software, algorithm | A custom MatLab program that normalized the distance and fluorescent signal in the plot profiles | David Kirchenbüechler (CAM, Northwestern University); DOI: 10.1083/jcb.201709174 |
Additional files
Download links
A two-part list of links to download the article, or parts of the article, in various formats.
Downloads (link to download the article as PDF)
Open citations (links to open the citations from this article in various online reference manager services)
Cite this article (links to download the citations from this article in formats compatible with various reference manager tools)
Competition between kinesin-1 and myosin-V defines Drosophila posterior determination
eLife 9:e54216.
https://doi.org/10.7554/eLife.54216


