Distinct spatiotemporal mechanisms underlie extra-classical receptive field modulation in macaque V1 microcircuits
- Center for Neural Science, New York University, United States
- Dominick Purpura Department of Neuroscience, Albert Einstein College of Medicine, United States
- Department of Brain and Cognitive Sciences, McGovern Institute for Brain Research, Massachusetts Institute of Technology, United States
Figures
Figure 1
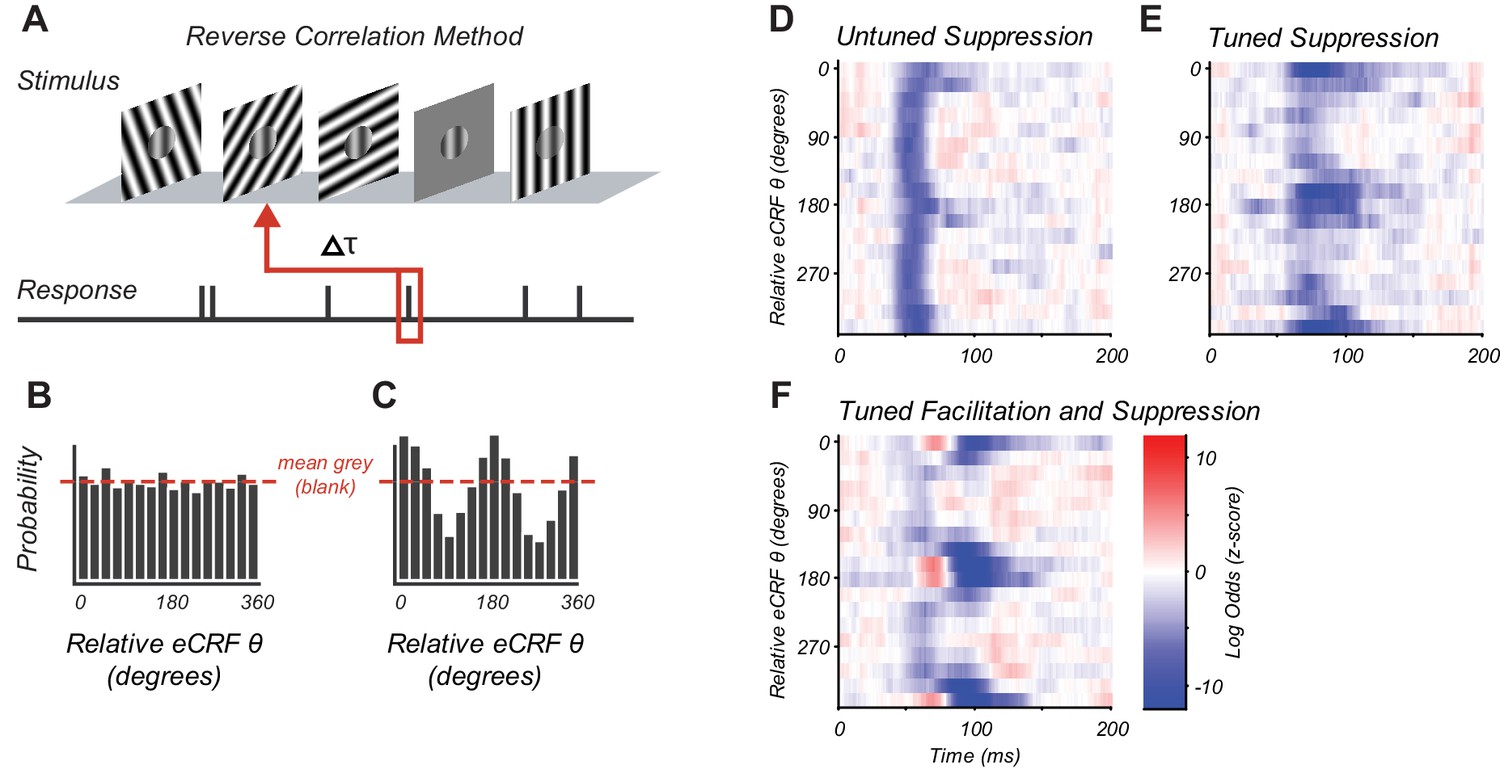
Reverse correlation approach and example eCRF dynamics.
(A) Orientations were briefly and randomly presented in the eCRF alongside optimal CRF stimulation. The probability of an eCRF stimulus prior to a spike was calculated for each delay (τ); blank eCRF stimuli were included as controls. (B) A hypothetical probability distribution for τ = 0 as a function of eCRF orientation (relative to CRF preference). The red dashed line shows the probability associated with the mean grey (blank) stimulus and no modulatory effect. (C) Same as panel (B) but for a delay τ where there is a strong facilitation at the preferred orientation (0, 180 deg) and suppression at the orthogonal orientation (90, 270 deg). (D–F) False color maps showing the log odds ratio (of the probability of each eCRF stimulus compared to blank) over time. Red indicates facilitation and blue suppression. (D) An example neuron showing strong suppression at all orientations (untuned) beginning at around 50 ms. (E) An example neuron showing strong suppressive modulation at its preferred orientation (tuned) around 75–100 ms. (F) An example neuron showing both early tuned collinear facilitation (red at ~60 ms) followed by delayed tuned suppression (blue at 90–140 ms).
-
Figure 1—source data 1
Source data for Figure 1.
- https://cdn.elifesciences.org/articles/54264/elife-54264-fig1-data1-v1.mat
Figure 2
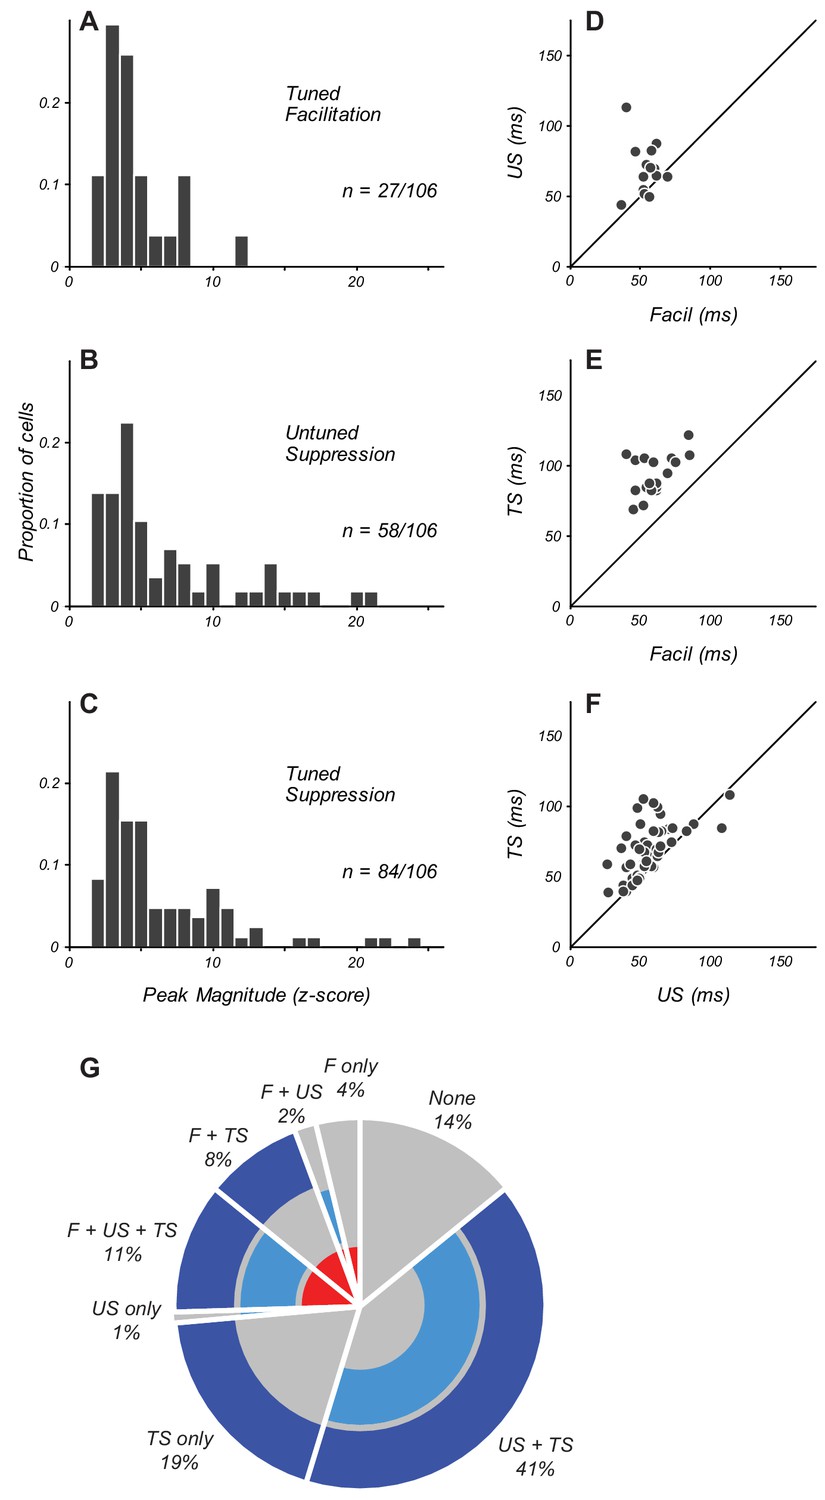
Magnitude and timing of eCRF components.
(A–C) The distribution of peak modulation strength in neurons with significant eCRF components of tuned facilitation (A), untuned suppression (B), and tuned suppression (C). Neurons with z-scored magnitudes > 2 are included. (D) Comparison in individual neurons of the peak times of facilitation and untuned suppression (US). Diagonal indicates unity line. (E) Timing of facilitation and tuned suppression (TS). (F) Timing of untuned and tuned suppression. (G) Percentage of neurons in the population exhibiting specific combinations of significant eCRF components. Facilitation (labeled F) is indicated by the inner red ring. Untuned and tuned suppression indicated by middle and outer blue rings (US and TS, respectively). The absence of significant eCRF modulation is shown in grey.
-
Figure 2—source data 1
Source data for Figure 2.
- https://cdn.elifesciences.org/articles/54264/elife-54264-fig2-data1-v1.mat
Figure 3 with 1 supplement
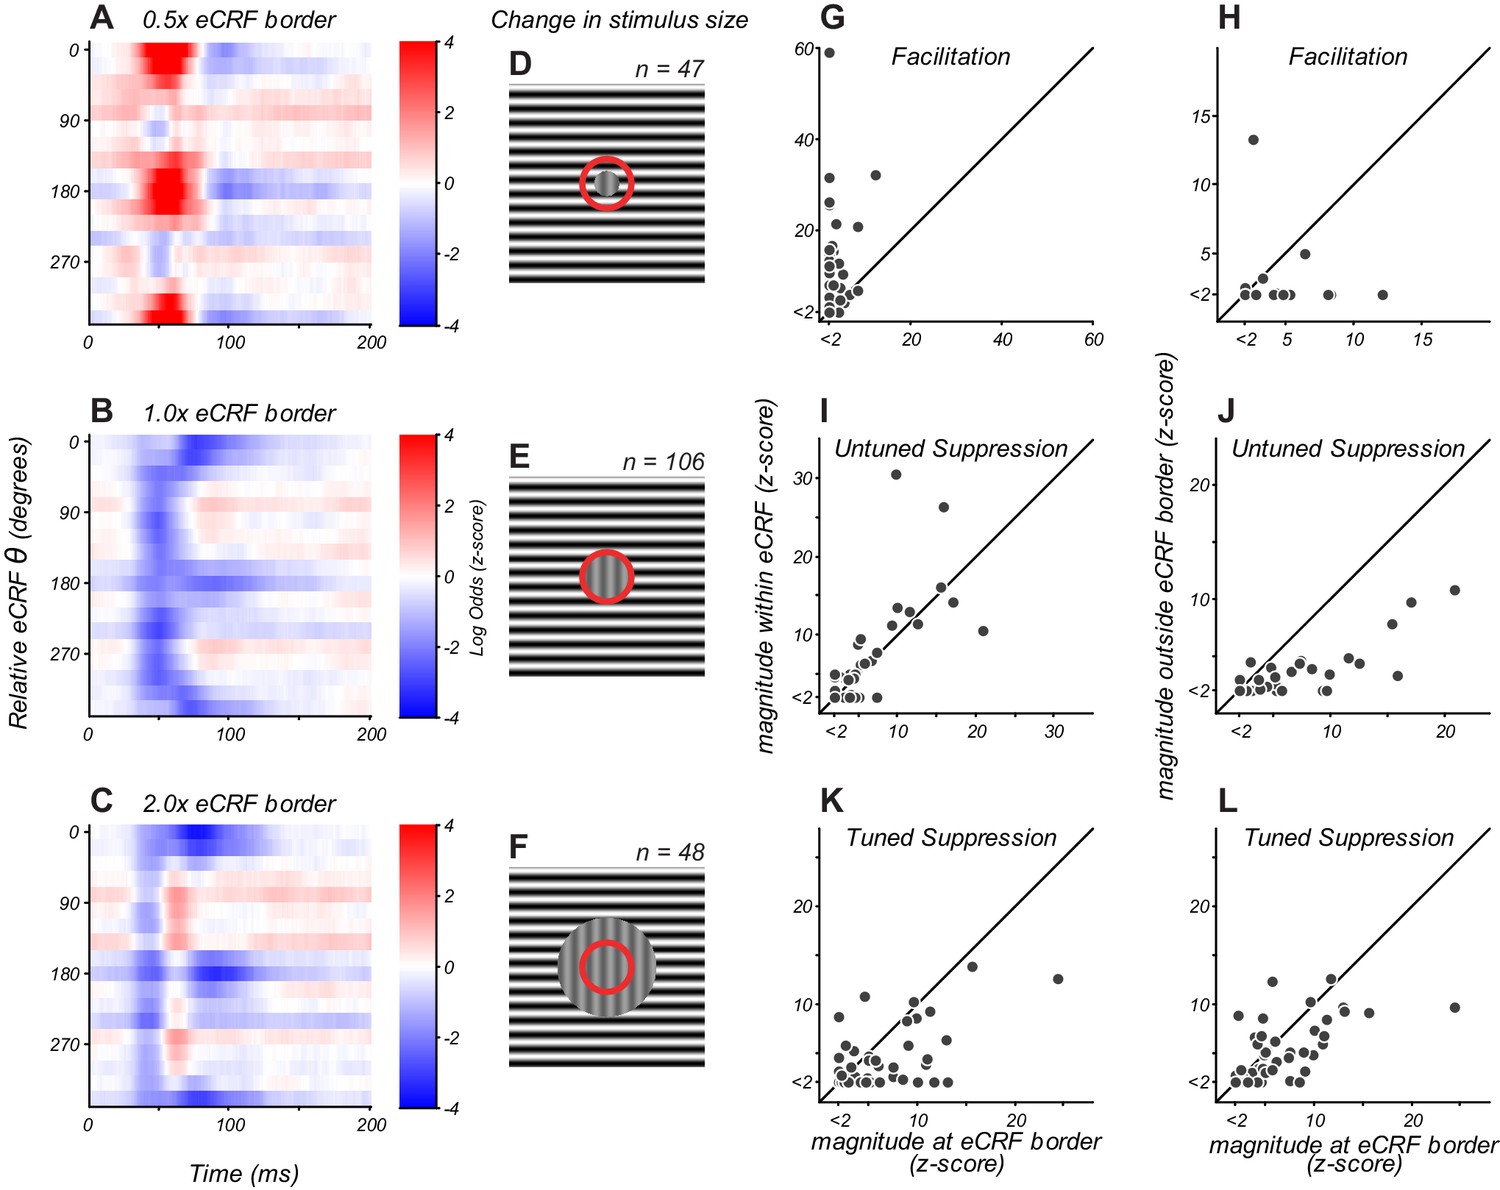
eCRF dynamics change with spatial configuration.
(A–C) eCRF modulation over time as a function of relative eCRF orientation for three spatial configurations, averaged over neurons. The location of the inner diameter of the surround stimulus is indicated at the top of each map. The color scales indicate modulation (red, facilitation; blue, suppression). (D–F) Spatial configurations associated with the responses in panels (A–C). The red circle denotes the border between the CRF and eCRF. Vertical grating indicates stimulus driving the CRF. Horizontal grating indicates where the dynamic eCRF stimulus was shown. (G–L) Change in the magnitude of modulation with spatial configuration, for eCRF components of facilitation (G ,H), untuned suppression (I, J), and tuned suppression (K, L).
-
Figure 3—source data 1
Source data for Figure 3.
- https://cdn.elifesciences.org/articles/54264/elife-54264-fig3-data1-v1.mat
Figure 3—figure supplement 1

Time course of facilitation and suppression at different spatial phases of the eCRF stimulus.
Response dynamics for eCRF stimuli matched in orientation to the CRF grating were split into those that were in-phase and anti-phase with the central grating, and averaged across neurons. (A) At the smallest spatial extent (0.5 x eCRF), which evokes early response facilitation, simple cells showed an increased response to in-phase eCRF stimuli (in-phase responses shown in black, anti-phase in red), presumably because of added integration within the CRF. (B) At the same scale, complex cells showed no such phase dependence. (C, D) At the large 1 x eCRF border scale, simple cells showed a slight phase dependence, whereas complex cells showed none. Suppression strength was only moderate, as the result in part of averaging over neurons with different peak times of suppression. (E, F) Traces at 1 x eCRF scale as in panels (C, D) but aligned to the time of peak suppression in individual neurons before averaging. It is clear that there is no phase-dependent suppression. (G, H) Traces at 2 x eCRF scale, aligned to the time of peak suppression. Suppression at greater extents also shows no phase-dependence.
-
Figure 3—figure supplement 1—source data 1
Source data for Figure 3—figure supplement 1.
- https://cdn.elifesciences.org/articles/54264/elife-54264-fig3-figsupp1-data1-v1.mat
Figure 4 with 1 supplement
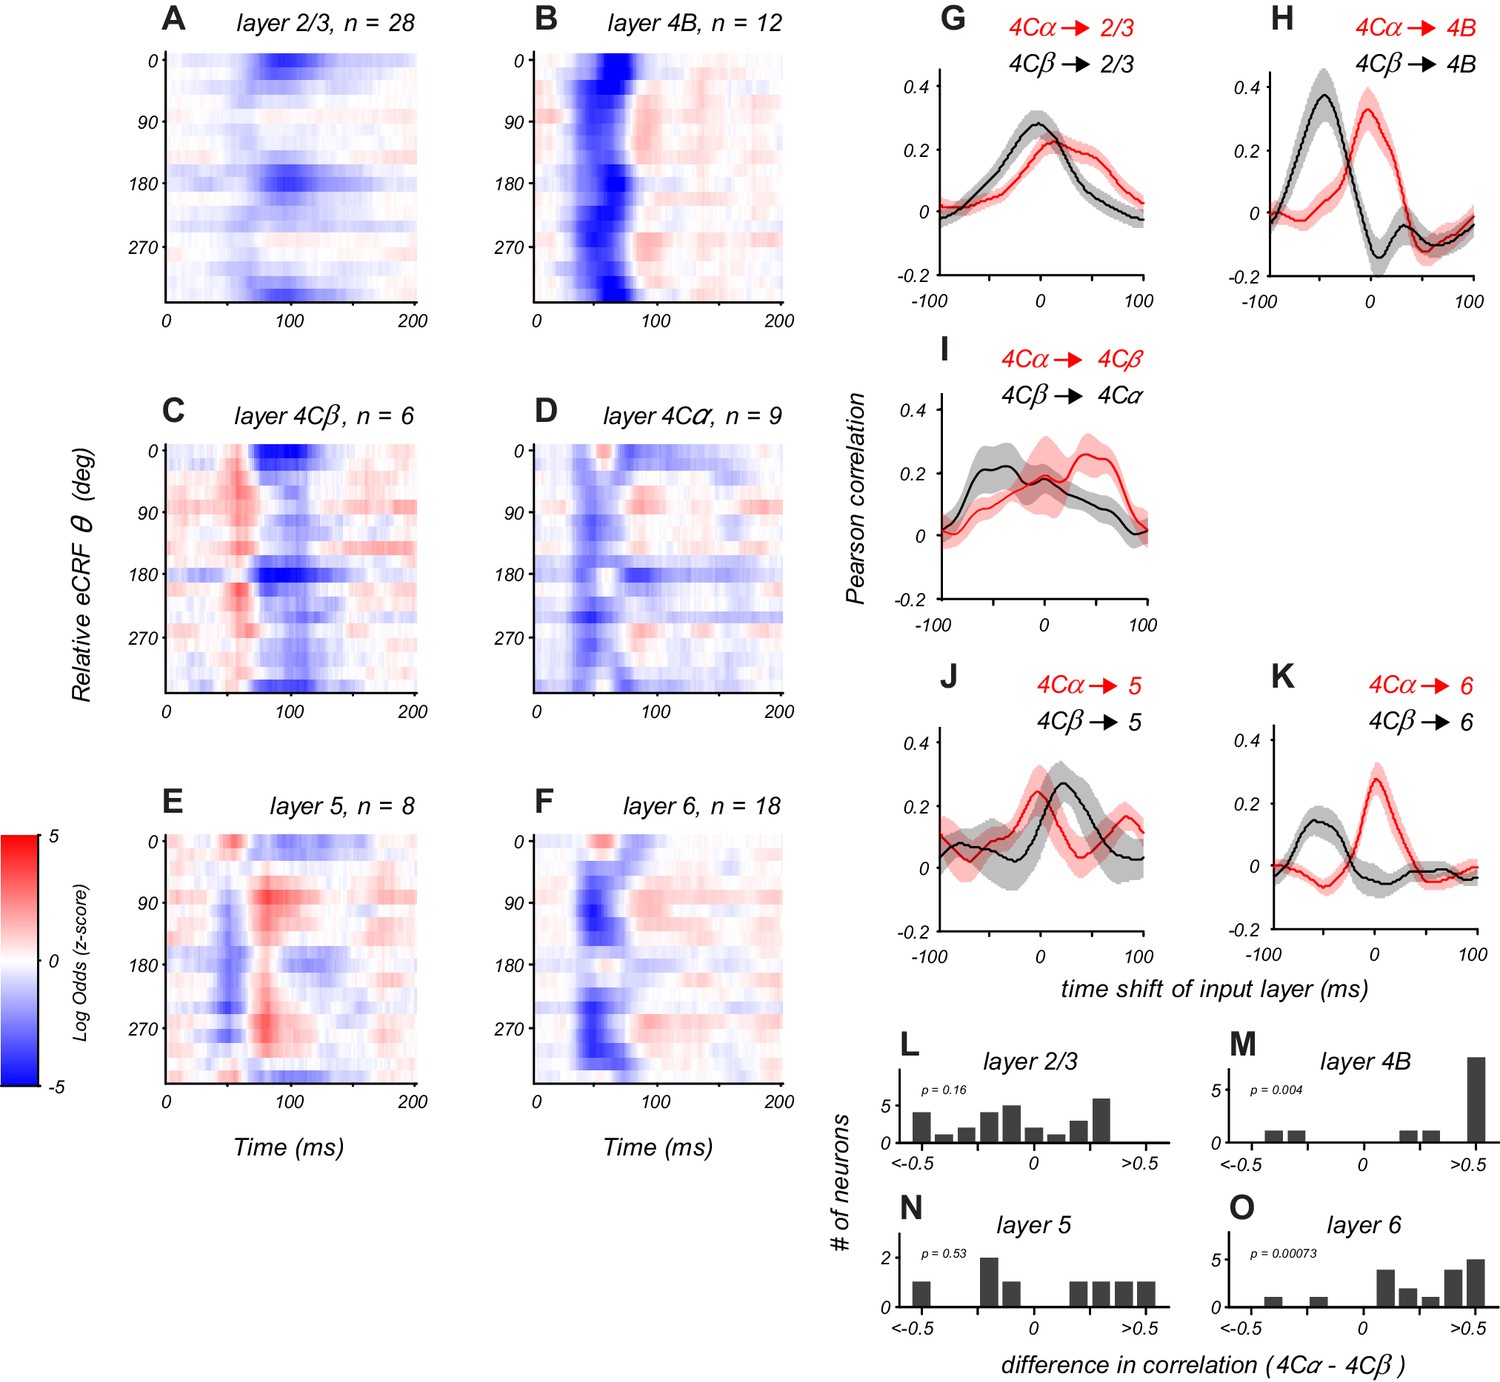
Distinct laminar patterns of eCRF modulation.
(A–F) Average eCRF dynamics by cortical layer for the CRF/eCRF border condition (1x eCRF). Color scale represents the sign and strength of modulation (red, facilitation; blue, suppression). The sample size for each layer is listed above each plot. (G–K) Cross-correlation of eCRF kernels with the average kernels of the two divisions of input layer 4C (red, 4Cα; black, 4Cβ) at varying time lags (−100 to +100 ms). Each panel represents the average cross-correlation function for all neurons in a given layer (solid line, mean; shading, s.e.m.). In (H,K), the peak at 0 time lag (red) indicates that the eCRF dynamics are well aligned with those of input layer 4Cα; by contrast, the peak at negative time lags (black) indicates that the dynamics of input layer 4Cβ would have to be shifted markedly earlier in time to have peak alignment. Dynamics in layers 2/3 and 5 show comparable agreement with those of both input layers, suggesting less-segregated processing streams. (L–O) Histograms show the difference in correlation values with 4Cα and 4Cβ at zero lag for all neurons in each cortical layer.
-
Figure 4—source data 1
Source data for Figure 4.
- https://cdn.elifesciences.org/articles/54264/elife-54264-fig4-data1-v1.mat
Figure 4—figure supplement 1

Patterns of modulation in layers 2/3 and 4B at different eCRF extents.
(A, C) Averaged orientation vs time maps of modulation for the CRF/eCRF border condition (1x eCRF) for neurons in layer 2/3 (A) and layer 4B (C). (B, D) Averaged orientation vs time maps of modulation for the 2x eCRF border condition for neurons in layer 2/3 (B) and layer 4B (D). Tuned suppression is prevalent at larger spatial scales in both cortico-cortical output layers, although they exhibit distinct dynamics.
-
Figure 4—figure supplement 1—source data 1
Source data for Figure 4—figure supplement 1.
- https://cdn.elifesciences.org/articles/54264/elife-54264-fig4-figsupp1-data1-v1.mat
Figure 5
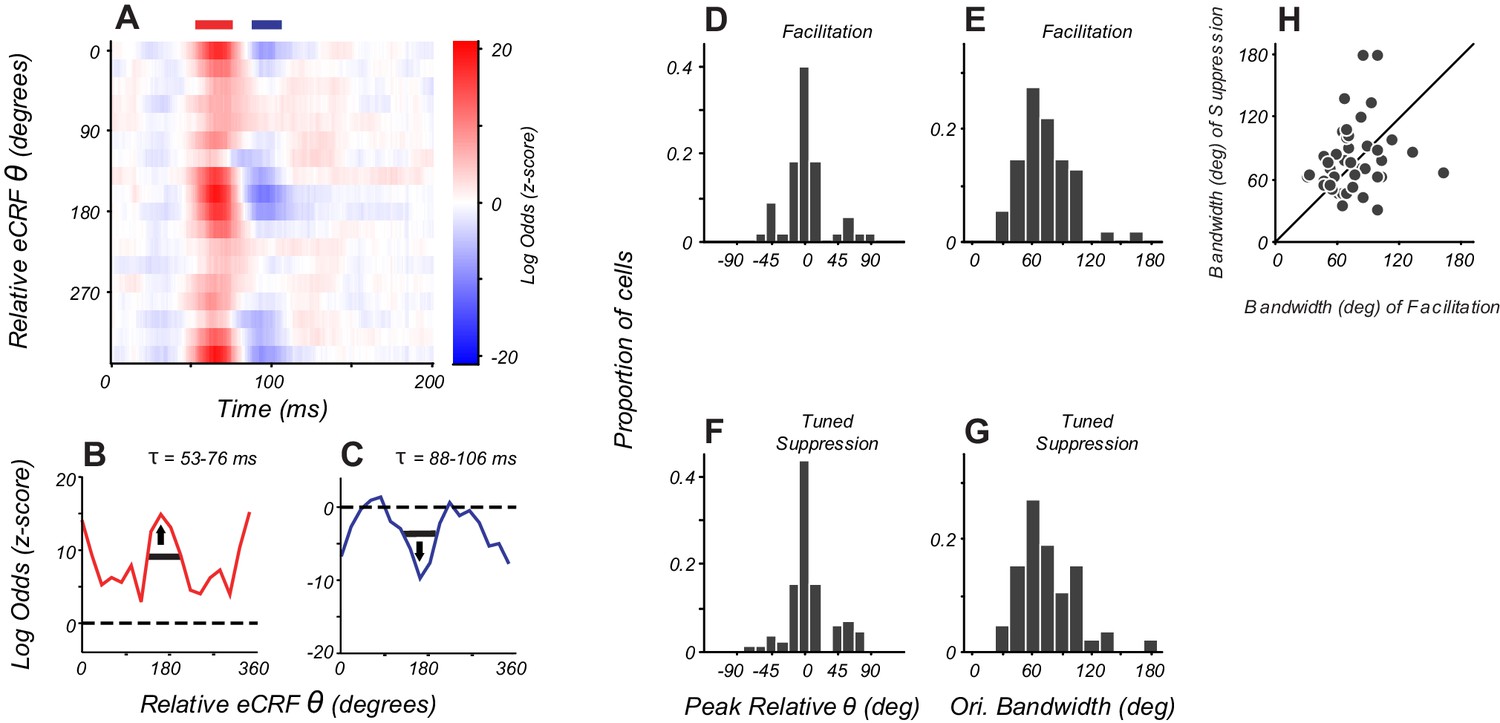
Orientation tuning of suppression in eCRF matches CRF tuning.
(A) eCRF dynamics from an example cell. Red and blue bars at the top of the figure show the windows used to determine the average tuning. (B, C) Average orientation tuning of eCRF components for the neuron in panel (A). Black horizontal lines indicate orientation bandwidth, arrows indicate peak orientation. (D, F) Population distribution of peak orientations for facilitation and tuned suppression. (E, G) Population distribution of orientation bandwidth (full width at half height) for facilitation and tuned suppression. (H) Relationship between orientation bandwidth for eCRF facilitation and eCRF suppression.
-
Figure 5—source data 1
Source data for Figure 5.
- https://cdn.elifesciences.org/articles/54264/elife-54264-fig5-data1-v1.mat
Figure 6
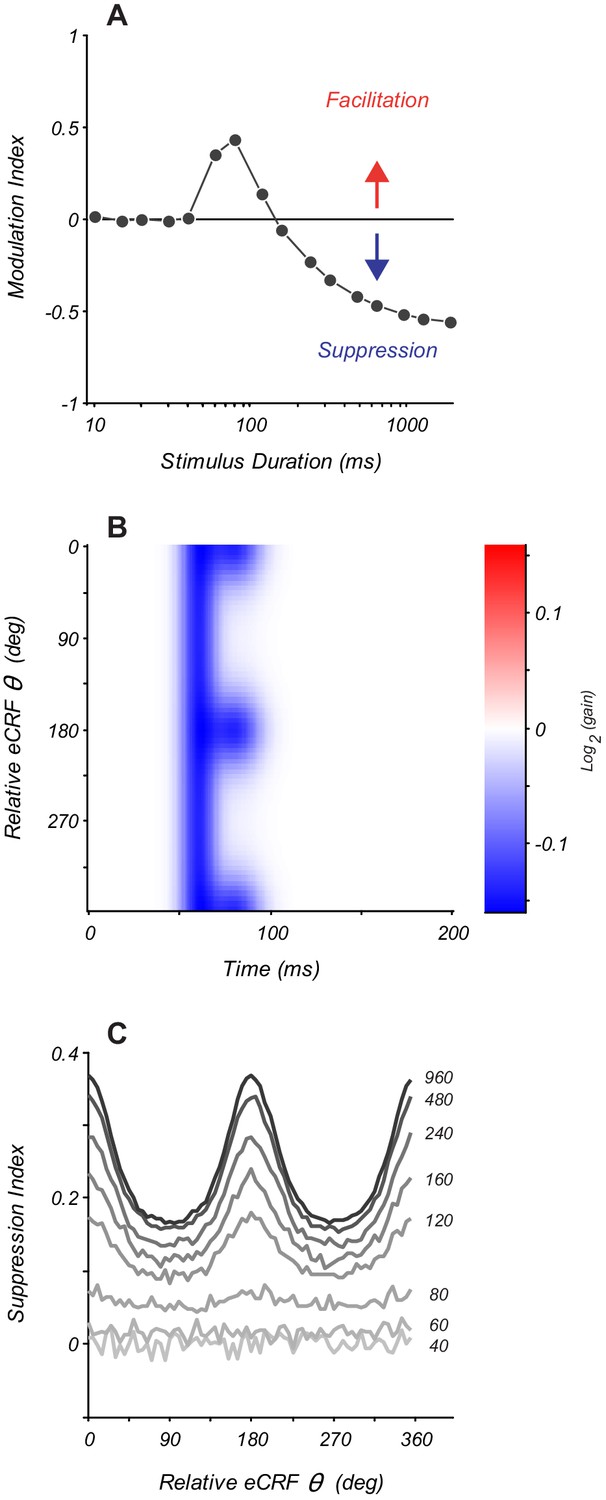
Modeling eCRF indicates that net effects change with stimulus duration.
(A) Response modulation index as a function of stimulus duration for an eCRF model with short-latency facilitation and long-latency strong suppression. Modulation index is calculated as mean change in net spiking activity over the entire stimulus presentation. Positive values reflect facilitation, negative values reflect suppression, and the horizontal line at zero reflects no net modulation. (B) eCRF dynamics of a model with both short-latency untuned suppression and long-latency tuned suppression. (C) The steady-state suppression index as a function of relative eCRF orientation for the model shown in panel (B). Each trace shows a net suppression tuning curve for a stimulus of a fixed duration (duration shown to the right of each curve in ms).
-
Figure 6—source data 1
Source data for Figure 6.
- https://cdn.elifesciences.org/articles/54264/elife-54264-fig6-data1-v1.mat
Additional files
Download links
A two-part list of links to download the article, or parts of the article, in various formats.
Downloads (link to download the article as PDF)
Open citations (links to open the citations from this article in various online reference manager services)
Cite this article (links to download the citations from this article in formats compatible with various reference manager tools)
Distinct spatiotemporal mechanisms underlie extra-classical receptive field modulation in macaque V1 microcircuits
eLife 9:e54264.
https://doi.org/10.7554/eLife.54264


