Short-term modulation of the lesioned language network
- Lise Meitner Research Group Cognition and Plasticity, Max Planck Institute for Human Cognitive and Brain Sciences Leipzig, Germany
- Language and Aphasia Laboratory, Department of Neurology, University of Leipzig Medical Centre, Germany
- Clinic for Cognitive Neurology, University of Leipzig Medical Centre & Max Planck Institute for Human Cognitive and Brain Sciences, Germany
Figures
Figure 1
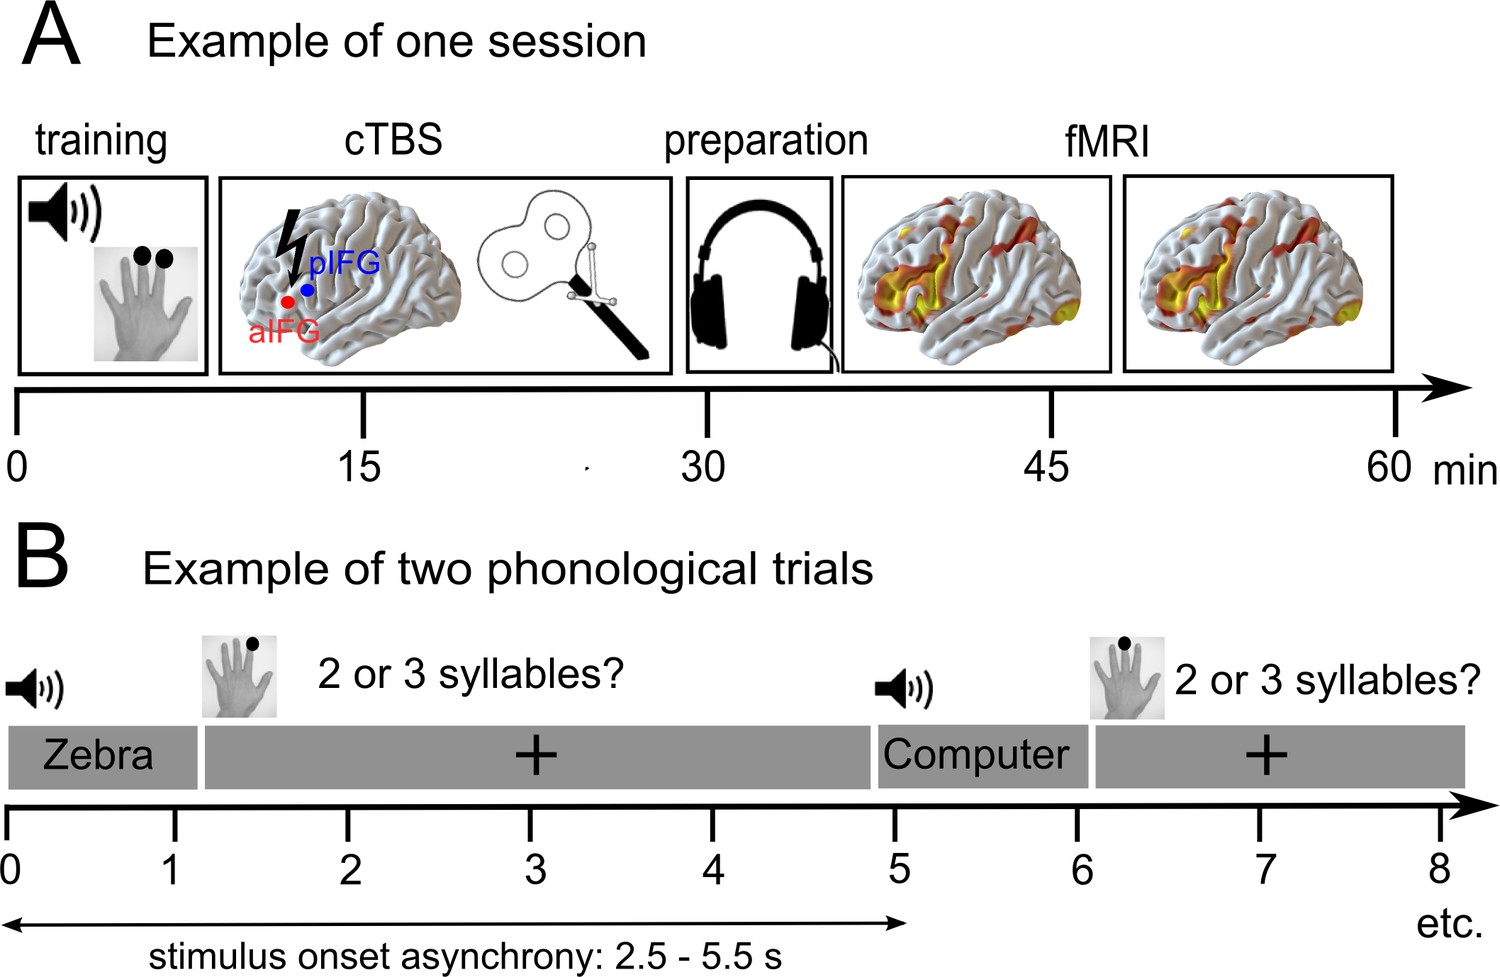
Overview of the experimental design.
(A) After a short training session, patients received effective or sham continuous theta burst stimulation (cTBS-600) either over the anterior or posterior inferior frontal gyrus (a/pIFG) in different sessions. Thereafter, they performed phonological and semantic word judgement tasks in two fMRI runs. (B) Tasks were divided into 10 miniblocks per task and run, each consisting of 6 German words (e.g. ‘Zebra’ or ‘Computer’) with varying stimulus onset asynchrony. min = minutes; s = seconds.
Figure 2
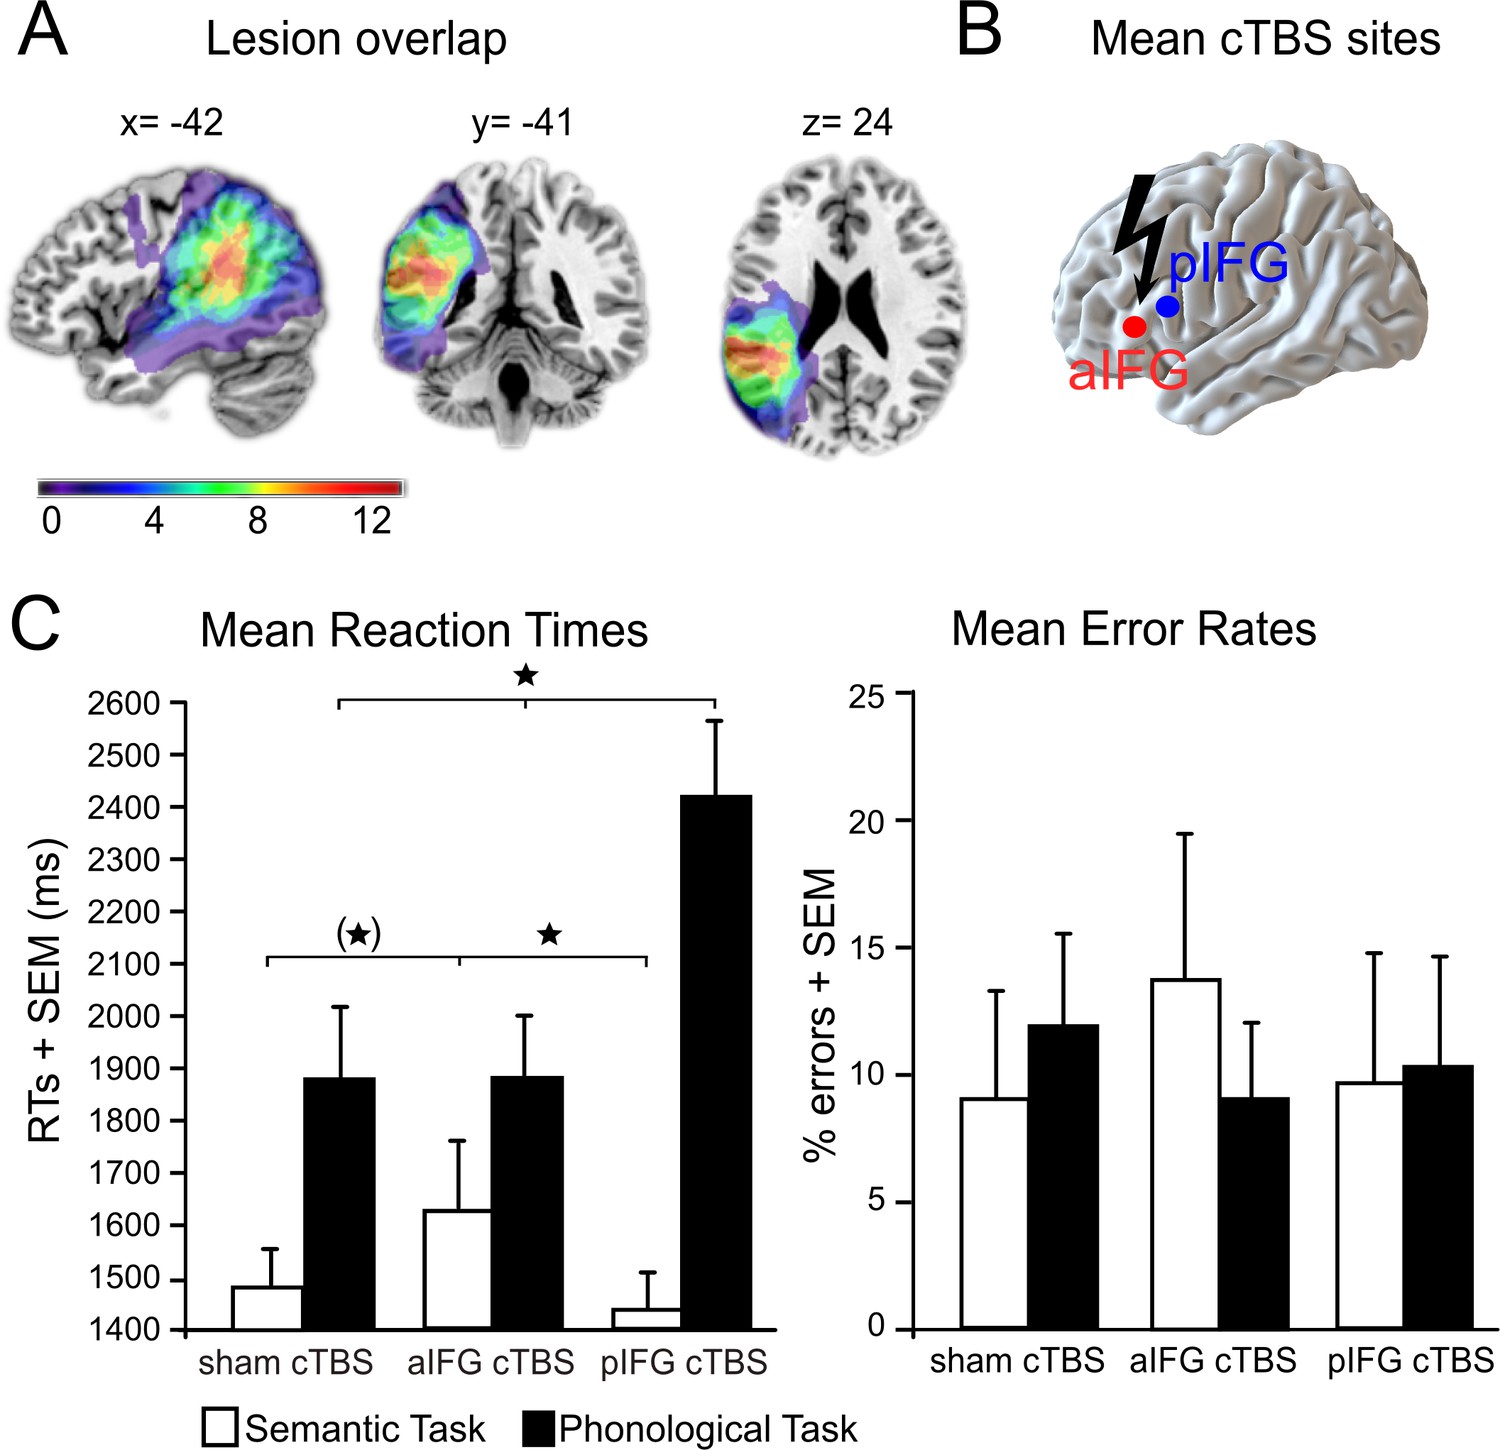
Behavioral results.
(A) Lesion overlap for all patients. All patients had lesions in their left temporo-parietal cortex with the strongest overlap in the supramarginal gyrus. Note that the frontal cortex was intact in all patients. (B) Continuous theta burst stimulation (cTBS) sites over the left anterior and posterior inferior frontal gyrus (a/pIFG). Mean stimulation sites were taken from a previous study and transferred to the individual patient’s brain. (C) Effects of cTBS on task processing. Left panel: Relative to cTBS over aIFG or sham cTBS, cTBS of pIFG significantly delayed phonological response speed. The opposite pattern was found for semantic processing. Relative to cTBS over pIFG or sham cTBS, cTBS over aIFG significantly delayed semantic response speed. Right panel: Effects of cTBS on error rates were not significant. *p<0.05. (*) does not survive a Bonferroni-Holm correction for multiple comparisons. RTs = reaction times, SEM = standard error of the mean. Coordinates are given in MNI space.
Figure 3

Residual language network after sham continuous theta burst stimulation.
(A) Phonological decisions compared to rest and (B) semantic decisions compared to rest. Voxels with at least one lesion are masked in dark grey and were excluded from the analysis. Results are shown at p<0.001 uncorrected for display reasons.
Figure 4
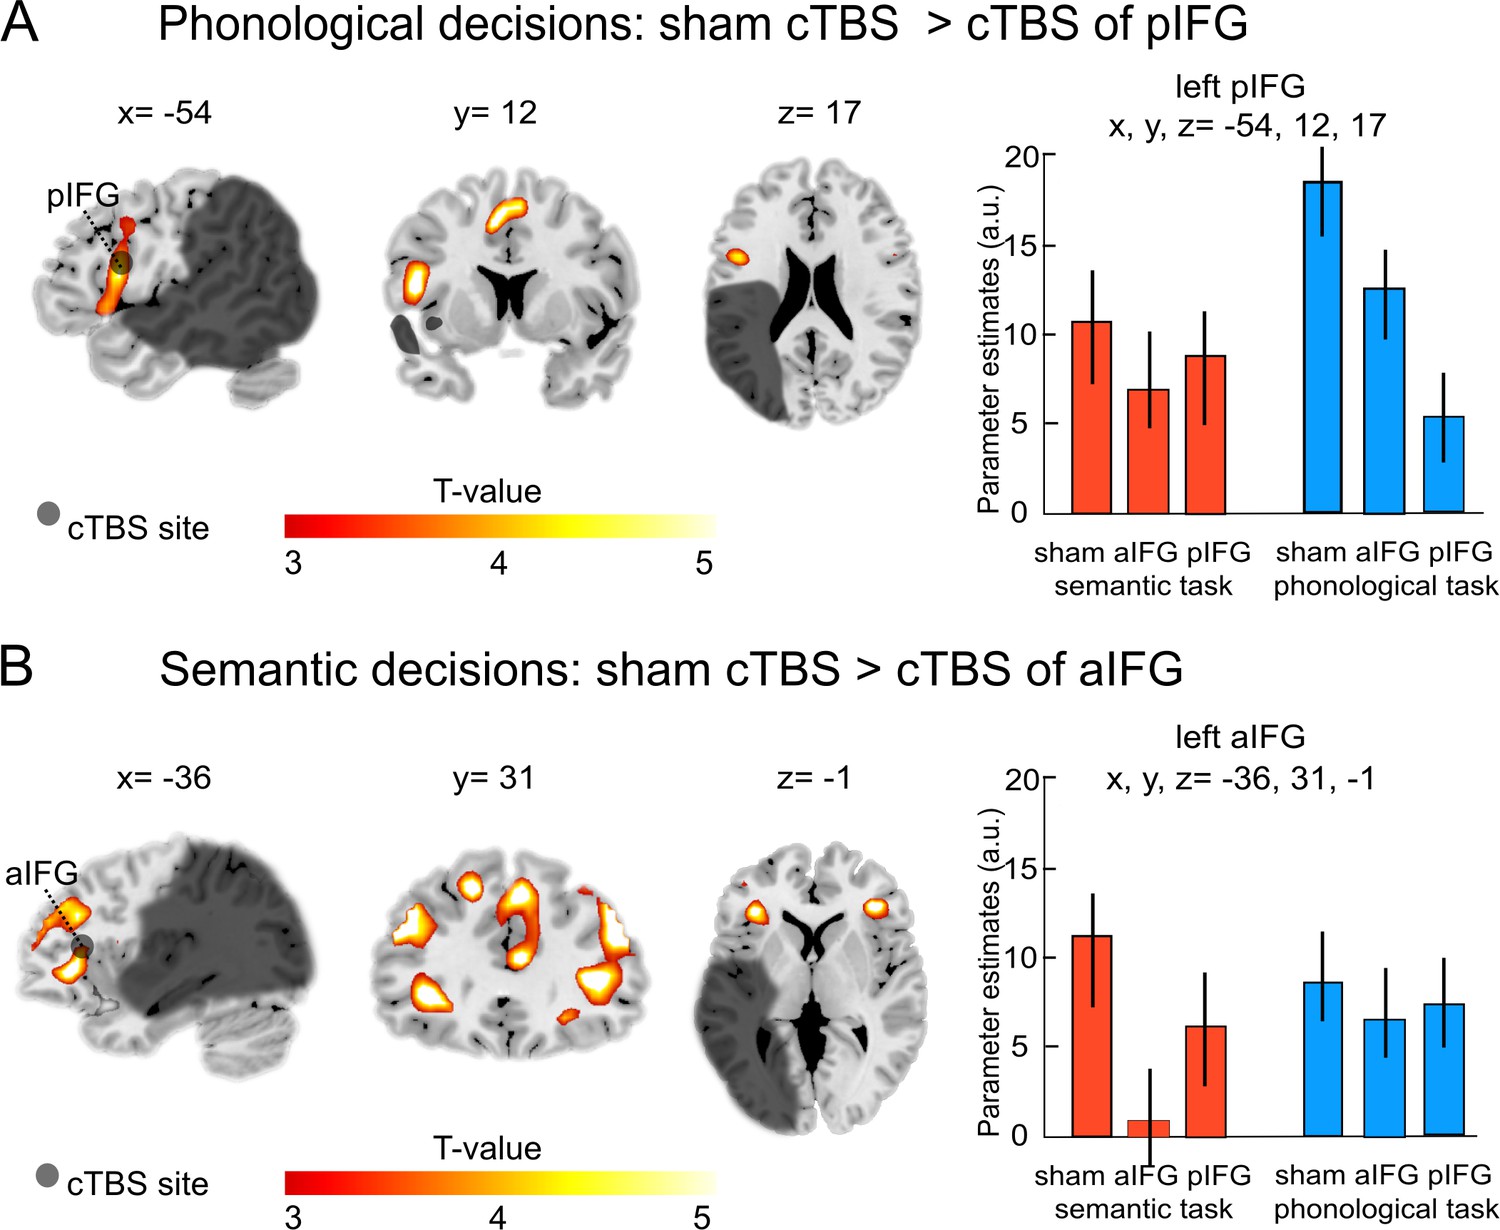
Task-specific continuous theta burst stimulation (cTBS) effects on word decisions.
(A) Phonological decisions. Relative to sham cTBS, cTBS of pIFG significantly decreased neural activity at the stimulated area. (B) Semantic decisions. Relative to sham cTBS, cTBS of aIFG significantly decreased neural activity in a larger network, including the bilateral anterior insula and adjacent aIFG. Right panels display the respective parameter estimates (arbitrary units) for the different cTBS conditions that were extracted at the respective mean group peak coordinates from the effect of interest for each task condition against rest. p<0.001 uncorrected for display reasons. a/pIFG = anterior/posterior inferior frontal gyrus. Coordinates are given in MNI space.
Figure 5
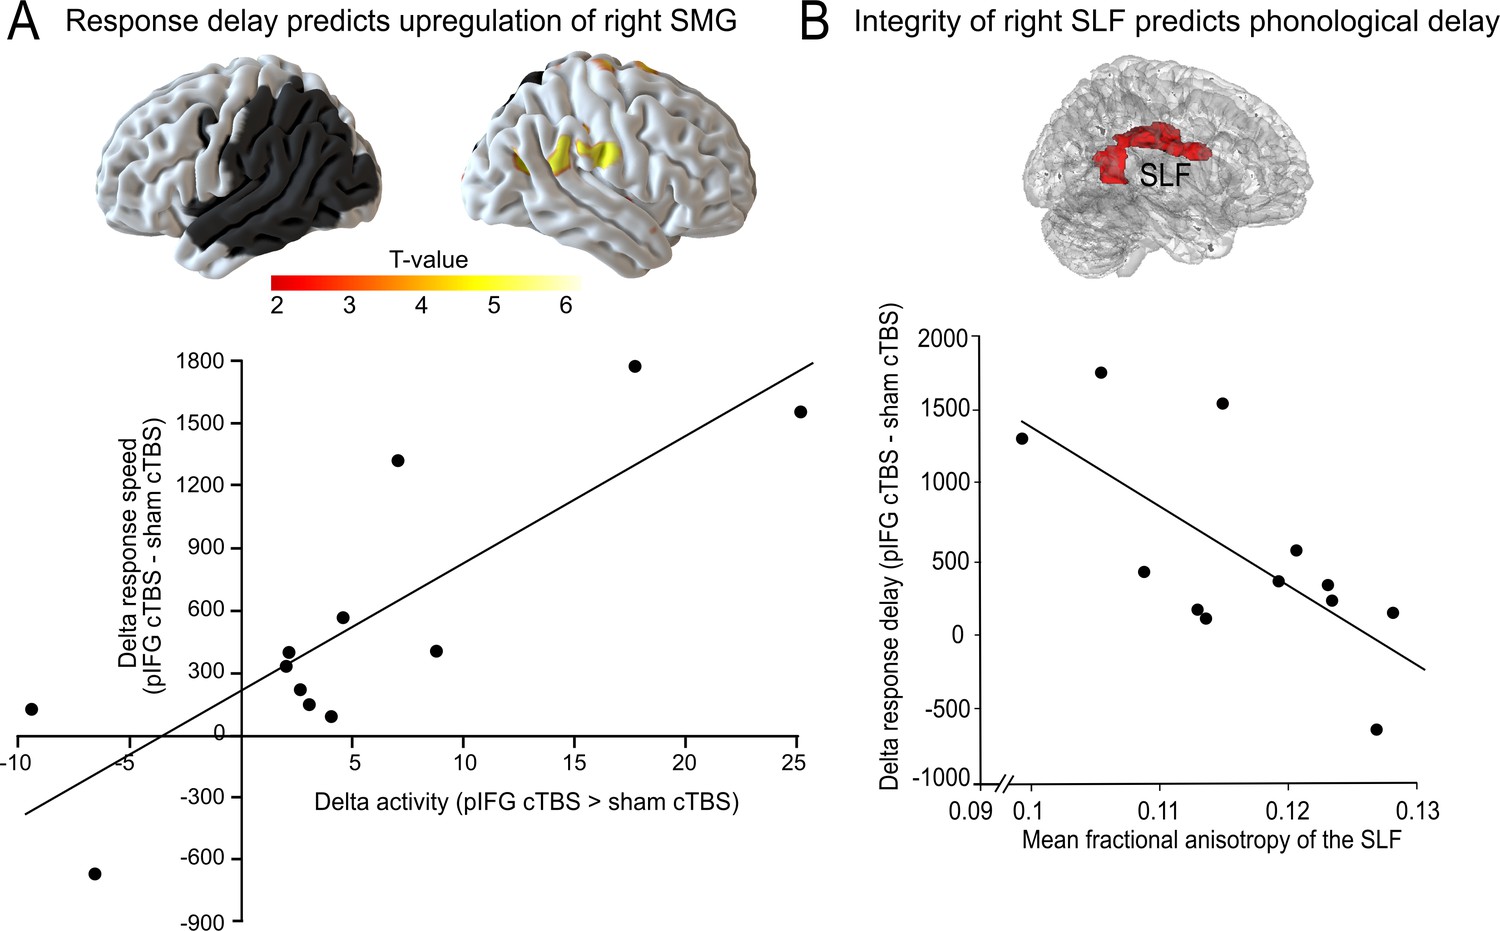
Compensatory effects during phonological processing.
(A) Regression analysis. The individual delay in phonological response speed after effective continuous theta burst stimulation (cTBS) over pIFG vs. sham cTBS (pIFG – sham cTBS) was correlated with the upregulation of the contralesional right supramarginal gyrus (SMG; shown at p<0.001 uncorrected for display reasons). (B) Correlation between the individual mean fractional anisotropy (FA) in the right superior longitudinal fasciculus (SLF) and the behavioural cTBS effect. Upper panel: 3D rendering generated with FSLview showing the region of interest in the right SLF that was used to extract the mean FA. The SLF ROI was obtained from the Juelich Histological atlas. Lower panel: Regression analysis. The individual FA for the right SLF was negatively correlated with the relative increase in the individual mean reaction times for the phonological task after cTBS of pIFG relative to sham cTBS.
Tables
Table 1
Patient characteristics: Test data.
| Patient | Age | Sex | Education | Laterality | Time since stroke | Lesion site | Lesion size (cm3) | % overlap with AG | % overlap with SMG | AAT |
|---|---|---|---|---|---|---|---|---|---|---|
| 01 | 54.2 | m | 12 | 0.9 | 10.1 | temporo-parietal | 66.90 | 76 | 40 | Isolated paraphasias comprehension deficits |
| 02 | 52.9 | m | 12 | 0.8 | 17.7 | parietal | 59.28 | 19 | 74 | No aphasia, expressive phon.deficits |
| 03 | 63.9 | m | 8 | 1 | 76.1 | parietal | 93.19 | 94 | 60 | Residual aphasia,expressive phon.deficits |
| 04 | 49.6 | m | 10 | 0.9 | 122.4 | parietal | 76.47 | 85 | 79 | Residual aphasia,expressive phon.deficits |
| 05 | 43.2 | w | 10 | 1 | 57.8 | parietal | 70.18 | 33 | 82 | Residual aphasia |
| 06 | 65.2 | m | 12 | 1 | 36.2 | parietal | 18.55 | 2 | 28 | No aphasia |
| 07 | 72.8 | w | 10 | 1 | 24.0 | parietal | 176.34 | 86 | 82 | Residual aphasia,decreased verbalmemory span |
| 08 | 66.2 | w | 8 | 1 | 6.2 | temporo-parietal | 37.99 | 0 | 55 | Residual aphasia |
| 09 | 61.9 | m | 8 | 1 | 6.6 | temporo-parietal | 11.89 | 3 | 2 | No aphasia, decreased verbalmemory span |
| 10 | 46.0 | m | 10 | 1 | 23.8 | parietal | 105.42 | 97 | 36 | Residual aphasia |
| 11 | 63.8 | w | 12 | 1 | 14.5 | parietal | 37.97 | 20 | 12 | No aphasia, decreased verbalmemory span |
| 12 | 63.8 | m | 10 | 0.9 | 24.6 | temporo-parietal | 25.66 | 2 | 36 | No aphasia,decreased verbal memory span |
-
Laterality = Handedness (Oldfield score), % overlap = lesion overlap with angular gyrus (AG; BA 39) or supramarginal gyrus (SMG, BA 40); Education is given in years, Time since stroke in months. AAT = Aachener Aphasie Test (Aaachen Aphasia Inventory). phon = phonological.
Table 2
Behavioral results.
| Task/condition | RTs ± SEM (in ms) | ERs ± SEM (in %) |
|---|---|---|
| Phonological judgements | ||
| sham cTBS | 1895 ± 132.54 | 11.28 ± 3.42 |
| cTBS of aIFG | 1888 ± 120.90 | 9.55 ± 2.69 |
| cTBS of pIFG | 2411 ± 151.31 | 9.10 ± 1.97 |
| Semantic judgements | ||
| sham cTBS | 1486 ± 112.98 | 9.04 ± 4.69 |
| cTBS of aIFG | 1632 ± 129.79 | 12.95 ± 5.88 |
| cTBS of pIFG | 1452 ± 84.18 | 9.36 ± 4.82 |
-
RTs = reaction times; ERs = error rates; SEM = standard error of the mean.
Table 3
Task-related changes in neural activity.
| Region | Side | MNI coordinates (x, y, z) | T | Cluster size | ||
|---|---|---|---|---|---|---|
| Phonological decisions > rest after sham cTBS | ||||||
| Supplementary motor area | L/R | –3 | 2 | 56 | 8.57 | 619 |
| Supplementary motor area | L | –6 | 11 | 47 | 8.15 | subcluster |
| Supplementary motor area | R | 9 | 17 | 44 | 6.90 | subcluster |
| anterior insula | L | −30 | 26 | 2 | 8.28 | 1527 |
| posterior inferior frontal gyrus (pars opercularis) | L | −49 | 9 | 11 | 8.15 | subcluster |
| posterior inferior frontal gyrus (pars opercularis) | L | −54 | 14 | 1 | 6.97 | subcluster |
| Frontal operculum | R | 42 | 20 | 5 | 6.61 | 532 |
| Posterior inferior frontal gyrus (pars opercularis) | R | 48 | 11 | 17 | 6.47 | subcluster |
| anterior insula | R | 33 | 23 | 5 | 6.32 | subcluster |
| Precentral gyrus (extending to the postcentral gyrus and parietal cortex) | R | 33 | −22 | 53 | 5.90 | 95 |
| Semantic decisions > rest | ||||||
| Supplementary motor area | L/R | –6 | 14 | 47 | 7.54 | 708 |
| Supplementary motor area | L | –3 | –1 | 56 | 6.87 | subcluster |
| Supplementary motor area | R | 9 | 17 | 41 | 6.69 | subcluster |
| anterior insula | L | −30 | 26 | 2 | 6.79 | 1054 |
| anterior inferior frontal gyrus (pars orbitalis / triangularis) | L | −46 | 42 | –5 | 6.01 | subcluster |
| posterior inferior frontal gyrus (pars opercularis) | L | −50 | 10 | 10 | 5.91 | subcluster |
| Precentral gyrus | R | 39 | −19 | 56 | 6.62 | 318 |
| Postcentral gyrus (extending to the parietal cortex) | R | 48 | −22 | 53 | 4.91 | subcluster |
| Frontal operculum | R | 39 | 23 | 2 | 6.05 | 299 |
| Cerebellum | L | −27 | −52 | −25 | 5.98 | 98 |
| Phonological decisions: sham cTBS > cTBS of pIFG | ||||||
| posterior inferior frontal gyurs (pars opercularis) | L | −54 | 12 | 17 | 4.97 | 64 |
| Supplementary motor area | R | 1 | 3 | 54 | 4.90 | 60 |
| Putamen | R | 18 | 8 | –7 | 4.80 | 35 |
| Phonological decisions: cTBS of aIFG > cTBS of pIFG | ||||||
| posterior inferior frontal gyrus (pars opercularis) | L | −54 | 23 | 18 | 4.92 | 60 |
| Semantic decisions: sham cTBS > cTBS of aIFG | ||||||
| Middle frontal gyrus | R | 45 | 35 | 32 | 5.20 | 347 |
| Inferior frontal gyrus (pars orbitalis) / insula | R | 40 | 37 | 3 | 4.90 | subcluster |
| Superior frontal gyrus | R | 9 | 35 | 41 | 4.99 | 158 |
| Inferior frontal gyrus (pars orbitalis) / insula | L | −36 | 31 | -1 | 4.80 | 65 |
| Middle frontal gyrus | L | −45 | 35 | 26 | 4.78 | 60 |
| Semantic decisions: cTBS of pIFG > cTBS of aIFG | ||||||
| Middle frontal gyrus | R | 45 | 30 | 28 | 5.00 | 242 |
| Inferior frontal gyrus (pars orbitalis) / insula | R | 42 | 38 | 4 | 4.80 | subcluster |
| Inferior frontal gyrus (pars orbitalis) / insula | L | −38 | 31 | 1 | 4.78 | 60 |
-
p<0.05, FWE corrected at the cluster level.
Additional files
Download links
A two-part list of links to download the article, or parts of the article, in various formats.
Downloads (link to download the article as PDF)
Open citations (links to open the citations from this article in various online reference manager services)
Cite this article (links to download the citations from this article in formats compatible with various reference manager tools)
Short-term modulation of the lesioned language network
eLife 9:e54277.
https://doi.org/10.7554/eLife.54277


