Cerebellar modulation of synaptic input to freezing-related neurons in the periaqueductal gray
- Department of Neurobiology, Northwestern University, United States
Figures
Figure 1 with 1 supplement
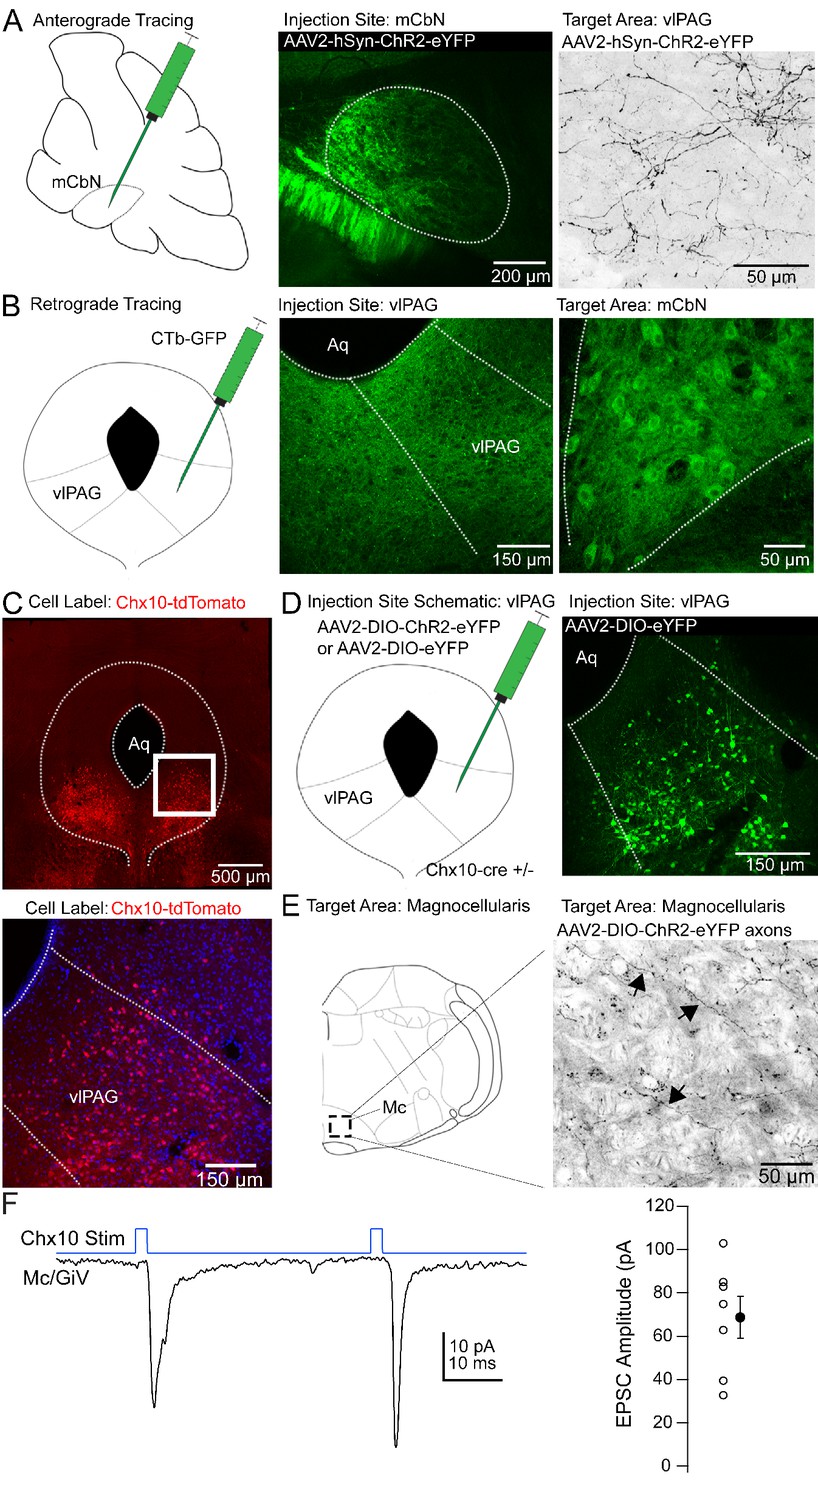
Anatomical tracing and identification of Chx10-positive vlPAG neurons.
(A) Left, Schematic of a parasagittal section of the cerebellum showing injection site for anterograde tracing from mCbN. Middle, Confocal image of the mCbN after injection of AAV-hSyn-ChR2-eYFP virus. Dotted line, mCbN boundaries. Right, Confocal image of virally labeled mCbN axons in the vlPAG. (B) Left, Schematic of a coronal section of the PAG showing injection site for retrograde tracing from the vlPAG. Middle, Example injection site of CTb-GFP in the vlPAG. Dotted line, approximate boundaries of vlPAG. Right Retrogradely labeled neurons in the mCbN. Dotted line, boundaries of mCbN. (C) Top, Low magnification confocal image of the PAG in a Chx10-tdT mouse, showing the distribution of Chx10 neurons in the ventrolateral PAG. Bottom, High magnification image of the white box in the upper panel. (D) Left, Schematic of the PAG showing injection site for anterograde tracing in Chx10-cre mice. Right, Confocal image of the vlPAG after viral labeling of Chx10 neurons. (E) Left, Schematic of a coronal section of the brainstem showing the approximate rostro-caudal position of Chx10-positive axons in the magnocellular reticular nucleus (Mc), approximately −6.6 mm from bregma. Right, Axonal labeling of Chx10-positive axons in the Mc. Arrows indicate labeled axons. (F) Left, EPSCs evoked in Mc neurons by optogenetic stimulation of Chx10-ChR2 axons. Right, Population data for first evoked EPSC in Mc neurons. Open symbols, individual cells, solid symbols, mean ± SEM.
Figure 1—figure supplement 1
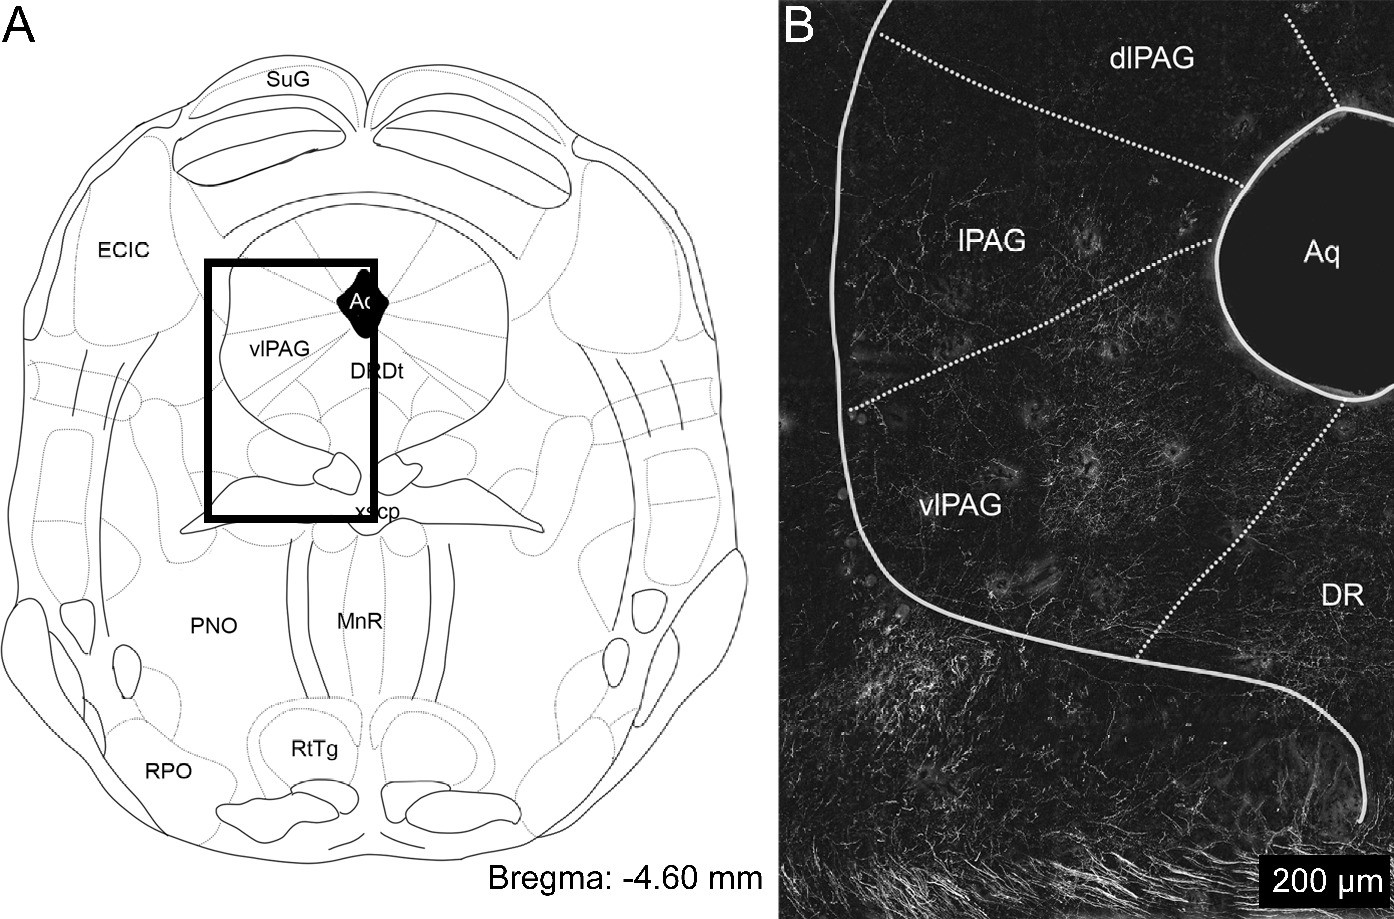
Low magnification image of mCbN labeled axons in vlPAG.
(A) Schematic of the approximate rostro-caudal level of the highest density of mCbN labeled fibers in the vlPAG. Box denotes boundaries of image in panel (B). Abbreviations: SuG: superficial grey layer of the superior colliculus, ECIC: external cortex of the inferior colliculus, vlPAG: ventrolateral periaqueductal gray, DrDt: dorsal segment of the dorsal raphe, Aq: central aqueduct, xscp: decussation of the superior cerebellar peduncle, PNO: pontine reticular nucleus, oral part, MnR: median raphe nucleus. RPO: rostral periolivary region, RtTg: reticulotegmental nucleus of the pons. (B) Low magnification confocal image of the distribution of mCbN labeled axon terminals in the vlPAG and surrounding tissue. Abbreviations: Aq: central aqueduct, vlPAG: ventrolateral periaqueductal gray, lPAG: lateral periaqueductal gray, dlPAG: dorsolateral periaqueductal gray, DR: dorsal raphe.
Figure 2
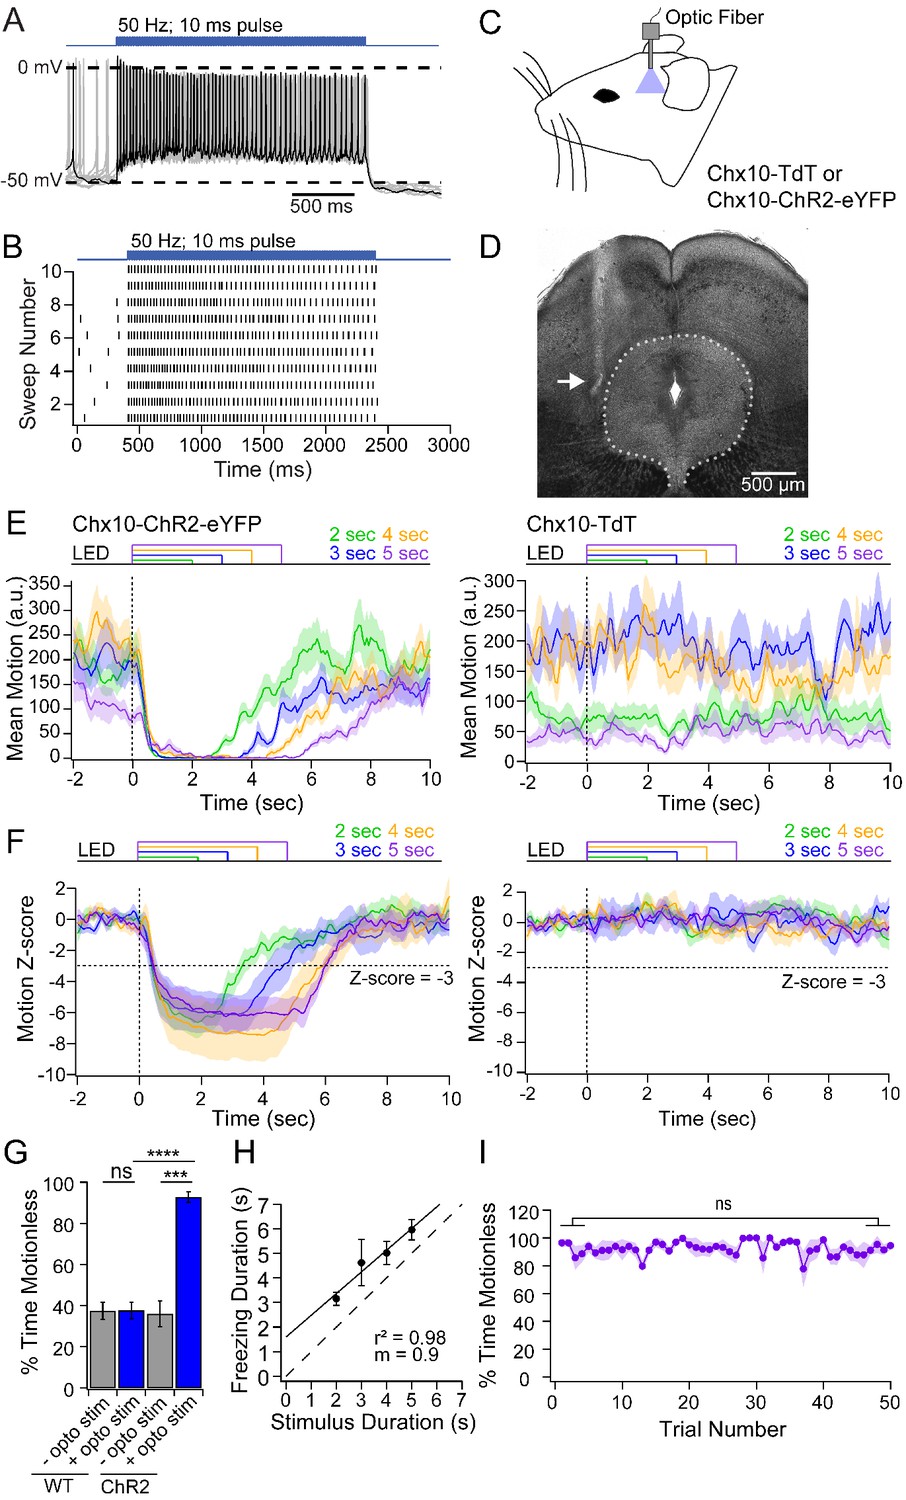
Freezing evoked by activation of Chx10 neurons in vivo.
(A) Action potentials in a Chx10-ChR2 expressing neuron in the vlPAG during a train (100 stimuli, 50 Hz, 10 ms) of light. (B) Spike raster of 10 consecutive sweeps during stimulation of the cell in A. (C) Schematic of a mouse showing placement of the fiber optic cannula in the vlPAG. (D) Transmitted-light image of the midbrain showing placement of fiber optic cannula just lateral to the vlPAG (white arrow). (E) Plot of the mean motion as a function of time in Chx10-ChR2 mice (left) and Chx10-tdT mice (right). Time 0 indicates onset of LED optogenetic stimulation (dotted line). Each trace is the mean of 50 consecutive sweeps in a single mouse. (F) Z-score of mean motion for each stimulus duration for all Chx10-ChR2 mice (left) and Chx10-tdT mice right). Horizontal dotted line, a Z-score of −3, vertical dotted line, light onset. (G) Mean percent time immobile with and without stimulation in Chx10-TdT mice and Chx10-ChR2. (H) Freezing duration vs. the stimulus duration in Chx10-ChR2 mice. Solid symbols, mean ± SEM. Dashed line, unity. (I) Stability of mean percent time freezing in response to 5 s optogenetic stimulations across 50 consecutive trials in Chx10-ChR2 mice.
Figure 3 with 1 supplement
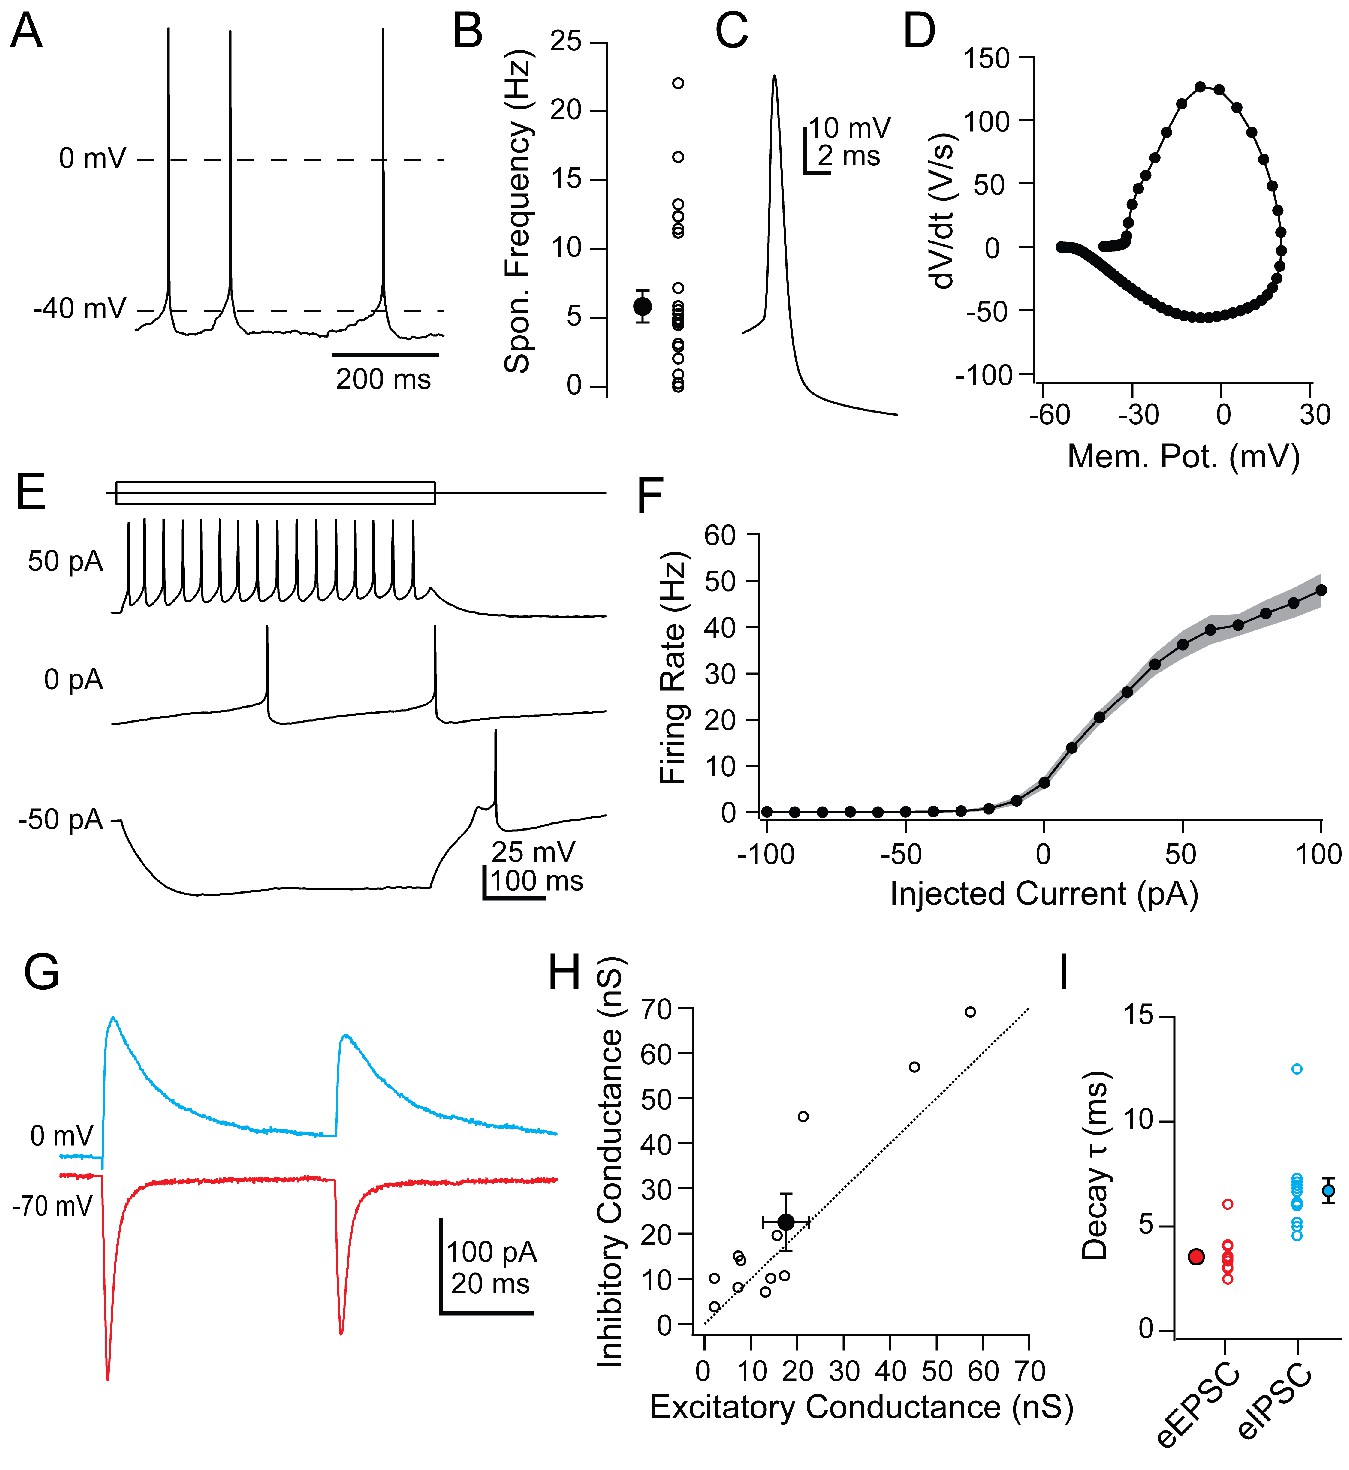
Intrinsic and synaptic properties of Chx10 neurons in PAG slices.
(A) Spontaneous action potentials from a Chx10 neuron. (B) Population data for spontaneous firing rates of Chx10 neurons. (C) Single spontaneous action potential of a Chx10 neuron. (D) Phase-plane plot of action potential in C. (E) Action potentials evoked by 500 ms current injections of −50, 0 and 50 pA in a Chx10 neuron. (F) Mean FI curve for all neurons. Solid symbols, mean, grey shading, SEM. (G) Evoked EPSCs (red) and IPSCs (blue) from a single Chx10 neuron. (H) Peak inhibitory conductance vs. peak excitatory conductance. Open symbols, individual cells, solid symbols, mean ± SEM. Dotted line, unity. (I) Decay time constants, τ, of EPSCs and IPSCs. Open symbols, individual cells, solid symbols, mean ± SEM.
Figure 3—figure supplement 1
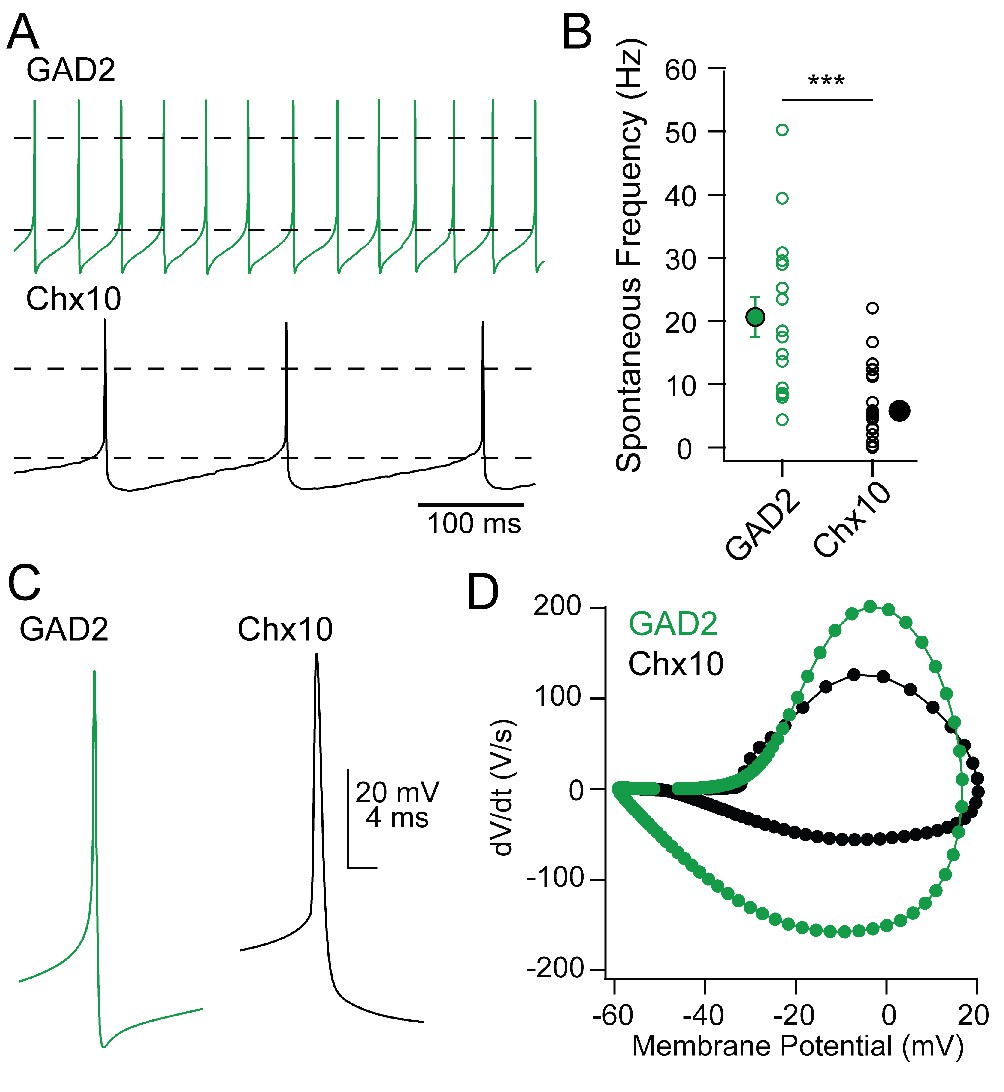
Comparison of Chx10 and GAD2 intrinsic properties.
(A) Spontaneous action potentials in a GAD2+ (green) and a Chx10 (black) neuron. (B) Population data for spontaneous firing rates of GAD2 and Chx10 neurons. Open symbols, individual cells, solid symbols, mean ± SEM. Asterisks, p<0.001. (C) Example action potential waveforms from each cell type. (D) Phase-plane plots of action potentials in C.
Figure 4 with 1 supplement
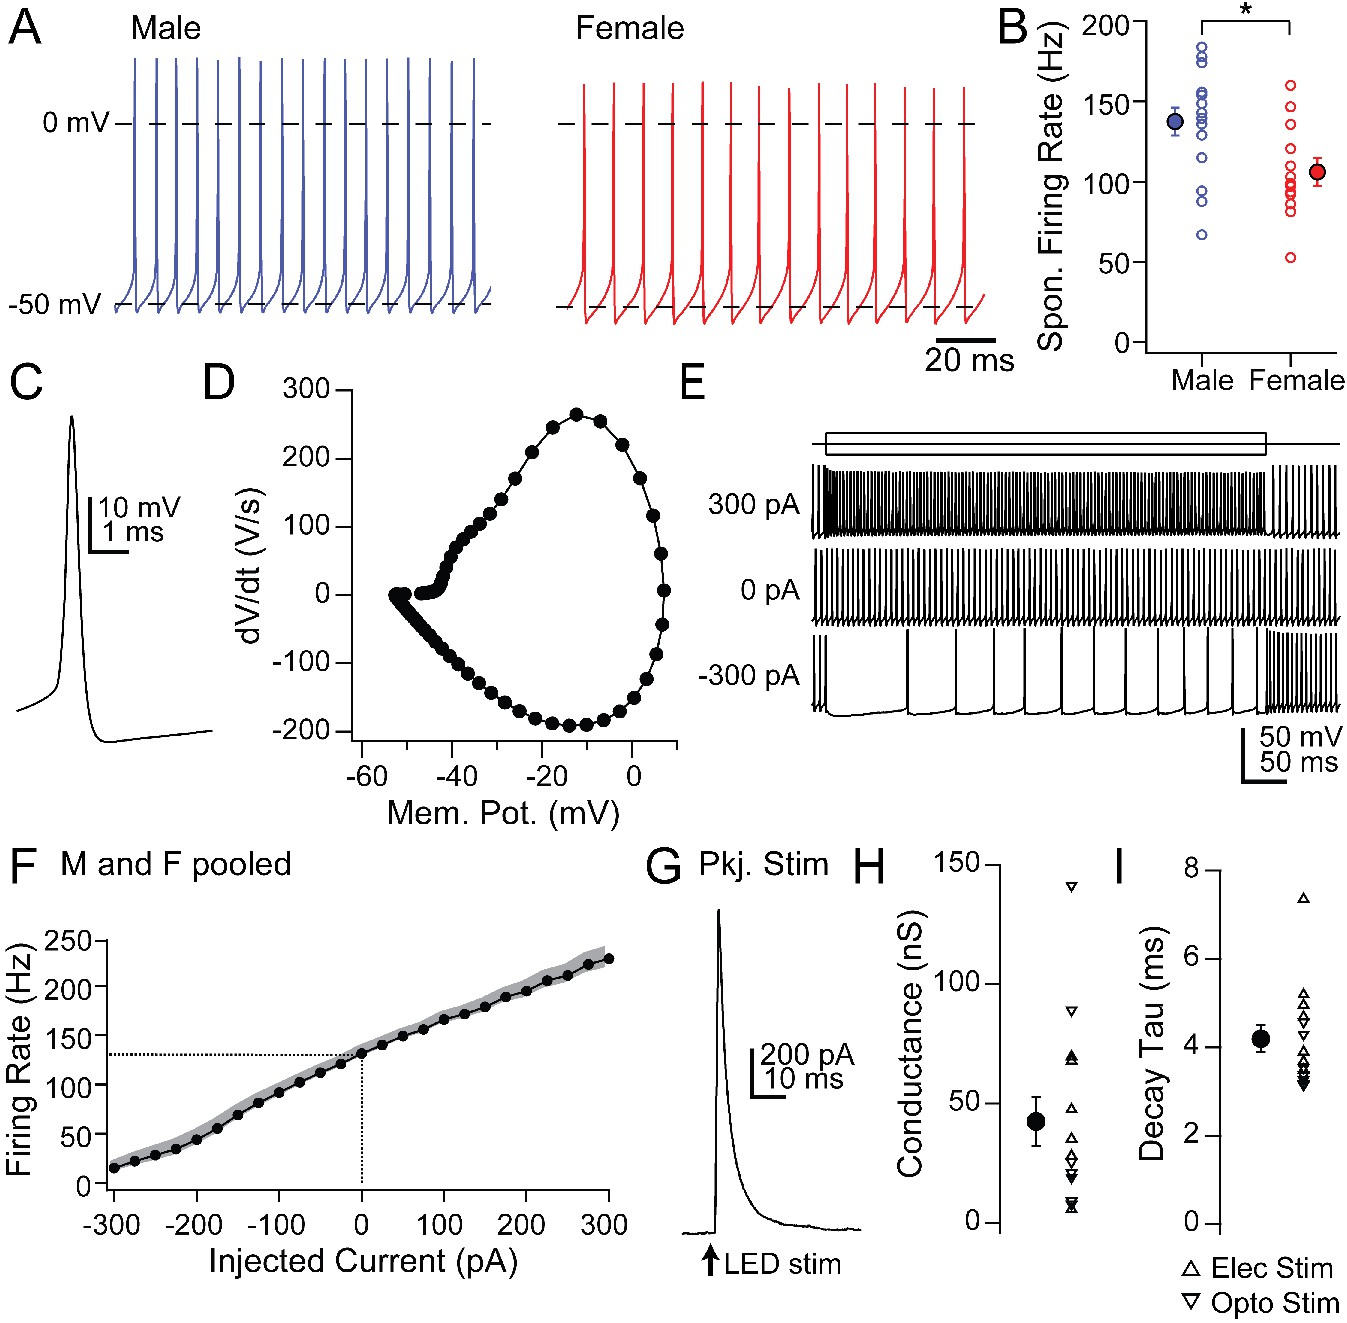
Intrinsic and synaptic properties of mCbN neurons in cerebellar slices.
(A) Spontaneous action potentials recorded from mCbN neurons from males (blue) and females (red). (B) Population data of spontaneous firing rates separated by sex. Open symbols, individual cells, solid symbols, mean ± SEM. Asterisks, p<0.05. (C) Single spontaneous action potential of an mCbN neuron. (D) Phase-plane plot of action potential in C. (E) Action potentials evoked by 500 ms current injections of −300, 0 and 300 pA in an mCbN neuron. (F) Mean FI curve for all neurons from both male and female mice. Solid symbols, mean, grey shading, SEM. Dotted line, firing rate at 0 pA injected current. (G) IPSC in an mCbN cell evoked by optogenetic stimulation of Purkinje cells. (H) Population data of IPSC conductances. Upward triangles, electrical stimulation; downward triangles, optogenetic stimulation. Open symbols, individual cells, solid symbols, mean ± SEM. (I) Population weighted decay time constants for evoked IPSCs in mCbN neurons. Open symbols, individual cells, solid symbols, mean ± SEM.
Figure 4—figure supplement 1
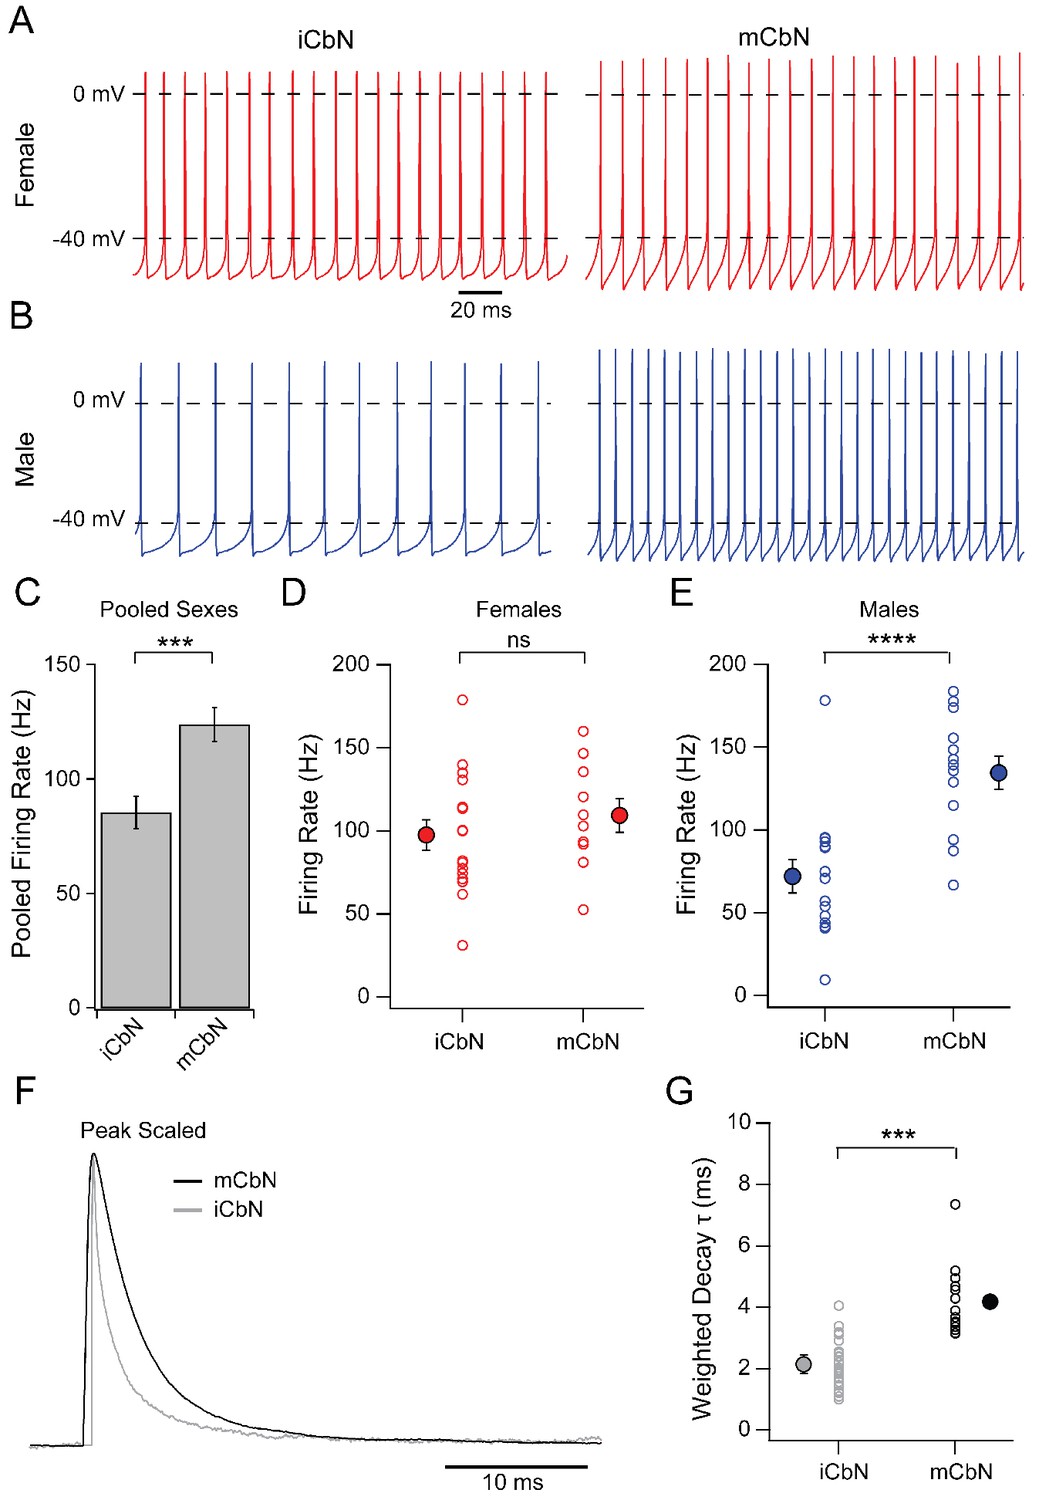
Comparison of mCbN and iCbN intrinsic and synaptic properties in males and females.
(A, B) Spontaneous action potentials of iCbN (left) and mCbN (right) neurons from females (A) and males (B). (C) Mean and SEM of firing rates of iCbN and mCbN neurons, pooled for both sexes. Asterisks, p<0.001. (D, E) Population data for spontaneous firing rates in iCbN and mCbN in females (D) and males (E). Open symbols, individual cells, solid symbols, mean ± SEM. Asterisks, p<0.0001, n.s., not significant. (F) Normalized electrically evoked IPSCs in mCbN (black) and iCbN (grey) neurons, overlaid to illustrate kinetic differences. (G) Population data for weighted time constants for IPSCs in the iCbN and mCbN. Open symbols, individual cells, solid symbols, mean ± SEM. Asterisks, p<0.001. All iCbN data is from Mercer et al. (2016).
Figure 5
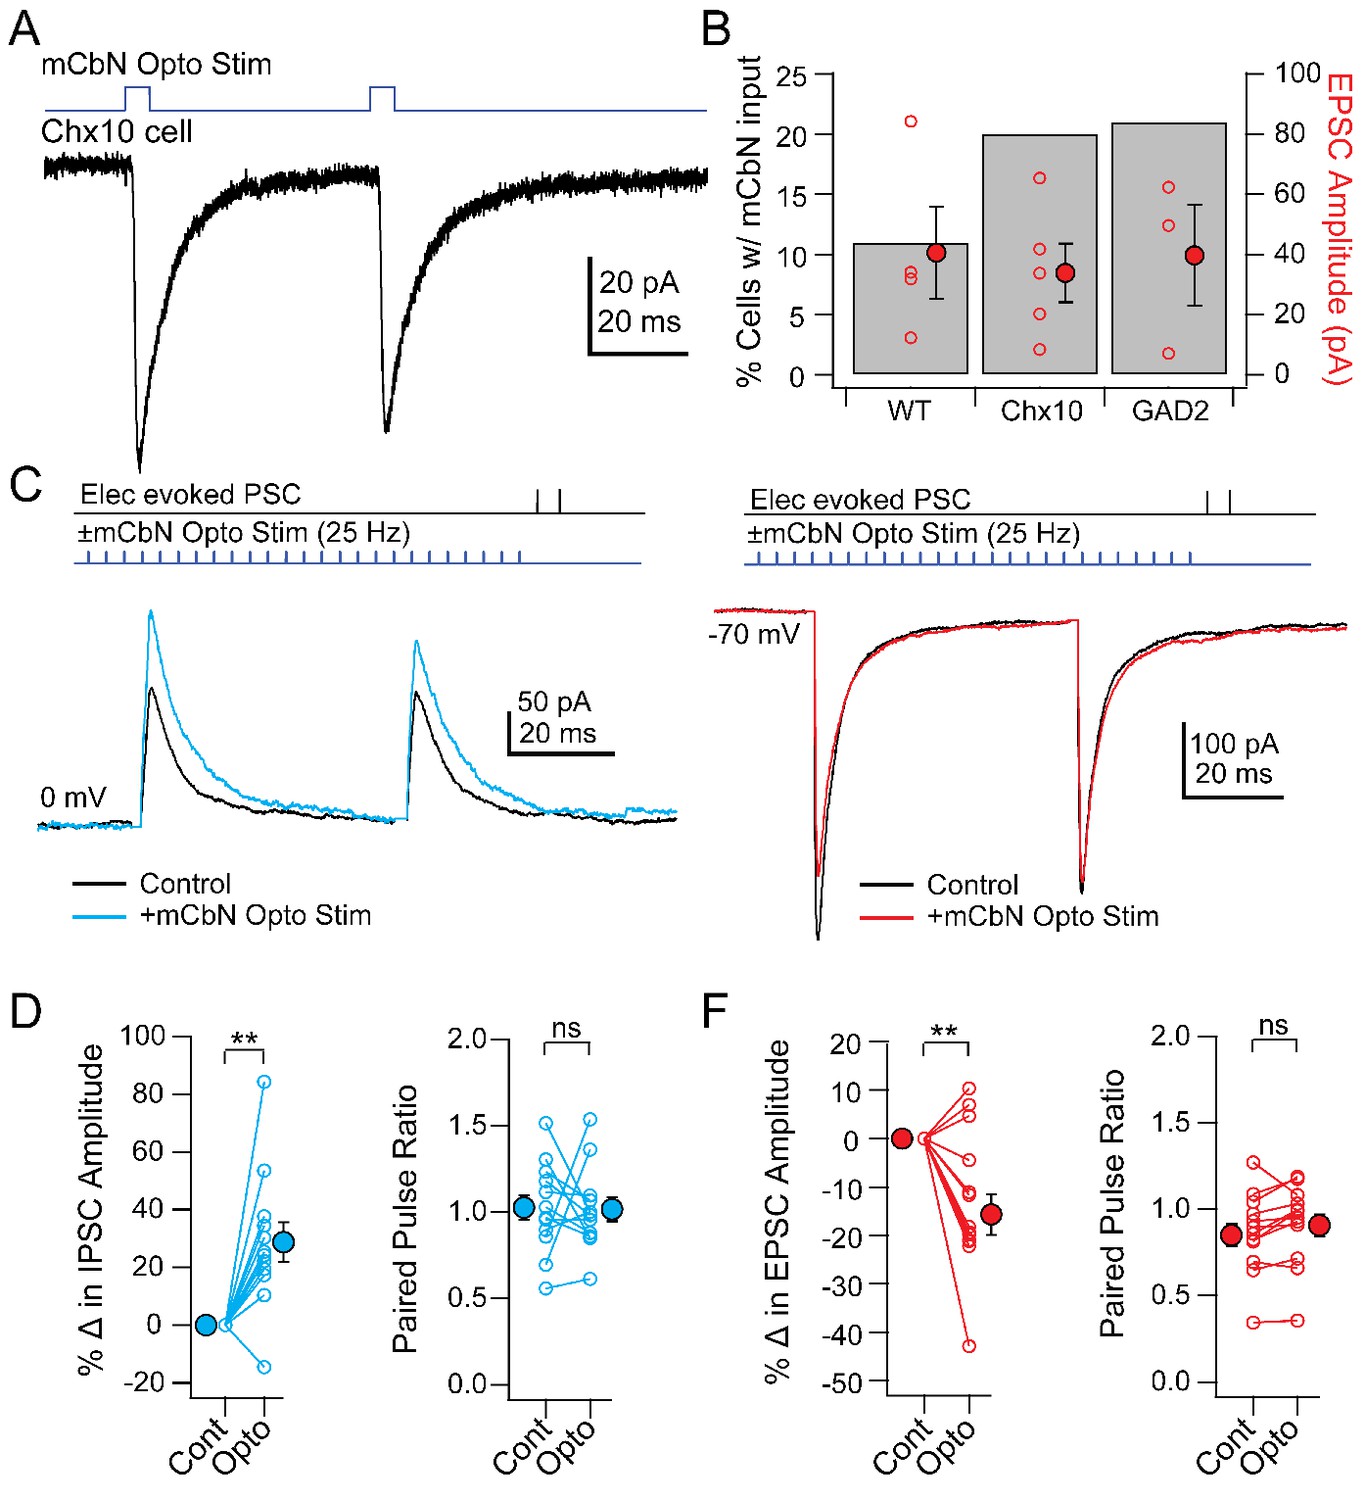
Direct and modulated PSCs in Chx10 cells evoked by mCbN optogenetic stimulation.
(A) EPSCs evoked in a Chx10 cell by optogenetic stimulation of mCbN afferents. (B) Percentage of tested cells in which responses could be elicited (grey bars) and population data for EPSC amplitudes (red circles), for unlabeled vlPAG cells (WT), Chx10 neurons, and GAD2 neurons. Open symbols, individual cells, solid symbols, mean ± SEM. (C) Top, protocol for stimulating electrically (upper line) and optogenetically (lower line). Bottom, IPSCs without (black) and with (color) mCbN stimulation. (D) Population data for percent change in IPSC (left) and PPR (right) without (Cont) and with mCbN (Opto) stimulation. Open symbols, individual cells, solid symbols, mean ± SEM. Asterisks, p<0.01, n.s., non-significant. (E, F) As in C, D for EPSCs.
Figure 6
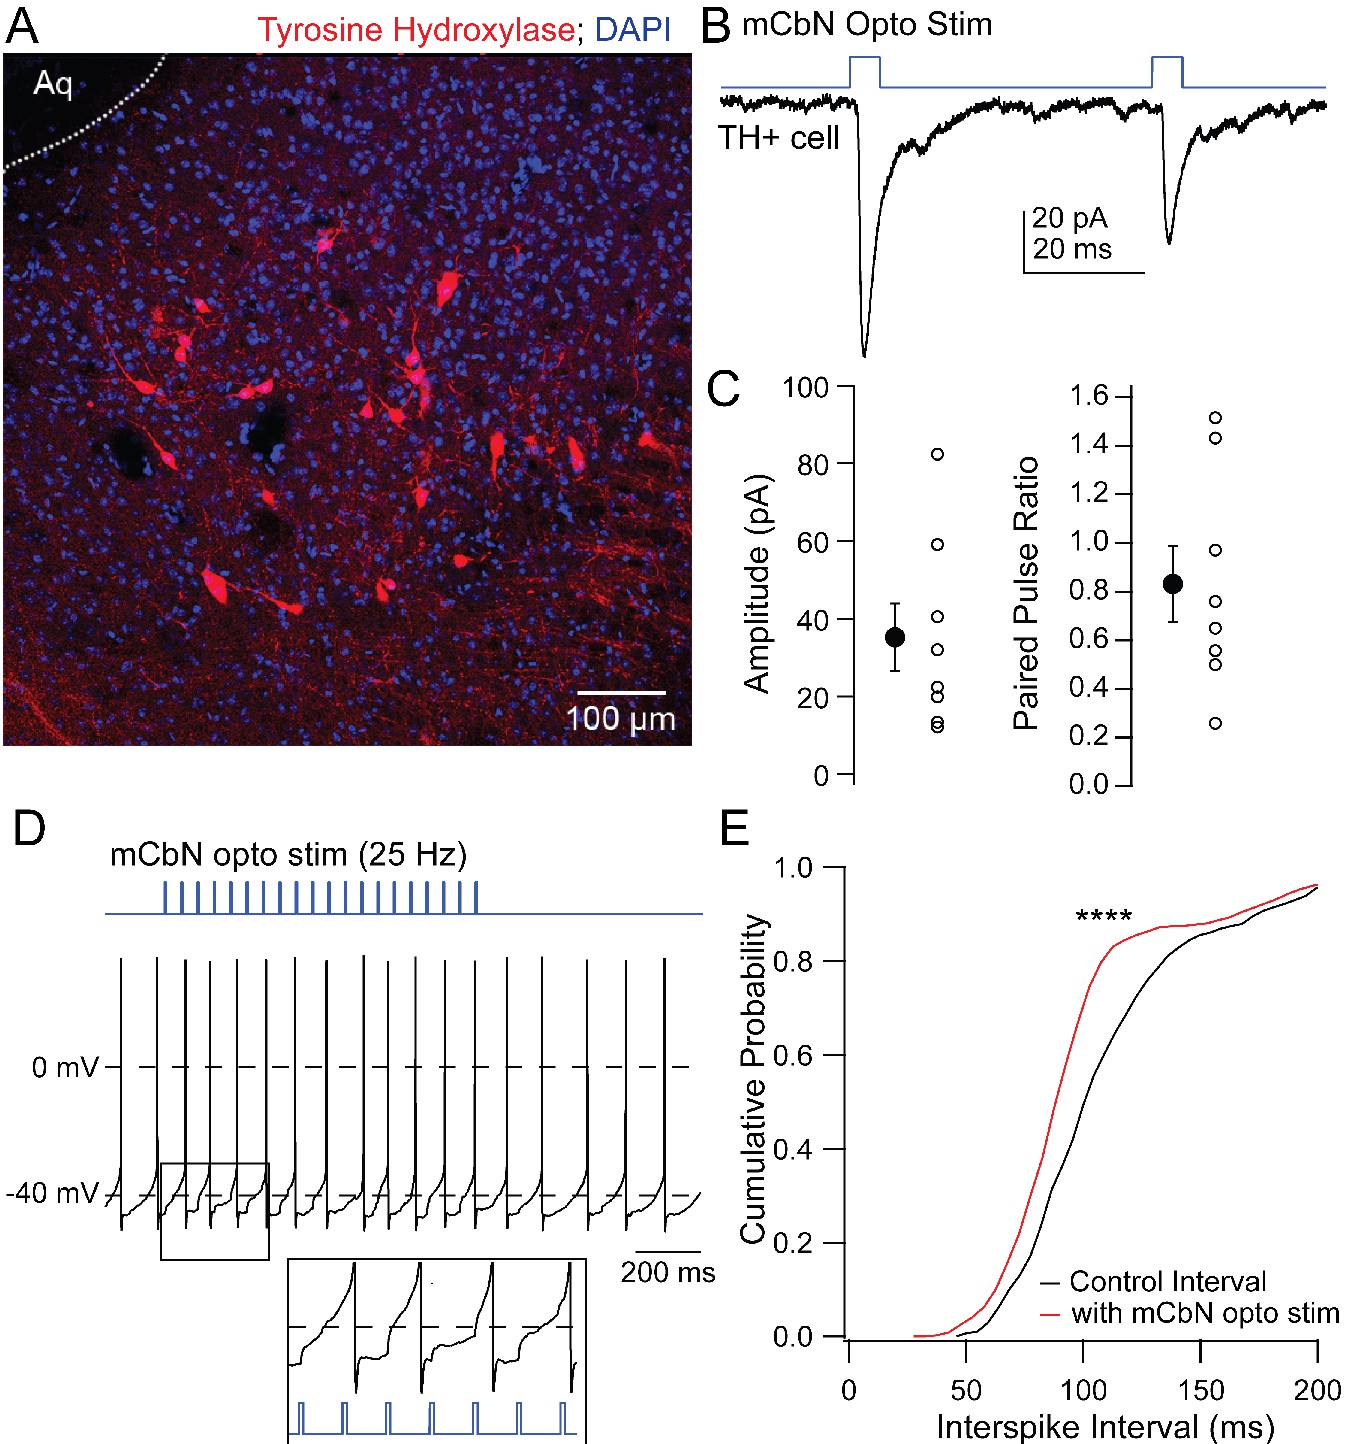
EPSCs in TH neurons evoked by mCbN activation.
(A) Distribution of TH neurons in the vlPAG. (B) Optogenetically evoked EPSCs in a TH neuron. (C) Population data for the first EPSC (left) and PPR (right) evoked as in B. Open symbols, individual cells, solid symbols, mean ± SEM. (E) Stimulus protocol (top) and action potentials in a TH neuron (bottom). Inset, magnification of stimulus-evoked EPSPs. (F) Cumulative probability distribution of interspike intervals before (black) and during (red) mCbN stimulation. Asterisks, p<0.0001.
Figure 7

Modulation of PSCs in unlabeled vlPAG cells evoked by TH neuron stimulation.
(A) Top, protocol for stimulating electrically (upper line) and optogenetically (lower line). Bottom, IPSCs without (black) and with (color) mCbN stimulation. (B) Population data for percent change in IPSC (left) and PPR (right) without (Cont) and with mCbN (Opto) stimulation. Open symbols, individual cells, solid symbols, mean ± SEM. Asterisks, p<0.05, n.s., non-significant. (C, D) As in A, B for EPSCs. (E) Optogenetic stimulus to TH-ChR2 neurons and lack of direct synaptic responses at −70 mV (top) and 0 mV (bottom). (F) Population data for the absence of synaptic responses at −70 mV (left) and 0 mV (right) evoked by optogenetic TH-ChR2 neuron stimulation. (G, H) As in A, B for IPSCs with intracellular GDP-βS.
Figure 8
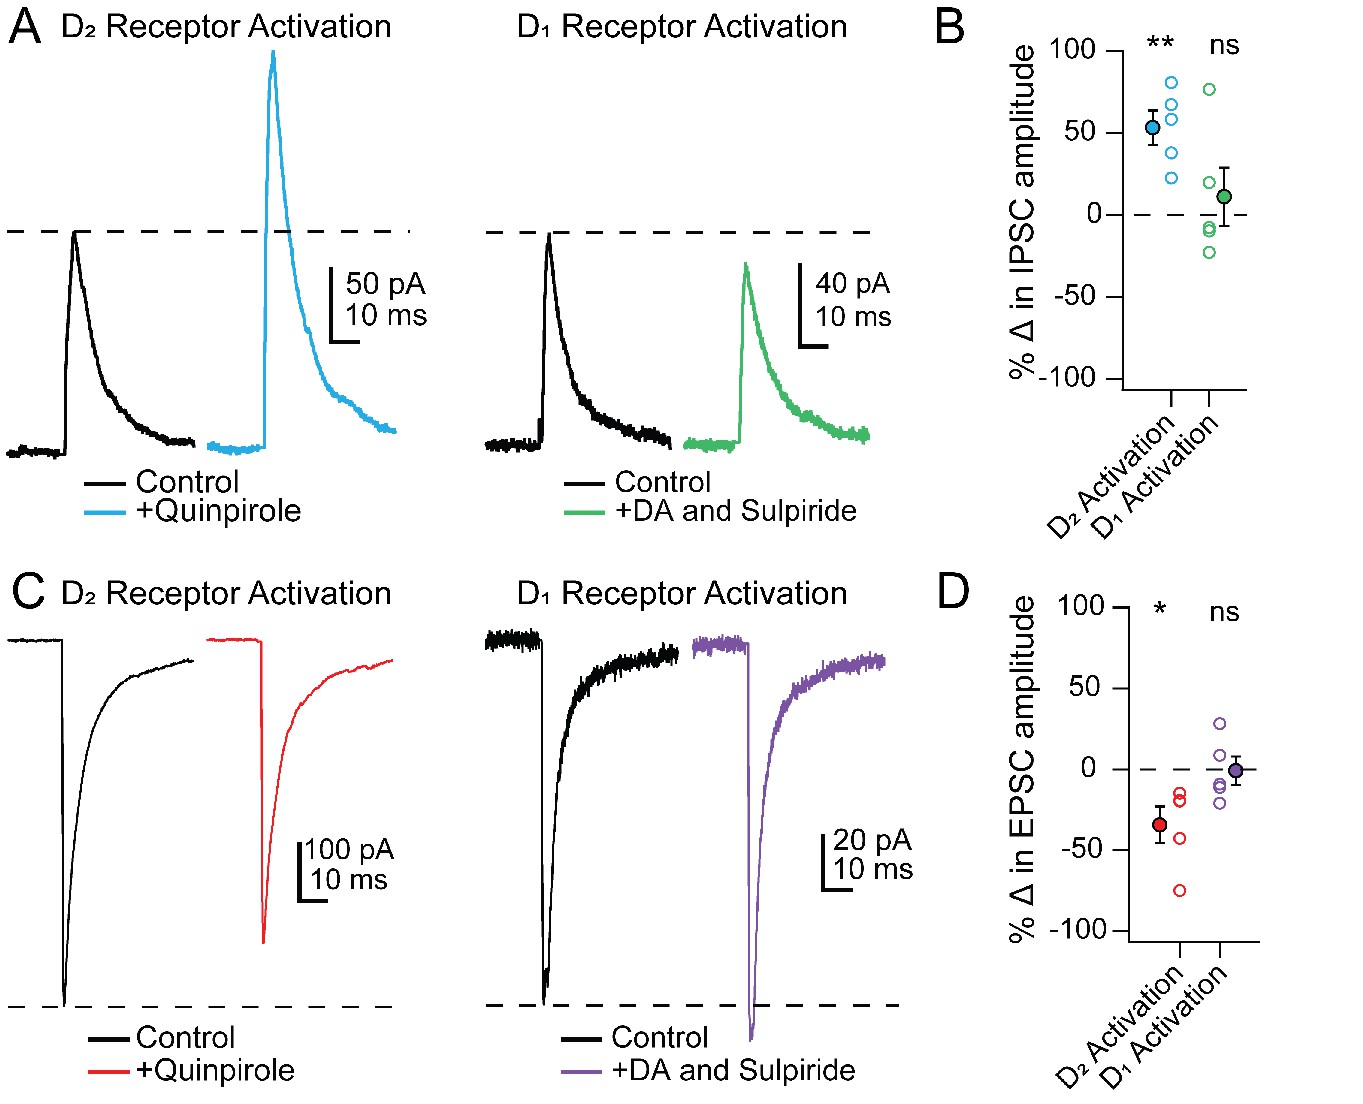
PSC modulation in Chx10 cells by D2 but not D1 receptor activation.
(A) Left, Electrically evoked IPSCs before (black) and during (color) bath application of the D2-receptor agonist quinpirole (25 μM). Right, As at left, but with D1 receptors activated by dopamine while D2 receptors were blocked by sulpiride (1 μM). (B) Population data for percent change in IPSC with either D2 or D1 receptor activation. Open symbols, individual cells, solid symbols, mean ± SEM. Asterisks, p<0.01, n.s., non-significant. (C, D) As in A, B but for EPSCs.
Figure 9
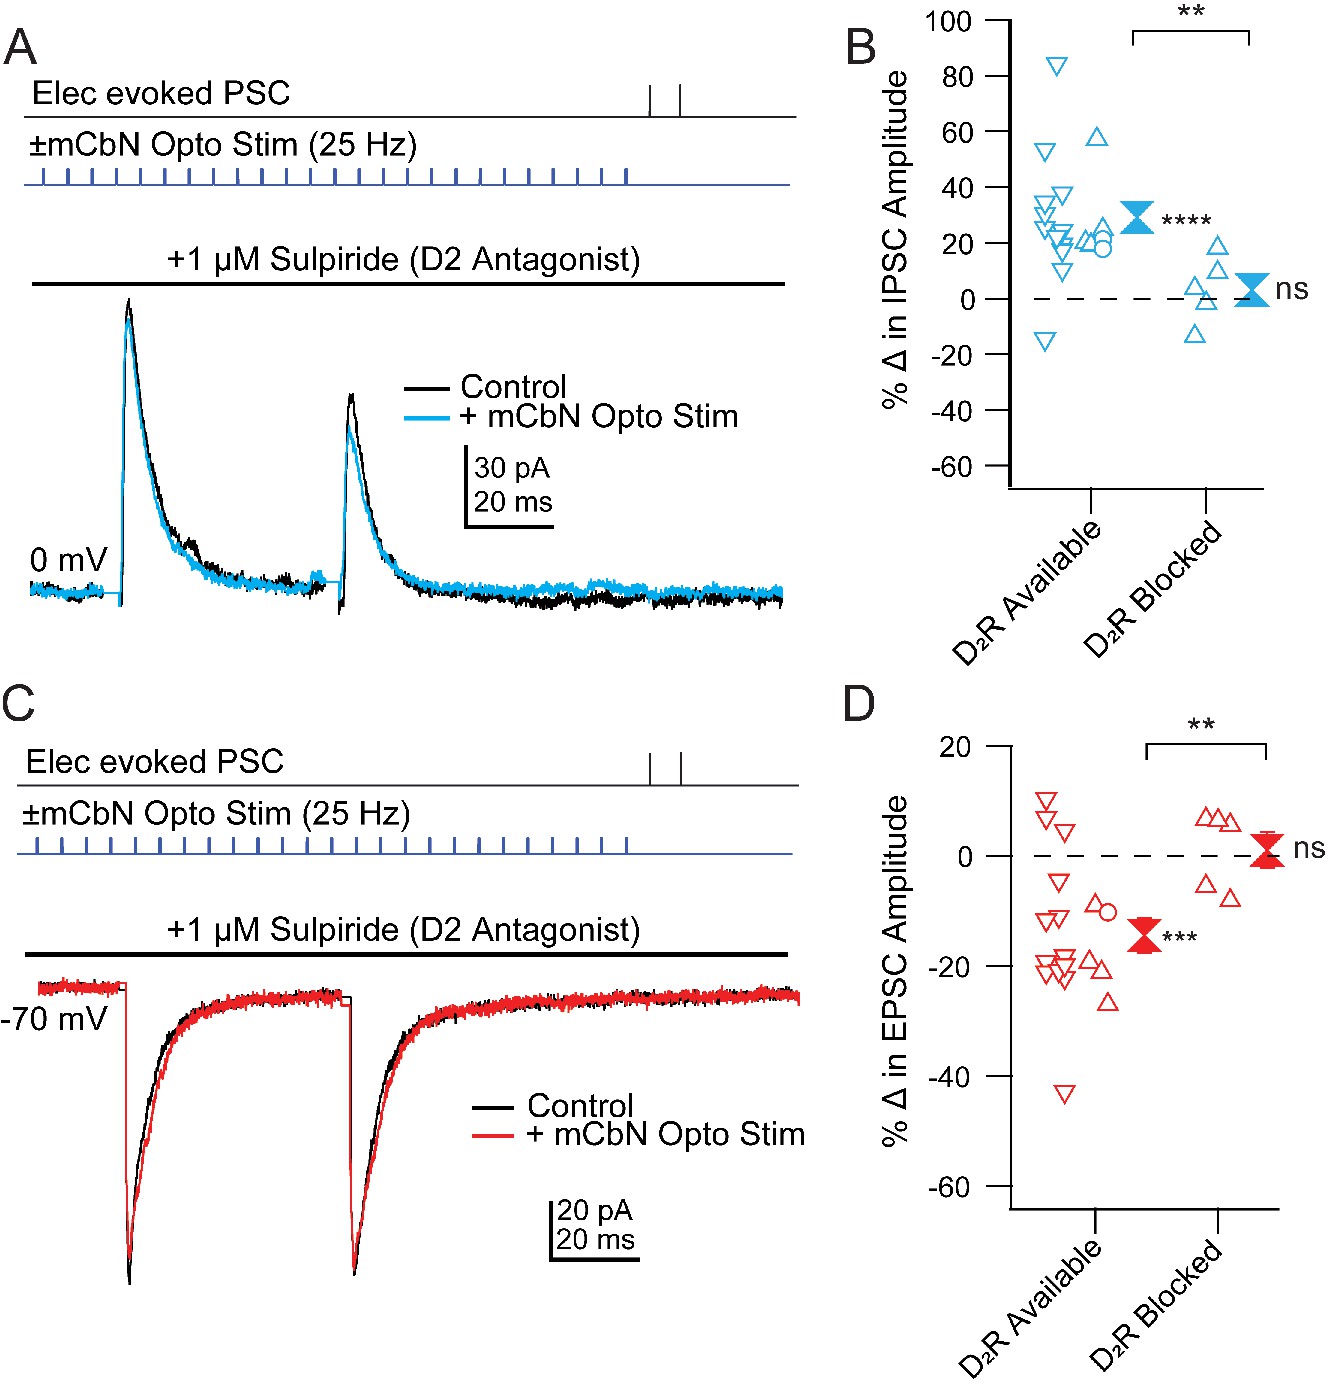
Blockade of mCbN-dependent modulation of Chx10 neuron PSCs by D2 receptor antagonists.
(A) Top, protocol for stimulating electrically (upper line) and optogenetically (lower line). Bottom, IPSCs without (black) and with (color) mCbN stimulation in the presence of sulpiride. (B) Population data for percent change in IPSC with D2 receptors available or blocked. Open symbols, individual cells. Control data with D2 receptors available include cells with no antagonists from Figure 5D (downward triangles), cells with D1 antagonists (open circles), and cells from slices in which D2 receptors were subsequently blocked (upward triangles). Solid symbols, mean of up and down triangles ± SEM. Two asterisks, p<0.01 (unpaired t-test with and without D2 receptors blocked), three asterisks, p<0.001 (one sample t-test), n.s., non-significant (one sample t-test). (C, D) As in A, B for EPSCs.
Figure 10
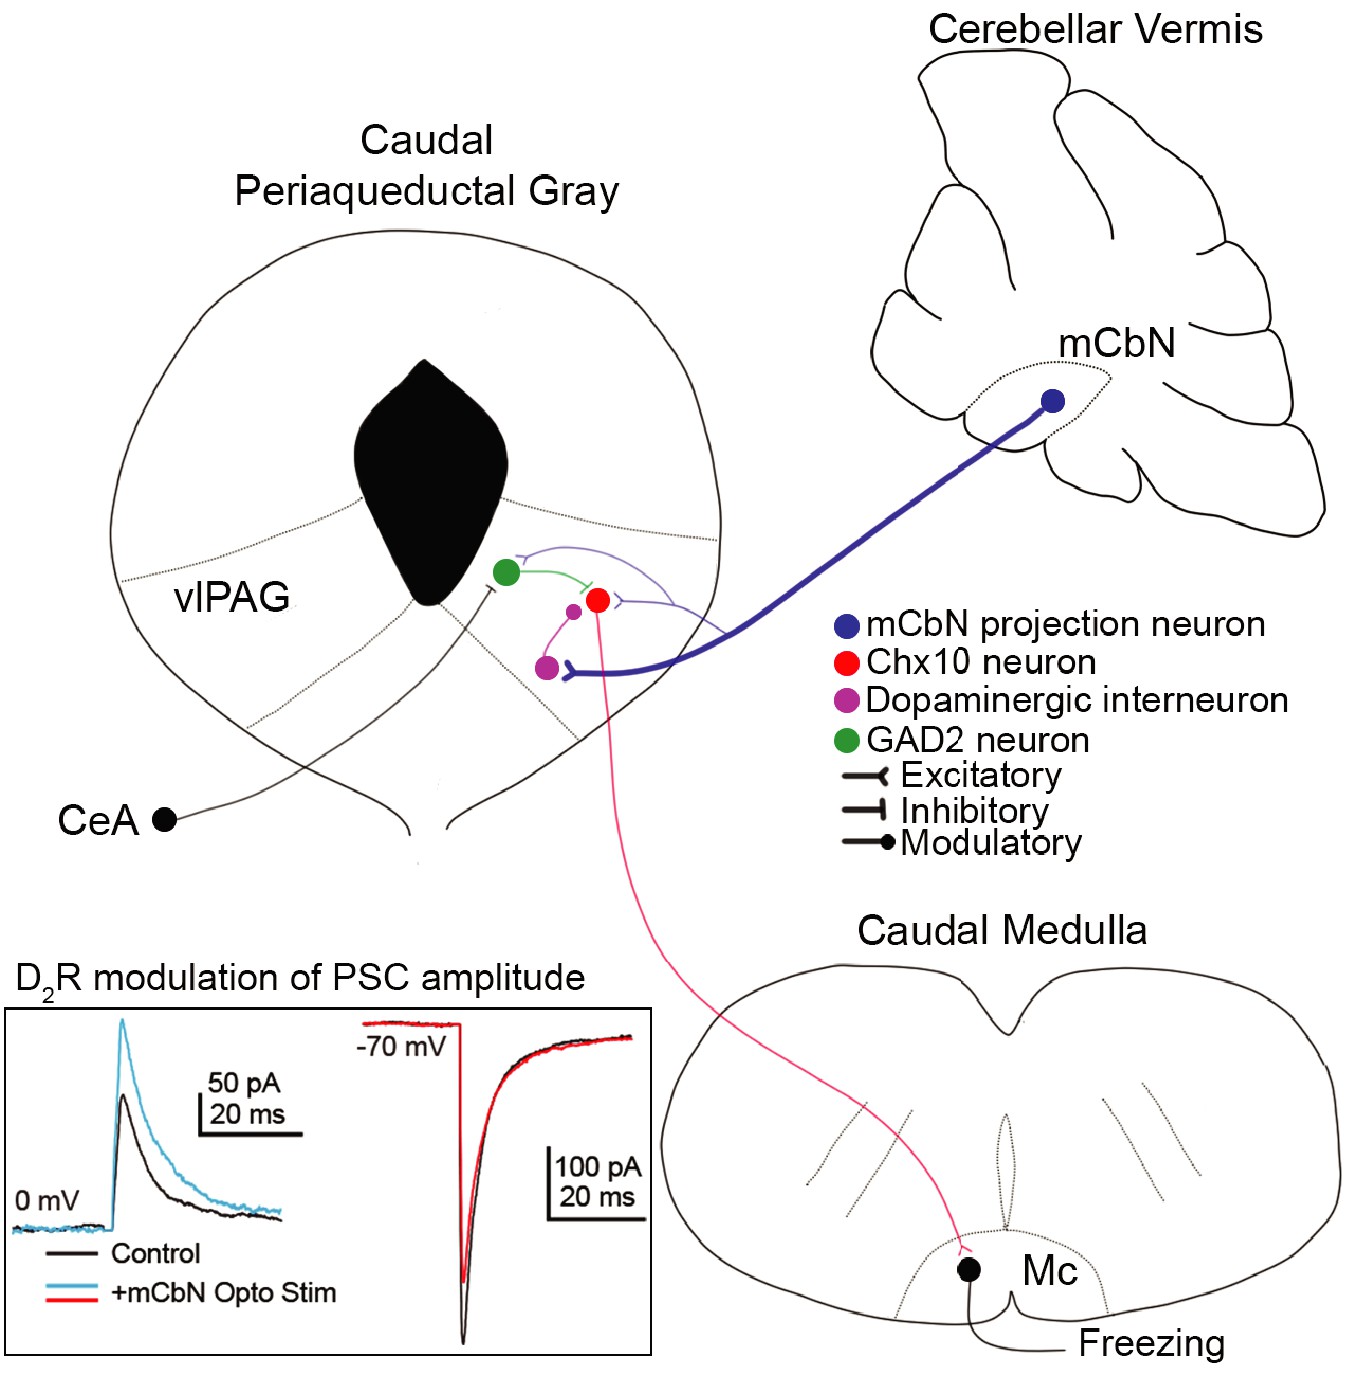
Cerebellar influence on the vlPAG freezing-related microcircuit.
(A) mCbN afferents (blue) excite Chx10 (red), GAD2 (green) and TH (purple) neurons in the vlPAG, with the strongest functional connection occurring between mCbN neurons and TH neurons. Chx10 neurons excite the magnocellular reticular nucleus (Mc) of the caudal medulla, which drives freezing output. Within the vlPAG, TH neurons modulate PSCs on Chx10 neurons via D2 receptors (inset, traces overlaid from Figure 5).
Videos
Video 1
Optogenetic stimulation of Chx10 neurons in vlPAG elicits freezing.
Responses evoked by optogenetic activation of Chx10 neurons in the vlPAG (10 ms, 50 Hz, 5 s) is indicated by ‘Light On.’.
Tables
Table 1
Intrinsic properties of Chx10+ vlPAG neurons.
| Parameter | All Cells (n=26) | Males (n=15) | Females (n=11) | p value |
|---|---|---|---|---|
| Intrinsic Properties | ||||
| Membrane Resistance (MΩ) | 584.1 ± 47.3 | 648.6 ± 62.2 | 496.0 ± 66.9 | 0.1 |
| Capacitance (pF) | 24.2 ± 1.3 | 23.4 ± 1.5 | 25.2 ± 2.5 | 0.6 |
| Interspike Vm (mV)* | -48.7 ± 1.0 | -50.6 ± 1.0 | -45.9 ± 1.6 | 0.02 |
| Action Potential Properties | ||||
| Spontaneous Rate (spikes/s) | 5.8 ± 1.2 | 4.5 ± 1.4 | 7.6 ± 1.9 | 0.2 |
| Maximum dV/dt (V/s) | 155.2 ± 11.4 | 153.9 ± 13.5 | 157.0 ± 20.5 | 0.9 |
| Estimated Peak INa (nA) | 4.0 ± 0.5 | 3.7 ± 0.5 | 4.3 ± 0.9 | 0.6 |
| Minimum dV/dt (V/s) | -63.9 ± 5.0 | -55.1 ± 4.0 | -76.0 ± 9.5 | 0.06 |
| Estimated Peak IK (nA) | 1.6 ± 0.2 | 1.3 ± 0.1 | -2.1 ± 0.4 | 0.06 |
| Halfwidth (ms) | 1.0 ± 0.1 | 1.1 ± 0.07 | 0.9 ± 0.1 | 0.06 |
| Amplitude (mV) | 55.9 ± 2.2 | 57.3 ± 2.7 | 54.1 ± 3.5 | 0.5 |
| Threshold (mV) | -31.6 ± 0.8 | -32.5 ± 1.0 | -30.4 ± 1.4 | 0.2 |
| Rheobase at -70 mV (pA) | 9.8 ± 0.8 | 9.6 ± 1.0 | 10.0 ± 1.4 | 0.8 |
-
* indicates significant difference between males and females.
Table 2
Intrinsic properties of medial cerebellar nucleus neurons.
| Parameter | All Cells (n=28) | Males (n=15) | Females (n=13) | p value |
|---|---|---|---|---|
| Intrinsic Properties | ||||
| Membrane Resistance (MΩ) | 77.5 ± 12.8 | 62.2 ± 8.1 | 95.5 ± 17.0 | 0.08 |
| Capacitance (pF) | 68.6 ± 5.5 | 79.7 ± 12.6 | 55.2 ± 5.8 | 0.09 |
| Action Potential Properties | ||||
| Spontaneous Rate (spike/s)* | 122.8 ± 6.6 | 137.4 ± 8.8 | 105.9 ± 9.0 | 0.01 |
| Maximum dV/dt (V/s) | 294.3 ± 19.0 | 270.6 ± 16.6 | 321.8 ± 34.6 | 0.2 |
| Estimated Peak INa (nA) | 19.4 ± 2.0 | 20.8 ± 2.9 | 17.9 ± 2.8 | 0.5 |
| Minimum dV/dt (V/s) | -270.7 ± 20.1 | -242.1 ± 19.4 | -303.4 ± 38.4 | 0.2 |
| Estimated Peak IK (nA) | 17.8 ± 1.8 | 18.4 ± 2.4 | 17.2 ± 3.0 | 0.7 |
| Halfwidth (ms) | 0.27 ± 0.02 | 0.27 ± 0.2 | 0.27 ± 0.4 | 0.9 |
| Ampliutde (mV) | 53.2 ± 1.5 | 51.7 ± 1.7 | 54.9 ± 2.8 | 0.3 |
| Threshold (mV) | -42.3 ± 0.7 | -41.7 ± 1.0 | -43.0 ± 1.1 | 0.4 |
-
* indicates significant difference between males and females.
Key resources table
| Reagent type (species) or resource | Designation | Source or reference | Identifiers | Additional Information |
|---|---|---|---|---|
| Strain, strain background Mus musculus | Chx10-cre | Obtained from Jessell Laboratory (Crone et al., 2008) | ||
| Strain, strain background Mus musculus | tdTomato (B6.Cg-Gt(ROSA)26Sortm14(CAG-tdTomato)Hze/J) | Jackson Laboratories | Stock: 007914 | |
| Strain, strain background Mus musculus | ChR2-EYFP (B6.Cg-Gt(ROSA)26 Sortm32(CAG-COP4*H134R/EYFP)Hze/J) | Jackson Laboratories | Stock: 024109 | |
| Strain, strain background Mus musculus | GAD2-cre (B6N.Cg-Gad2tm2(cre)Zjh/J) | Jackson Laboratories | Stock:019022 | |
| Strain, strain background Mus musculus | TH-cre (B6.Cg-7630403G23 RikTg(Th-cre)1Tmd/J) | Jackson Laboratories | Stock: 008601 | |
| Strain, strain background Mus musculus | L7-Cre (B6.Cg-Tg(Pcp2-cre)3555Jdhu/J) | Jackson Laboratories | Stock: 010536 | |
| Recombinant DNA reagent | AAV2-EF1α-DIO-hChR2(H134R)-eYFP | UNC Viral Vector Core | ||
| Recombinant DNA reagent | AAV2-hSyn-hChR2 (H134R)-eYFP-WPRE-PA | UNC Viral Vector Core | ||
| Recombinant DNA reagent | AAVdj-hSyn-hChR2(E123A)-eYFP-WPRE | Stanford Viral Vector Core | ||
| Recombinant DNA reagent | AAV2-EF1α-DIO-eYFP | UNC Viral Vector Core | ||
| Chemical compound, drug | Cholera Toxin Subunit B (Recombinant), Alexa Fluor 488 Conjugate | ThermoFisher Scientific | Cat. No. C22841 | |
| Chemical compound, drug | Lumafluor red retrobeads | LumaFluor | Red Retrobeads IX | |
| Chemical compound, drug | DNQX | Tocris | Cat. No. 0189 | |
| Chemical compound, drug | CPP | Tocris | Cat. No. 0247 | |
| Chemical compound, drug | CPCCOEt | Tocris | Cat. No. 1028 | |
| Chemical compound, drug | Sulpiride | Tocris | Cat. No. 0894 | |
| Chemical compound, drug | SCH 23390 | Tocris | Cat. No. 0925 | |
| Chemical compound, drug | Prazosin | Tocris | Cat. No. 0623 | |
| Chemical compound, drug | Sotalol | Tocris | Cat. No. 0952 | |
| Chemical compound, drug | Quinpirole | Tocris | Cat. No. 1061 | |
| Chemical compound, drug | Dopamine | Tocris | Cat. No. 3548 | |
| Chemical compound, drug | Isoproterenol | Tocris | Cat. No 17.47 | |
| Software, algorithm | FreezeFrame | Actimetrics (www.actimetrics.com) |
Additional files
Download links
A two-part list of links to download the article, or parts of the article, in various formats.
Downloads (link to download the article as PDF)
Open citations (links to open the citations from this article in various online reference manager services)
Cite this article (links to download the citations from this article in formats compatible with various reference manager tools)
Cerebellar modulation of synaptic input to freezing-related neurons in the periaqueductal gray
eLife 9:e54302.
https://doi.org/10.7554/eLife.54302


