Caenorhabditis elegans nuclear RNAi factor SET-32 deposits the transgenerational histone modification, H3K23me3
- Department of Molecular Biology and Biochemistry, Rutgers the State University of New Jersey, United States
- Department of Biochemistry, Albert Einstein College of Medicine, Bronx, United States
Figures
Figure 1 with 3 supplements
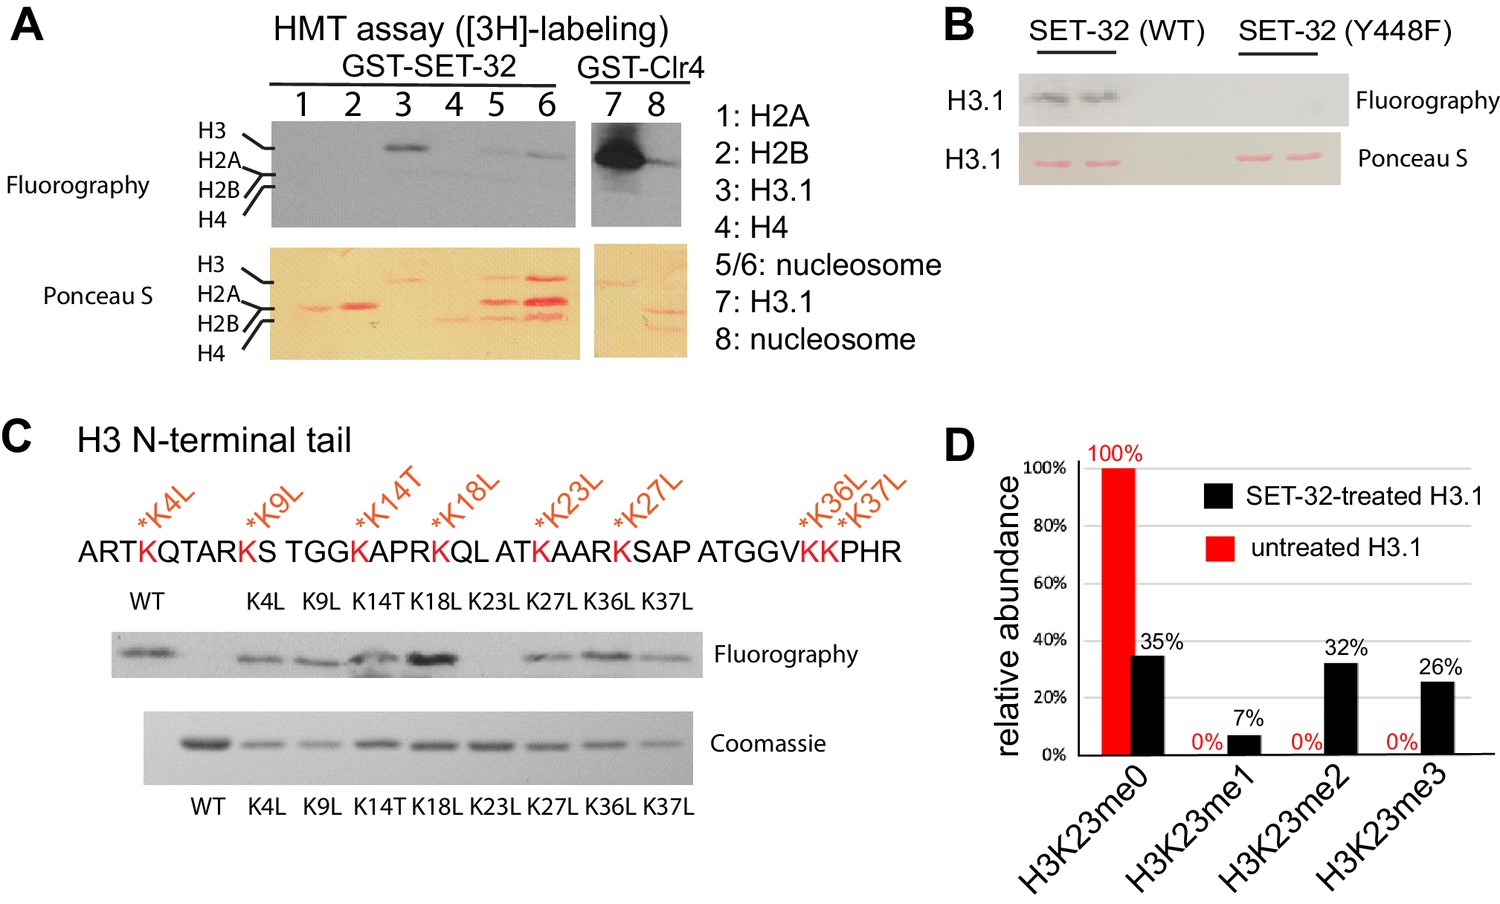
SET-32 methylates H3K23 in vitro.
(A) Detecting the HMT activity of GST-SET-32 by [3H]-labeling and fluorography. Individual core histone proteins and in vitro assembled mononucleosome made of 601 DNA and recombinant C. elegans H2A, H2B, and H3.1, and Xenopus H4. Xenopus H4 was used because C. elegans H4 expression was not successful and there is only one amino acid difference between the two. GST-Clr4 was used as a positive control. (B) Fluorography of GST-SET-32 (WT and Y448) HMT assay using histone H3.1. (C) Top panel: fluorography of GST-SET-32 HMT assay using WT H3.1 and eight lysine mutants of H3.1. An empty lane was added between the WT H3 and H3K4L for HMT assay to avoid contamination between the WT and H3K4L lanes. Bottom panel: Coomassie staining of WT and mutant H3.1. (D) Mass spectrometry analysis of GST-SET-32-treated H3.1 versus untreated H3.1. The percentages of H3K23-containing fragments with H3K23me0, 1, 2, and 3 are indicated above bars.
Figure 1—figure supplement 1
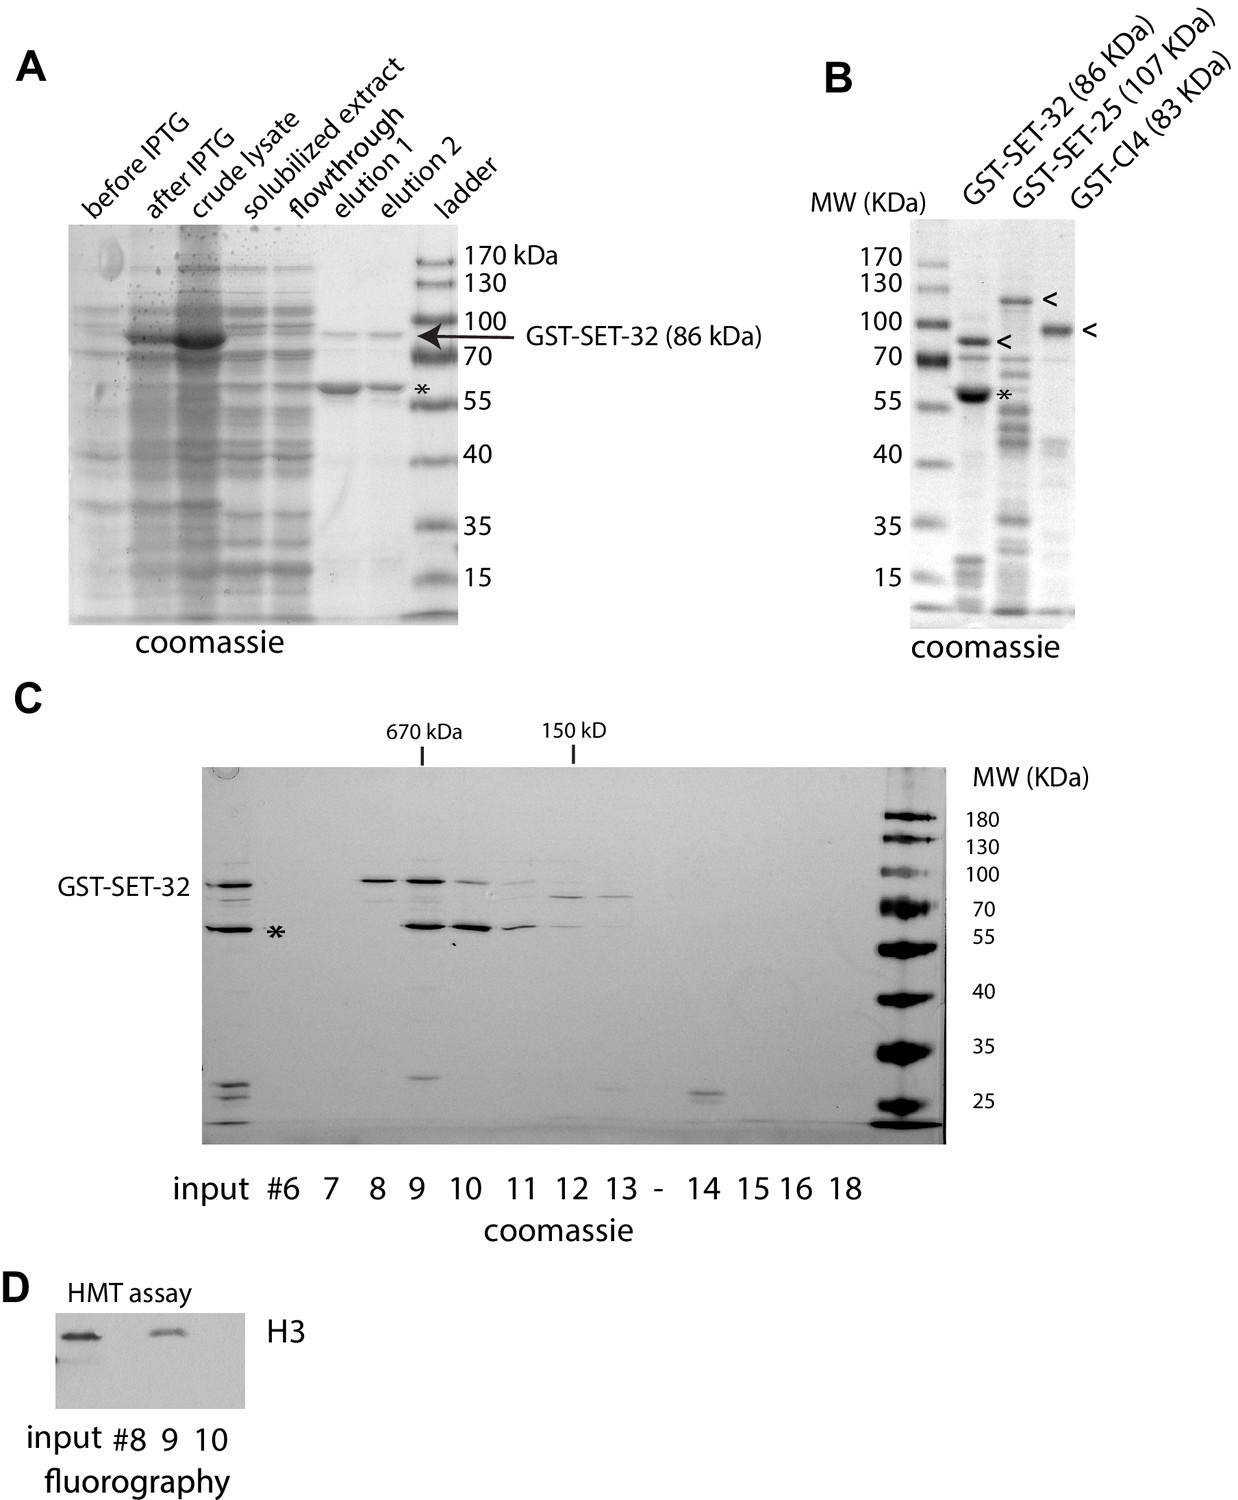
Recombinant GST-fusion protein purification.
(A) SDS-PAGE/coomassie analysis of GST-SET-32 expression and purification. The strong reduction of GST-SET-32 after clear spin (compare the crude lysate and solubilized extract) indicates that most of the GST-SET-32 was expressed as inclusion body. (B) SDS-PAGE/coomassie of the GST-SET-32, GST-SET-25, and SET-Clr4 purification products. The full-length GST fusion proteins are indicated by <. (C) SDS-PAGE/silver stain analysis of size exclusion chromatography fractions (Superdex 200 10/300 GL column from GE, 1 ml fractions) of the GST-SET-32 purification product. The main co-purified 60 KDa protein (indicated by *) and the GST-SET-32-containing fractions largely overlap. Removing the GST-tag by HRV 3C protease did not change the overlapping of SET-32 and the 60 KDa protein in size exclusion chromatography (data not shown). (D) Fluorography of HMT assays ([3H]-labeling of H3) using fractions 8, 9, and 10, as well as the input, of the size exclusion chromatography of GST-SET-32. Note that the peak GST-SET-32 fraction (#9) has the HMT activity.
Figure 1—figure supplement 2
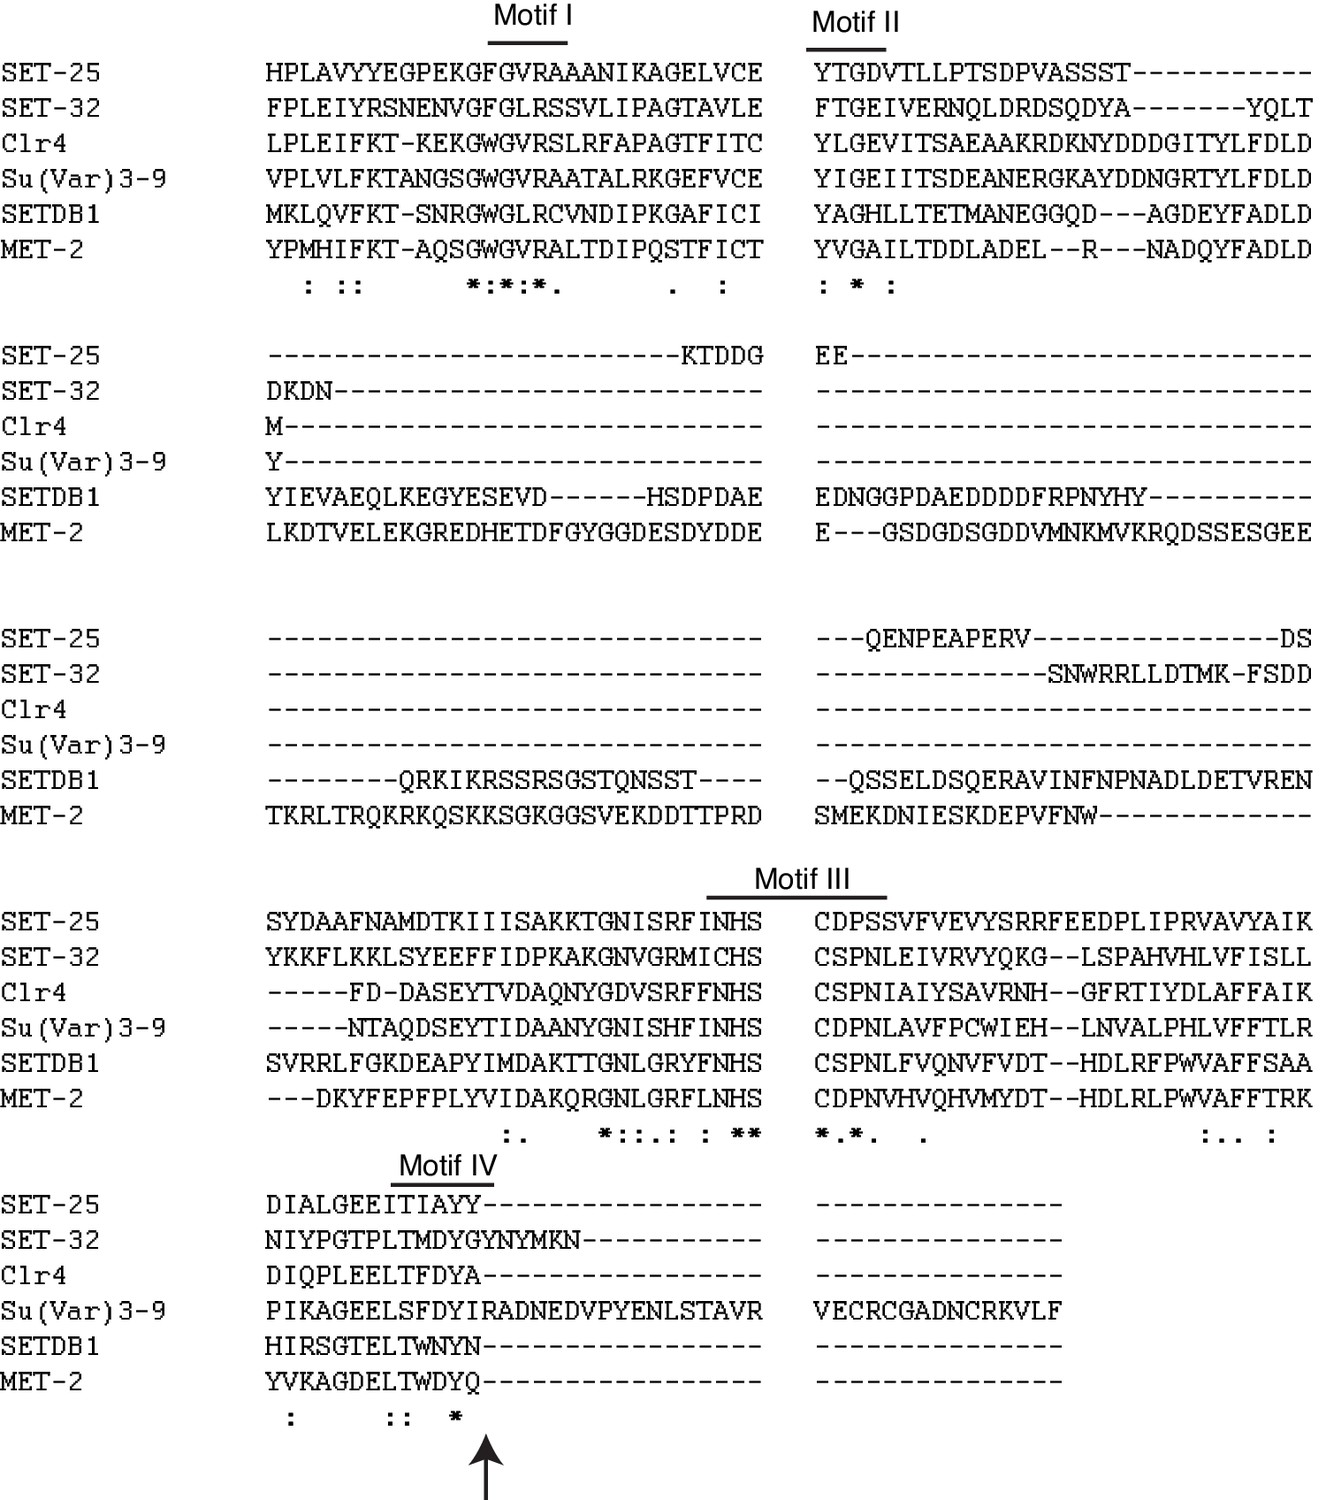
Alignment of SET domains of histone methyltransferases.
The four conserved motifs and Y448 (in SET-32) position are indicated. Arrow indicates Y448F residue.
Figure 1—figure supplement 3

Recombinant histone purification and histone octamer assembly.
(A). C. elegans H3.1 protein sequence, lysine residues within the first 40 residues in bold. The differences with human H3.1 sequence are indicated. (B) SDS-PAGE/coomassie analysis of C. elegans histone expression and purification. Lysate before HiTrap SF fractionation are shown to indicate expression of H2A, H2B, and H3, but not H4 in E. coli. Peak fractions of HiTrap SF chromatography are shown for H2A, H2B, and H3. (C) Size exclusion fractionation of histone octamer assembly. C. elegans H2A, H2B, H3 and Xenopus H4 were used. Xenopus H4 (Histone Source) is identical to C. elegans H4 except at position 74 (threonine in Xenopus and cysteine for C. elegans). (C. elegans and Xenopus H2Bs have the identical protein sequence. The percentages of identity between the two species are 81.7% and 95.6% for H2A and H3, respectively.).
Figure 2 with 2 supplements

dsRNA triggers transgenerational H3K23me3 at the RNAi target gene.
(A) H3K23 methylation levels are plotted as a function of position along the oma-1 locus. The top panel shows input DNA for the three ChIP experiments: H3K23me1 (second panel), H3K23me2 (third panel), H3K23me3 (bottom panel); pink: oma-1 dsRNA, green: GFP dsRNA, black: no dsRNA feed. (B) H3K23me3 and H3K9me3 levels are plotted as a function of position along the smg-1 locus after smg-1 dsRNA feeding. Yellow block highlights dsRNA trigger region. All signals are normalized to sequencing depth. (C-D) oma-1 heritable RNAi assay. H3K23me3 (left) compared with H3K9me3 (right), at oma-1 locus with oma-1 dsRNA feeding at the F0 generation (top panel) and no dsRNA feeding in subsequent generations, F1-F4. Yellow block highlights dsRNA trigger region, orange dashed lines indicate the boundaries of oma-1. The data in this figure is representative of 1 replicate (H3K23me1, H3K23me2, heritable oma-1, smg-1), and three replicates for H3K23me3 and H3K9me3 oma-1.
Figure 2—figure supplement 1

Antibody validation.
(A) Western blotting against C. elegans crude lysate, recombinant H3 with or without H3K23 methylation, as indicated at the top. Antibodies are indicated on the left. (B) Western blotting against recombinant H3, H3K9me3, and H3K23me3. (C) Immunofluorescence analysis: Anti-H3K23me3 and DAPI staining of dissected gonads from adult C. elegans. Scale bar: 10 μm. The antibody was pre-incubated with either H3, H3K23me3, H3K9me3 histone proteins or H3K27me3 peptide, as indicated on the left. Anti-H3 and anti-H3K9me3 antibodies were purchased from Abcam; anti-H3K23me1/2/3 from Active Motif. (D) Same assay as Figure (C) but with whole gonad shown, anti-H3K23me3 and DAPI staining of whole gonads from adult C. elegans. Scale bar: 20 μm. The antibody was pre-incubated with H3K23me3 histone protein in the lower panel.
Figure 2—figure supplement 2
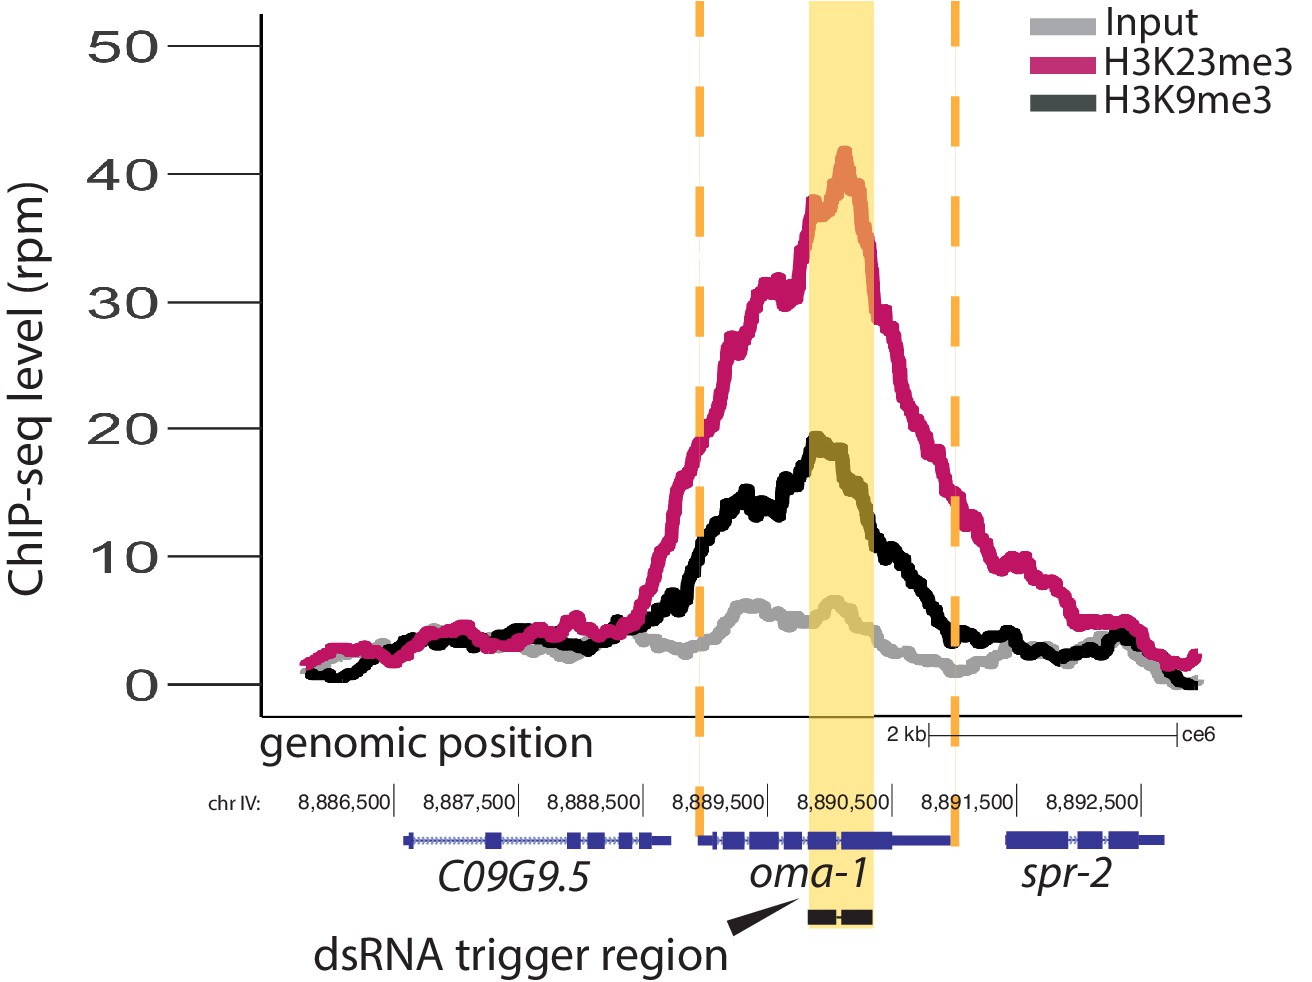
Comparison of dsRNA-mediated H3K9me3 and H3K23me3.
H3K23me3 (pink) compared with H3K9me3 (black), at the oma-1 locus, grey no dsRNA feeding. All signals normalized to sequencing depth. Yellow block highlights dsRNA trigger region, orange dashed lines indicate the boundaries of oma-1.
Figure 3 with 2 supplements
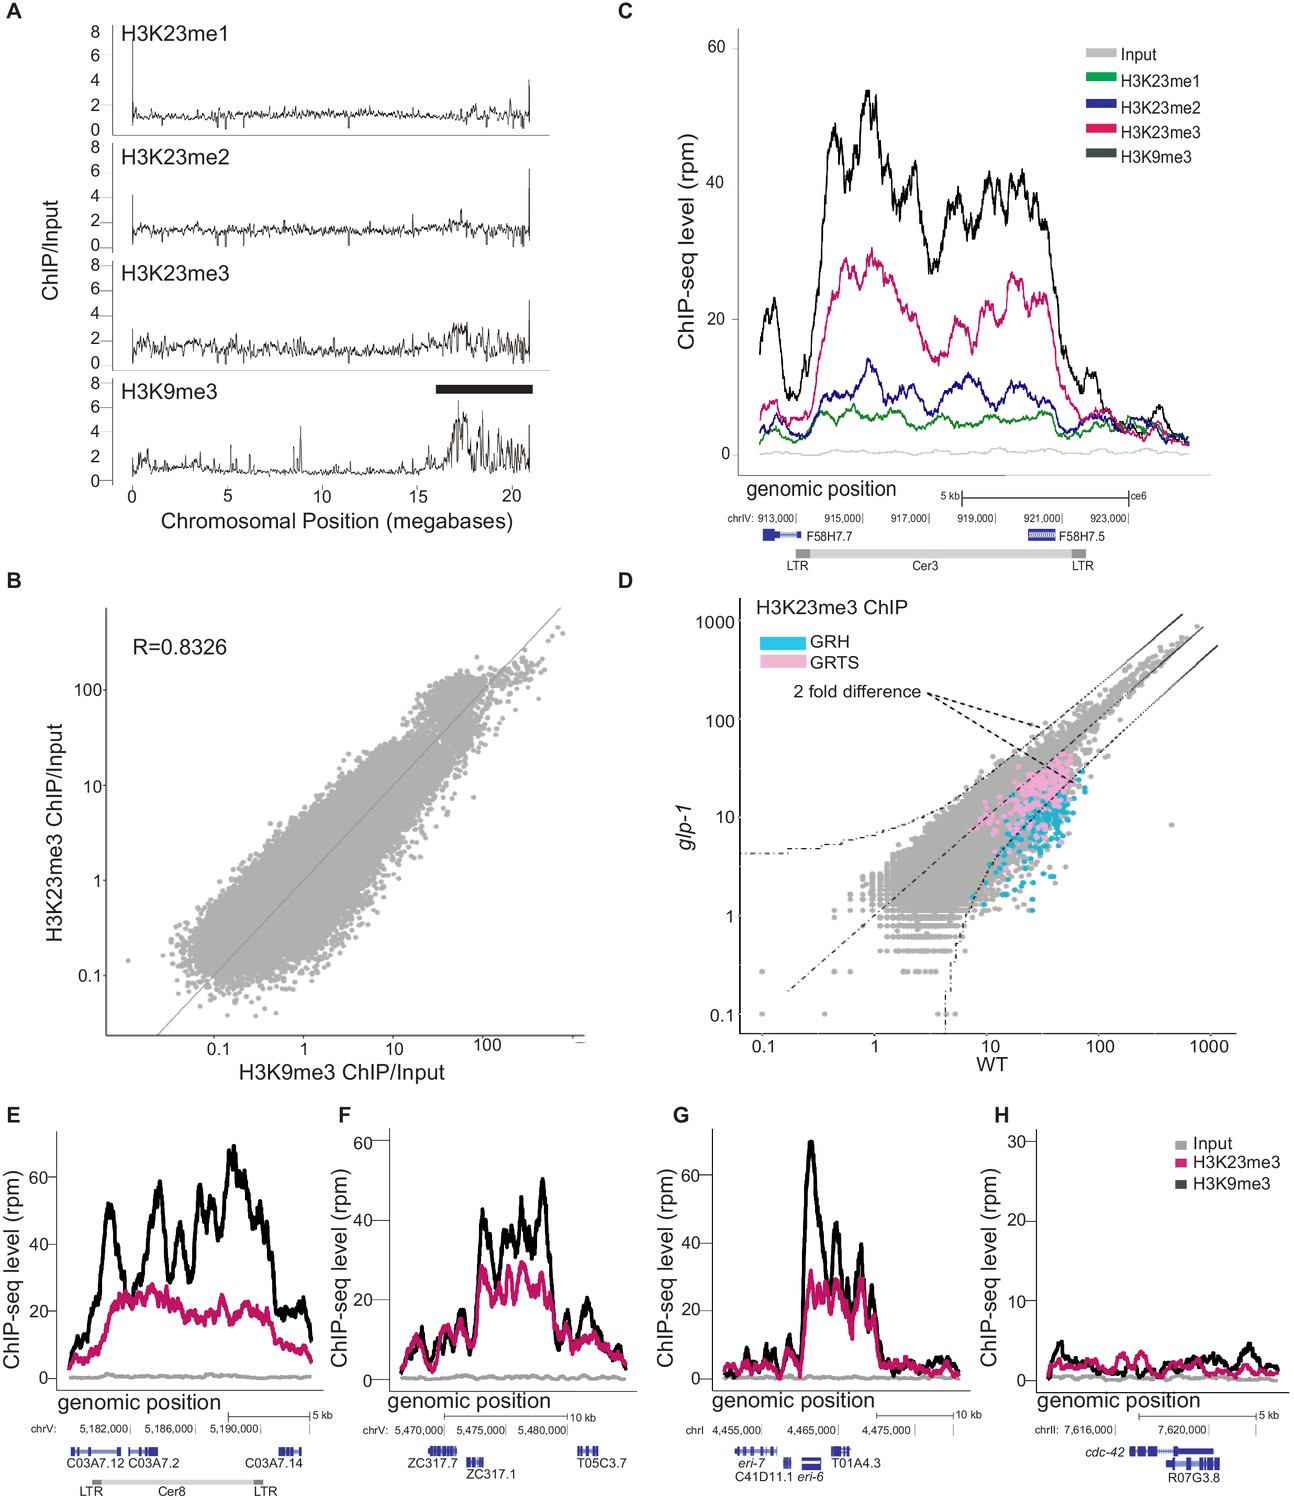
H3K23 methylation profiles at endogenous germline nuclear RNAi targets in WT.
(A) Relative enrichment (y axis) of H3K23me1, H3K23me2, H3K23me3, H3K9me3 ChIP (top to bottom) to input for chromosome V (x axis). Black bar indicates approximate location of meiotic paring center. (B) Scatter plot of H3K23me3 ChIP/input (y axis) vs H3K9me3 ChIP/input (x axis) for the whole genome, in which each point represents a 1kb segment of the genome. Averaged values from two replicates were used. (C) H3K23me1, H3K23me2, H3K23me3, and H3K9me3 enrichment (y axis) at an endogenous germline nuclear RNAi target, Cer3 LTR retrotransposon (x axis). Grey is the input signal. (D) Scatter plot comparing the H3K23me3 whole-genome profiles (1kb windows) in glp-1(e2141) and WT adult animals (25°C). Curved dashed lines indicated two-fold difference (FDR≤0.05). Regions of germline nuclear RNAi-mediated heterochromatin (GRH) are highlighted in blue and regions of germline nuclear RNAi-mediated transcriptional silencing (GRTS) in pink. (E-H) H3K9me3 (black) and H3K23me3 (pink) coverage plots for three other endogenous targets, (E) Cer8, (F) an exemplary GRH locus on chromosome V:5465000-5485000, (G) eri-6, and (H) a control euchromatin locus, cdc-42. All signals are normalized to sequencing depth. The data in this figure is representative of 1 replicate (H3K23me1, H3K23me2, H3K27me3, glp-1), or 3 replicates (H3K23me3 & H3K9me3).
Figure 3—figure supplement 1

Whole Chromosome Comparison of H3K9me3/H3K27me3/H3K23me3/H3K23me2/H3K23me1.
Relative enrichment of H3K23me1, H3K23me2, H3K23me3, H3K27me3 and H3K9me3 (top to bottom) ChIP-seq signal to input (y axis) for each chromosome (x axis). Black bar indicates approximate location of meiotic paring centers. Signal is normalized to sequencing depth.
Figure 3—figure supplement 2
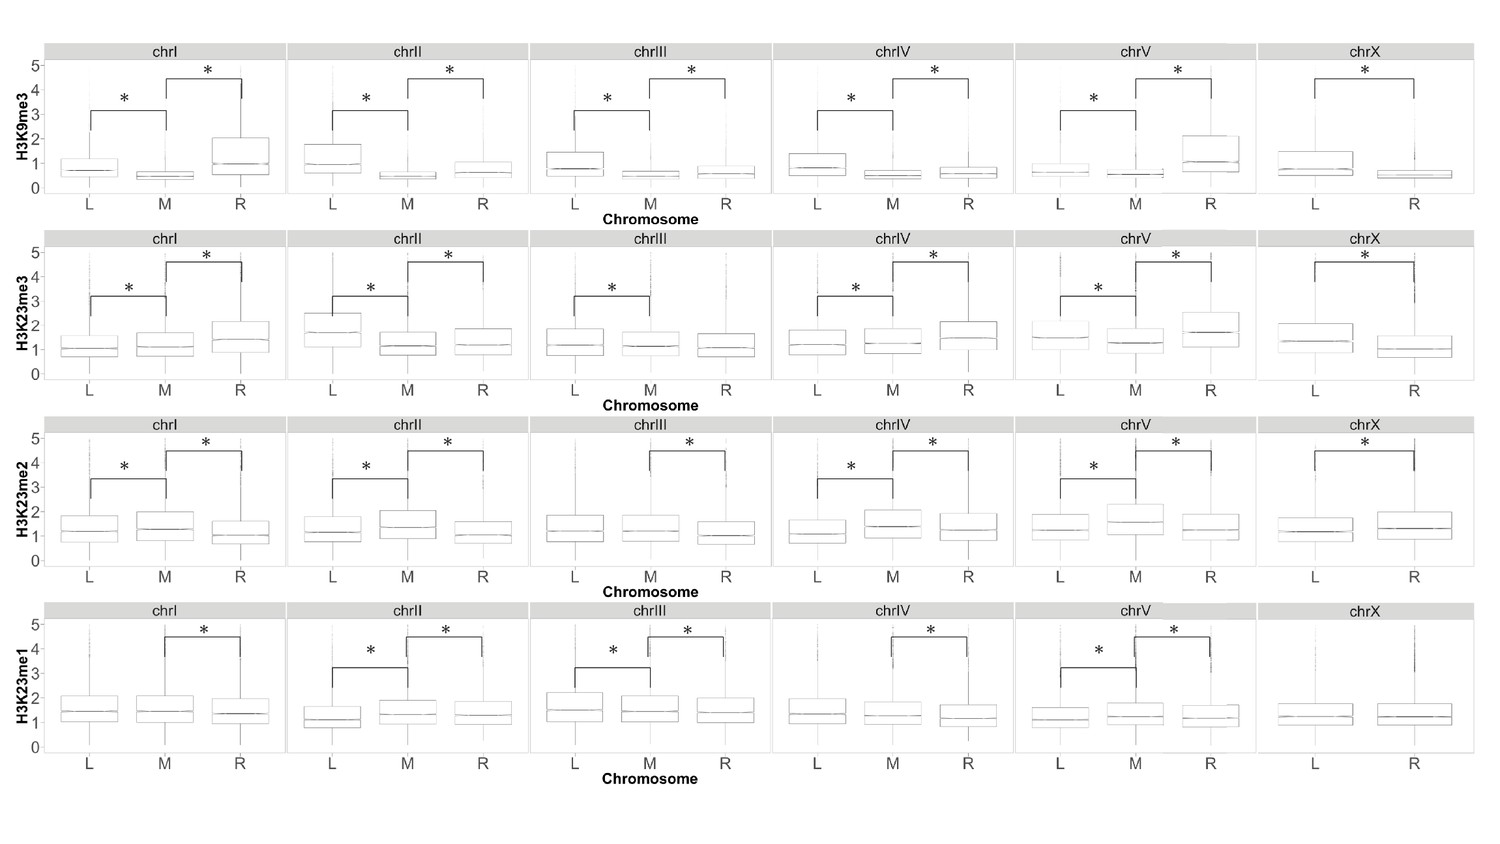
Boxplot comparing relative enrichment of heterochromatic chromosome arms to chromosome center for H3K9 and H3K23 methylation.
Box plot of ChIP-seq levels at the left arm (L), right arm (R), and middle (M) of each chromosome, y axis is relative enrichment of ChIP-seq signal to input. Each row of boxplots is representative of a different methylation mark (from top to bottom: H3K9me3, H3K23me3, H3K23me2, H3K23me1). Asterix indicates statistically significant difference between middle and arm (p<0.05).
Figure 4 with 4 supplements
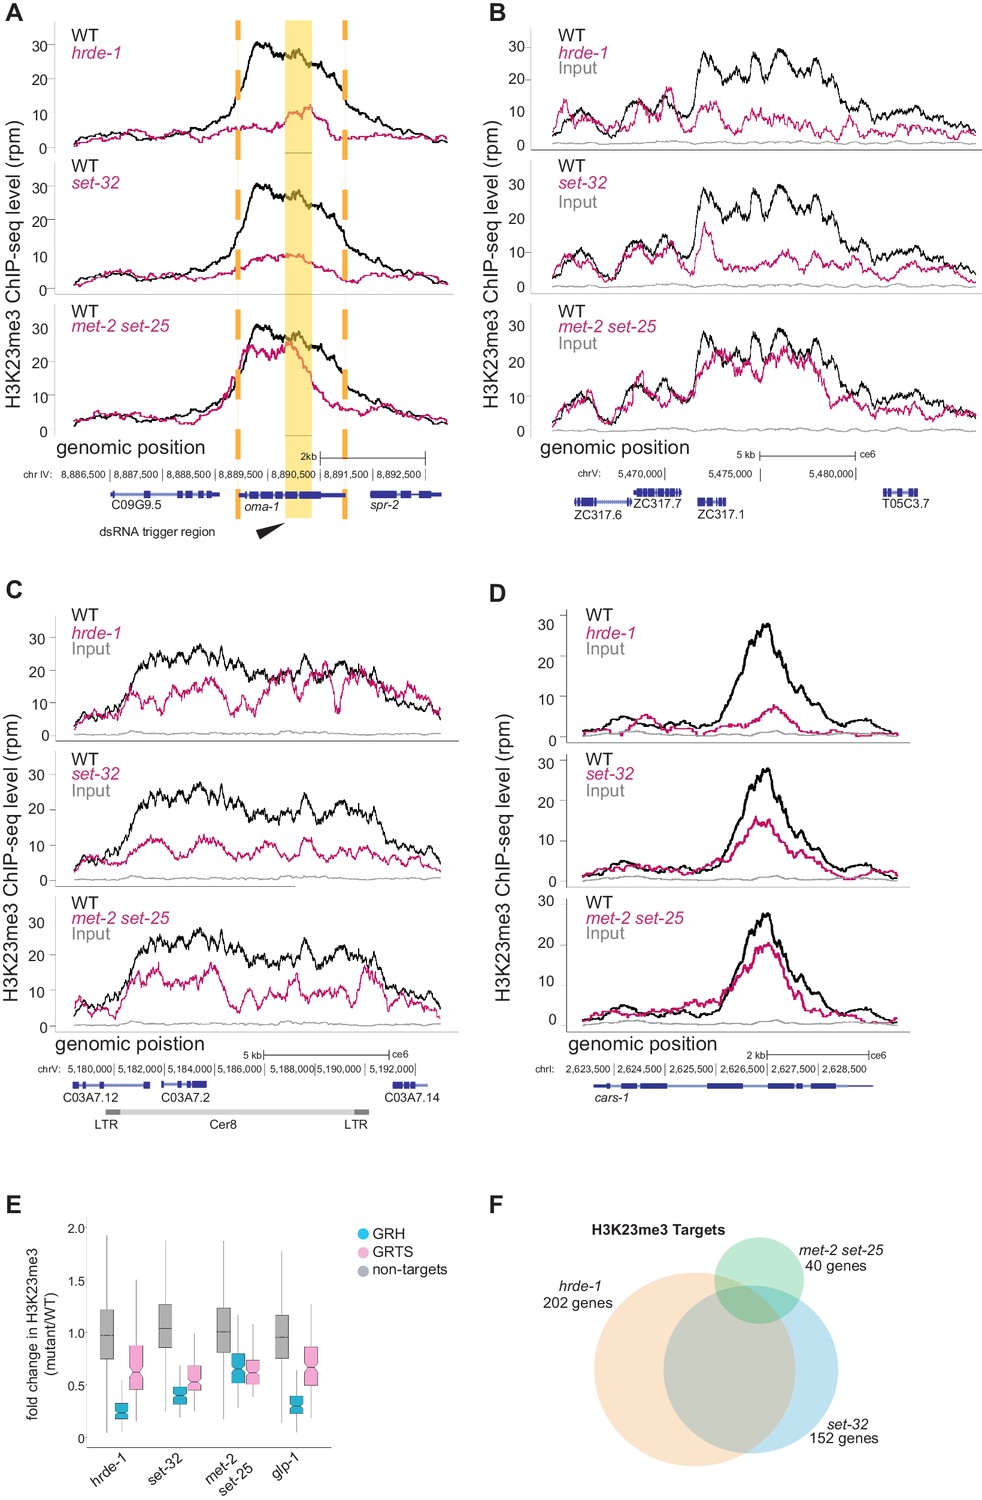
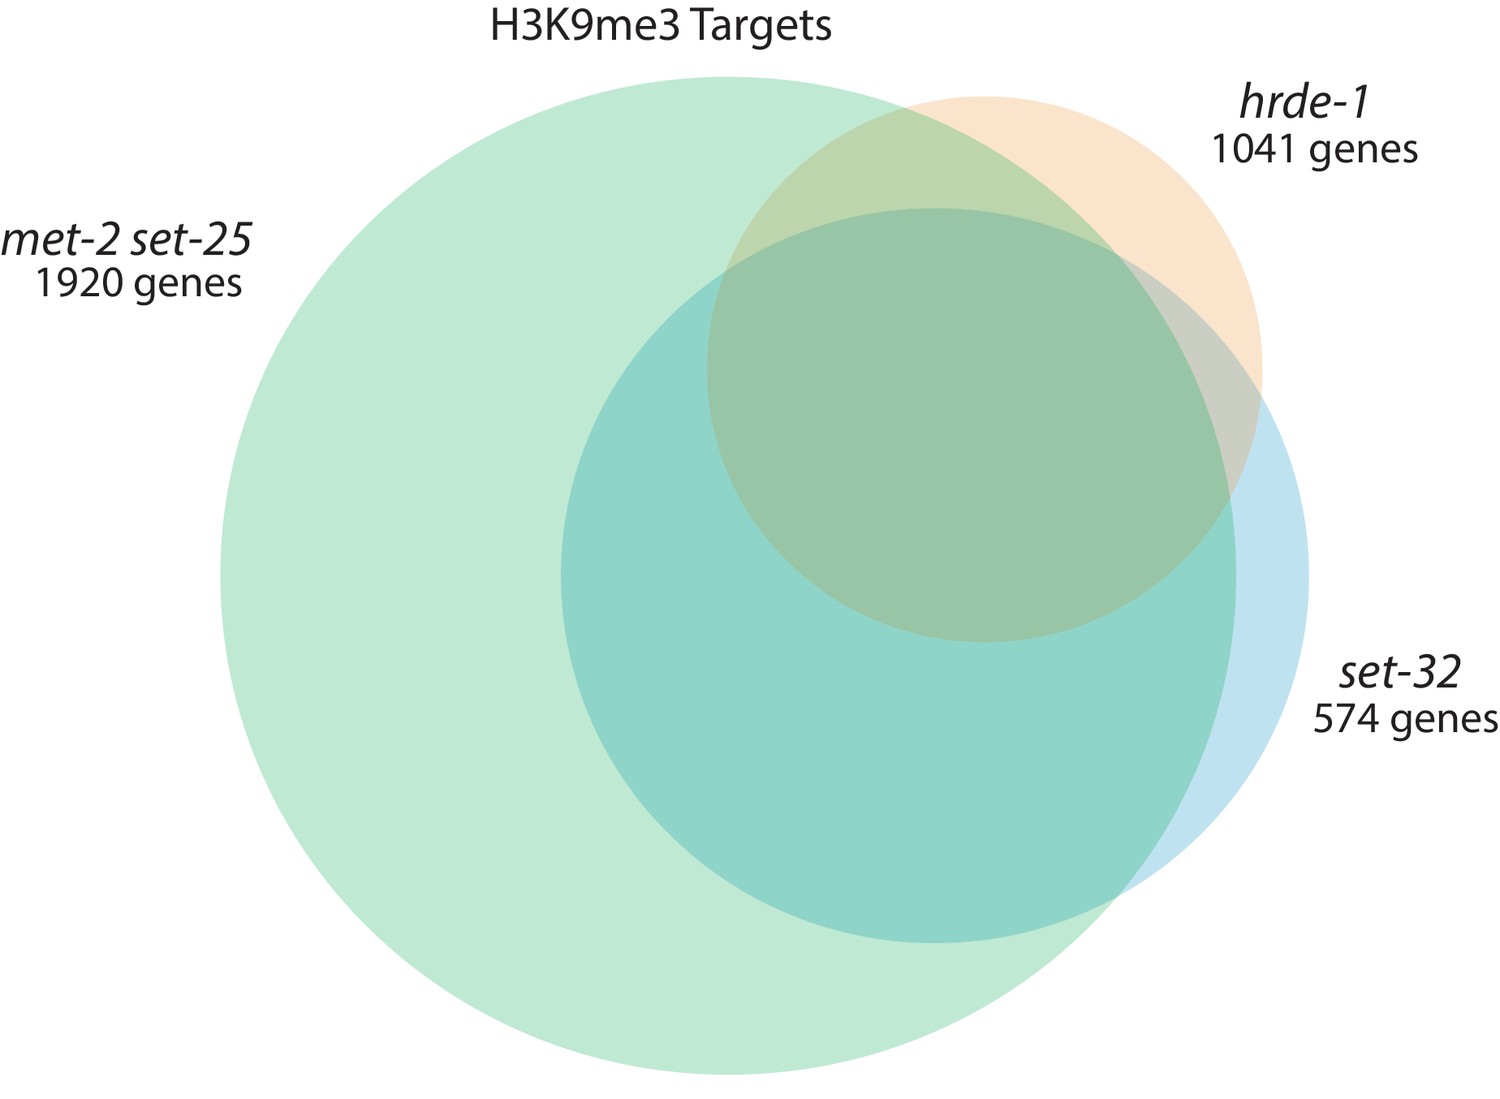
set-32 and hrde-1 are required for nuclear RNAi-dependent H3K23me3.
(A–D) H3K23 methylation levels (y axis) are plotted as a function of genomic position (x axis) in three mutant strains. Top panel: hrde-1, middle panel: set-32, bottom panel: met-2 set-25. The same H3K23me3 signal from WT animals (black) was plotted in each panel to compare with the mutant signals (pink). Grey: ChIP input from WT. (A) oma-1 locus with exogenous dsRNA-induced nuclear RNAi. Yellow block highlights the dsRNA trigger region, orange dashed lines indicate the boundaries of oma-1. (B-C) Endogenous targets of nuclear RNAi, (B) an exemplary GRH locus on chromosome V:5465000–5485000, (C) Cer8, (D) Y23H5A.7a, a top hrde-1-dependent gene. (E) Box plot of H3K23me3 ChIP whole-genome coverage in mutant/WT comparing GRH and GRTS regions, as well as the rest of the genome. (F) Venn diagram of genes enriched with hrde-1 (orange), set-32 (blue), and met-2 set-25 (green)-dependent H3K23me3. Dependence is measured as a twofold decrease in H3K23me3 signal in mutant compared with WT for individual annotated protein-coding genes in two replicas (p value < 0.05). Fisher’s exact test found the overlap between all pairs are statistically significant; the p values are < 2.2×10⁻¹⁶ for hrde-1 vs set-32 and set-32 vs met-2 set-25 and 2.095 × 10⁻¹⁵ for hrde-1 vs met-2 set-25. The data in this figure is representative of one replicate (hrde-1 oma-1 RNAi), two replicates (all other genotypes in oma-1 RNAi) or three replicates (all genotypes no RNAi).
Figure 4—figure supplement 1
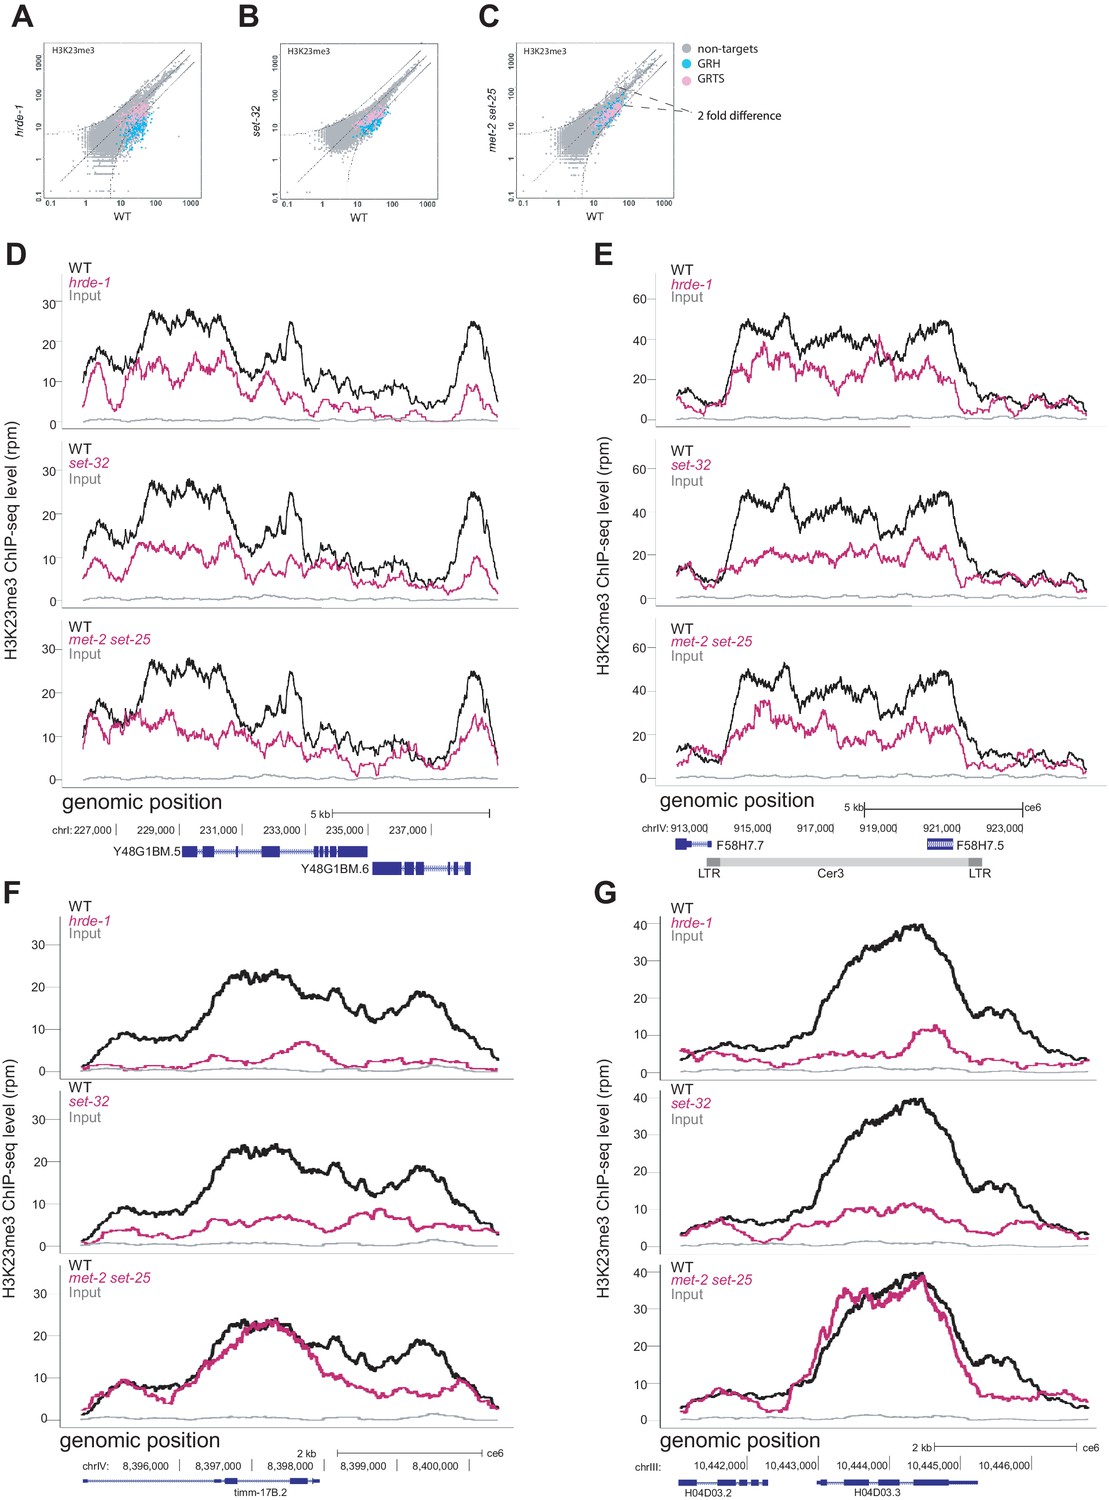
Genetic requirements for H3K23me3 at additional loci.
(A–C) Scatter plots of H3K23me3 ChIP whole-genome coverage in which each point represents a 1kb window of the genome with GRH and GRST loci highlighted. Mutant coverage is plotted on the y axis and WT coverage is plotted on the x axis. Curved dashed lines indicated two-fold difference (FDR≤0.05). (D-G) H3K23me3 levels (y axis) are plotted as a function of genomic position along the x axis in three mutant strains. Top panel: hrde-1, middle panel: set-32, bottom panel: met-2 set-25. For each panel WT is plotted in black, mutant is plotted in pink, grey is input in WT. The genomic loci are as follows: (D): Cer12, (E): Cer3, (F) :D2096.1, a top set-32-dependent gene, (G): H04D03.3, a top set-32-dependent gene. All signals normalized to sequencing depth.
Figure 4—figure supplement 2
Genetic requirements for H3K9me3.
Venn diagram of hrde-1 (orange), set-32 (blue), and met-2 set-25-dependent (green) H3K9me3 genes. Dependence is defined as a twofold decrease in H3K9me3 signal compared to WT with a p value of < 0.05 for a single gene in two replicas. Fisher’s exact test showed the following significance values for the overlapping regions: hrde-1 and set-32 <2.2×10⁻¹⁶, hrde-1 and met-2 set-25 <2.2×10⁻¹⁶, set-32 and met-2 set-25 <2.2×10⁻¹⁶.
Figure 4—figure supplement 3
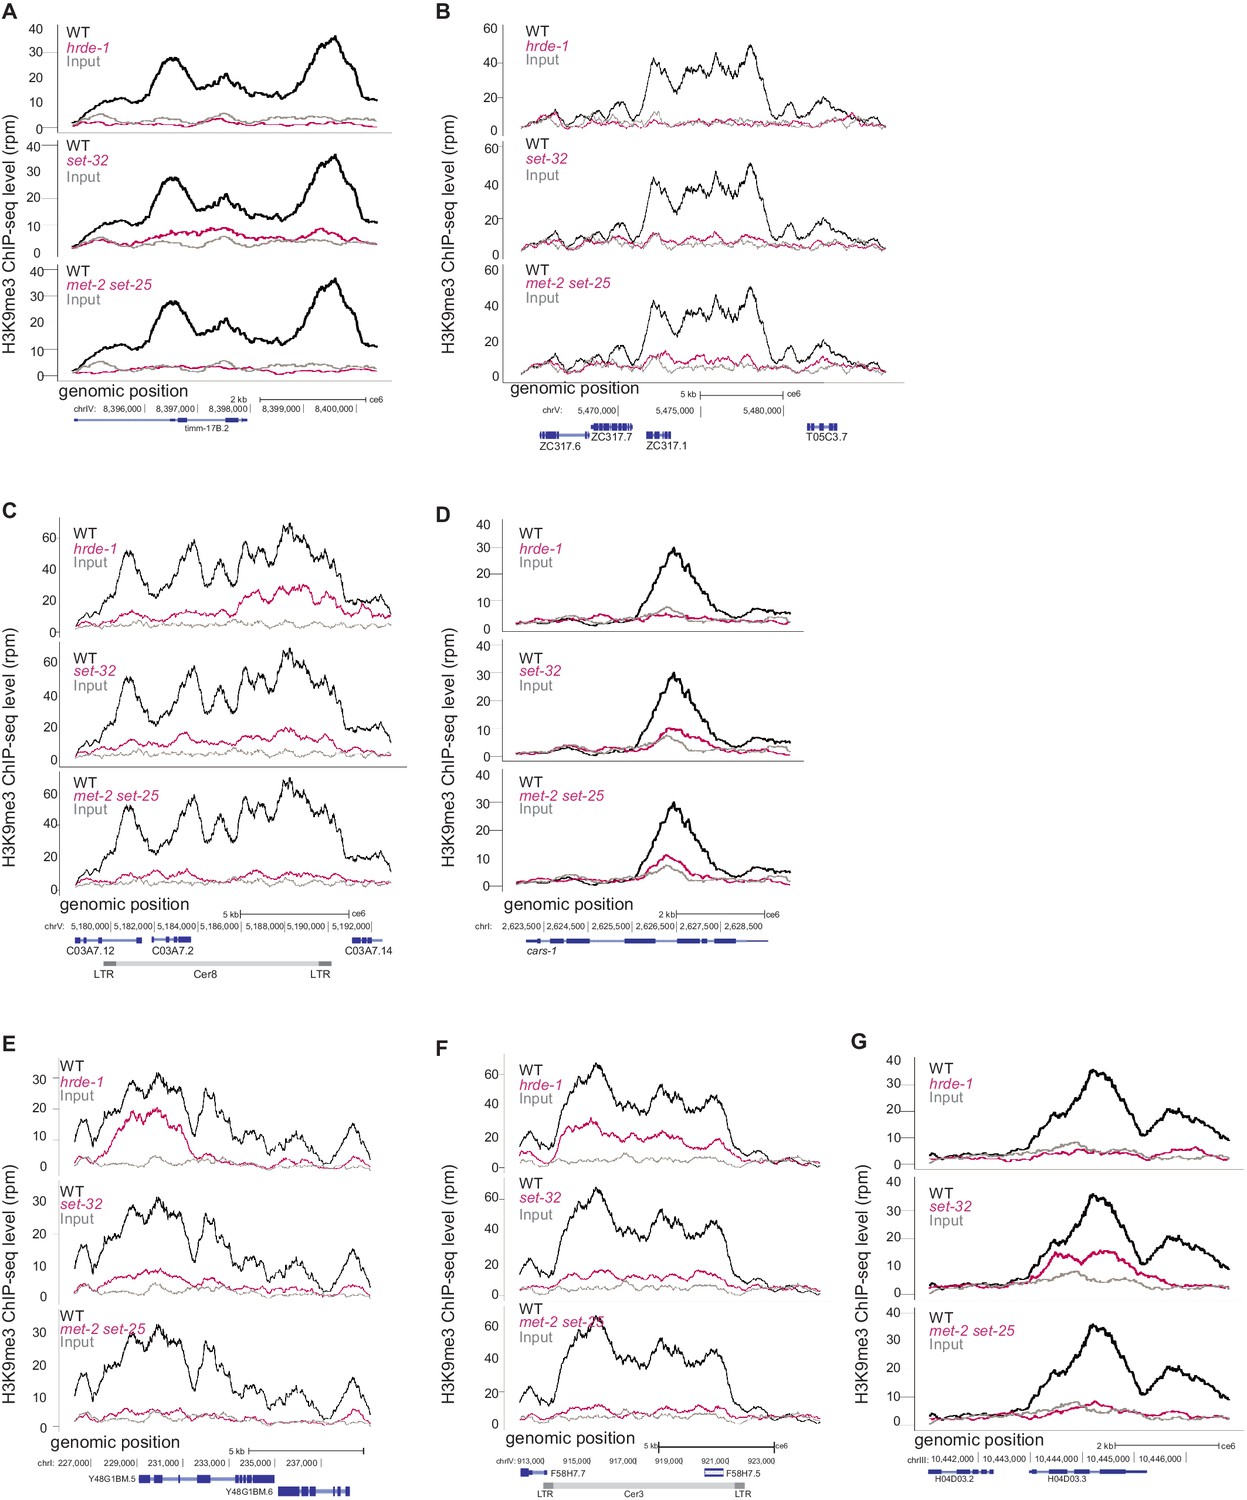
Genetic requirements for H3K9me3 at additional loci.
(A–G) H3K9me3 levels (y axis) are plotted as a function of genomic position along the x axis in three mutant strains. Top panel: hrde-1, middle panel: set-32, bottom panel: met-2 set-25. For each panel WT is plotted in black, mutant is plotted in pink, grey is input in WT. The genomic loci are as follows: (A) D2096.1, a top set-32-dependent gene, (B) an exemplary GRH locus on chromosome V:5465000–5485000, (C) Cer8, (D) Y23H5A.7a, a top hrde-1-dependent gene, (E) Cer12, (F) Cer3, and (G) H04D03.3, a top set-32-dependent gene. All signals normalized to sequencing depth.
Figure 4—figure supplement 4
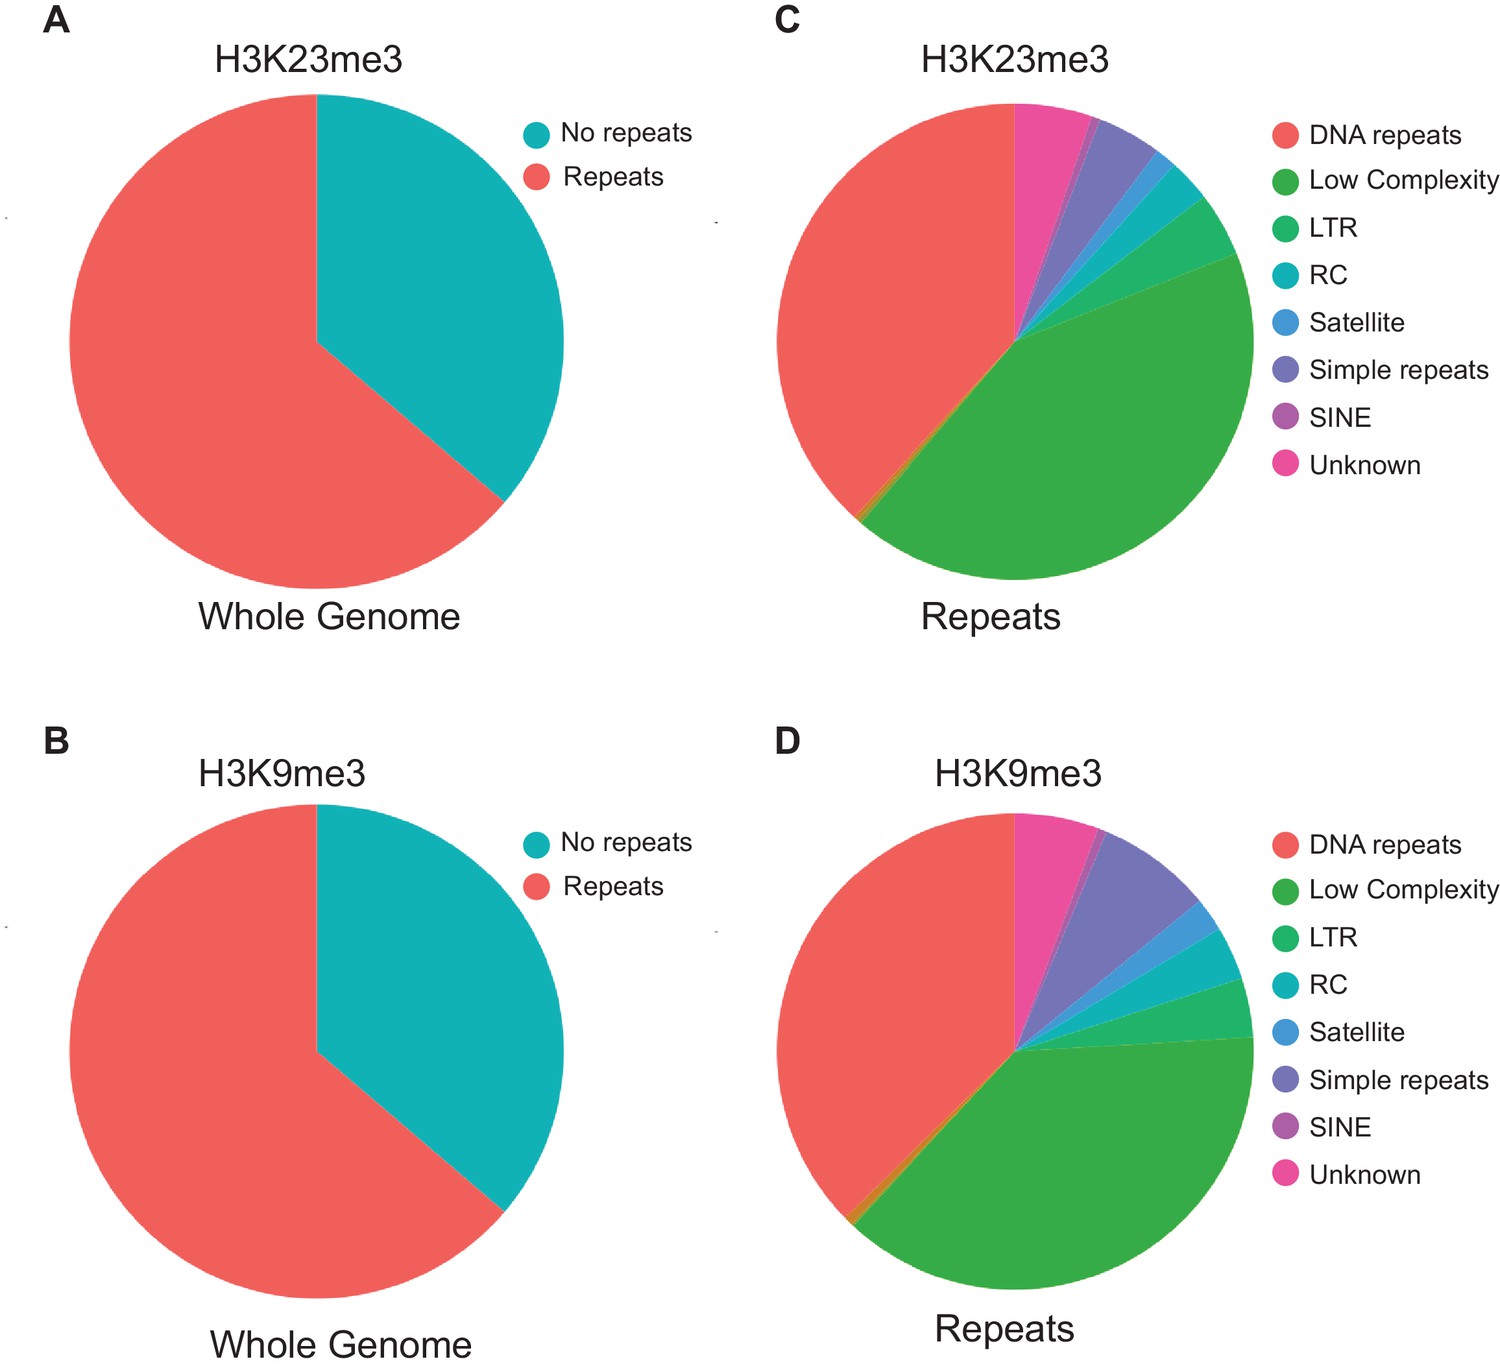
Repeat analysis of hrde-1-dependent H3K23me3 and H3K9me3 genes.
(A–B) Pie chart representing the proportion of genes containing repeat elements for: (A) hrde-1-dependent H3K23me3 genes and (B) hrde-1-dependent H3K9me3 genes. (C-D) Pie chart of the classes of repeats in genes that contain repeats.
Tables
Key resources table
| Reagent type (species) or resource | Designation | Source or reference | Identifiers | Additional information |
|---|---|---|---|---|
| Commercial assay or kit | KAPA Hyper Prep Kit | KAPA Biosystems | ||
| Commercial assay or kit | Vivaspin columns (MWCO 30 KDa) | GE healthcare | ||
| Peptide, recombinant protein | Xenopus H4 | Histone Source | ||
| Strain, strain background (C. elegans) | WT | Caenorhabditis Genetics Center | N2 | |
| Strain, strain background (C. elegans) | set-32 | PMID:30463021 | LG I: set-32(red11) | |
| Strain, strain background (C. elegans) | hrde-1 | Caenorhabditis Genetics Center | LG III: hrde-1(tm1200) | |
| Strain, strain background (C. elegans) | glp-1 | Caenorhabditis Genetics Center | glp-1(e2141) | |
| Strain, strain background (C. elegans) | met-2, set-25 | Caenorhabditis Genetics Center | met-2(n4256) set-25 (ok5021) | |
| Antibody | rabbit polyclonal anti-H3K9me3 | Abcam | ab8898 | Anitbody for ChIP seq |
| Antibody | rabbit polyclonal anti-H3K23me3 | Active Motif | 61500 | Anitbody for ChIP seq |
| Antibody | rabbit polyclonal anti-H3K23me2 | Active Motif | 39654 | Anitbody for ChIP seq |
| Antibody | rabbit polyclonal anti-H3K23me1 | Active Motif | 39388 | Anitbody for ChIP seq |
| Antibody | mouse monoclonal anti-H3K27me3 | Active Motif | 39535 | Anitbody for ChIP seq |
| Antibody | Donkey Anti-Rabbit-Alexa Fluor 488 | Jackson ImmunoResearch Laboratories | 711-545-152 | (1:300) |
| Antibody | monoclonal Mouse-anti-tubulin | DSHB | AA4.3 | (1:250) |
| Antibody | Cy5-conjugated donkey anti-Rabbit IgG secondary antibody | Jackson ImmunoResearch Laboratories | 711-175-152 | (1:1000) |
| Antibody | Cy5-conjugated donkey anti-Mouse IgG secondary antibody | Jackson ImmunoResearch Laboratories | 715-175-150 | (1:1000) |
| Peptide, recombinant protein | histone H3K23me3 | Active Motif | 31264 | antibody validation |
| Peptide, recombinant protein | histone H3K9me3 | Active Motif | 31601 | antibody validation |
| Peptide, recombinant protein | unmodified histone H3 | Abcam | ab2903 | antibody validation |
| Peptide, recombinant protein | H3K27me3 histone peptide | Abcam | ab1782 | antibody validation |
| Plasmid | pGEX-6p-1-GST-SET-32-WT | This study | pSG361 | recombinant protein expression |
| Plasmid | pGEX-6p-1-GST-SET-32-(Y448F) | This study | pSG434 | recombinant protein expression |
| Plasmid | pGEX-6p-1-GST-SET-25-WT | This study | pSG355 | recombinant protein expression |
| Plasmid | pet28a_human_H3.1_WT | Addgene, a gift from Joe Landry | 42631 | recombinant protein expression |
| Plasmid | pet28a_human_H3.1_K4L | This study | pSG371 | recombinant protein expression |
| Plasmid | pet28a_human_H3.1_K9L | This study | pSG367 | recombinant protein expression |
| Plasmid | pet28a_human_H3.1_K14T | This study | pSG372 | recombinant protein expression |
| Plasmid | pet28a_human_H3.1_K18L | This study | pSG373 | recombinant protein expression |
| Plasmid | pet28a_human_H3.1_K23L | This study | pSG374 | recombinant protein expression |
| Plasmid | pet28a_human_H3.1_K27L | This study | pSG375 | recombinant protein expression |
| Plasmid | pet28a_human_H3.1_K36L | This study | pSG376 | recombinant protein expression |
| Plasmid | pet28a_human_H3.1_K37L | This study | pSG377 | recombinant protein expression |
| Plasmid | pet28a_elegans_H2A | This study | pSG395 | recombinant protein expression |
| Plasmid | pet28a_elegans_H2B | This study | pSG427 | recombinant protein expression |
| Plasmid | pet28a_elegans_H3.1 | This study | pSG428 | recombinant protein expression |
| Plasmid | L4440-oma-1 | PMID:28228846 | pSG42 | RNAi feeding plasmid against oma-1 |
| Plasmid | L4440-smg-1 | PMID:22231482 | pSG27 | RNAi feeding plasmid against smg-1 |
| Plasmid | L4440-GFP | A gift from Andrew Fire lab | L4417 | RNAi feeding plasmid against GFP |
Additional files
-
Supplementary file 1
Top set-32 and hrde-1 dependent genes.
A list of top set-32-dependent H3K23me3 genes taken from annotated list of 20911 C. elegans genes. In the second list, the top hrde-1-dependent H3K23me3 genes. The top genes were defined as those that were threefold higher in WT versus mutant in two libraries with a p-value of <0.05.
- https://cdn.elifesciences.org/articles/54309/elife-54309-supp1-v1.xlsx
-
Supplementary file 2
List of experiments, libraries, sequencing depth used in this study.
ChIP-seq libraries are listed by experiment.
- https://cdn.elifesciences.org/articles/54309/elife-54309-supp2-v1.xlsx
-
Supplementary file 3
Oligonucleotides and other sequences used in this study.
- https://cdn.elifesciences.org/articles/54309/elife-54309-supp3-v1.xlsx
-
Transparent reporting form
- https://cdn.elifesciences.org/articles/54309/elife-54309-transrepform-v1.docx
Download links
A two-part list of links to download the article, or parts of the article, in various formats.
Downloads (link to download the article as PDF)
Open citations (links to open the citations from this article in various online reference manager services)
Cite this article (links to download the citations from this article in formats compatible with various reference manager tools)
Caenorhabditis elegans nuclear RNAi factor SET-32 deposits the transgenerational histone modification, H3K23me3
eLife 9:e54309.
https://doi.org/10.7554/eLife.54309


