Sensory restoration by epidural stimulation of the lateral spinal cord in upper-limb amputees
- Rehab Neural Engineering Labs, University of Pittsburgh, United States
- Department of Physical Medicine and Rehabilitation, University of Pittsburgh, United States
- Center for Neural Basis of Cognition, United States
- Department of Bioengineering, University of Pittsburgh, United States
- Human Engineering Research Labs, VA Center of Excellence, Department of Veteran Affairs, United States
- University of Pittsburgh Clinical Translational Science Institute, United States
Figures
Figure 1 with 2 supplements

Representative sensory percept locations.
Colored areas represent selected projected fields that were reported for more than two testing sessions and remained stable for at least two weeks. Each color represents a unique stimulation electrode per subject. If a pair of percepts had more than 70% overlap, only the more focal percept is shown here (Charkhkar et al., 2018). For a complete presentation of all sensations included in this study, see interactive Supplementary file 1.
Figure 1—figure supplement 1
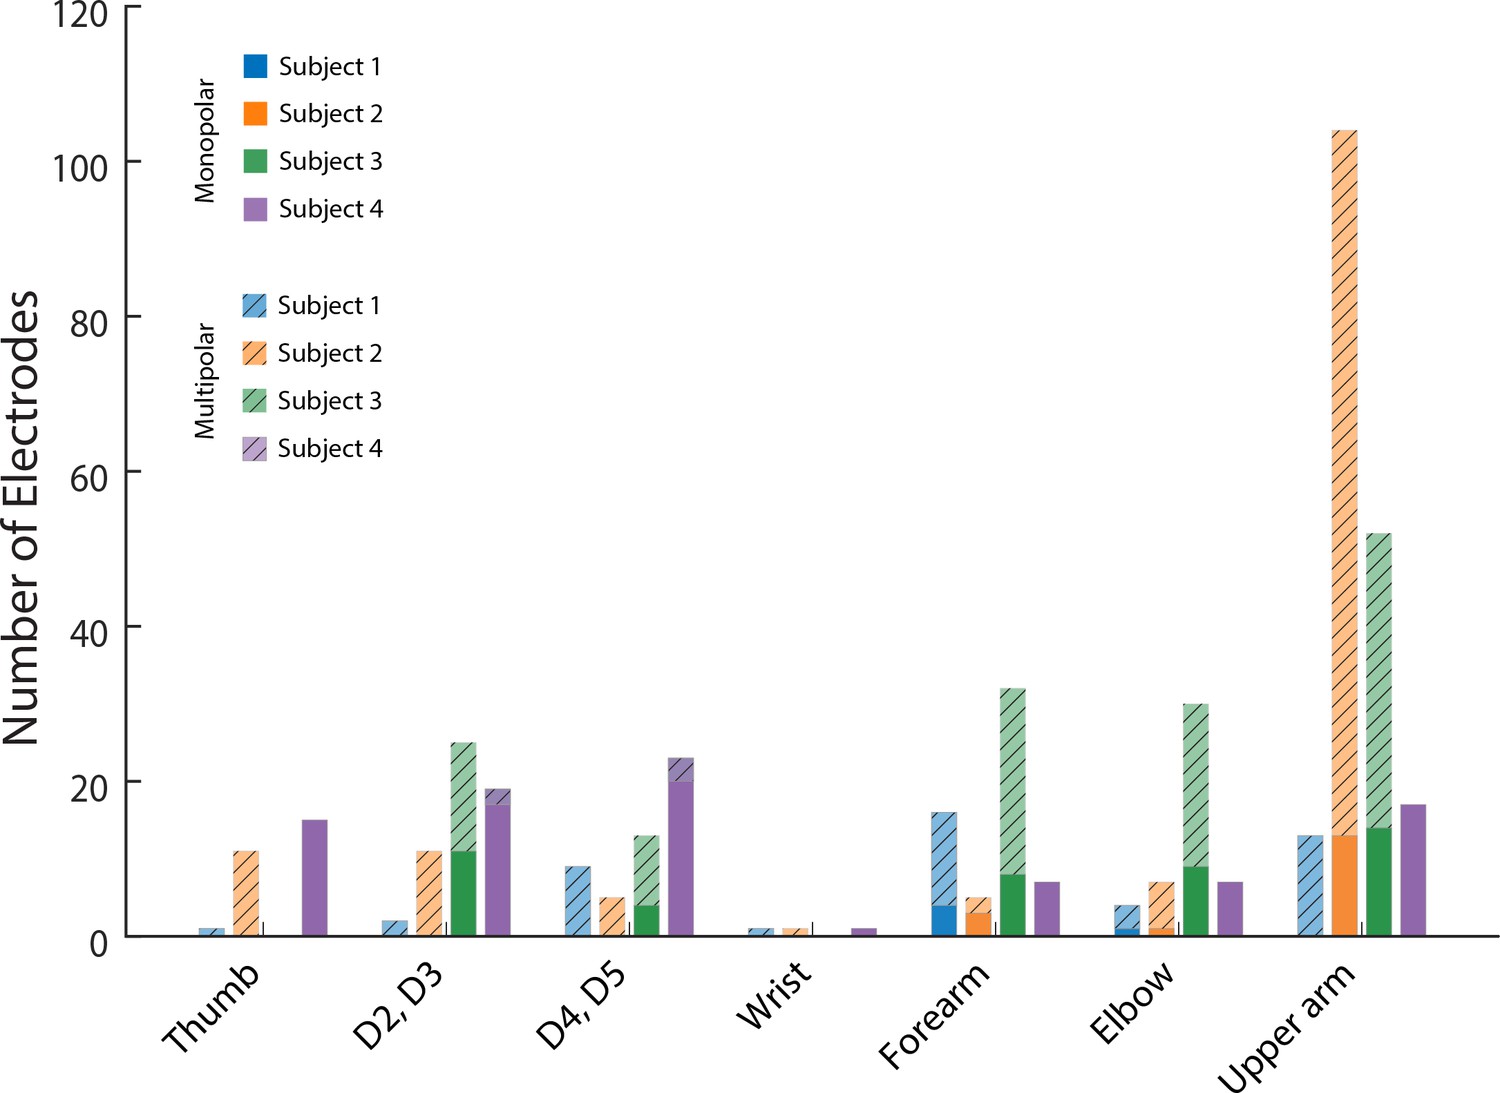
Effect of monopolar and multipolar stimulation.
The number of electrodes that evoked a sensory percept at a specific anatomical location. Lighter, hatched colored bars indicate multipolar electrodes and darker colored bars indicate monopolar electrodes.
Figure 1—figure supplement 2
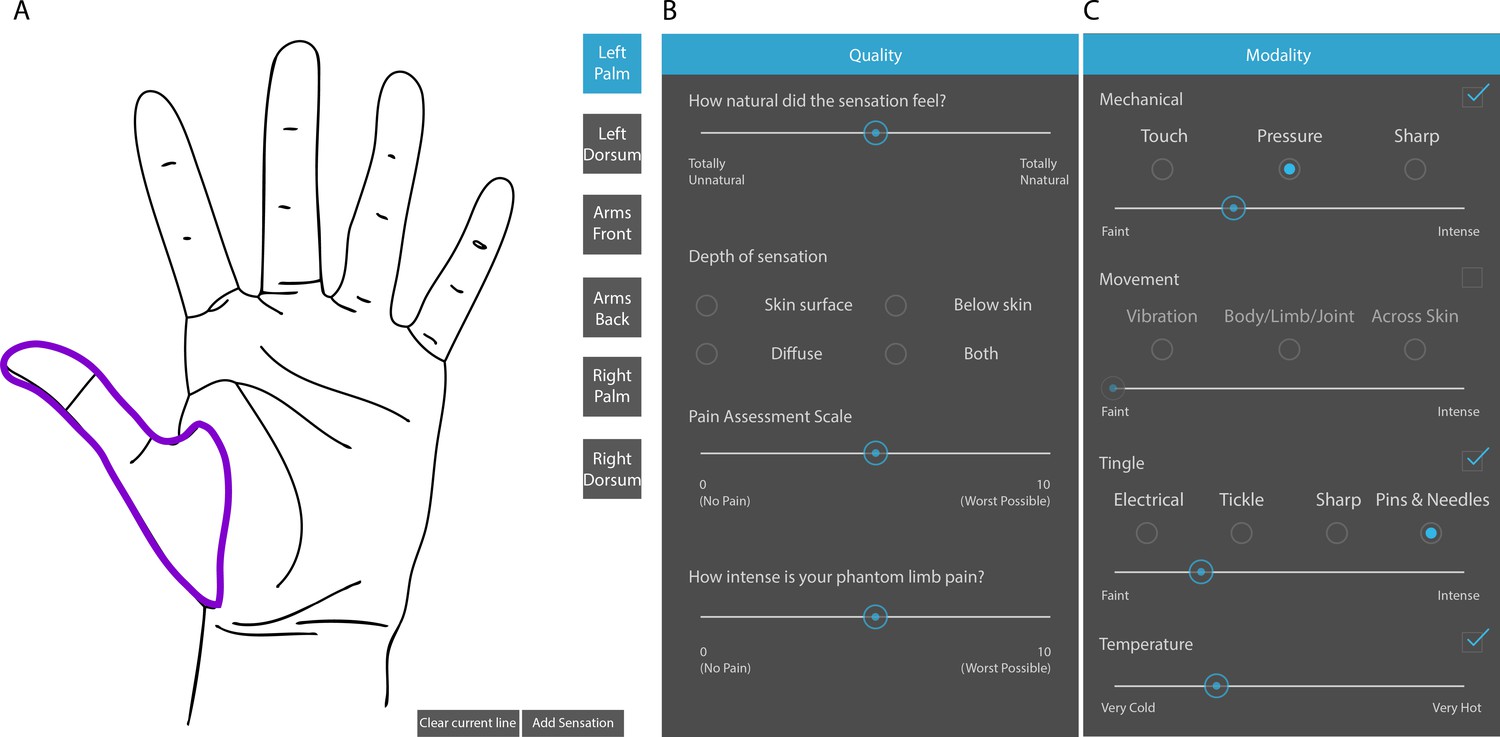
Touchscreen interface for describing evoked sensory percepts.
(A) Panel for free hand drawing to show the location and extent of the sensory percept. (B and C) Questionnaire to describe the modality and intensity of the sensory percept and associated phantom limb pain, if any.
Figure 2
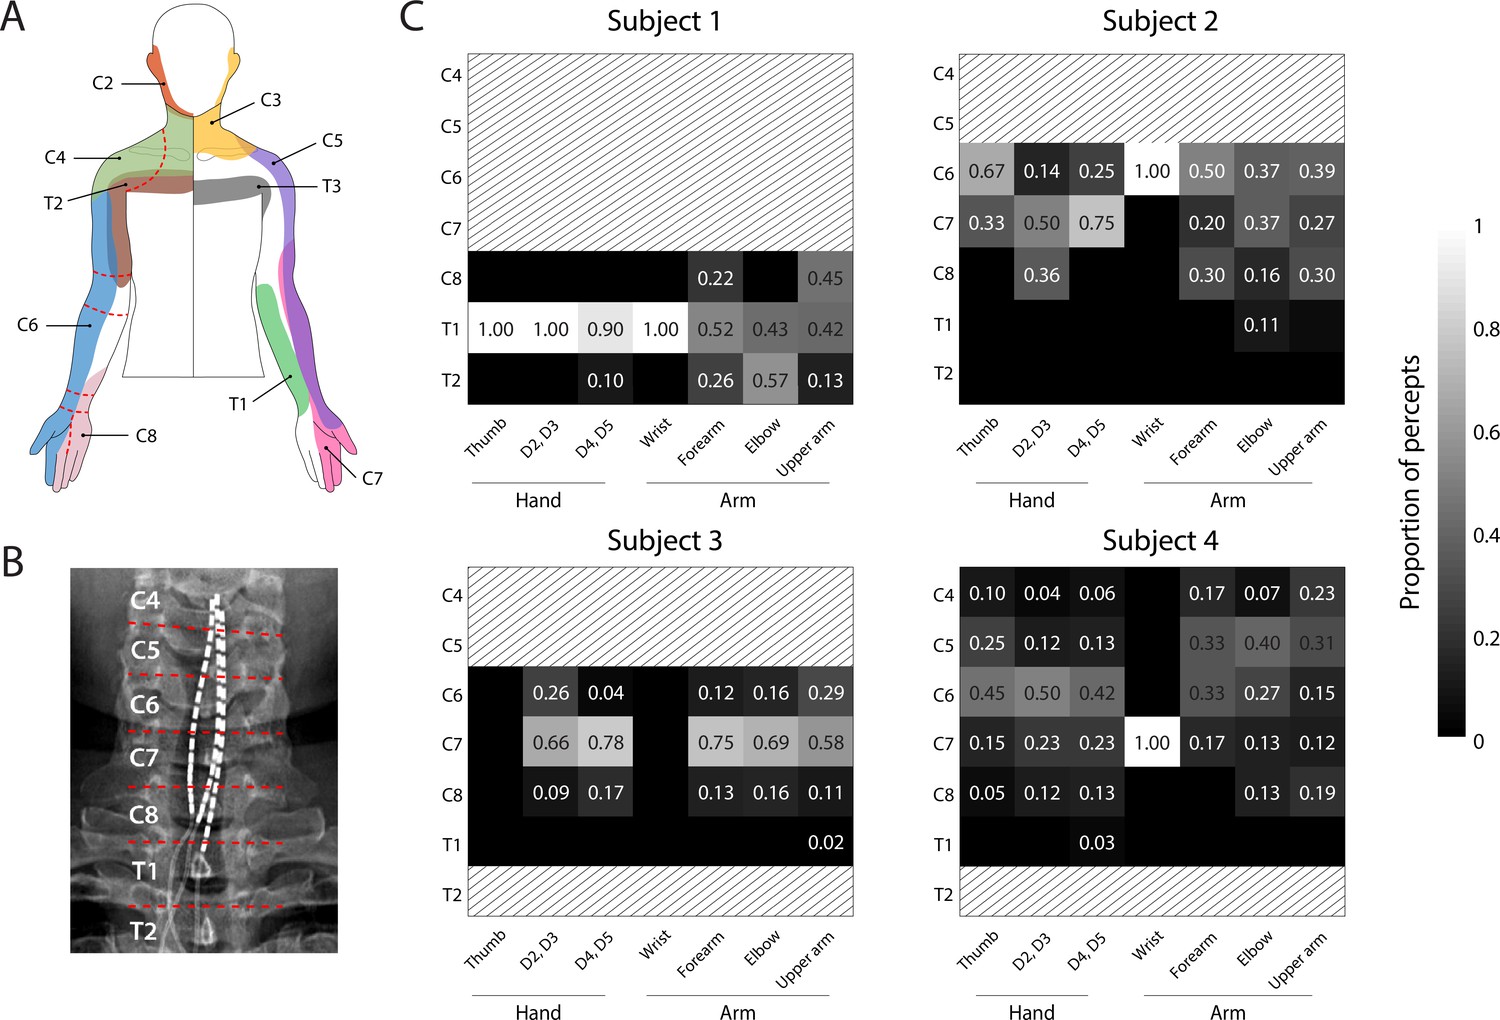
Dermatomal organization of the evoked percepts.
(A) Schematic of dermatomes, adapted from Lee et al., 2008. Overlapping dermatome areas are shown in lighter shades. Dotted lines indicate our division of different regions of the fingers, hand, and arm. (B) An example of the segmentation of the spinal cord (from Subject 4) used to determine the location of each stimulation electrode. (C) Heat maps show the relative proportion of electrodes located at different spinal levels to the total number of percepts emanating from a specific region of the arm. The spinal level of each electrode was defined by the position of the cathode with respect to the spinal levels as seen in the X-rays. Spinal levels that have no electrodes nearby are marked with gray hatching.
© 2008 Wiley. All rights reserved. Panel A is reprinted from Lee et al., 2008, with permission from Wiley. It is not covered by the CC-BY 4.0 licence and further reproduction of this panel would need permission from the copyright holder.
Figure 3
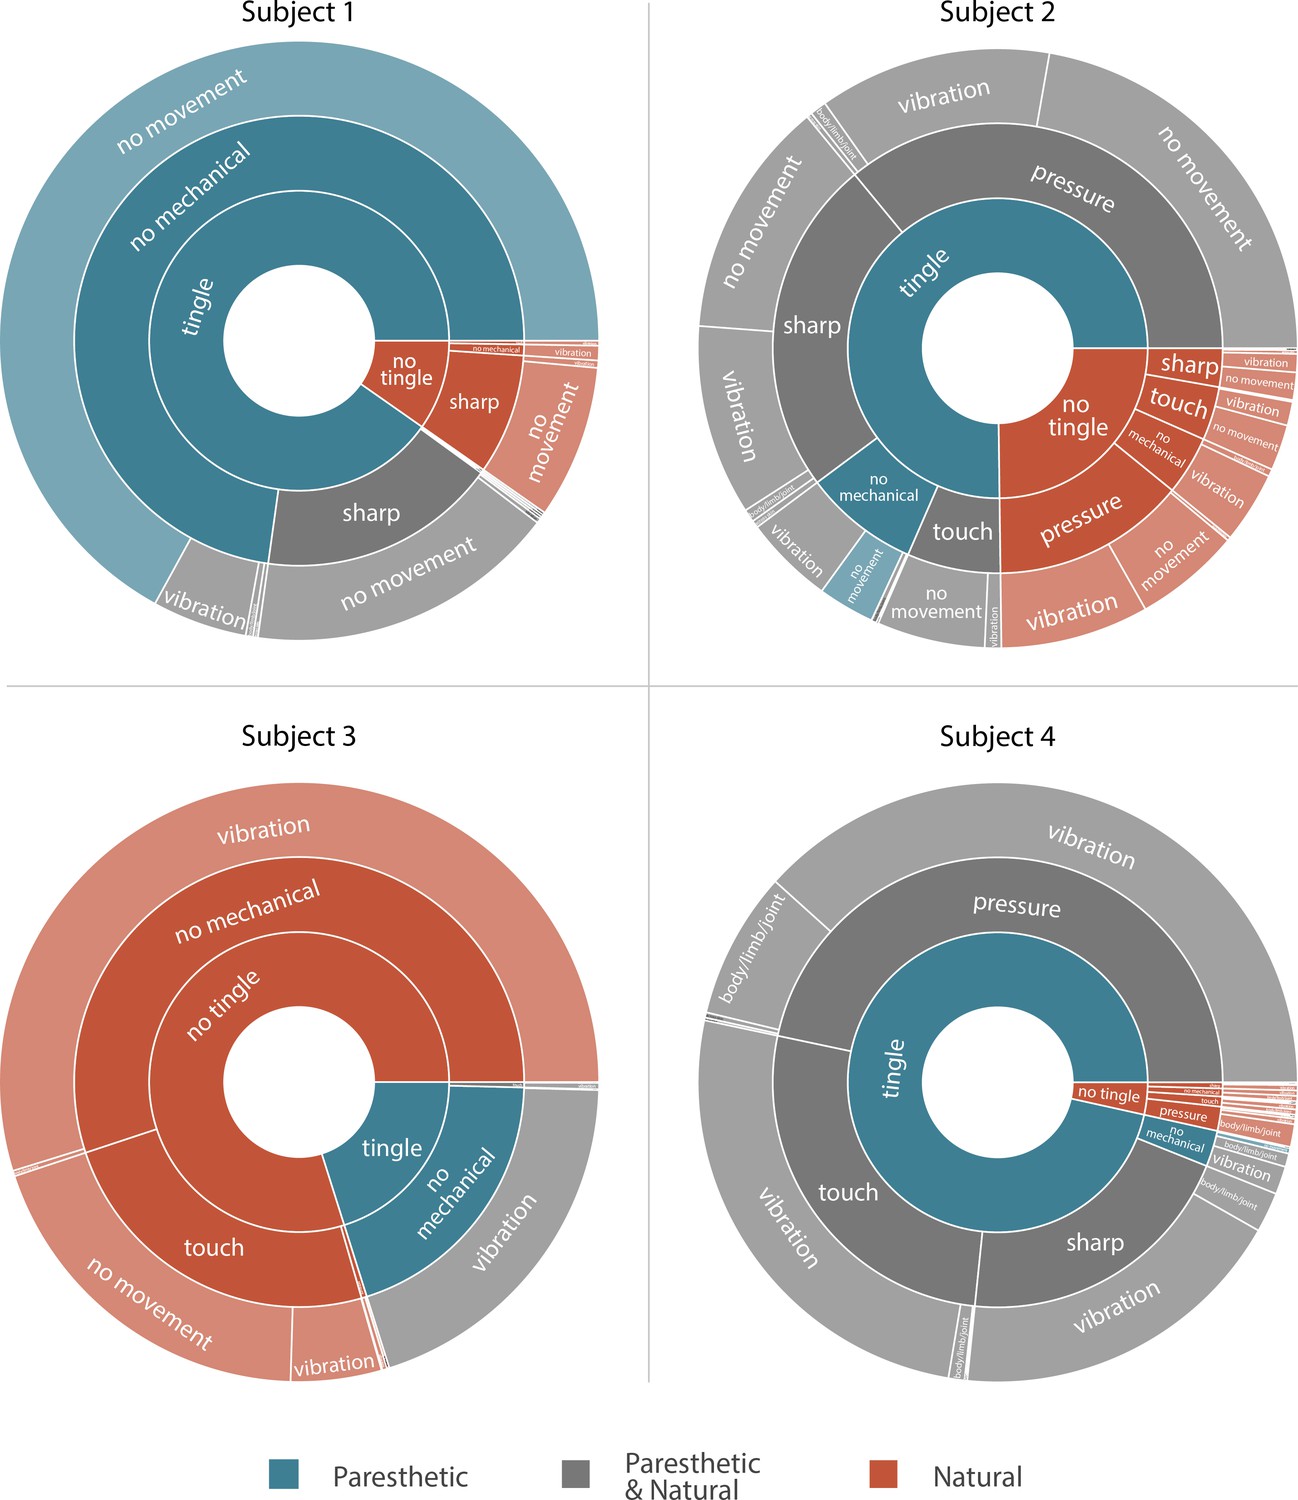
Sunburst plot showing the combination of paresthetic (teal), naturalistic (red), and mixed (grey) percept descriptors used by each subject.
Each annulus represents a modality descriptor that the subjects could select. The innermost annulus represents sensations where a ‘tingle’ descriptor was used. The middle annulus represents the fraction of each tingle descriptor that co-occurred with a ‘mechanical’ descriptor. The outermost annulus represents the fraction of tingle and mechanical descriptors that co-occurred with a ‘movement’ descriptor. For Subjects 1, 2, and 4, most sensory percepts were either paresthetic or of mixed modality (90.2%, 75.2%, and 96.5%, respectively). Subject 3 predominantly reported naturalistic sensations (79.9%) with most of those percepts described as pure vibration. An interactive version of this figure with expandable sectors and annotations for the percent occurrence of each descriptor is available in Supplementary file 3. Source data are available in Figure 3—source data 1.
-
Figure 3—source data 1
Number of times each subject reported each of the different modality descriptor combinations shown in Figure 3.
- https://cdn.elifesciences.org/articles/54349/elife-54349-fig3-data1-v1.csv
Figure 4 with 2 supplements

Psychophysics of the evoked sensory percepts.
(A) Example data from a detection task for a single electrode from Subject 2. Data were collected using a threshold tracking method and a psychometric function was fit to the data. The detection threshold was determined to be 982 µA. (B) Scatter plot showing the distribution of all the detection thresholds for Subjects 1 (blue), 2 (orange), 3 (green) and 4 (purple). (C) Example data for the just-noticeable differences at two different standard amplitudes for one electrode in Subject 3 and (D) Subject 4. Error bars represent SD. (E) Example data from Subject 3 of a free magnitude estimation task carried out on two different days (light and dark green circles) for a single electrode. Data from multiple days were compared after normalizing each electrode to its mean response. Perceived intensity varied linearly with stimulus amplitude for each individual testing session (dashed and solid green lines) as well as when taken together (black solid line). The slope of these lines was measured in units of mA-1 (F) Distribution of the stimulation amplitude and the reported intensity of the evoked percept for all subjects. Stimulation amplitude and reported intensity were independently discretized into three linearly spaced (low, medium, and high) bins and subject ratings of sensation intensity accurately predicted these bins. The stacked bar graph represents the percentage of times a binned magnitude response occurred for the corresponding discretized amplitude. Source data for panels B and F are available in Figure 4—source data 1 and Figure 4—source data 2 , respectively.
-
Figure 4—source data 1
Detection threshold for each electrode included in Figure 4B.
- https://cdn.elifesciences.org/articles/54349/elife-54349-fig4-data1-v1.csv
-
Figure 4—source data 2
Magnitude estimation data for each electrode included in Figure 4E and F.
- https://cdn.elifesciences.org/articles/54349/elife-54349-fig4-data2-v1.csv
Figure 4—figure supplement 1
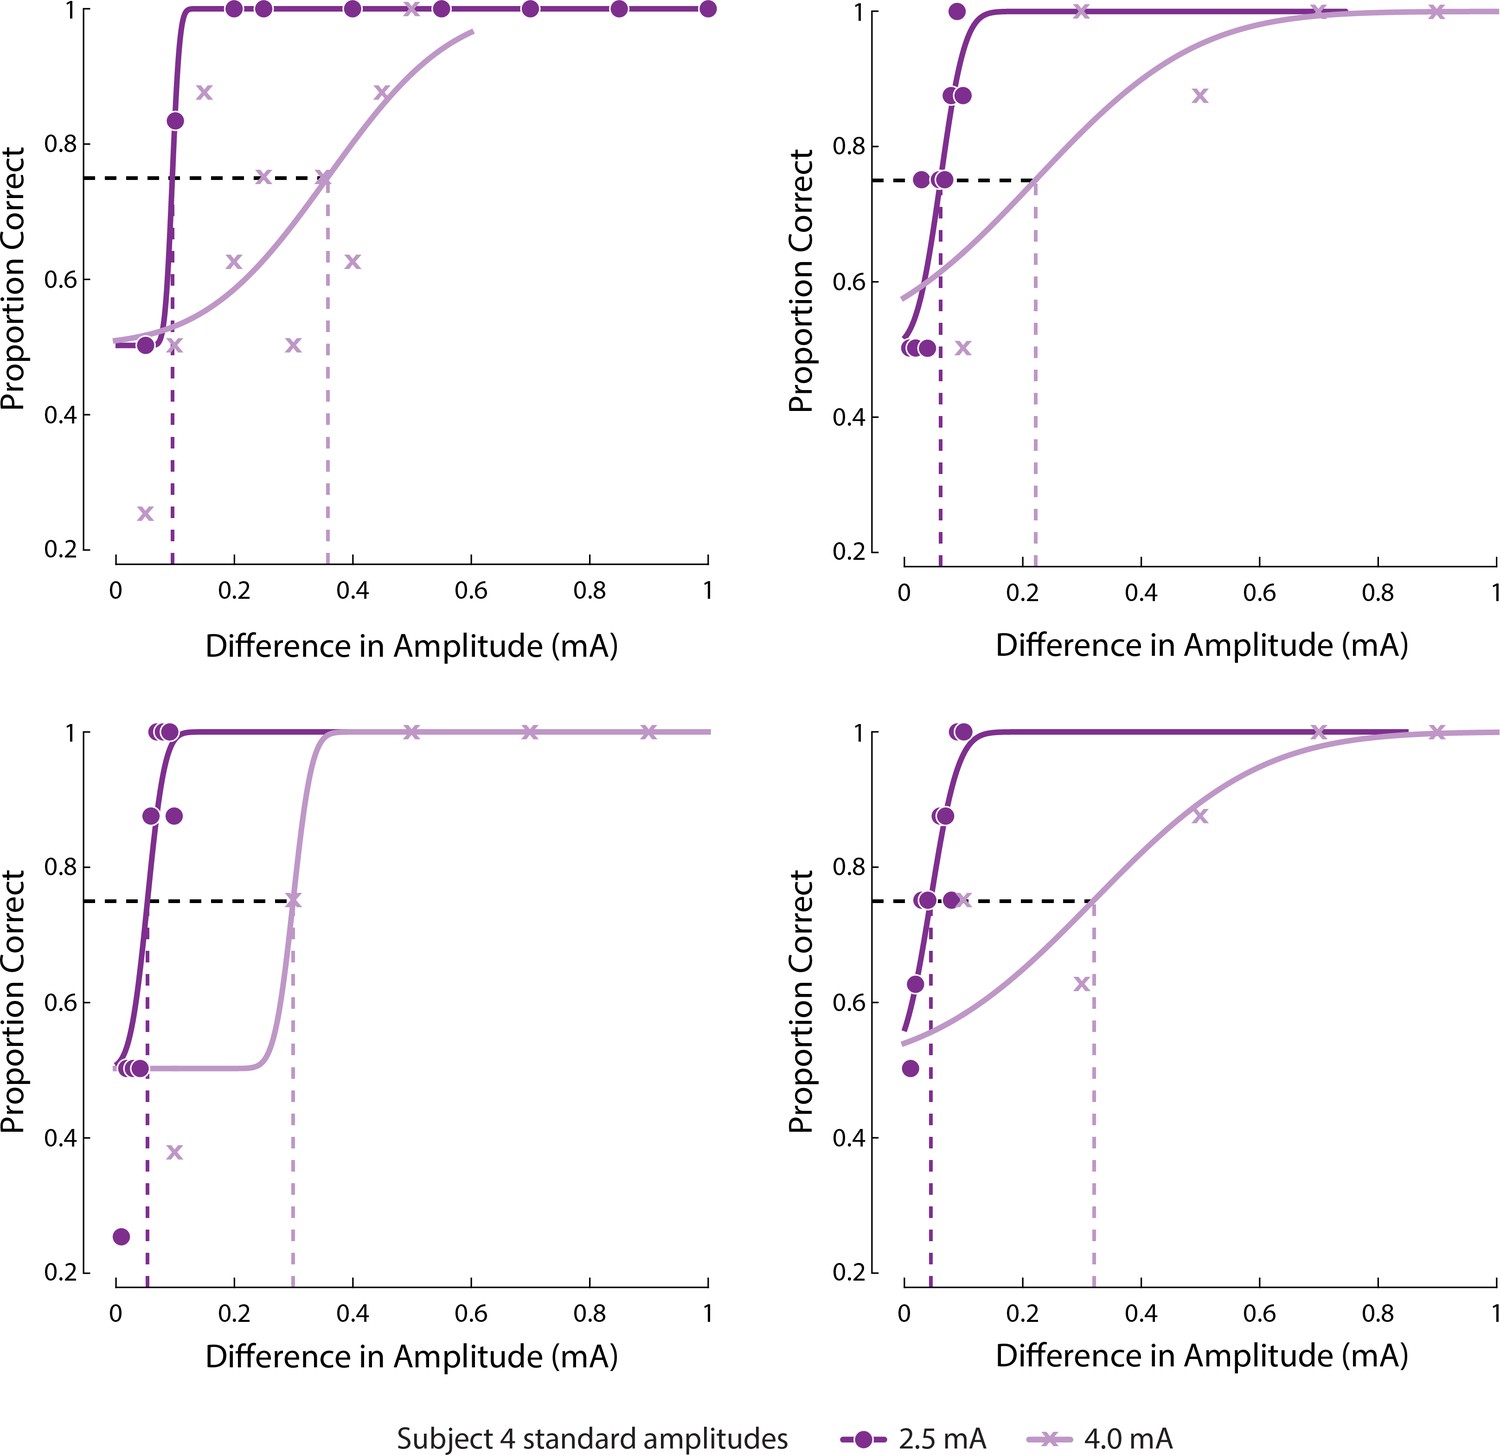
Psychometric curves fit to response of Subject four to JND tasks on four electrodes as shown in Figure 4D.
Figure 4—figure supplement 2
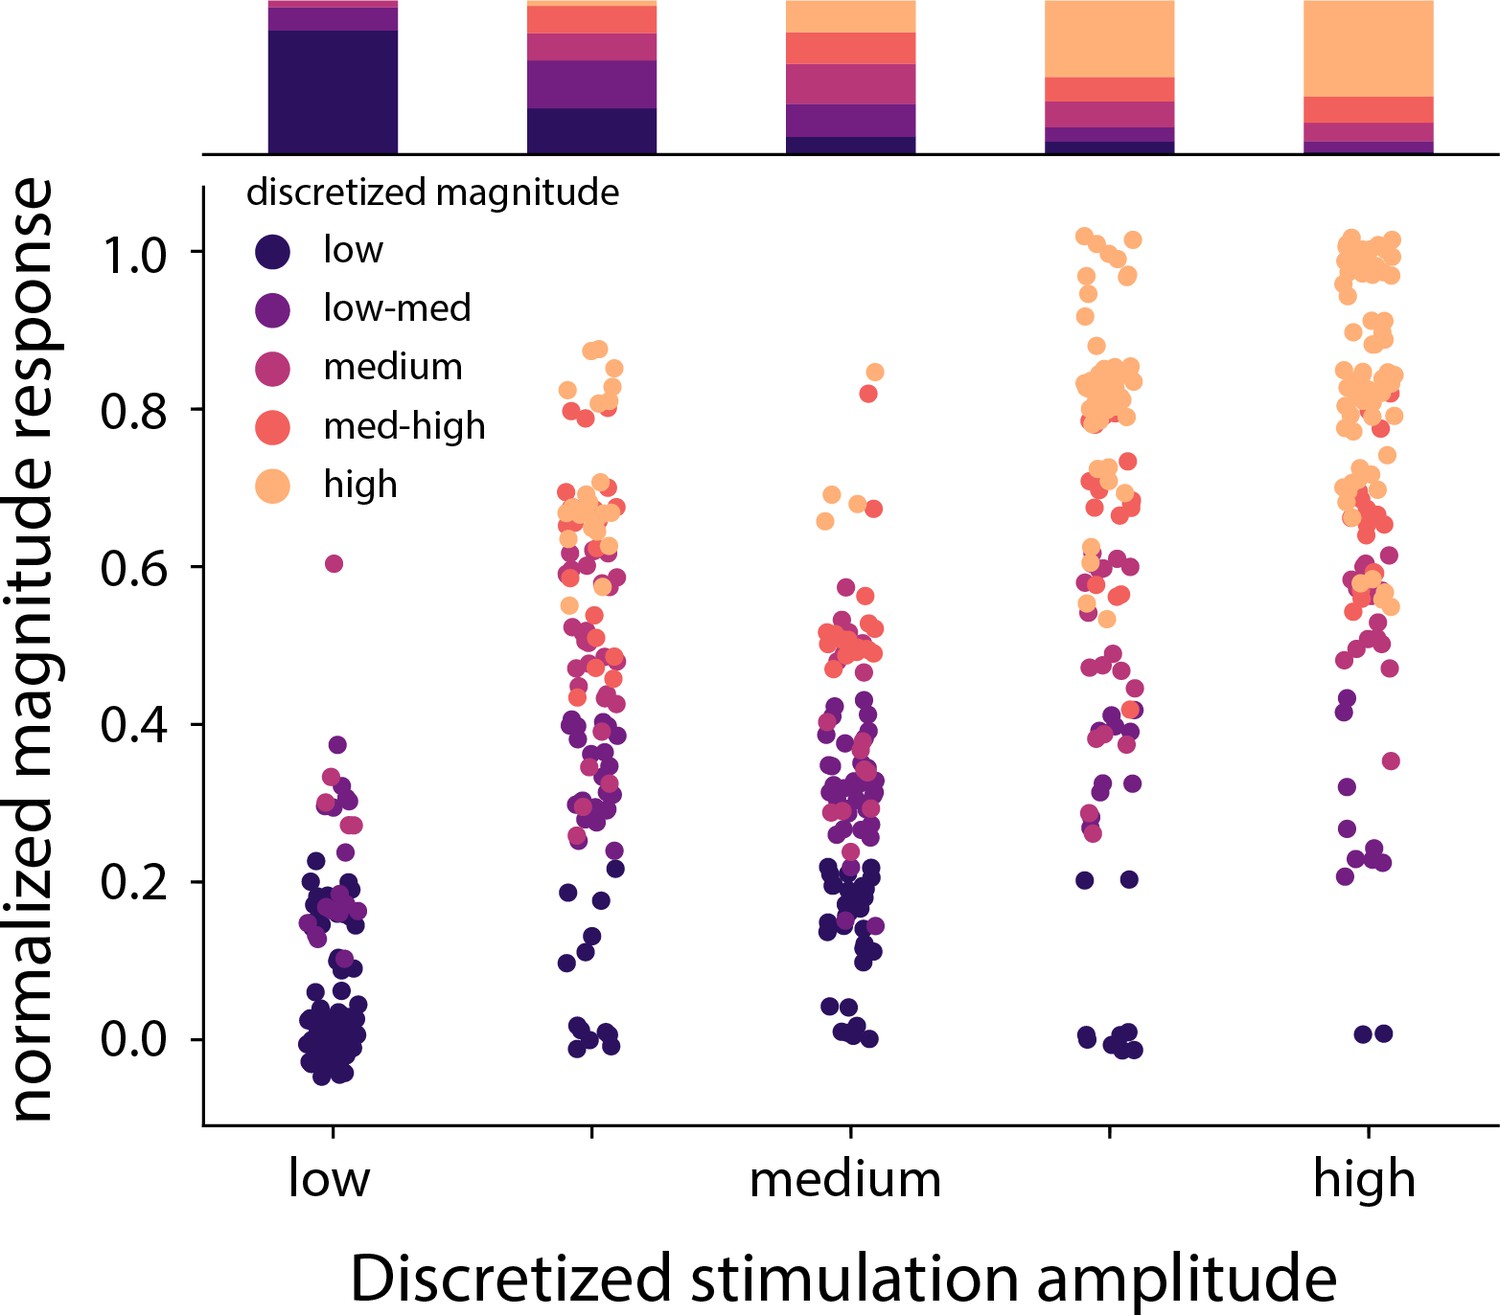
Distribution of the stimulation amplitude and the reported intensity of the evoked percept for all subjects.
Stimulation amplitude and reported intensity were independently discretized into five linearly spaced bins. The stacked bar graph represents the percentage of times a binned magnitude response occurred for the corresponding discretized amplitude. Overall accuracy of predicting stimulation bins from subject ratings of sensation intensity was lower than the three-target task shown in Figure 4F. Source data are available in Figure 4—figure supplement 2—source data 1.
-
Figure 4—figure supplement 2—source data 1
Magnitude estimation data for each electrode included in Figure 4—figure supplement 2.
- https://cdn.elifesciences.org/articles/54349/elife-54349-fig4-figsupp2-data1-v1.csv
Figure 5
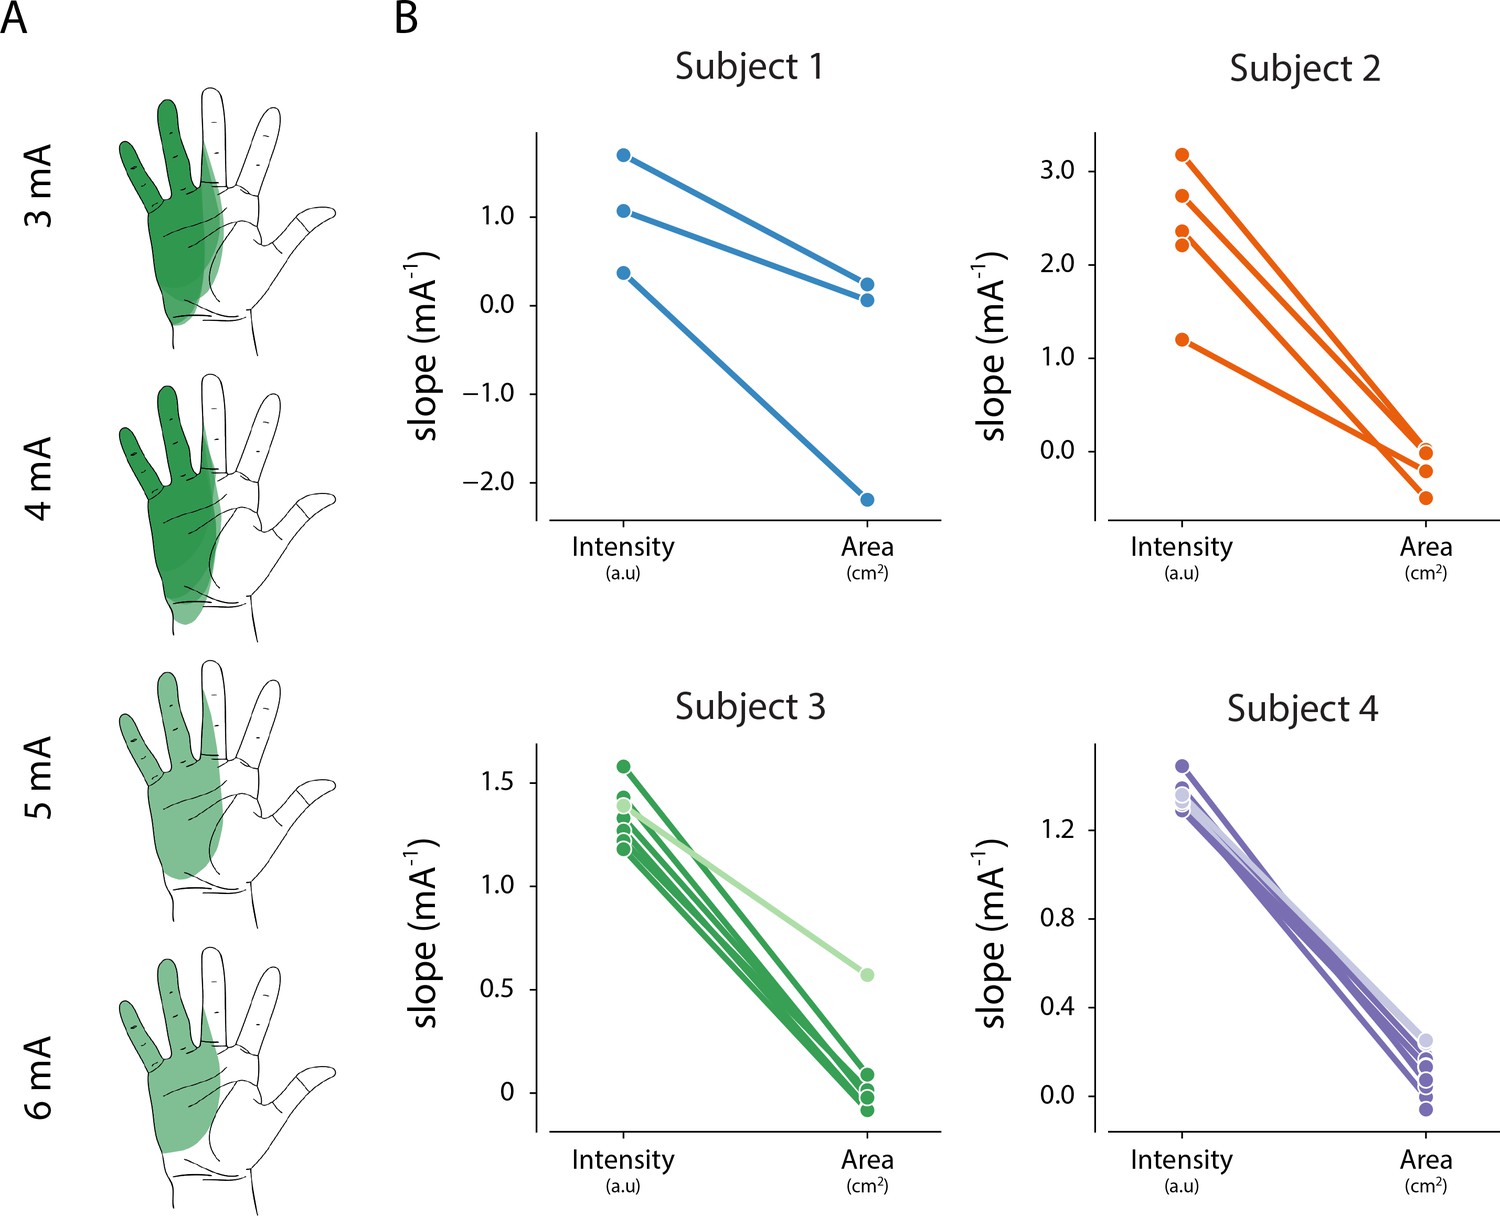
Relationship between intensity and area of evoked percept, and stimulation amplitude.
(A) Example of the stability of percept area with increasing amplitude for one electrode in Subject 3. (B) Summary of the relationship between stimulation amplitude and percept characteristics for each electrode that evoked a percept in the phantom hand. The slope of the linear fit between stimulation amplitude and reported intensity was obtained from magnitude estimation trials. The slope of the linear fit between stimulation amplitude and percept area was obtained from percept mapping trials. Lighter shades represent electrodes where parea < 0.01. The null hypothesis is that the slope of the linear fit is zero. Source data for panel B are available in Figure 5—source data 1.
-
Figure 5—source data 1
Intensity and area slope data for all percepts included in Figure 5.
- https://cdn.elifesciences.org/articles/54349/elife-54349-fig5-data1-v1.csv
Figure 6
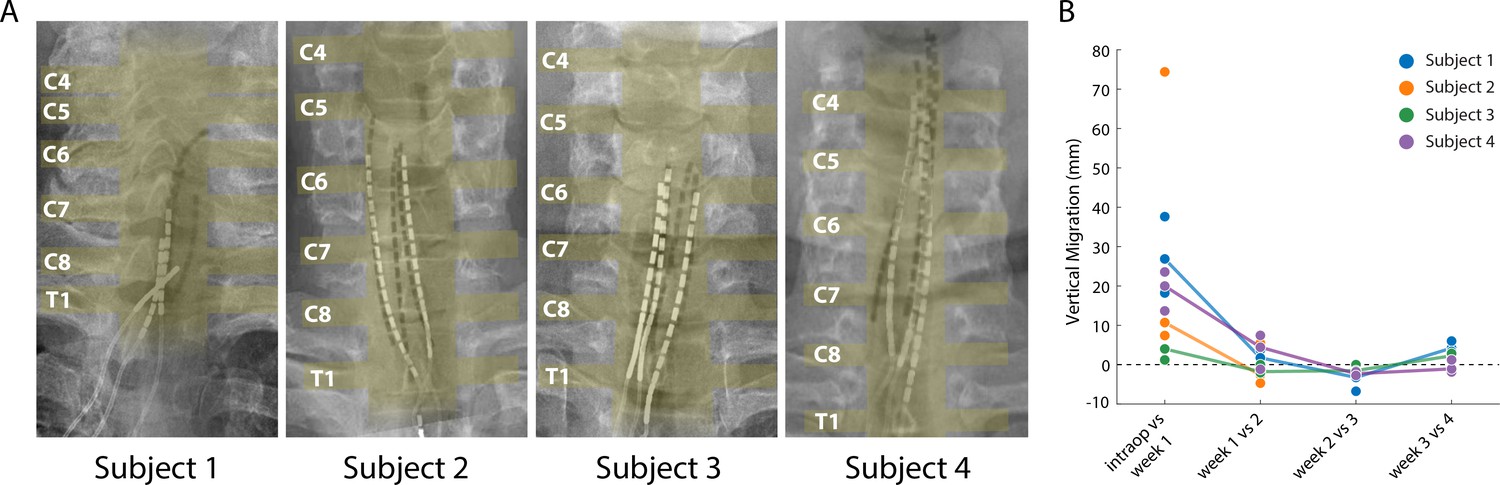
Stability of the SCS leads after implantation.
(A) Composite image showing the changes in the position of the SCS leads in the epidural space. The intraoperative fluoroscopy image (contacts appear black) showing the position of the leads immediately after implantation is superimposed over the X-rays (contacts appear white) from week four for each subject. The labels on the left mark the dorsal root exiting at that level. The approximate location of the spinal cord and the roots is also shown in yellow overlay. For scale, each contact is 3 mm long. (B) Weekly migration of the rostral tip of each of the leads for the four subjects (blue, orange, green, and purple circles for Subjects 1–4, respectively). For week 1, the comparison was between the weekly X-ray and the intraoperative fluoroscopic image. For subsequent weeks, the comparison was done between the weekly X-ray and the one from the preceding week. Median migrations are shown (solid lines). The X-ray for Subject 2 was taken from week 2, before leads were explanted.
Figure 7
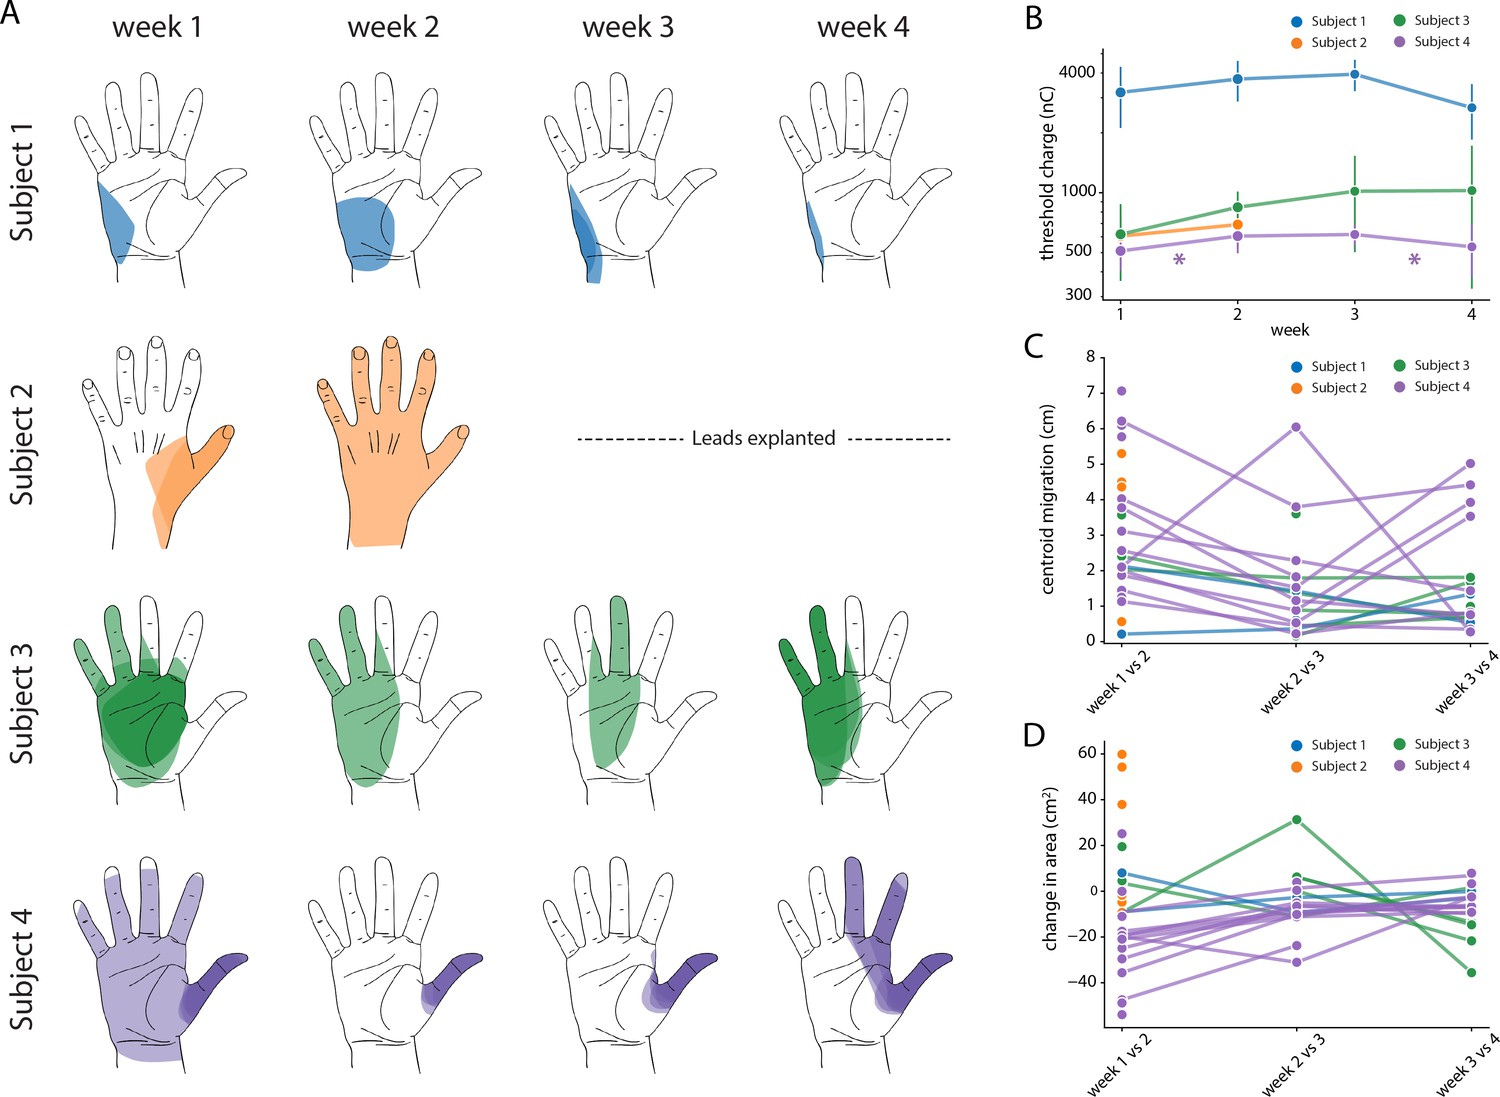
Stability of the sensory percepts.
(A) Example sensory percepts from the hand for a single electrode in Subjects 1–4. For Subject 2, the percepts are shown for weeks 1 and 2 only, as the leads were explanted after that. The percepts shown were evoked by the minimum stimulus amplitude that was tested at least once per week for the maximal number of weeks. Each column shows the location of all percepts evoked for that week of testing. Multiple examples of the percepts evoked during the week are superimposed on each other as indicated by different shades. (B) Time course of the average stimulation threshold (in nC) for evoking a percept in the phantom hand for each subject. Weeks with a significant change in threshold are annotated with an asterisk. (C) Stability of the location of the evoked percept in the phantom hand. For each electrode, the centroid location of the evoked percept was compared between successive weeks. (D) Stability of the area of the evoked percept in the phantom hand. For each electrode, the area of the evoked percept was compared between successive weeks. Source data for panels B-D are available in Figure 7—source data 1, Figure 7—source data 2, and Figure 7—source data 3, respectively.
-
Figure 7—source data 1
Stimulation threshold charge for all electrodes included in Figure 7B.
- https://cdn.elifesciences.org/articles/54349/elife-54349-fig7-data1-v1.csv
-
Figure 7—source data 2
Percept centroid migration distance data for all electrodes included in Figure 7C.
- https://cdn.elifesciences.org/articles/54349/elife-54349-fig7-data2-v1.csv
-
Figure 7—source data 3
Change in percept area for all electrodes included in Figure 7D.
- https://cdn.elifesciences.org/articles/54349/elife-54349-fig7-data3-v1.csv
Tables
Table 1
Subject information.
Demographic, amputation, and study-related information for each subject.
| Subject | Age | Gender | Amputation characteristics | Implant duration (days) | |||
|---|---|---|---|---|---|---|---|
| Years since | Side | Level | Cause | ||||
| 1 | 67 | Female | >5 | Right | Shoulder disarticulation | Necrotizing fasciitis | 29 |
| 2 | 33 | Male | >16 | Left | Transhumeral | Trauma | 15 |
| 3 | 38 | Female | >2 | Right | Transhumeral | Trauma | 29 |
| 4 | 44 | Female | >3 | Right | Transradial | Compartment syndrome | 29 |
Table 2
Descriptors provided for characterizing the evoked percepts.
The various descriptors that subjects were asked to choose from while describing the modality and intensity of the evoked sensory percept. Visual analog scales (VAS) were presented as a slider bar and no specific numbers were shown.
| Naturalness | Depth | Mechanical | Tingle | Movement | Temperature |
|---|---|---|---|---|---|
| VAS (Totally Unnatural to Totally Natural) | Skin surface | Touch | Electrical | Vibration | VAS (Very Cold to Very Hot) |
| Below skin | Pressure | Tickle | Body/limb/joint | ||
| Diffuse | Sharp | Itch | Across skin | ||
| Both | Pins and Needles | ||||
| VAS (intensity) | VAS (intensity) | VAS (intensity) |
Additional files
-
Supplementary file 1
An interactive version of Figure 1 showing all percepts included in analyses in this study.
- https://cdn.elifesciences.org/articles/54349/elife-54349-supp1-v1.zip
-
Supplementary file 2
Summary of psychophysics testing for each subject.
For detection and discrimination trials the threshold (TH) and JND per stimulation channel are listed along with the corresponding frequency and pulse width that were used.
- https://cdn.elifesciences.org/articles/54349/elife-54349-supp2-v1.docx
-
Supplementary file 3
An interactive version of Figure 3.
Clicking on individual sectors provides additional detail.
- https://cdn.elifesciences.org/articles/54349/elife-54349-supp3-v1.zip
-
Transparent reporting form
- https://cdn.elifesciences.org/articles/54349/elife-54349-transrepform-v1.docx
Download links
A two-part list of links to download the article, or parts of the article, in various formats.
Downloads (link to download the article as PDF)
Open citations (links to open the citations from this article in various online reference manager services)
Cite this article (links to download the citations from this article in formats compatible with various reference manager tools)
Sensory restoration by epidural stimulation of the lateral spinal cord in upper-limb amputees
eLife 9:e54349.
https://doi.org/10.7554/eLife.54349


