Identification of an inhibitory neuron subtype, the L-stellate cell of the cochlear nucleus
- Oregon Hearing Research Center and Vollum Institute, Oregon Health and Science University, United States
- Physiology and Pharmacology Graduate Program, Oregon Health and Science University, United States
Figures
Figure 1
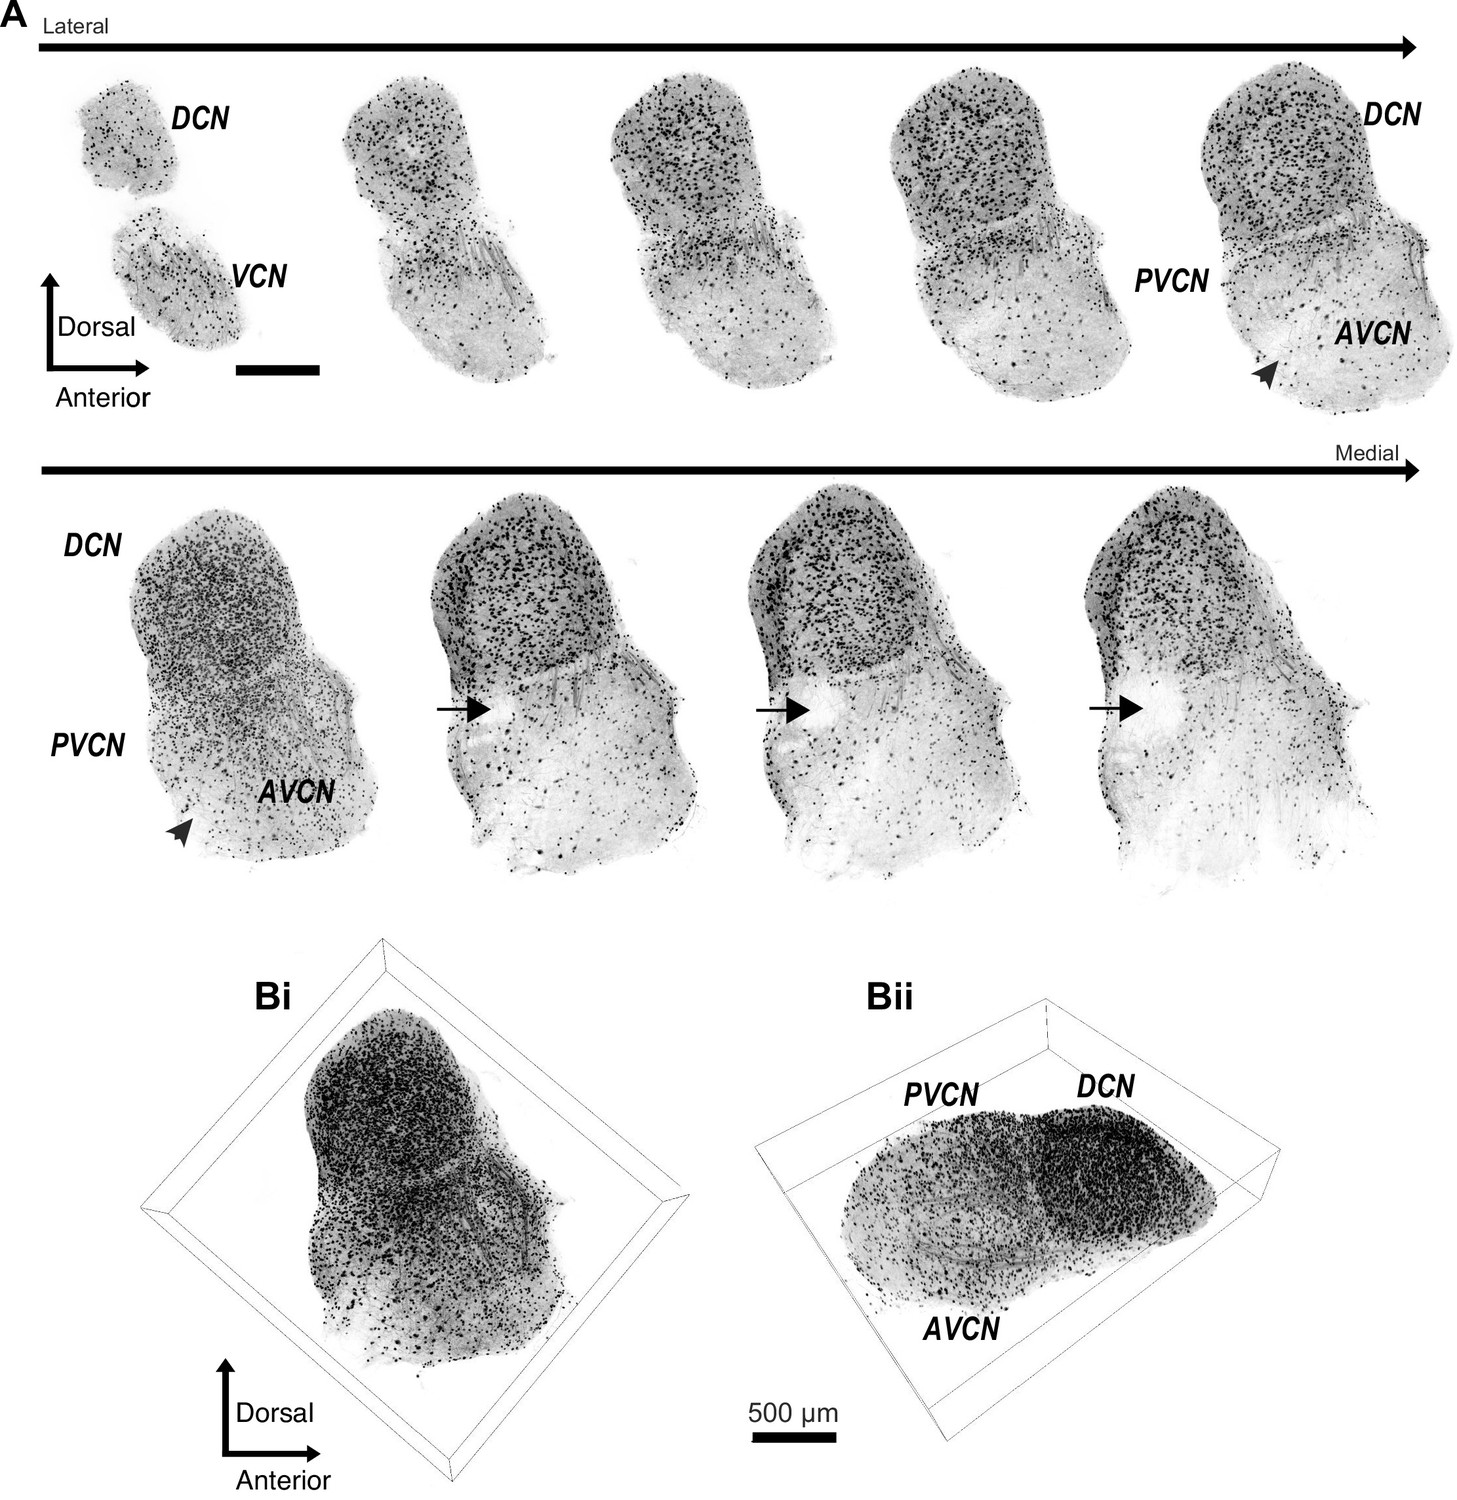
Diversity of glycinergic cell population in the CN.
(A) Entire CN was optically cleared using CUBIC-mount and imaged with a super-resolution confocal microscope. Examples of 50 μm thick image stacks of CN from lateral to medial sides. DCN has a dense population of glycinergic cells. Octopus cell region in the PVCN (arrow) shows a lack of glycinergic cells. Arrowhead: auditory nerve root. (Bi, ii) 3D images of the entire CN with different viewpoints show dense population of glycinergic cells not only the DCN but also in the VCN. Source data is available at https://doi.org/10.5061/dryad.69p8cz8xp. The zip archive, Figure_1_source_Data1_CN_series.tif.zip, contains CN images used for the quantitative analyses shown in Figures 1 and 2. Images were collected at 5 μm steps using Zeiss LSM880 with Airyscan super resolution microscope with 25× objective.
Figure 2
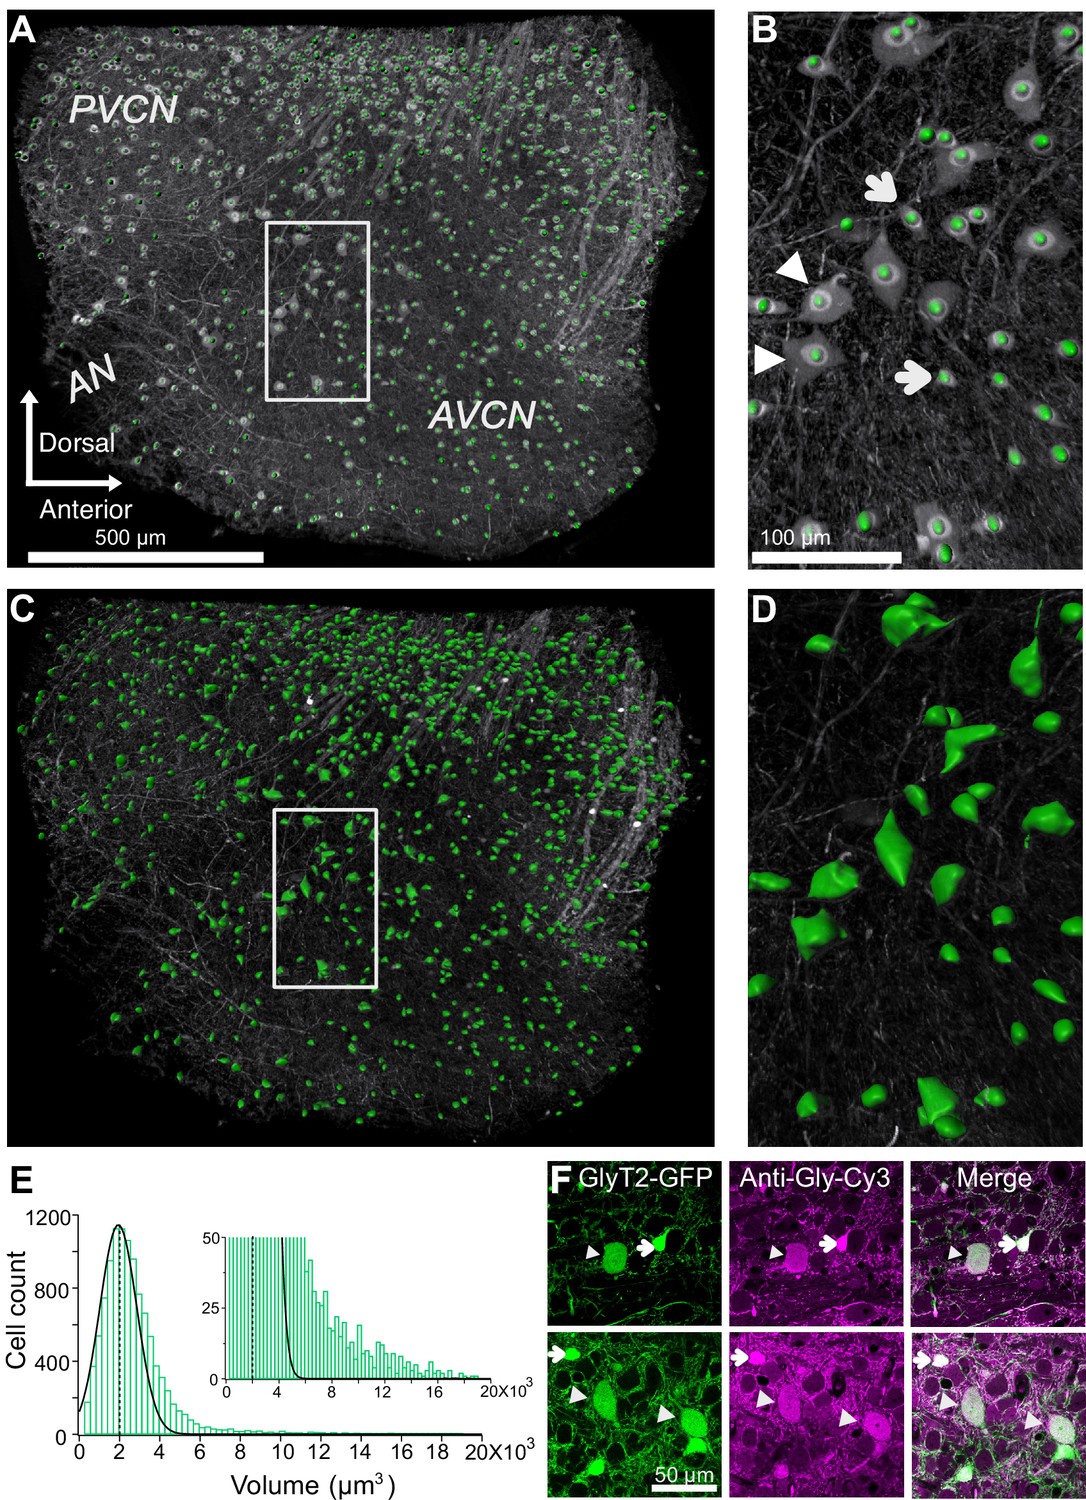
Quantification of glycinergic cells in the VCN.
Maximum image projection of a 150 μm thick VCN. Cell count and soma size quantification were restricted to glycinergic cells in the VCN. (A–B) Cell counts were quantified using ‘spot function’ in Imaris. Each green dot is counted as one cell. (B) There is an anatomically distinct glycinergic cell population in the VCN. Example image shows a mix of large (arrowheads) and small cells (arrows). (C–D) Soma volumes were measured with surface rendering program in Imaris. (E) Soma size distribution was positively skewed. Dashed line shows the average soma size. The distribution was fitted by a Gaussian curve. Majority of the glycinergic cells had small soma size, and minority have large soma size (inset). (F) Two representative images of VCN showing large (arrowheads) and small (arrow) glycinergic cells colabeled for glycine. Source data is available at https://doi.org/10.5061/dryad.69p8cz8xp. The spreadsheet Figure_2-Source_Data_1_cell_volume1.xlsx contains all the raw volume data for the four CNs used for the quantitative analyses shown in Figure 2. The individual files and their data are present in separate sheets.
Figure 3
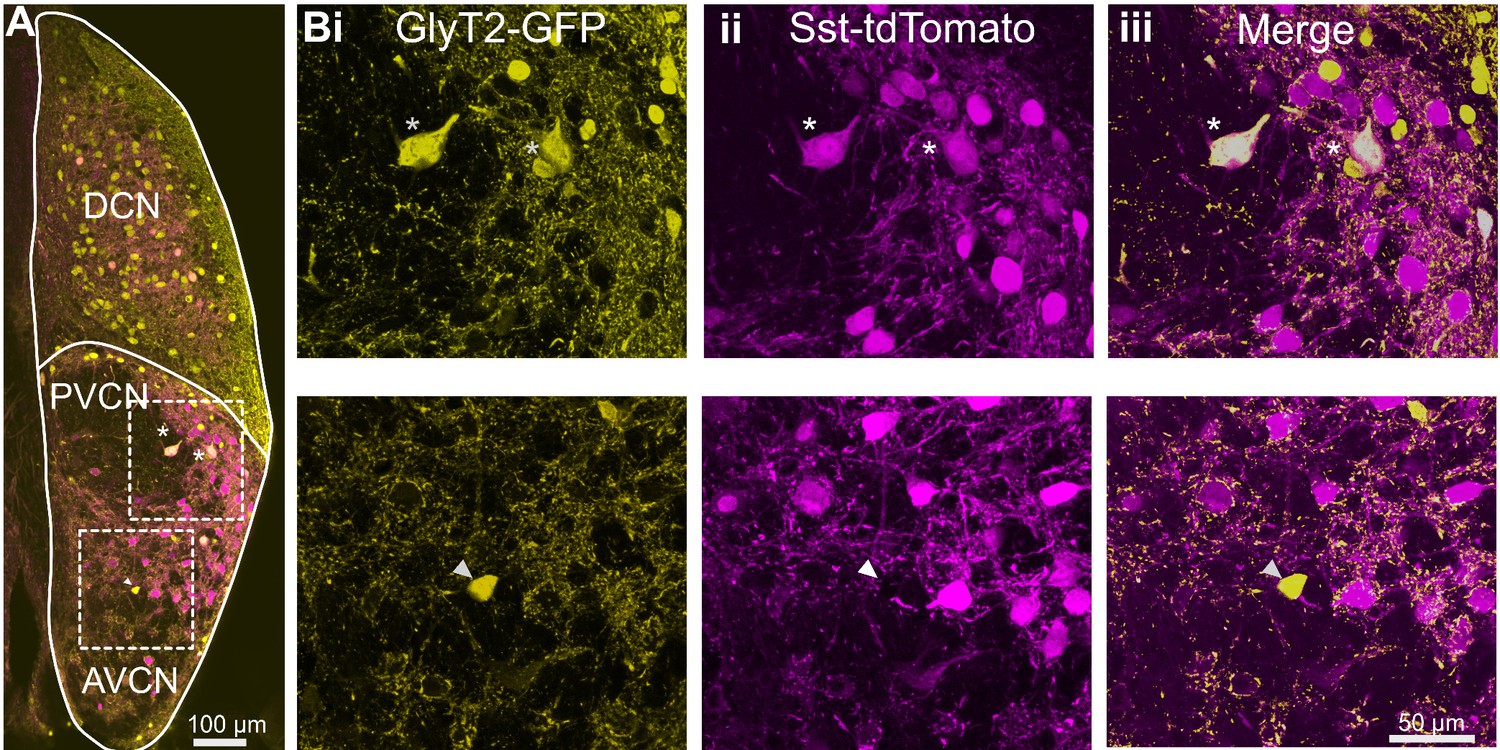
D-stellate cells are molecularly distinct from the small glycinergic cells.
(A) Coronal section of a CN from an SST-tdTomato::GlyT2-GFP mouse. (Bi-iii) D-stellate cells show strong colocalization of tdTomato and GFP (inset and top row, asterisk) whereas small glycinergic cells were tdTomato negative and GFP positive (bottom row).
Figure 4
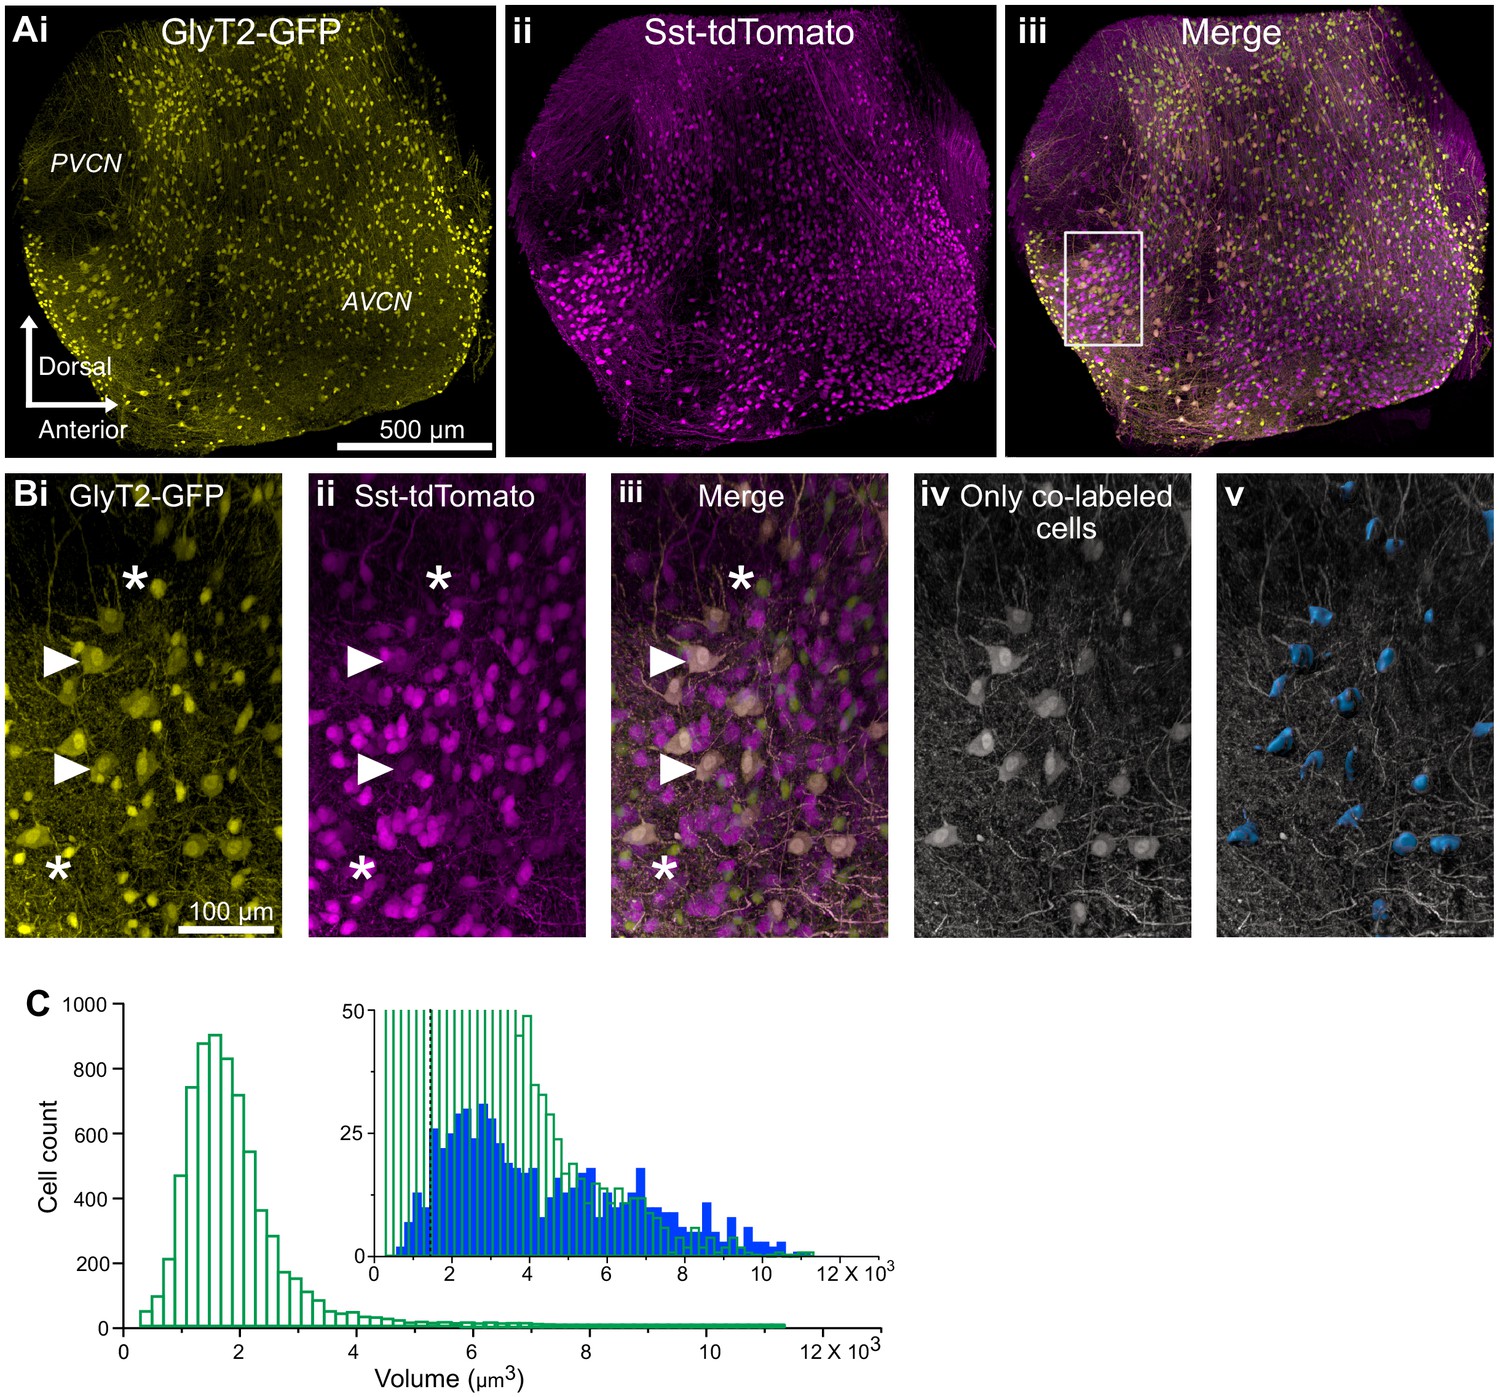
D-stellate cell types are molecularly distinct from the small glycinergic cells.
(A) 150 μm thick image stacks of optically cleared VCN from SST-tdTomato::GlyT2-GFP mouse showing GFP (i), tdTomato expressing cells (ii) and merge (iii). (B) An example area from VCN (inset, Aiii) showing large GFP (i) and tdTomato (ii) expressing cells colocalize (iii). (Biv-v) Only the double-labeled cells are shown and surfaces were rendered to measure soma size. (C) Soma size distribution of all the glycinergic GFP positive neurons. Inset, soma volumes of double-labeled cells (blue) compared to all GFP positive cells (green). Double-labeled cells were significantly larger than GFP-only cells (average soma volume, GFP only, 1826.55 ± 12.93 μm3 versus D-stellate cells, 4289.50 ± 98.29 μm3, n = 2 VCNs, two mice). However, numerically, the larger cells types composed only about 12% of all glycinergic neurons in VCN (GFP only, n = 3250 ± 55 versus. D-stellate cells, n = 380 ± 9). Dashed line shows the average soma size. Source data is available at https://doi.org/10.5061/dryad.69p8cz8xp. The spreadsheet Figure_4-Source_Data_1_cell_volume_SSt.xlsx contains all the raw volume data for the 2 CNs used for the quantitative analyses shown in Figure 4.
Figure 5
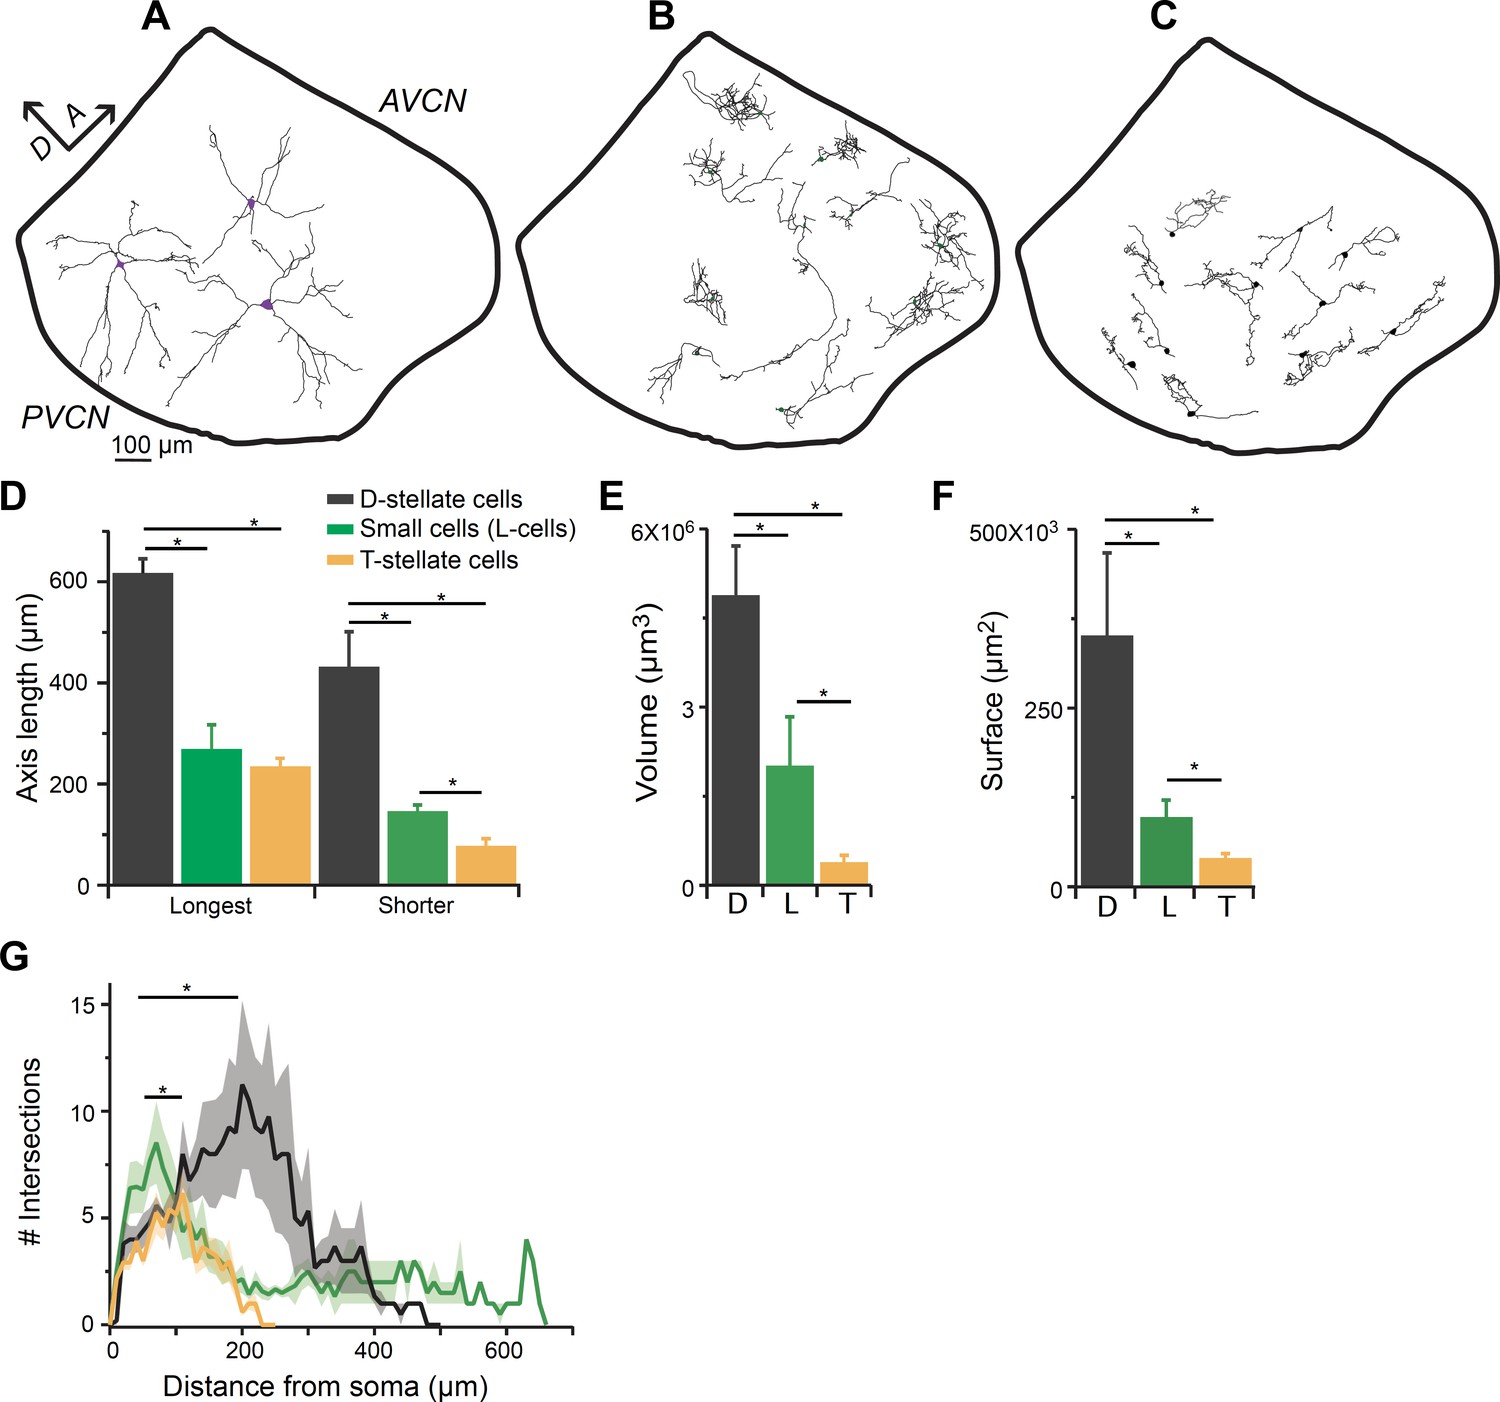
Smaller glycinergic cells are anatomically distinct from D- and T-stellate cells.
Biocytin filled neurons were reconstructed using Neurolucida. (A) D-stellate cells (large cells) exhibited typical radiate morphology whereas (B) the smaller glycinergic cells show restricted axonal and dendritic arbors. (C) T-stellate cells show tuffed dendritic arbors and occupy regions parallel to the isofrequency bands. (D) Spread of axonal-dendritic arbors was quantified by measuring the longest and shortest axis of the reconstructed structures. Smaller glycinergic cells had significantly restricted axonal-dendritic process compared with D-stellate cells (longest axis: D-stellate cells, 619.42 ± 45.78 μm versus. small cells, 271.43 ± 26.27 μm, p<0.001, t-test; shorter axis: D-stellate cells, 435.62 ± 1.82 μm, n = 6 cells versus small cells, 148.60 ± 12.03 μm, n = 17, p<0.001, t-test). In comparison to T-stellate cells, small glycinergic cells had similar spread of the axonal-dendritic field in the longest axis but occupied a significantly larger region in the shortest axis longest axis: T-stellate cells, 237.03 ± 16.67 μm versus small cells, 271.43 ± 26.27 μm, p<0.33, t-test; shorter axis: T-stellate cells, 79.73 ± 13.68 μm versus small cells, 148.60 ± 12.03 μm, p<0.005, t-test. D- and T-stellate cells had significantly larger volume (volume: D-stellate cells, 4.8 ± 1.2×106 μm3 versus small cells, 2.02 ± 0.69×106 μm3, p<0.001, t-test) (E) and surface area (D-stellate cells, 20.91 ± 1.07×103 μm2 versus small cells, 9.83 ± 2.71 × 103 μm2, p<0.01, t-test) (F) compared with the small glycinergic cells. (F) Sholl analysis showing that small cells had significantly higher branching closer to soma compared with D- and T-stellate cells (Sholl analysis, p<0.05, K-S test).
Figure 6 with 1 supplement
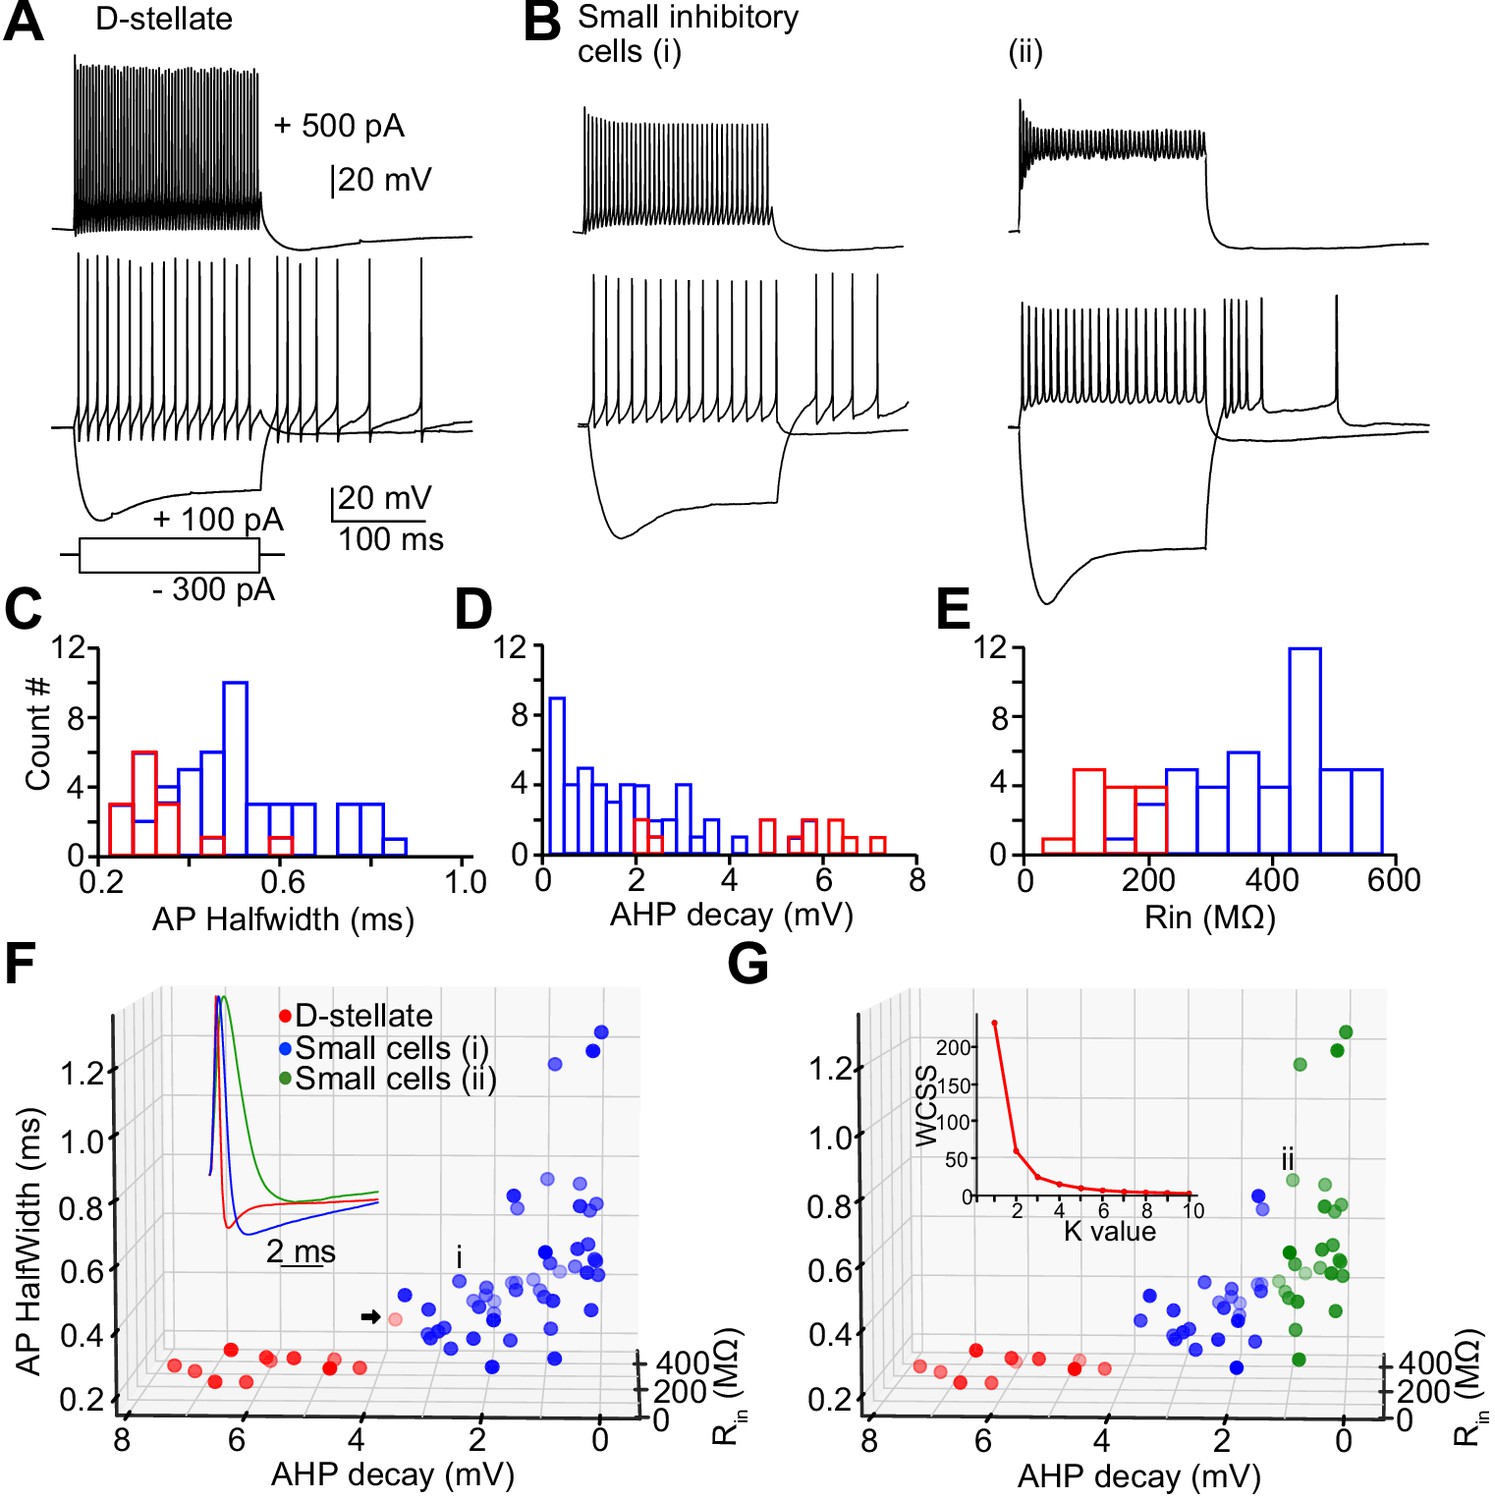
Heterogeneity of spiking properties of the small glycinergic cells.
Representative examples of D-stellate cells (A) and small glycinergic cell types (B) responding to current injections (+500 pA, +100 pA, and −300 pA). All cells showed sustained firing responses to +100 pA current injections. Small cells exhibited diverse spike amplitude adaptation in responses to strong (+500 pA) current steps (top, Bi-ii). (C–E) Histogram of AP halfwidth, AHP decay, and Rin (F) Classification of glycinergic cells based on the AP halfwidth, AHP decay, and Rin. The elbow method was used to calculate the optimal number of clusters (Panel 6G, inset [labels, Within cluster sum of squares (WCSS)]). Glycinergic cells are group into clusters based on K-means cluster analysis (K = 2) (red: D-stellate cells, blue: small cells, color gradient: front [dark] to back [light]). (G) K = 3 resulted in further classification of small cells into two sub clusters (blue and green). Arrow points to the D-stellate cell included in small cells when K = 3, i and ii represents small cells in blue and green clusters, respectively. Source data is available at https://doi.org/10.5061/dryad.69p8cz8xp. The spreadsheet Figure_6-Source_Data_1_intrinsic_properties.xlsx contains all the raw data used for the quantitative analyses shown in Figure 6.
Figure 6—figure supplement 1
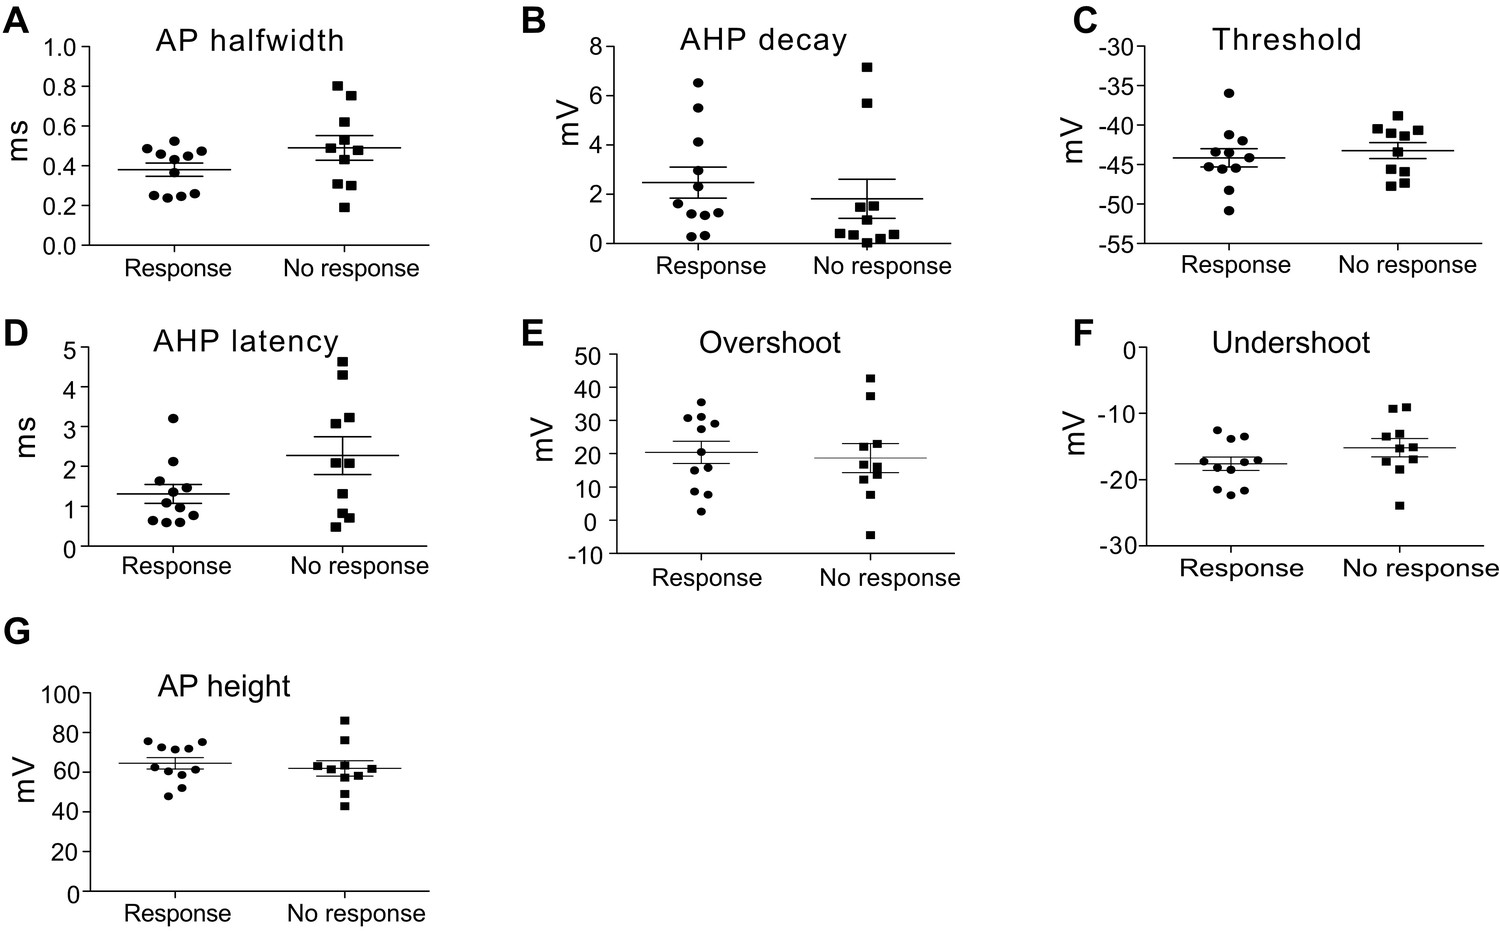
Membrane properties of small glycinergic cells to carbachol sensitivity.
(A) AP halfwidth: action potential half width (response, average = 0.38 ± 0.03, n = 11 versus no response = 0.49 ± 0.06, n = 10, p=0.1264, t-test). (B) AHP decay: decay time of action potential afterhyperpolarization (response, average = 2.48 ± 0.63 versus no response = 1.82 ± 0.79, p=0.52). (C) Threshold: action potential threshold (response, average = −44.15 ± 1.16 versus no response = −43.24 ± 1.01, p=0.56). (D) AP AHP latency: action potential hyperpolarization latency from spike peak (response, average = 1.31 ± 0.24 versus no response = 2.27 ± 0.47, p=0.04). (E) Overshoot: peak of action potential positive to 0 mV (response, average = 20.36 ± 3.35 versus no response = 18.69 ± 4.33, p=0.76). (F) Undershoot: Peak of hyperpolarization from threshold (response, average = −17.63 ± 1.01 versus no response = −15.21 ± 1.39, p=0.17). (G) AP height: action potential amplitude from threshold to peak (response, average = 64.50 ± 2.86 versus no response = 61.93 ± 3.88, p=0.30).
Figure 7
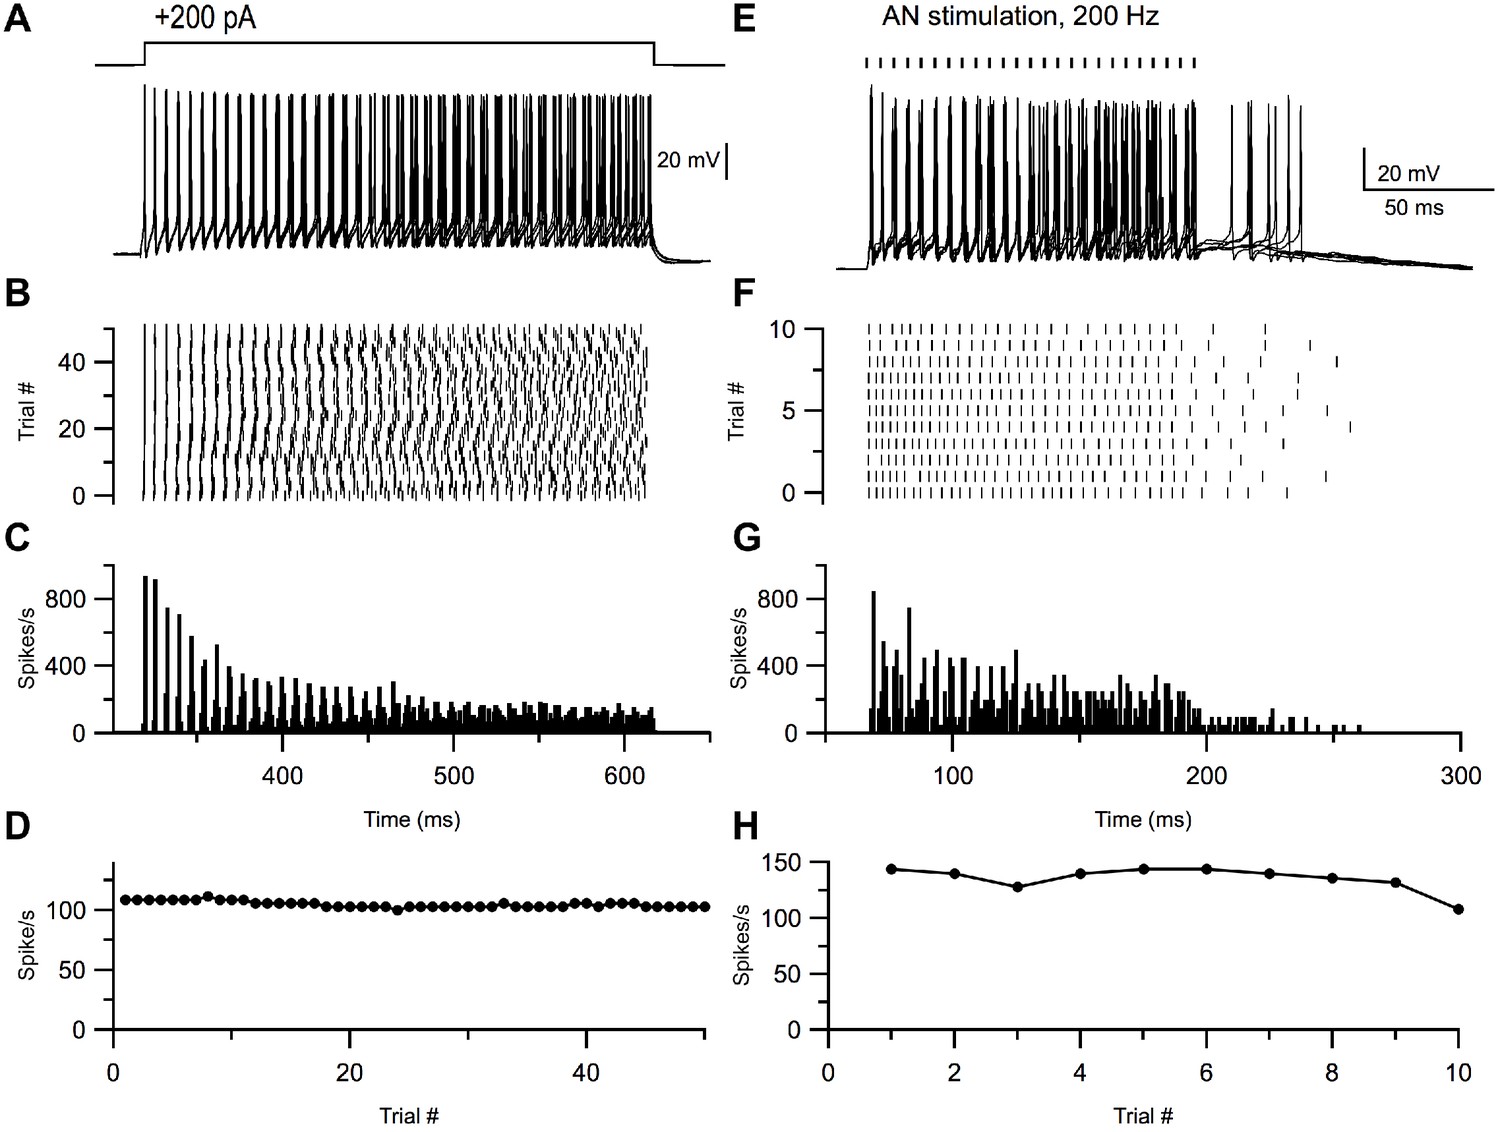
Small glycinergic cells show chopper responses.
Representative example of a small glycinergic cell responding to +200 pA current injections (A) and electrical stimulation at 200 Hz (E). Raster (B, F), PSTH (C, G), and firing rate (D, H) of cell in A and E, respectively.
Figure 8
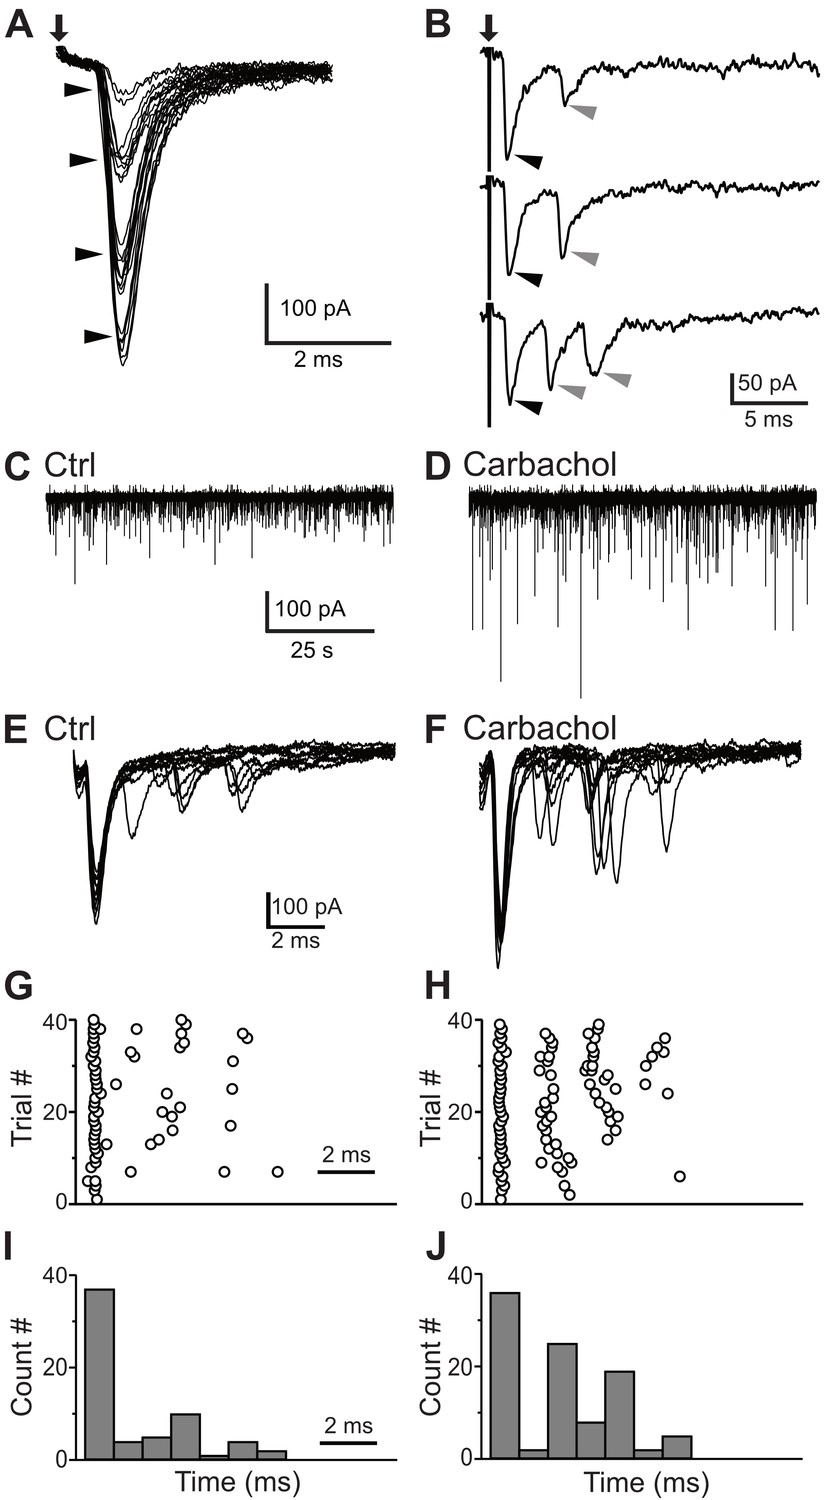
Synaptic inputs to the small glycinergic cells.
(A) Stimulation of AN root evoked EPSCs with graded amplitudes. The EPSCs amplitude increased with stronger stimulus strength (arrowheads). (B) Representative example of disynaptic EPSCs with longer latency in response to AN root stimulation (gray arrowheads). (C) Example trace showing sEPSCs measured in small cells under control condition (C) and carbachol (D). The increased in sEPSCs frequency confirms T-stellate cells as disynaptic source of EPSCs. (E) Representative example of eEPSCs in response to AN root stimulation under control conditions (E), raster (G) and PSTH (I) of cell in E. (F–H) Carbachol application significantly increased the number of delayed EPSCs (short latency events < 1 ms, percentage increase = 17.57 ± 0.11%; longer latency events, percentage increase = 92.00 ± 0.13%).
Figure 9

Small cells do not project contralaterally.
(A) Retrogradely-transported fluorescent latex beads were injected into the contralateral CN of GlyT2-GFP mice. (B) VCN from the Ipsilateral CN was examined for neurons with retrobeads. (C) All the double-labeled neurons had large soma size (arrowhead) consistent with D-stellate cells. D-stellate cells (length of longest axis = 26.91 ± 3.92 μm, n = 47, n = 3 CNs). Ci, GFP; Cii, retrobeads; Ciii, merge.
Figure 10
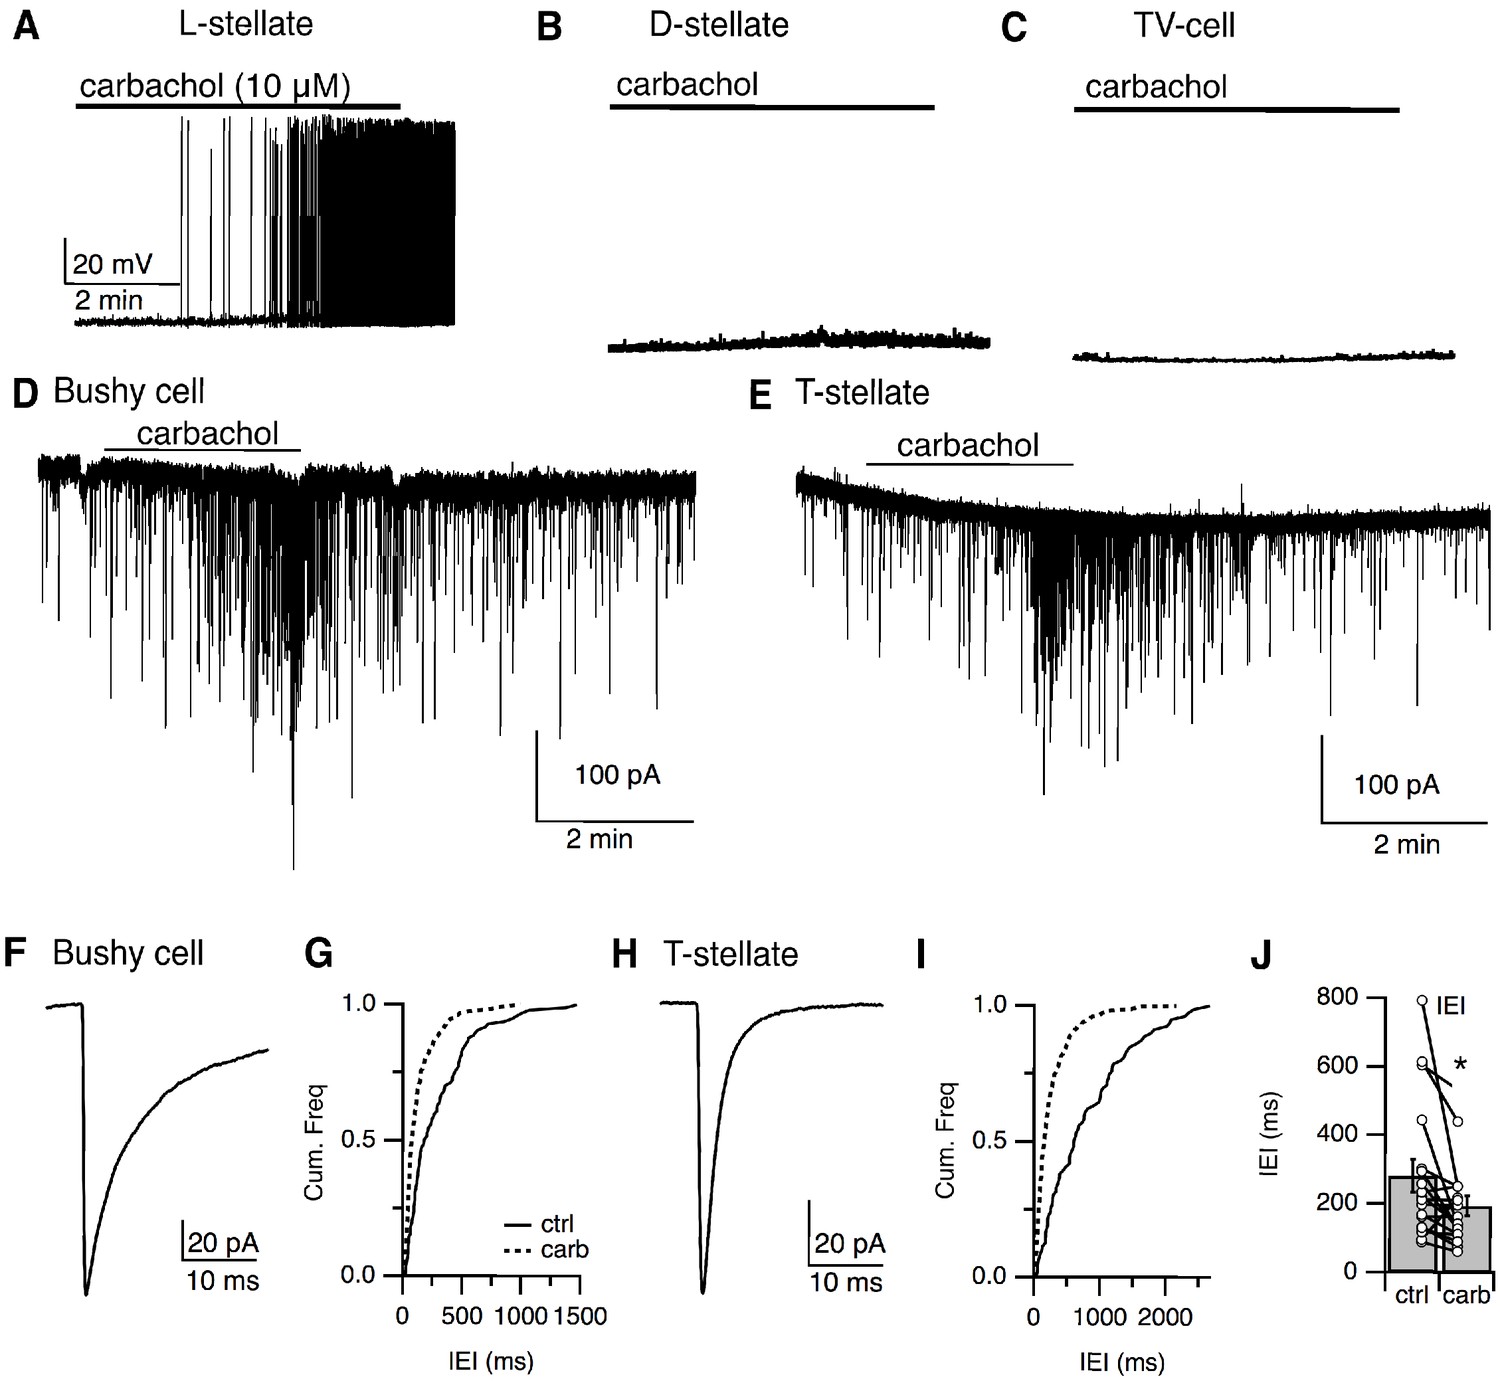
Local stellate cells (L-cells) provide local inhibition to primary cells in the VCN.
(A–C) Representative responses to cholinergic agonist (carbachol, 10 μM) by small (L-cells) (A), D-stellate (B), tuberculoventral (TV) cells (C). Small cells were activated by carbachol. D-stellate and TV cells failed to respond to carbachol application. IPSCs in principal cells, bushy cells (D), and T-stellate cells (E) in the VCN were induced by carbachol application, confirming that small inhibitory neurons were local interneurons. (F, H) Time course of sIPSCs from bushy cells and T-stellate (bushy cell, τ = 7.22 ± 1.40 ms, n = 9, T-stellate, τ = 2.28 ± 0.07 ms, n = 9). (G, I) Cumulative histogram of inter-event internal under control and carbachol application. (J). Carbachol application resulted in a significant increase in sIPSCs frequency (inter-event interval, control = 280.44 ± 47.56 ms versus carbachol = 191.21 ± 28.99 ms, p<0.02, t-test).
Figure 11

Summary of circuitry in the VCN.
Neurons in the VCN including principal excitatory cells (T-stellate and bushy cells) and inhibitory cells (D-stellate and L-stellate cells) receive excitatory input from the auditory nerve (AN). L-stellate cells also receive polysynaptic inputs from T-stellate cells. L-stellate cells make local inhibitory synaptic contacts on principal cells of the VCN (* possibly function as narrow band local inhibitor). Principal cells also receive inhibition from D-stellate cells present in the contralateral VCN.
Tables
Table 1
Membrane properties of the glycinergic cells in the VCN.
Rin: Input resistance; AP height: action potential amplitude from threshold to peak; AP halfwidth: action potential width at half amplitude, measured between threshold and peak; AP AHP decay: voltage measured between peak of undershoot to Vm 1 ms later; AP AHP latency: action potential hyperpolarization latency; Rate of rise: rate of rise of action potential; Threshold: action potential threshold; Overshoot: peak of action potential from 0 mV; Undershoot: Peak of hyperpolarization from baseline; Firing rate: number of spikes/s. See the source data for Figure 6 available at https://doi.org/10.5061/dryad.69p8cz8xp.
| Measure | D-stellate | Small cell |
|---|---|---|
| Rin (MOhm) | 114.87 ± 12.77 | 305.54 ± 16.93 |
| AP height (mV) | 70.14 ± 2.59 | 63.92 ± 1.60 |
| AP halfwidth (ms) | 0.31 ± 0.02 | 0.55 ± 0.03 |
| AP AHP (mV) | 4.18 ± 0.62 | 1.55 ± 0.20 |
| AP AHP latency (ms) | 0.87 ± 0.10 | 1.81 ± 0.15 |
| Rate of rise (V/s) | 317.67 ± 17.85 | 288.06 ± 14.71 |
| Threshold (mV) | −45.57 ± 1.18 | −43.46 ± 0.49 |
| Overshoot (mV) | 24.57 ± 3.05 | 20.46 ± 1.59 |
| Undershoot (mV) | −17.79 ± 1.16 | −14.03 ± 0.59 |
| Firing rate (sp/s) | 213.52 ± 17.31 | 225.72 ± 14.94 |
Key resources table
| Reagent type (species) or resource | Designation | Source or reference | Identifiers | Additional information |
|---|---|---|---|---|
| Strain, strain background (M. musculus) | C57BL/6J | Jackson Laboratory | RRID:JAX:000664 | |
| Strain, strain background (M. musculus) | GlyT2-EGFP, Tg(Slc6a5-EGFP)1Uze | MGI, Zeilhofer et al., 2005 | RRID:MGI:3835459 | |
| Strain, strain background (M. musculus) | Sst-IRES-Cre, (Sst(tm2.1(cre)Zjh)) | MGI and Jackson Laboratory | RRID:MGI_4838416 RRID:JAX_013044 | |
| Strain, strain background (M. musculus) | Rosa 26, synonyms Ai9(RCL-tdT) | Jackson Laboratory PMID:22446880 | RRID:MGI_3809523 RRID:JAX_007909 | |
| Chemical compound, drug | Strychnine hydrochloride | Sigma | Cat# S8753 | |
| Chemical compound, drug | SR-95531 hydrobromide | Tocris | Cat# 1262 | |
| Chemical compound, drug | NBQX disodium salt | Tocris | Cat# 1044 | |
| Chemical compound, drug | (+)-MK-801 hydrogen maleate | Sigma | Cat# M107 | |
| Chemical compound, drug | Carbachol (carbamoylcholine chloride) | Sigma | Cat# C4382 | |
| Chemical compound, drug | Biocytin | ThermoFisher Scientific | Cat# B1592 | |
| Antibody | anti-GFP (Chicken polyclonal) | Aves Labs | Cat# GFP-1020 RRID:AB_10000240 | IHC (1:2000) |
| Antibody | anti-DsRed (Rabbit polyclonal) | Clontech | Cat# 632496 RRID:AB_10013483 | IHC (1:1000) |
| Antibody | anti-Glycine (Rabbit polyclonal) | Millipore Sigma | Cat# Ab139 RRID:AB_90582 | IHC (1:500) |
| Antibody | anti-rabbit Cy3 (Donkey polyclonal) | Jackson Immuno Research Labs | Cat# 711-165-152 RRID:AB_2307443 | IHC (1:500) |
| Antibody | anti-chicken Alexa Fluor 488 (Donkey polyclonal) | Jackson Immuno Research Labs | Cat# 703-545-155 RRID:AB_2340375 | IHC (1:500) |
| Antibody | anti-Rabbit Alexa Fluor 594 (Donkey polyclonal) | Jackson Immuno Research Labs | Cat# 711-585-152 RRID:AB_2340621 | IHC (1:400) |
| Chemical compound, drug | Tetrakis (N,N,N′,N′-tetrakis (2-hydroxypropyl) ethylenediamine) | Sigma | Cat# 122262 | |
| Chemical compound, drug | Red Retrobeads | LumaFluor. Inc | Red Retrobeads | |
| Software, algorithm | pClamp 10 | Molecular Devices | RRID:SCR_011323 | |
| Software, algorithm | Igor Pro 8 | WaveMetrics | RRID:SCR_000325 | |
| Software, algorithm | NeuroMatic | Rothman and Silver, 2018; DOI:10.3389 | RRID:SCR_004186 | |
| Software, algorithm | Axograph | Axograph | RRID:SCR_014284 | |
| Software, algorithm | Prism 5 | GraphPad | RRID:SCR_002798 | |
| Software, algorithm | Excel | Microsoft | RRID:SCR_016137 | |
| Software, algorithm | Imaris | Bitplane | RRID:SCR_007370 | |
| Software, algorithm | Zen Black | Zeiss | RRID:SCR_013672 | |
| Software, algorithm | ImageJ | National Institute of Health, ImageJ.net | RRID:SCR_003070 | |
| Software, algorithm | FIJI | Fiji.sc | RRID:SCR_002285 | |
| Software, algorithm | Affinity Designer | Serif | RRID:SCR_016952 | |
| Software, algorithm | Adobe Illustrator | Adobe | RRID:SCR_010279 |
Additional files
Download links
A two-part list of links to download the article, or parts of the article, in various formats.
Downloads (link to download the article as PDF)
Open citations (links to open the citations from this article in various online reference manager services)
Cite this article (links to download the citations from this article in formats compatible with various reference manager tools)
Identification of an inhibitory neuron subtype, the L-stellate cell of the cochlear nucleus
eLife 9:e54350.
https://doi.org/10.7554/eLife.54350


