Direct reprogramming of human smooth muscle and vascular endothelial cells reveals defects associated with aging and Hutchinson-Gilford progeria syndrome
- Molecular and Cell Biology Laboratory, The Salk Institute for Biological Studies, United States
- Paul F. Glenn Center for Biology of Aging Research at The Salk Institute, United States
- The Razavi Newman Integrative Genomics and Bioinformatics Core (IGC), The Salk Institute for Biological Studies, United States
Figures
Figure 1 with 2 supplements
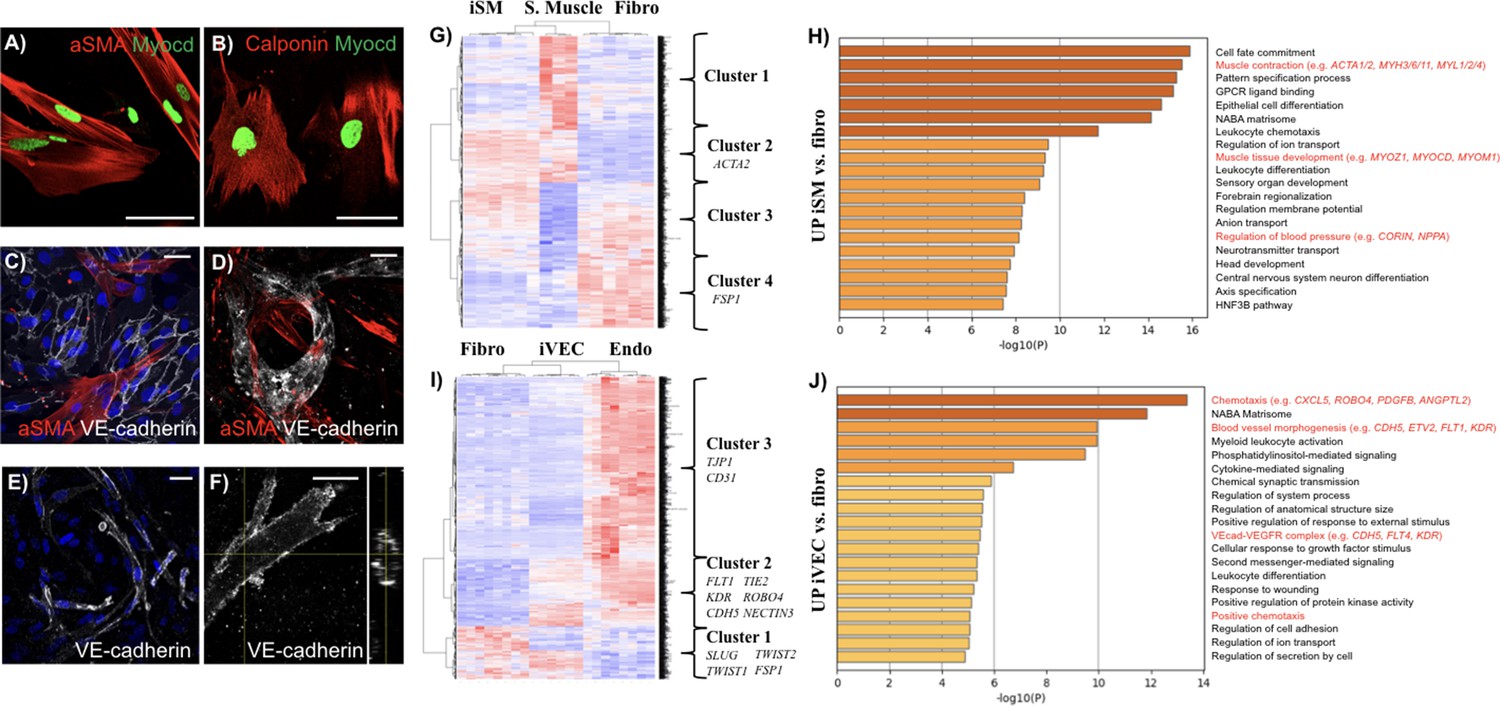
Characterization of directly reprogrammed vascular cells.
iSMCs express the identity markers αSMA (A) and calponin (B). iSMCs contribute to the formation of endothelial monolayers (C) and 3D microvascular networks (D). iVECs form 3D vessel-like structures in fibrin matrix (E) and show open lumens (F). Both iSMCs and iVECs express cell identity genes showing a progressive transition from fibroblasts to mature vascular cells (G–J). iSMC gene expression profile compared to primary SMCs and fibroblasts (analysis based on 1,852 DE genes between primary SMCs and fibroblasts). N = 6 donors for iSMCs and fibroblasts, N = 3 donors for SMCs. Z score = ± 3. DE genes with log2FC > 1 and FDR < 0.05 (G). Gene ontology analysis reveals that iSMCs upregulate genes associated with muscle development, contraction and blood pressure regulation compared to fibroblasts (H). iVEC gene expression profile compared to primary VECs and fibroblasts (analysis based on 1,780 DE genes between primary VECs and fibroblasts). N = 6 donors for iVECs, primary VECs and fibroblasts. Z score = ± 4. DE genes with log2FC > 1 and FDR < 0.05 (I). Gene ontology showing that iVECs upregulate genes associated with chemotaxis, blood vessel morphogenesis and VE cadherin–VEGFR complex compared to fibroblasts, indication of ongoing differentiation towards and endothelial phenotype (J). Scale bars: 25 µm.
-
Figure 1—source code 1
Statistical models used for DE analysis and clustering analysis.
- https://cdn.elifesciences.org/articles/54383/elife-54383-fig1-code1-v1.zip
-
Figure 1—source data 1
DE analysis.
- https://cdn.elifesciences.org/articles/54383/elife-54383-fig1-data1-v1.xlsx
-
Figure 1—source data 2
Clustering analysis.
- https://cdn.elifesciences.org/articles/54383/elife-54383-fig1-data2-v1.xlsx
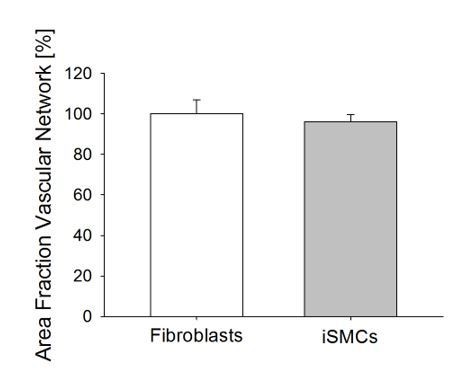
Figure 1—figure supplement 1
Quantification of the vascular area fraction in 3D matrices embedding a co-culture of VECs and fibroblasts or iSMCs (Student’s t-test with p=0.61).
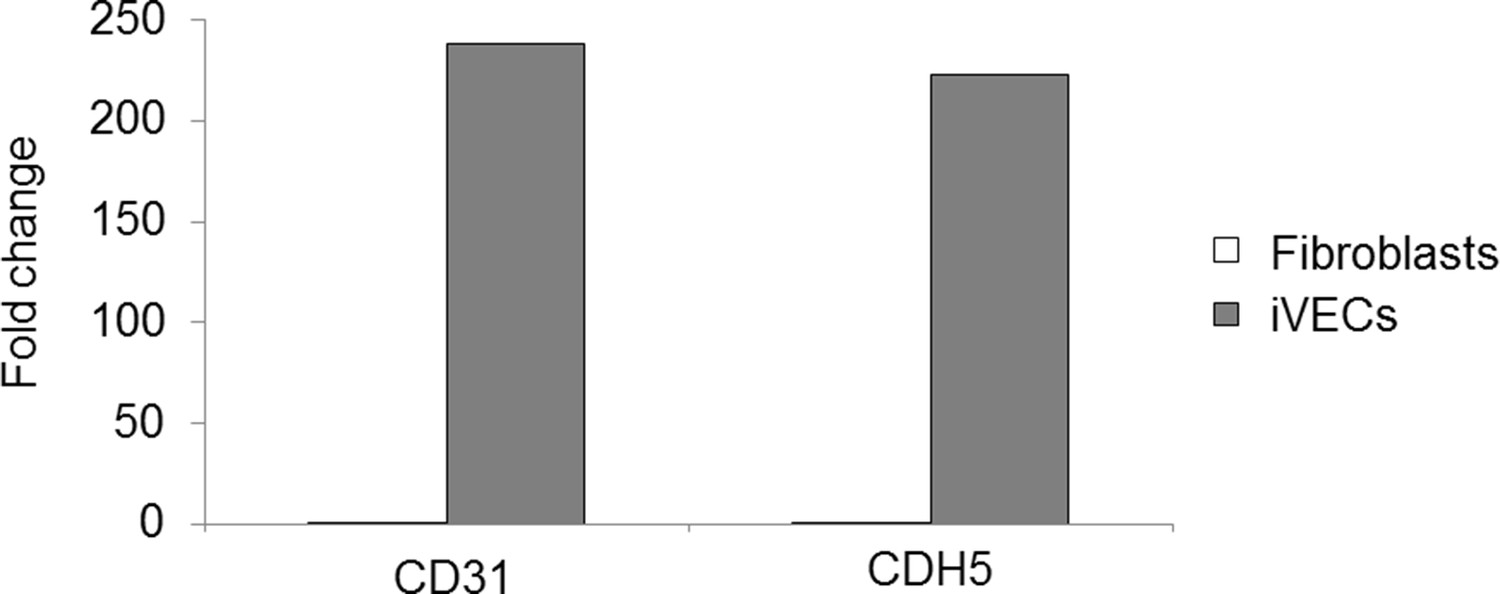
Figure 1—figure supplement 2

Representative FACS plot showing iVEC sorting based on CD31 expression.
Region P4 refers to CD31 positive cells labeled with AlexaFluor488 secondary antibody.
Figure 2 with 7 supplements
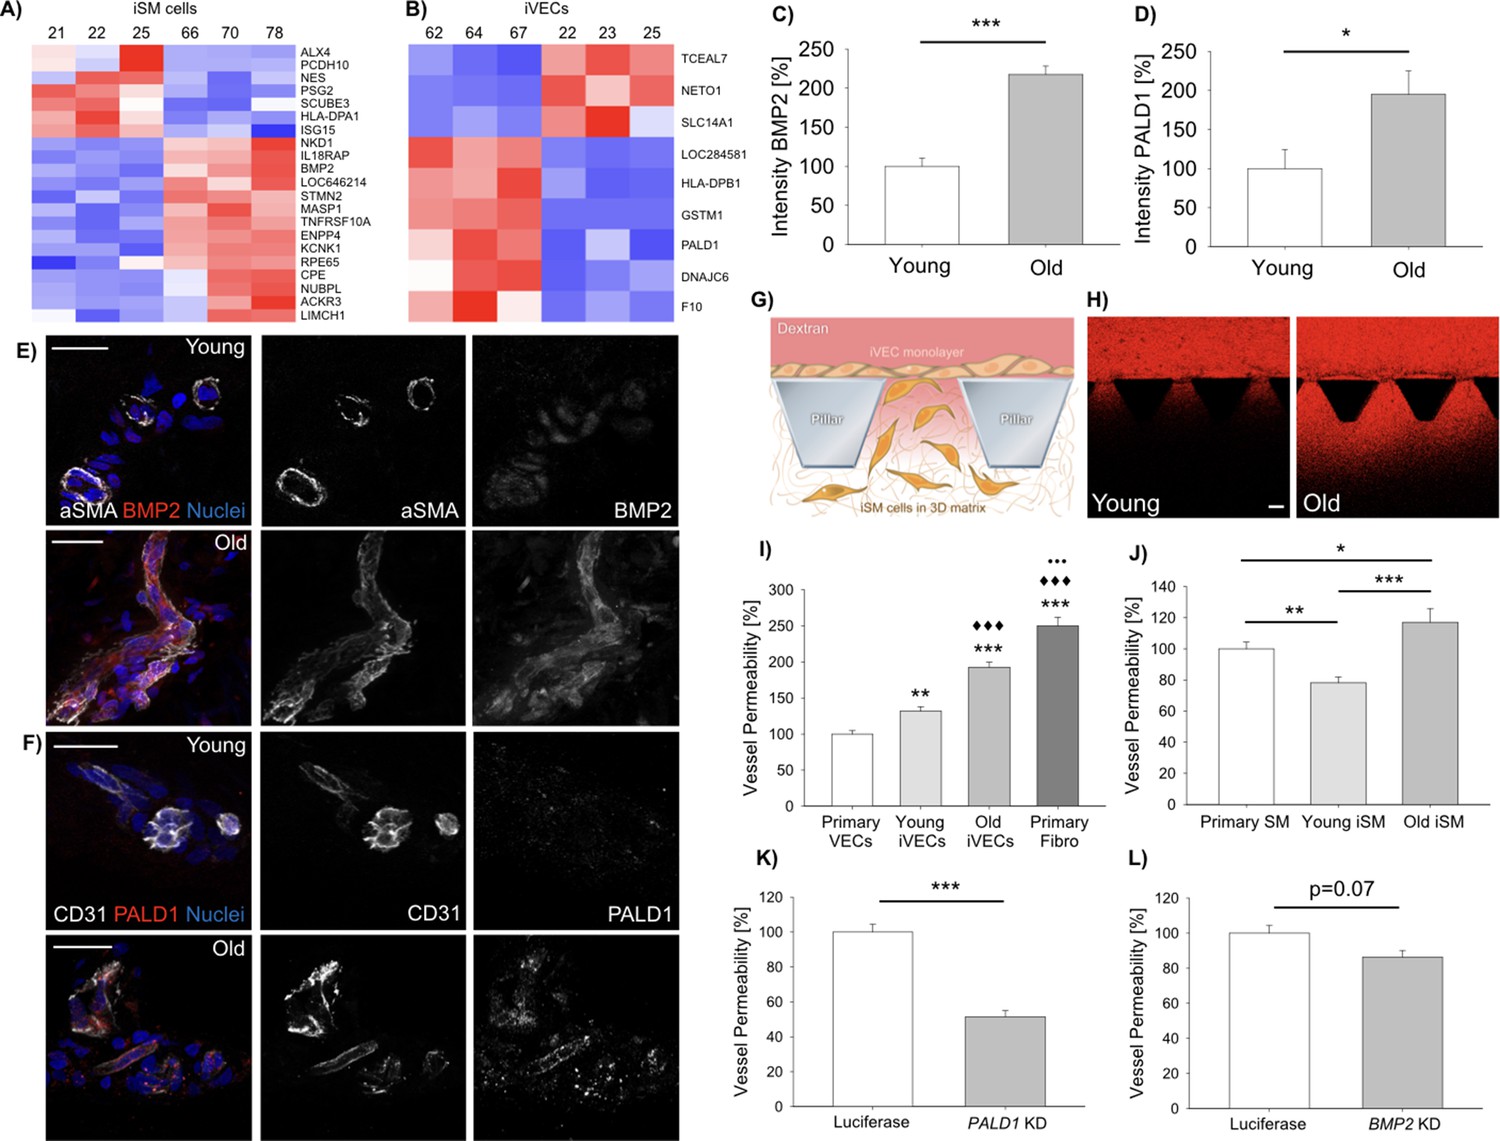
Vascular cells reprogrammed from young vs. old donors show gene expression and functional differences.
Heat-map representing DE genes between reprogrammed vascular cells from young (N = 3) vs. old (N = 3) donors (iSMCs (A), iVECs (B)). Z score = ± 1.5. DE genes with log2FC > 1 and FDR < 0.05. Quantification of BMP2 (C) and PALD1 (D) expression in human skin biopsies from young vs. old donors (N = 2 donors per condition; N = 10 tissue sections per condition; Student’s t-test with p<0.001 (***) and p<0.05 (*)). Representative images of BMP2 (E) and PALD1 (F) from skin biopsies obtained from young vs. old donors. Scale bars: 50 µm. Quantification of vascular permeability using young vs. old reprogrammed cells (G–J). Schematic showing the generation of an endothelial monolayer covering the interface with a 3D matrix embedding SMCs. Vascular permeability was quantified by measuring the variation of 70 kDa dextran fluorescent intensity across the interface (G). Representative images of dextran flow (red) through the endothelial monolayer in presence of young vs. old reprogrammed cells. Scale bar: 100 µm (H). Quantification of vascular permeability in presence of young vs. old iVECs (I, at least N = 40 independent measurements per condition in three biological replicates; ANOVA with Holm-Sidak test; comparison with primary VECs (** is p<0.01 and *** is p<0.001); comparison with young iVECs (♦♦♦is p<0.001); comparison with old iVECs (••• is p<0.001)) or young vs. old iSMCs (J, at least N = 40 independent measurements per condition in three biological replicates; ANOVA with Holm-Sidak test; * is p<0.05, ** is p<0.01 and *** is p<0.001). Quantification of vascular permeability in presence of PALD1 KD (K) or BMP2 KD (L) in primary VECs and SMCs, respectively (at least N = 60 independent measurements per condition in three biological replicates for each KD experiment; Student's t-test; *** is p<0.001).
Figure 2—figure supplement 1
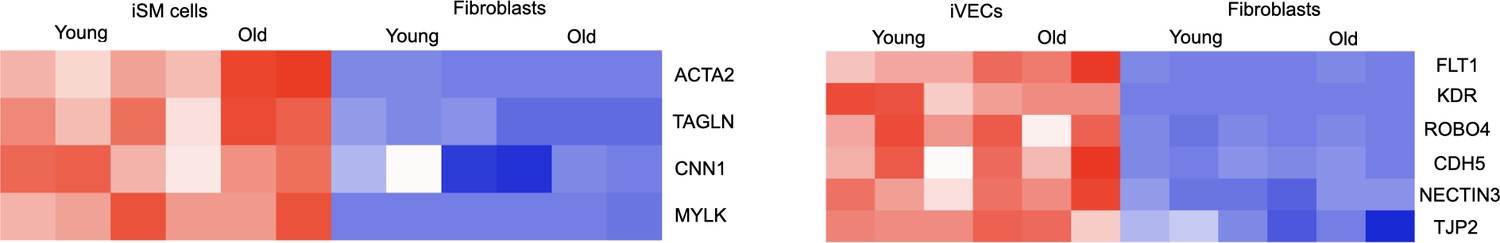
Heat-maps representing key cell identity genes for both iSM cells and iVECs derived from young and old donors.
Fibroblasts were included as control. Z score = ± 1. All these genes were not DE comparing young and old donors.
Figure 2—figure supplement 2
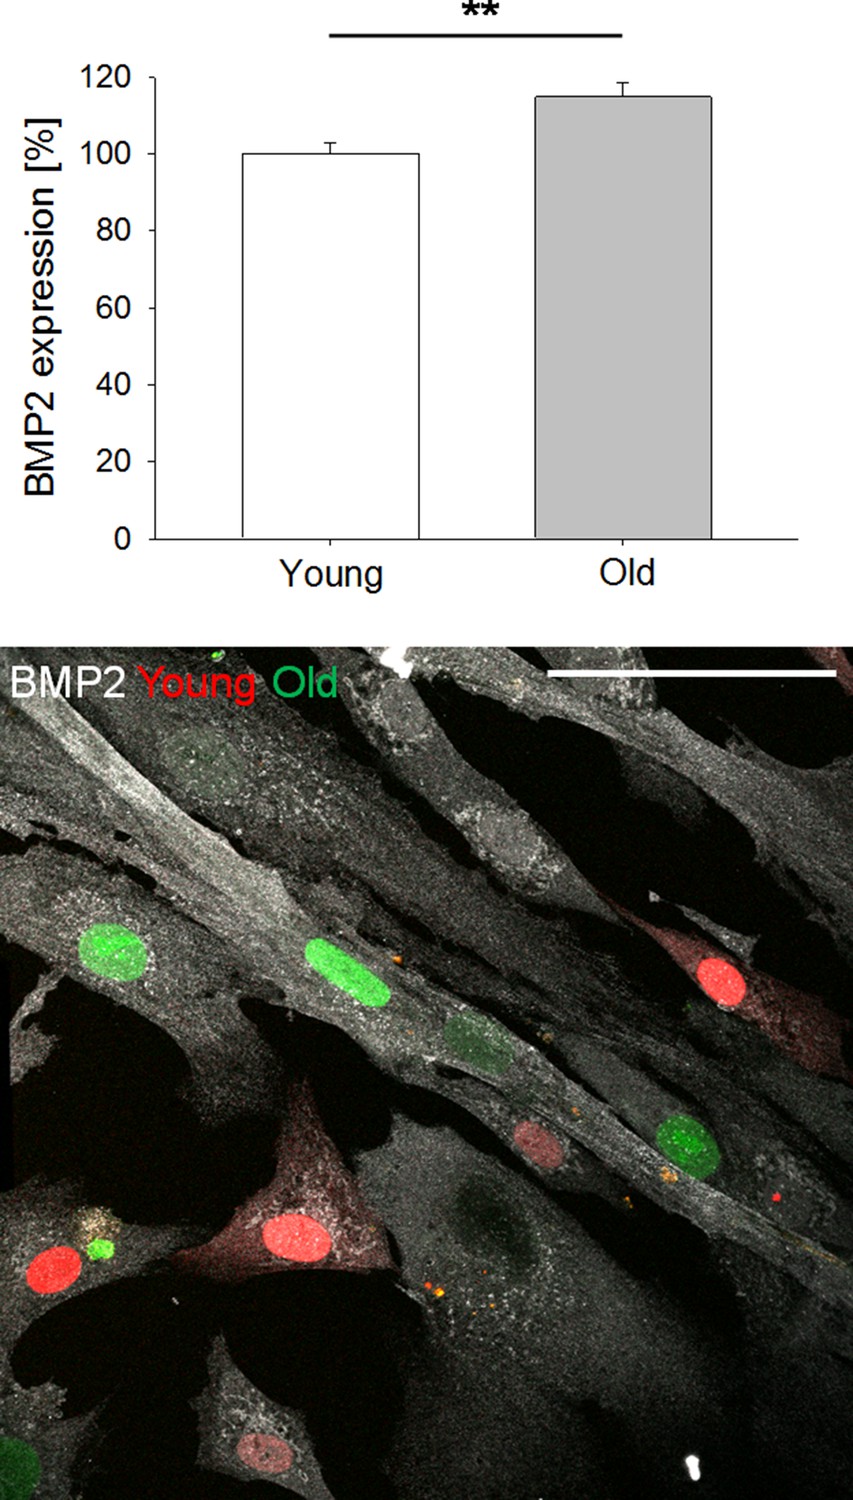
BMP2 expression by iSMCs reprogrammed from young (19 y.o.) vs. old (67 y.o.) donor.
Representative image showing young (mCherry MYOCD) and old (EGFP MYOCD) iSMCs. Experiments were also performed with the reciprocal tagging. At least N = 25 independent measurements in three biological replicates. Student’s t-test, p<0.01 (**). Scale bar: 50 µm.
Figure 2—figure supplement 3

Representative images of GSTM1 expression by endothelial cells within human skin biopsies from young vs.old donors (N = 2 donors per condition, 10 tissue sections per condition; Student’s t-test with p<0.01 (**)).
Scale bars: 100 µm.
Figure 2—figure supplement 4
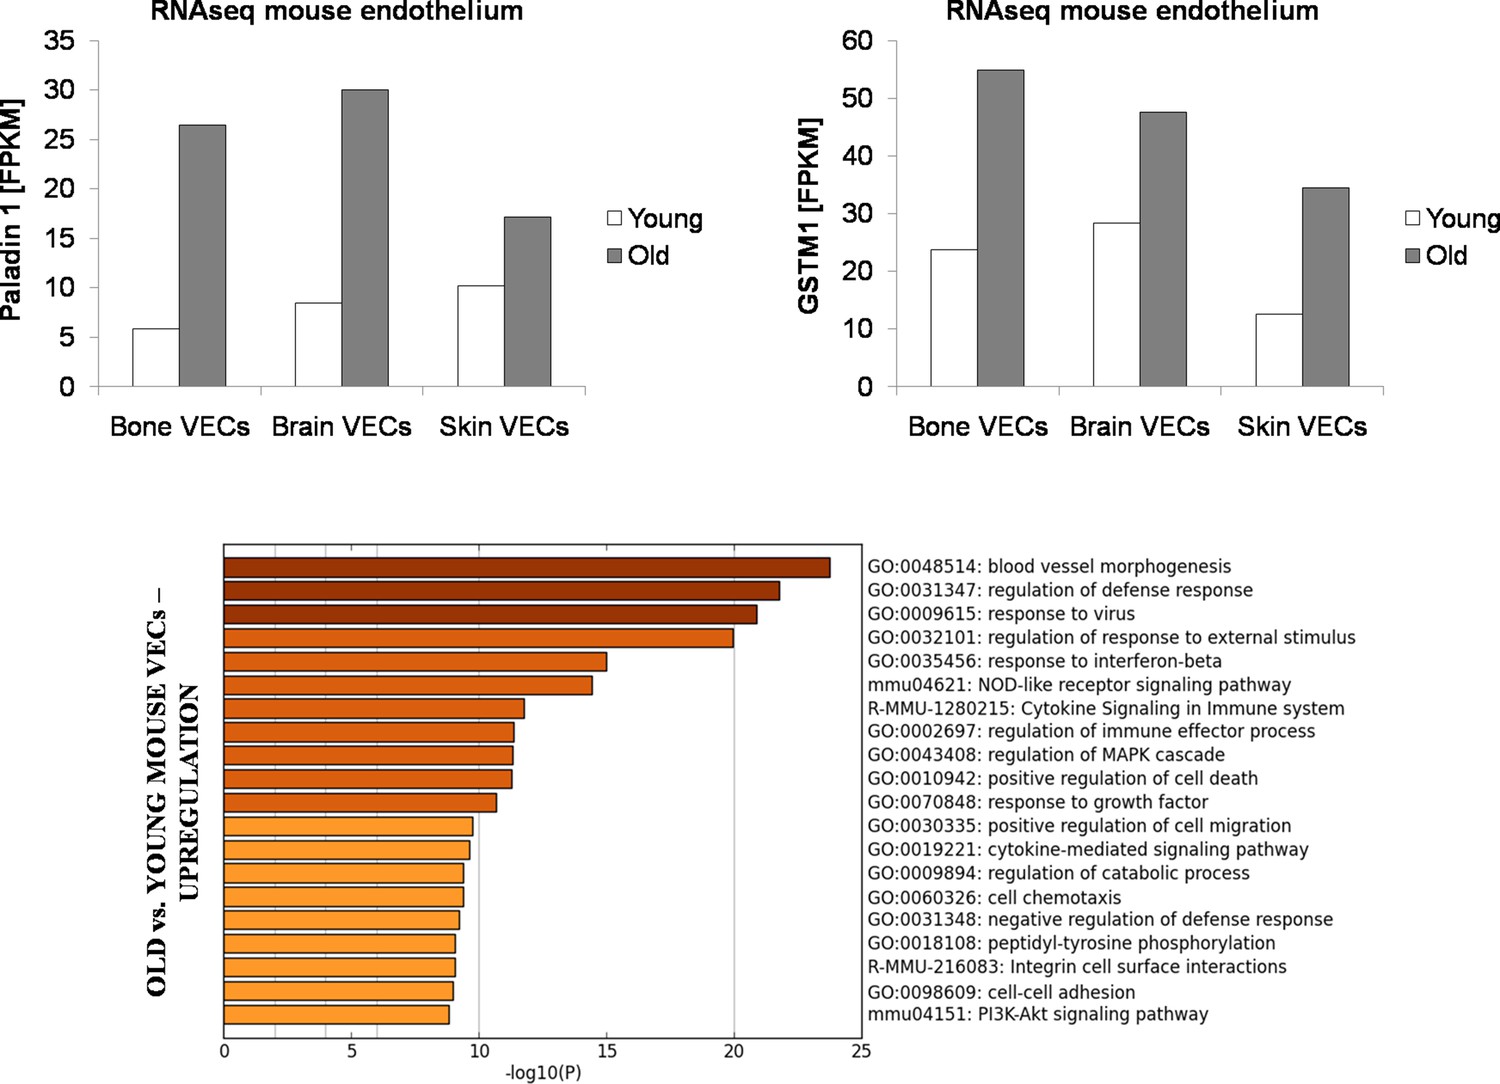
FPKM values for PALD1and GSTM1 from RNAseq performed on primary mouse endothelial cells from bone marrow, brain and skin of young (3 months) vs. old (18 months) mice.
Biological processes upregulated in old vs. young mouse VECs (pool of bone marrow, brain and skin VECs). It is interesting to observe the upregulation in old mouse VECs of biological processes associated with immune system activation and inflammation, consistent with the general concept that aging is associated with chronic inflammation. Cells were derived from N = 3 animals per age group and then pooled for RNAseq.
Figure 2—figure supplement 5
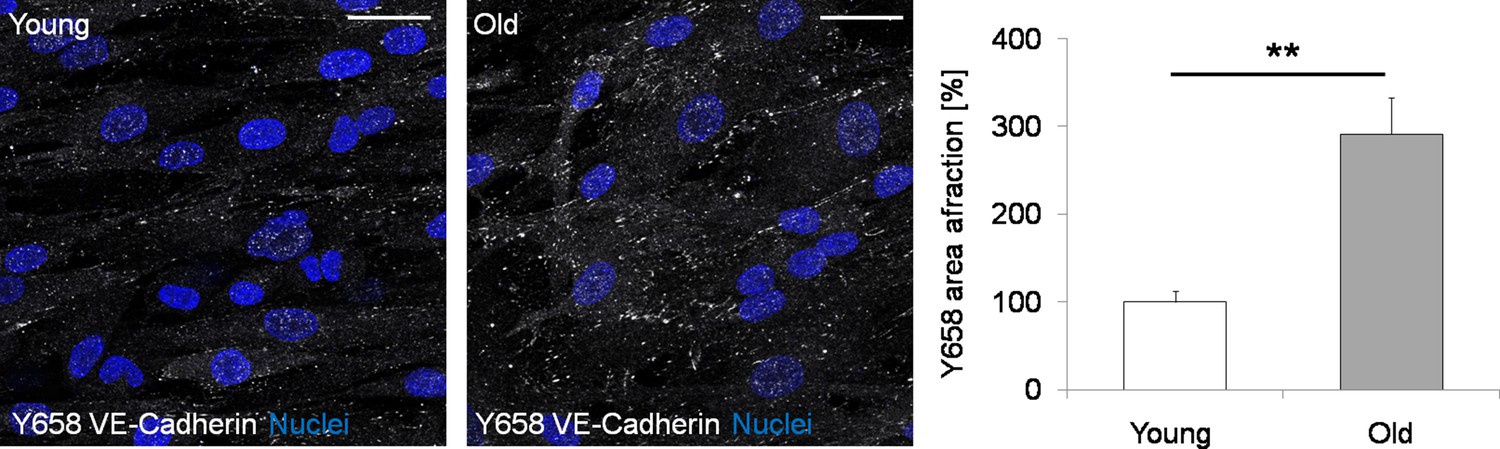
Representative images and quantification of Y658 VE-Cadherin (white) in iVECs derived from young and old donors.
The higher amount of Y658 staining in old iVECs (Student’s t-test with p<0.01 (**) from N = 3 biological replicates) suggests that cell-cell junctions might be compromised in reprogrammed cells derived from old donors. Nuclei: blue. Scale bars: 25 µm.
Figure 2—figure supplement 6
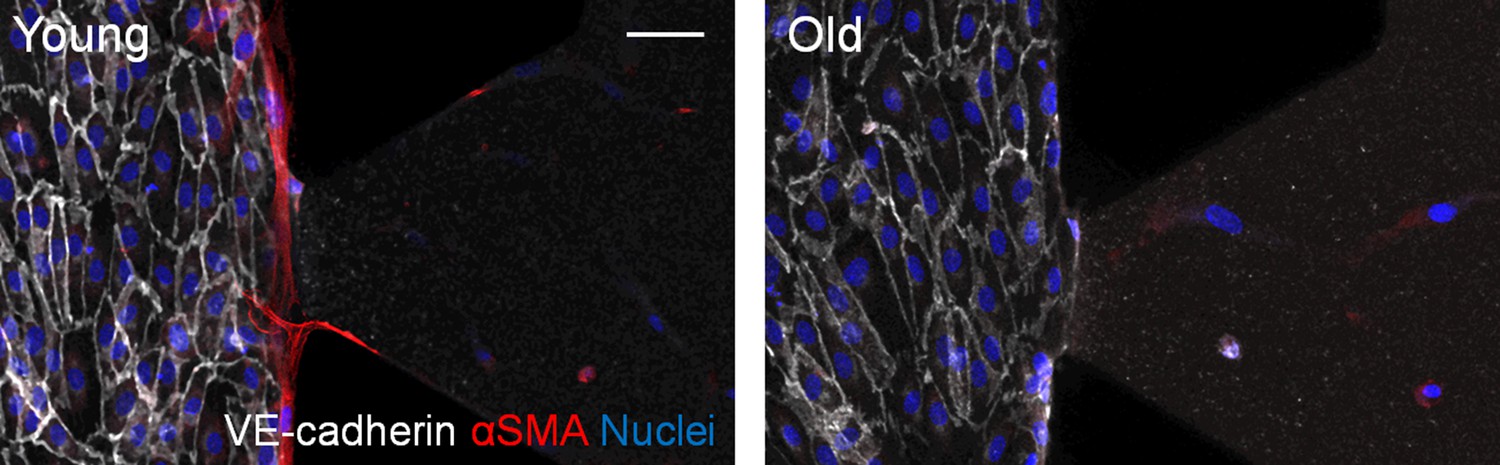
Representative images of microfluidic devices seeded with iSMCs reprogrammed from young or old fibroblasts.
VECs stained with VE-cadherin (white) cover the lateral channel and the interface with the 3D matrix embedding iSMCs (red, αSMA). iSMCs from young donors migrate towards the endothelial layer. Nuclei: blue. Scale bar: 50 µm.
Figure 2—figure supplement 7
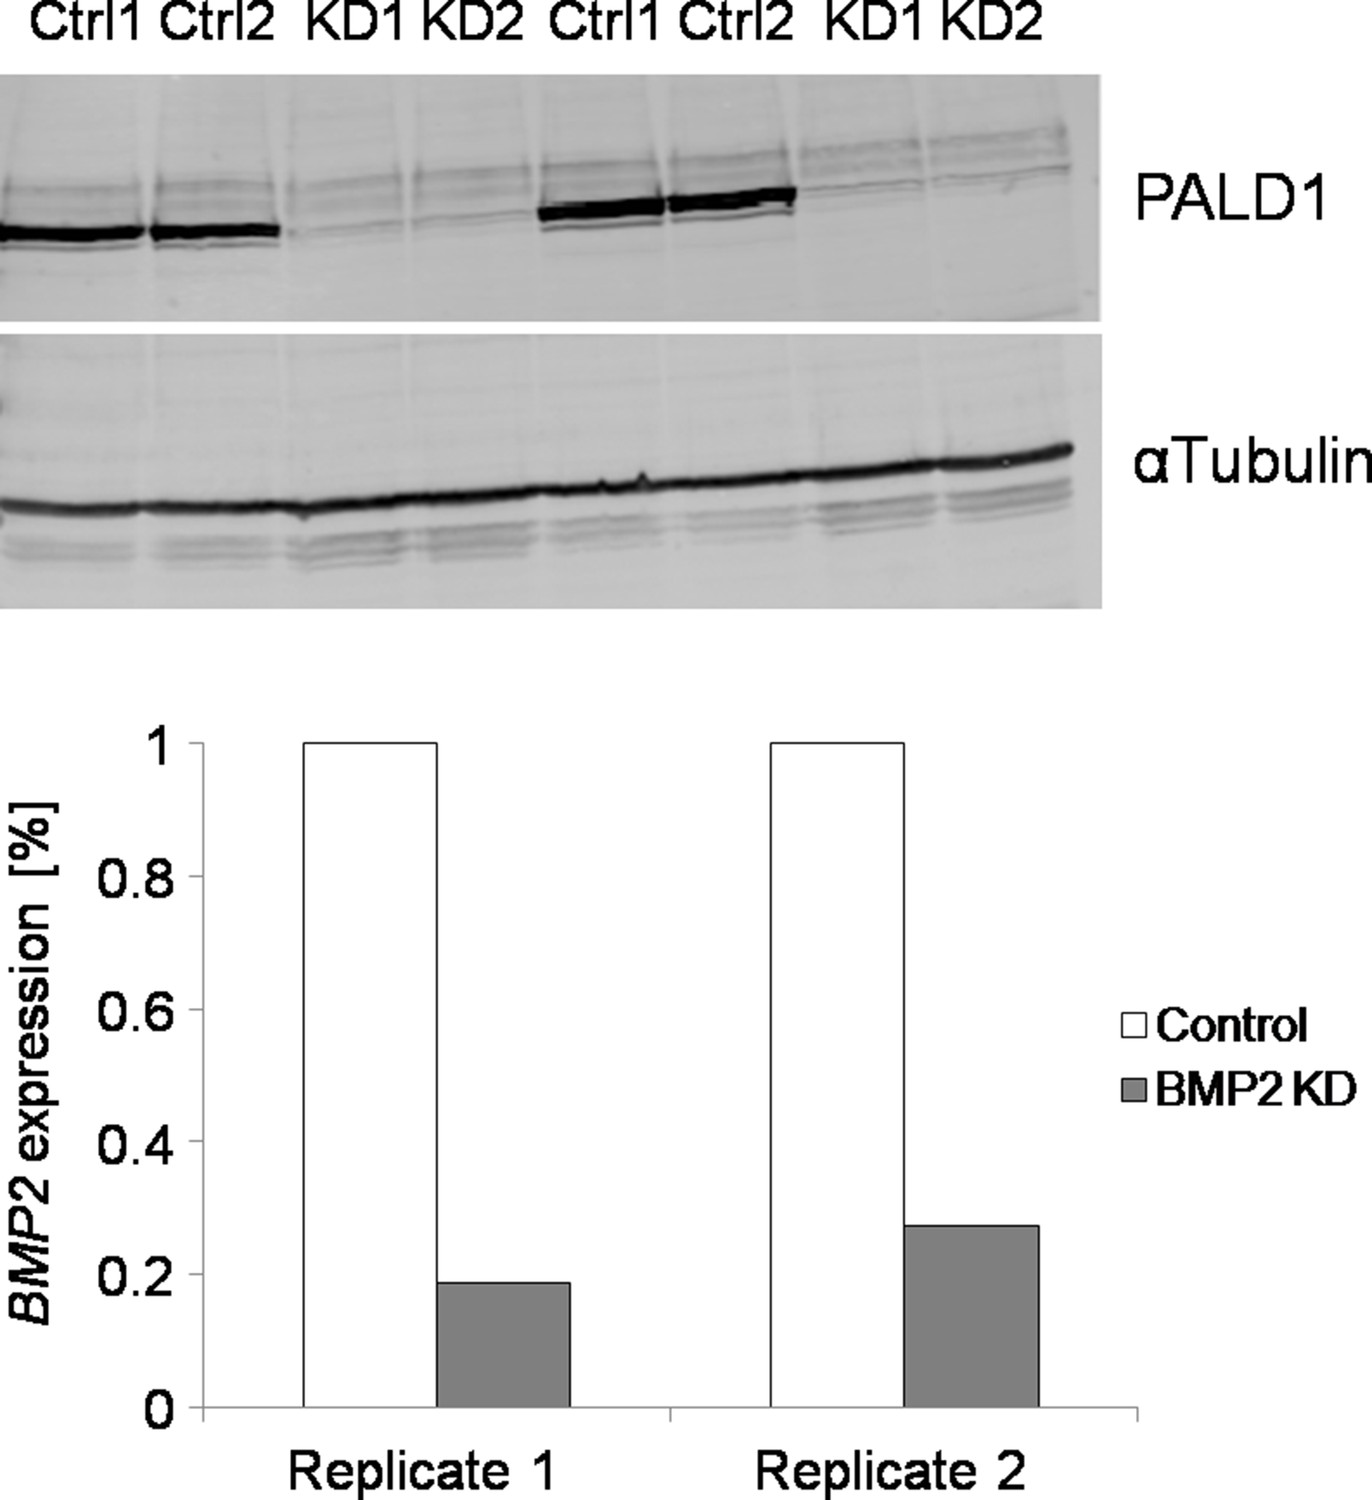
Validation of KD of PALD1 and BMP2 in VECs and SMCs, respectively (N = 2 biological replicates).
Note that BMP2 KD was validated using qPCR due to technical problems with any of the tested anti-BMP2 antibodies (Western Blot). The use of these antibodies resulted in multiple aspecific bands.
Figure 3 with 1 supplement
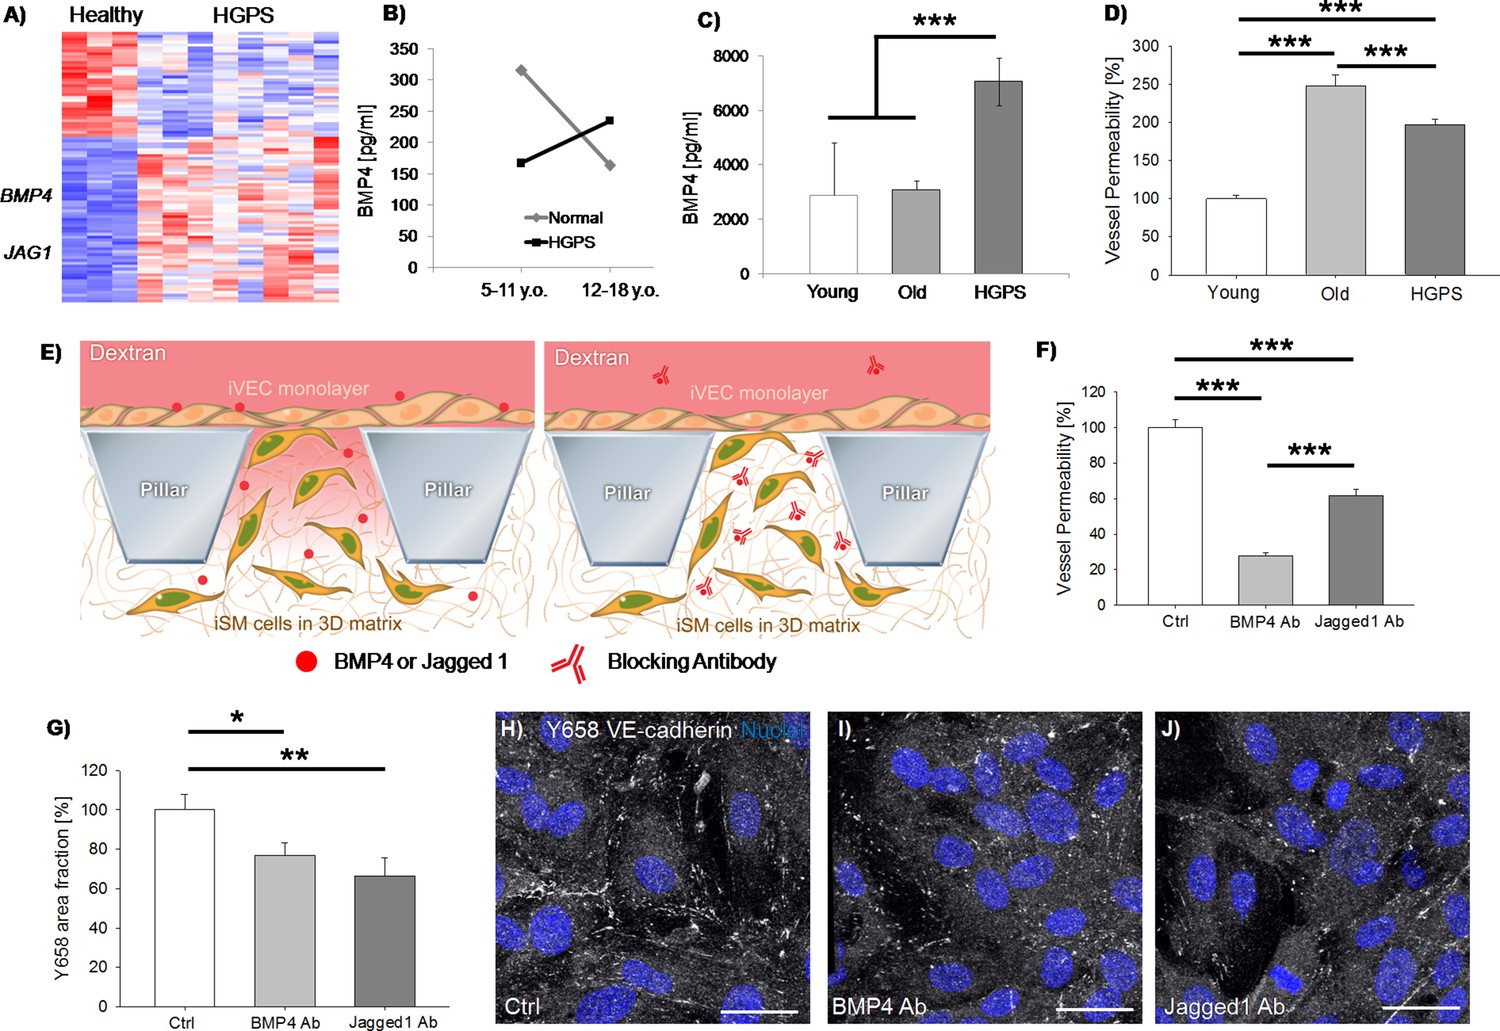
iSMCs reprogrammed from HGPS fibroblasts show signatures of vascular dysfunction.
Heat-map representing DE genes between iSMCs reprogrammed from healthy (N = 3) vs. HGPS (N = 8) donors. Z score = ± 2. DE genes with log2FC > 1 and FDR < 0.05 (A). ELISA measurement of BMP4 in the serum of HGPS and age-matched healthy human donors (B, Student’s t-test with p=0.4 for normal vs. HGPS 5–11 y.o.; p=0.575 for normal vs. HGPS 12–18 y.o.; Student’s t-test with p=0.04 for 5–11 y.o. vs. 12–18 y.o. normal donors; Student’s t-test with p=0.4 for 5–11 y.o. vs. 12–18 y.o. HGPS donors), as well as in the serum of HGPS, young (age-matched) and old mice (C, ANOVA with Holm-Sidak test with p=0.79 for young vs. old; p=0.001 for young vs. HGPS; p<0.001 for old vs. HGPS). Quantification of vascular permeability in presence of iSMCs reprogrammed from young (N = 6), old (N = 6) and HGPS (N = 6) donors. At least N = 95 independent measurements per condition in three biological replicates. ANOVA with Holm-Sidak test with p<0.001 (***) (D). Schematic showing the vascular permeability assay in presence of antibodies specifically blocking secreted BMP4 and Jagged 1 (E). Quantification of vascular permeability comparing iSMCs from HGPS donors (ctrl) or the same cells treated with antibodies blocking BMP4 or Jagged 1. At least N = 60 independent measurements per condition in three biological replicates. ANOVA with Holm-Sidak test with p<0.001 (***) (F). Quantification of the effect of BMP4 and Jagged one blocking antibody on Y658 VE-cadherin area fraction. N = 6 independent measurements per condition in three biological replicates. ANOVA with Holm-Sidak test with p<0.05 (*) or p<0.01 (**); p=0.897 for BMP4 Ab vs. Jagged1 Ab (G). Representative images of Y658 VE-cadherin in presence of BMP4 and Jagged one blocking antibodies (H–J). Scale bars: 25 µm.
Figure 3—figure supplement 1
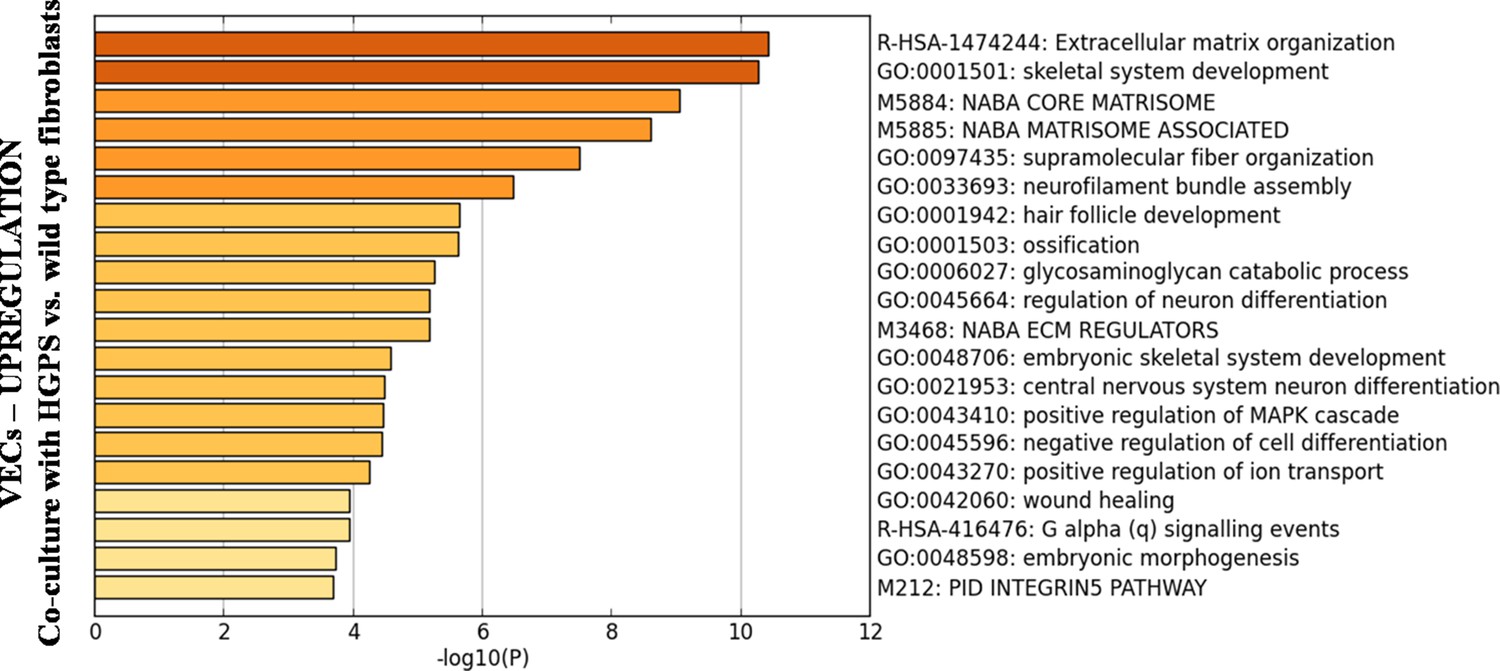
Biological processes upregulated in primary, healthy VECs when 3D co-cultured with HGPS vs. healthy fibroblasts for 25 days.
These supplementary data refer to N = 1 biological replicate.
Author response image 1
Quantification of the vascular area fraction in 3D matrices embedding a co-culture of VECs with fibroblasts or iSMCs (Student’s t-test with p=0.61).
Videos
Video 1
Representative movie showing a 3D reconstruction of in vitro co-cultured iVECs (white) and iSMCs (red) in a fibrin matrix.
Video 2
Representative movie showing a 3D reconstruction of human skin biopsy from a young (21 y.o.) donor stained for BMP2.
From the left: panel one is BMP2, panel two is αSMA, panel three is DAPI and panel four is merge.
Video 3
Representative movie showing a 3D reconstruction of human skin biopsy from an old (72 y.o.) donor stained for BMP2.
From the left: panel one is BMP2, panel two is αSMA, panel three is DAPI and panel four is merge.
Video 4
Representative movie showing a 3D reconstruction of human skin biopsy from a young (21 y.o.) donor stained for Paladin 1.
From the left: panel one is Paladin, panel two is CD31, panel three is DAPI and panel four is merge.
Video 5
Representative movie showing a 3D reconstruction of human skin biopsy from an old (72 y.o.) donor stained for Paladin 1.
From the left: panel one is Paladin, panel two is CD31, panel three is DAPI and panel four is merge.
Video 6
Representative movie showing 70 kDa dextran diffusion through the endothelial barrier in presence of iSMCs reprogrammed from HGPS donors.
Video 7
Representative movie showing 70 kDa dextran diffusion through the endothelial barrier in presence of iSMCs reprogrammed from HGPS donors and treated with BMP4 blocking antibody.
Video 8
Representative movie showing 70 kDa dextran diffusion through the endothelial barrier in presence of iSMCs reprogrammed from HGPS donors and treated with Jagged 1 blocking antibody.
Tables
Key resources table
| Reagent type (species) or resource | Designation | Source or reference | Identifiers | Additional information |
|---|---|---|---|---|
| Cell line (Homo-Sapiens) | Dermal fibroblasts (normal) | Coriell | Details in Supplementary file 1 | https://www.coriell.org/0/Sections/Support/Global/QCcells.aspx?PgId=409 |
| Cell line (Homo-Sapiens) | Dermal fibroblasts (normal and HGPS) | Progeria Research Foundation | Details inSupplementary file 1 | https://www.progeriaresearch.org/wp-content/uploads/2020/04/PRF-AVAILABLE-CELL-LINES.pdf |
| Cell line (Homo-Sapiens) | Microvascular endothelial cells (normal) | Angioproteomie | Details in Supplementary file 1 | https://www.angioproteomie.com/commerce/ccp1073-human-dermal-microvascular-endothelial-cells-cap-0005.htm |
| Cell line (M. musculus) | Microvascular endothelial cells (normal) | Cell Biologics | Details in Supplementary file 1 | https://cellbiologics.com/index.php?route=product/product&path=2_47_89_91&product_id=2240 |
| Transfected construct (human) | pQCXIB EGFP-MYOCD | This paper | Retroviral construct for stable expression | |
| Transfected construct (human) | pQCXIB ETV2 | This paper | Retroviral construct for stable expression | |
| Transfected construct (human) | On Target Plus Human PALD1 siRNA (Smart Pool) | Horizon | L-026434-00-0005 | |
| Transfected construct (human) | On Target Plus Human BMP2 siRNA (Smart Pool) | Horizon | L-011219-00-0005 | |
| Biological sample (Homo-sapiens) | Human skin samples | This paper | Isolated from human donors by the Cooperative Human Tissue Network or by the Clinical and Translational Research Institute of UCSD | |
| Antibody | Anti-human CD31 (Mouse monoclonal) | ThermoFisher | Cat# MA3100 RRID:AB_223516 | IF(1:100) |
| Antibody | Anti-human collagen type I (Mouse monoclonal) | ThermoFisher | Cat# MA126771 RRID:AB_2081889 | IF(1:250) |
| Antibody | Anti-human VE-cadherin (Rabbit monoclonal) | Cell Signaling | Cat#2500S RRID:AB_10839118 | IF(1:100) |
| Antibody | Anti-human Y658 VE-cadherin (Rabbit polyclonal) | ThermoFisher | Cat#441144G RRID:AB_2533583 | IF(1:100) |
| Antibody | Anti-human alpha smooth muscle actin (Mouse monoclonal) | eBioscience | Cat#14-9760-82 RRID:AB_2572996 | IF(1:2,500) |
| Antibody | Anti-human calponin (Mouse monoclonal) | Santa Cruz | Cat#sc-58707 RRID:AB_781770 | IF(1:100) |
| Antibody | Anti-human BMP2 (Rabbit polyclonal) | Novus | Cat#nBP1-19751 RRID:AB_2227877 | IF(1:100) |
| Antibody | Anti-human Paladin (Rabbit polyclonal) | ThermoFisher | Cat#PA5-53591 RRID:AB_2645183 | IF(1:100) |
| Antibody | Anti-human GSTM1 (Mouse Monoclonal) | ThermoFisher | Cat#MA5-17085 RRID:AB_2538556 | IF(1:100) |
| Antibody | Anti-human BMP4 (Mouse Monoclonal) | R and D Systems | Cat#MAB3552 RRID:AB_2065677 | Blocking (2 ug/ml) |
| Antibody | Anti-human Jagged 1 (Goat polyclonal) | R and D Systems | Cat#AF1277 RRID:AB_354713 | Blocking (1 ug/ml) |
| Sequence-based reagent | CD31 forward | This paper | PCR primers | TGGTCAAGAAAAGCAACACAG |
| Sequence-based reagent | CD31 reverse | This paper | PCR primers | GATTCGCAACGGACTTCG |
| Sequence-based reagent | CD31 forward | This paper | PCR primers | ACAACGAGGGCATCATCAAG |
| Sequence-based reagent | CD31 reverse | This paper | PCR primers | GAAGTGGTAGAAAGGCTGCTG |
| Sequence-based reagent | BMP2 forward | This paper | PCR primers | CATGCTAGACCTGTATCGCA |
| Sequence-based reagent | BMP2 reverse | This paper | PCR primers | TGTTTTCCCACTCGTTTCTGG |
| Sequence-based reagent | BMP2 forward | This paper | PCR primers | GCCCTTCGAGCACCACGCA |
| Sequence-based reagent | BMP2 reverse | This paper | PCR primers | TGGCTTGTAGTGCCGCTGCTG |
| Commercial assay or kit | BMP4 ELISA Kit | Sigma-Aldrich | RAB0029 | |
| Software, algorithm | Fiji | https://fiji.sc/ |
Additional files
-
Supplementary file 1
The table collects relevant information on the source of fibroblasts, SMCs and endothelial cells employed in the study.
- https://cdn.elifesciences.org/articles/54383/elife-54383-supp1-v1.docx
-
Supplementary file 2
Details on DE genes between young vs old iVECs, young vs old iSMCs, normal vs HGPS iSMCs.
Details on clustering analyses comparing iVECs, primary VECs and fibroblasts as well as iSMCs, primary SMCs and fibroblasts.
- https://cdn.elifesciences.org/articles/54383/elife-54383-supp2-v1.docx
-
Supplementary file 3
Details on clustering analyses comparing induced vs primary cells.
This dataset refers to data presented in Figure 1G and I.
- https://cdn.elifesciences.org/articles/54383/elife-54383-supp3-v1.docx
-
Supplementary file 4
Code used for data analyses.
- https://cdn.elifesciences.org/articles/54383/elife-54383-supp4-v1.docx
-
Supplementary file 5
Cell identity gene analysis in reprogrammed cells.
The table collects relevant information on key cell identity genes expressed by reprogrammed and primary cells.
- https://cdn.elifesciences.org/articles/54383/elife-54383-supp5-v1.docx
-
Supplementary file 6
Cell identity gene analysis in young vs old reprogrammed cells.
The table collects relevant information on key cell identity genes expressed by reprogrammed cells derived from young and old donors.
- https://cdn.elifesciences.org/articles/54383/elife-54383-supp6-v1.docx
-
Supplementary file 7
The table collects relevant information on the source of human serum employed in the study.
- https://cdn.elifesciences.org/articles/54383/elife-54383-supp7-v1.docx
-
Transparent reporting form
- https://cdn.elifesciences.org/articles/54383/elife-54383-transrepform-v1.docx
Download links
A two-part list of links to download the article, or parts of the article, in various formats.
Downloads (link to download the article as PDF)
Open citations (links to open the citations from this article in various online reference manager services)
Cite this article (links to download the citations from this article in formats compatible with various reference manager tools)
Direct reprogramming of human smooth muscle and vascular endothelial cells reveals defects associated with aging and Hutchinson-Gilford progeria syndrome
eLife 9:e54383.
https://doi.org/10.7554/eLife.54383


