Polyploidy in the adult Drosophila brain
- Molecular, Cellular, and Developmental Biology, University of Michigan, United States
Figures
Figure 1 with 2 supplements
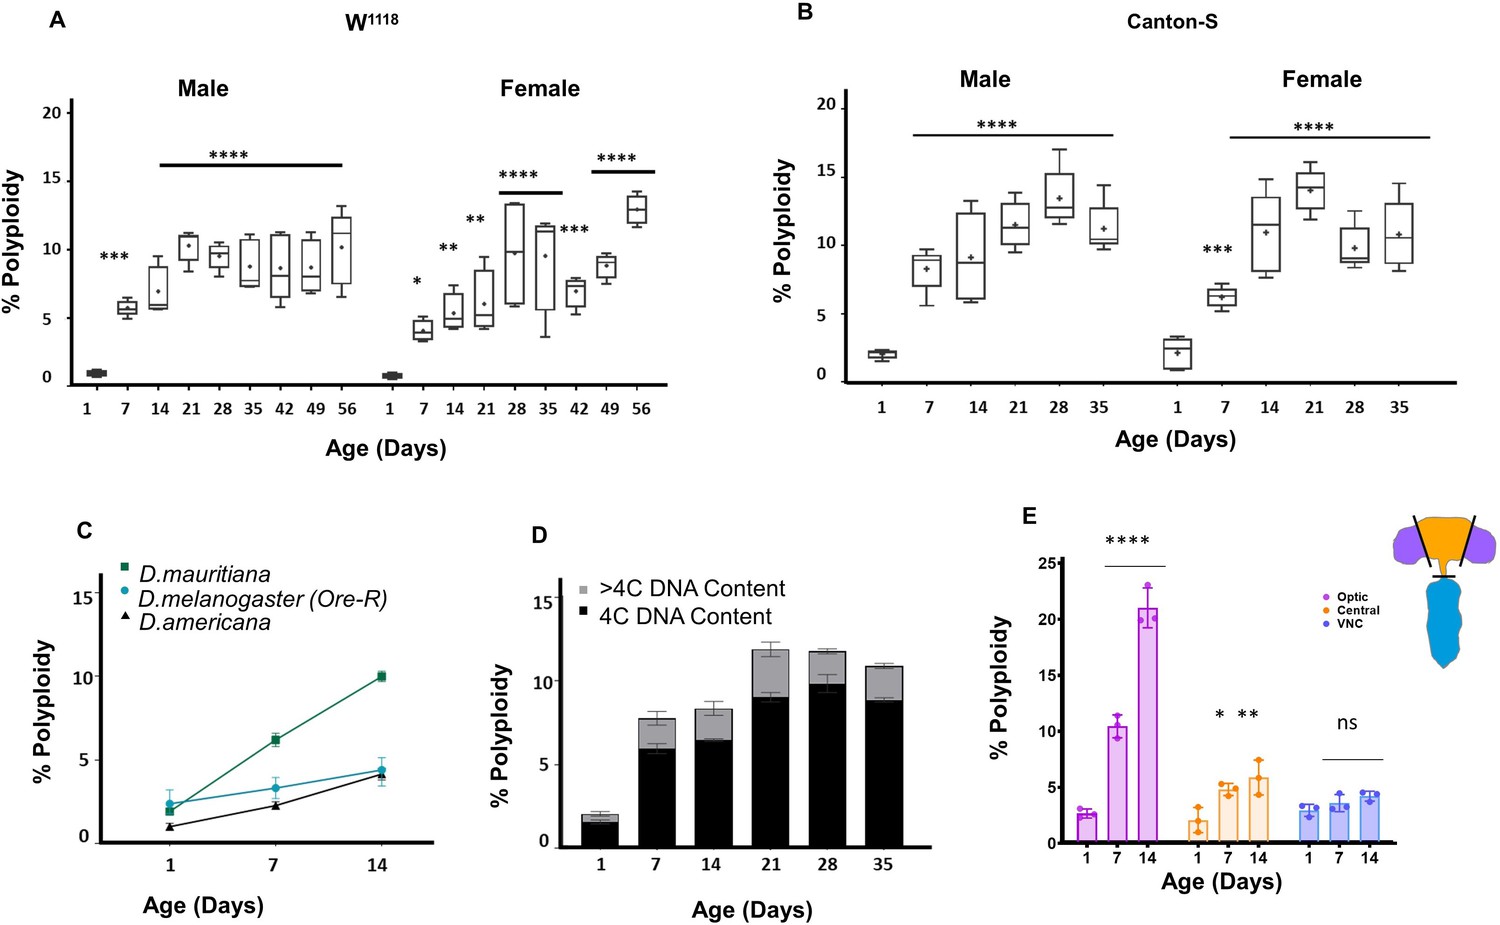
Polyploid cells accumulate in the adult Drosophila brain.
(A,B) Percentage of cells in individual brains exhibiting polyploidy in w1118 (A) and Canton-S (B) male and female whole brains. Age in days indicates days post-eclosion. Box plots showing range, dot indicates mean (n = 10). (Two-way ANOVA with greenhouse-geisser correction for unequal SDs followed by Holm-Sidak's multiple comparisons test. P values: ns > 0.1234;<0.0332 *;<0.0021 **;<0.0002 ***; ****<0.0001) (C) Accumulation of polyploidy is also observed in other Drosophila species. D.mauritiana and D.americana shown respectively in green and black compared to Oregon-R (D. melanogaster) shown in teal at different time points post-eclosion. Shapes indicate mean polyploidy observed, bars show range. three brains each per sample, n = 2 per time point. (D) Stacked bar plot showing proportion of polyploid cells with tetraploid or 4C DNA content (black) and greater than tetraploid or >4C DNA content (grey) in Canton-S males at different ages. (D) Percentage of polyploidy in Optic lobes (OL shown in purple), central brain (CB, shown in orange) and ventral nerve cord (VNC shown in blue) at different ages, w1118 (Error bars show mean ± SEM n = 3).
-
Figure 1—source data 1
Source Data for Figure 1A.
- https://cdn.elifesciences.org/articles/54385/elife-54385-fig1-data1-v1.csv
-
Figure 1—source data 2
Source Data for Figure 1B.
- https://cdn.elifesciences.org/articles/54385/elife-54385-fig1-data2-v1.csv
Figure 1—figure supplement 1
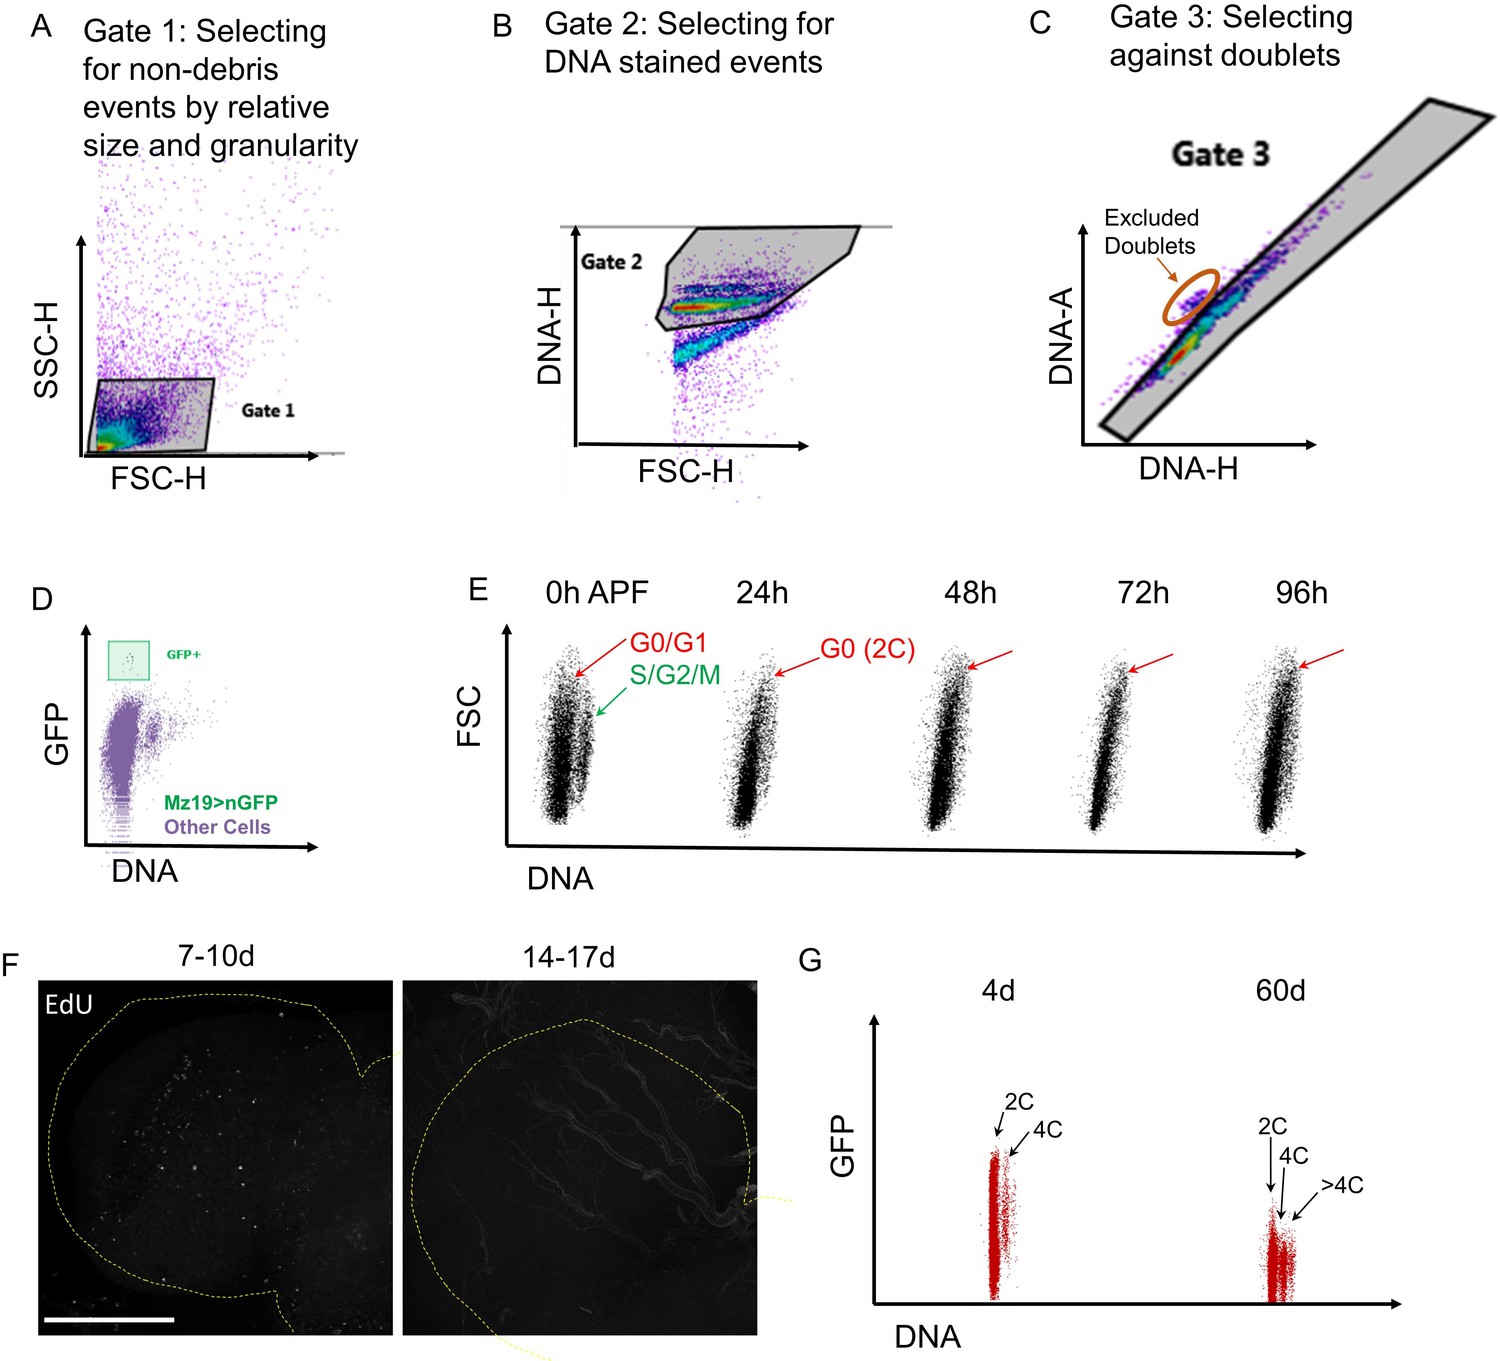
Examples of flow cytometry and S-phase labeling.
(A–C) Flow Cytometry gating strategy to ensure doublet discrimination. (D) The small population of mz19-GAL4, UAS nGFP labeled neurons are detectable by flow cytometry assay. (E) Dot plots showing DNA content during metamorphosis in Drosophila melanogaster w1118 brains. APF = after puparium formation. Cell cycle exit in most cells occurs by 24 hr APF. (F) Sparse EdU labeling observed in OL (outlined with yellow dotted line) before 10d but not after 2 weeks in the adult brain. (G) Increased DNA content observed in 60d old brains compared to 4d. Dot plots showing all cells in Elav-GAL4, UAS-nGFP brains at each time point Polyploid cells indicated as 4C and >4C. Elav-GAL4 driver shows weak expression in older brains.
Figure 1—figure supplement 2

Polyploidy in Optic lobes is not light or photoreceptor dependent.
(A) 14d Canton-S (CS) males reared in 12 h L/D cycles do not show significantly different polyploidy compared to age-matched CS males reared in 24 hr darkness from eclosion. Error bars = mean ± SEM; unpaired t-test with welch’s correction. (B) Percentage of polyploidy observed in glass60j mutants lacking photoreceptors and age-matched w1118 controls at 1 and 14 days. Bars show mean % polyploidy in samples containing three pooled brains.
Figure 2 with 1 supplement
Identification of various neuronal and glial cell types that become polyploid in the adult brain.
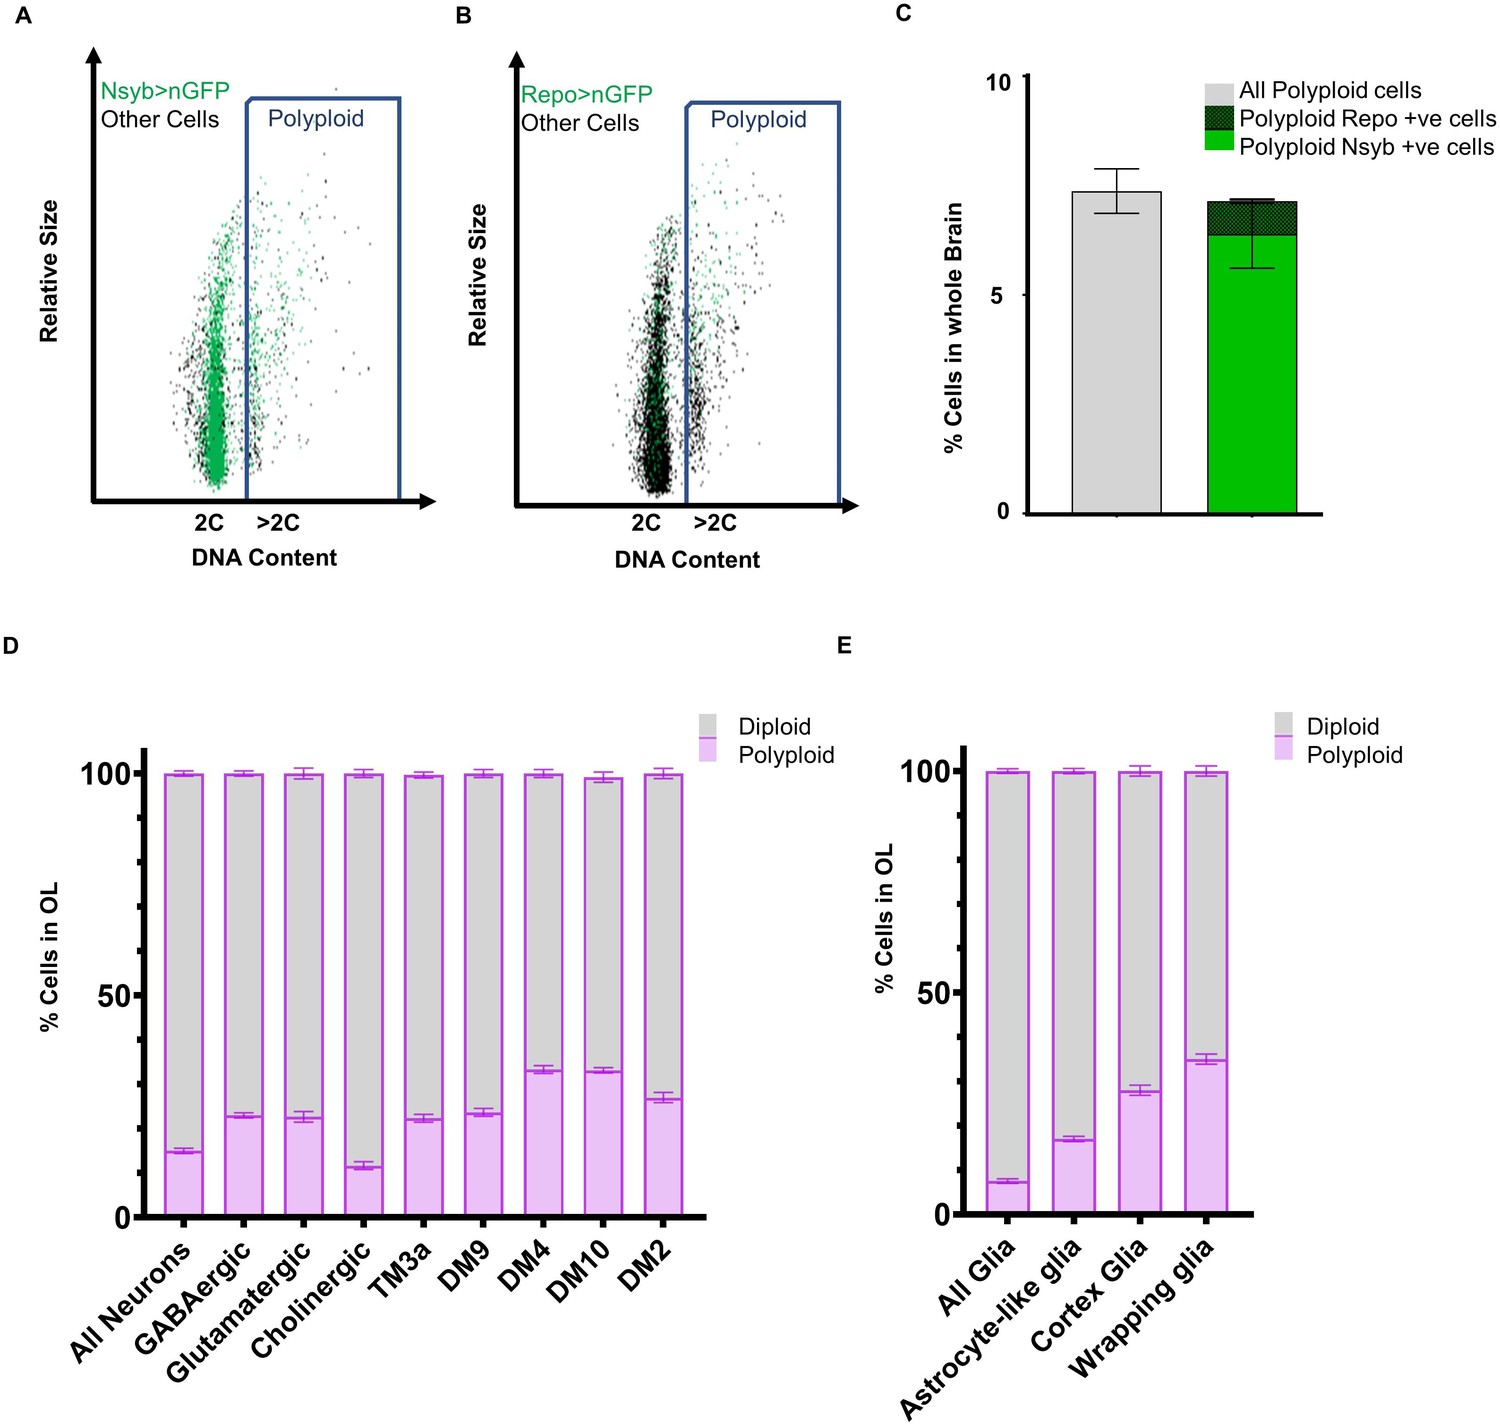
Representative flow cytometry dot plots showing polyploid neuronal (A) and glial (B) cells in 2 week old male brain (A) Neuronal nuclei are labeled using nsyb-GAL4, UAS-nGFP, neuronal cells are shown in the dot plot as green dots and ‘other’ cells unlabelled by nsyb-GAL4 are shown in black. Blue rectangle highlights cells with polyploid or >2C DNA content (B) Glial nuclei are labelled using Repo-GAL4, UAS-nGFP, glial cells are shown in the dot plot as green dots and ‘other’ cells unlabeled by Repo-GAL4 are shown in black. Blue rectangle highlights cells with polyploid or >2C DNA content. (C) Plot showing proportion of polyploid neurons (bold green) and polyploid glia (checked green) at 2 weeks compared to total polyploidy in the brain in w1118 control (grey) (error bars show mean ± SEM, n = 3). (D) Proportion of polyploidy observed at 7 days in the optic lobes in various classes of neurons (D) and glia (E). Stacked bar plot showing mean ± SEM; percentage of polyploidy (purple) and diploidy (grey) per sample, each sample contains pooled OLs from three or more brains; n = 3. Proportions of cells also represented as tables in Supplementary files 3 and 4.
-
Figure 2—source data 1
Source Data for Figure 2C.
- https://cdn.elifesciences.org/articles/54385/elife-54385-fig2-data1-v1.csv
-
Figure 2—source data 2
Source Data for Figure 2D.
- https://cdn.elifesciences.org/articles/54385/elife-54385-fig2-data2-v1.csv
-
Figure 2—source data 3
Source Data for Figure 2E.
- https://cdn.elifesciences.org/articles/54385/elife-54385-fig2-data3-v1.csv
Figure 2—figure supplement 1
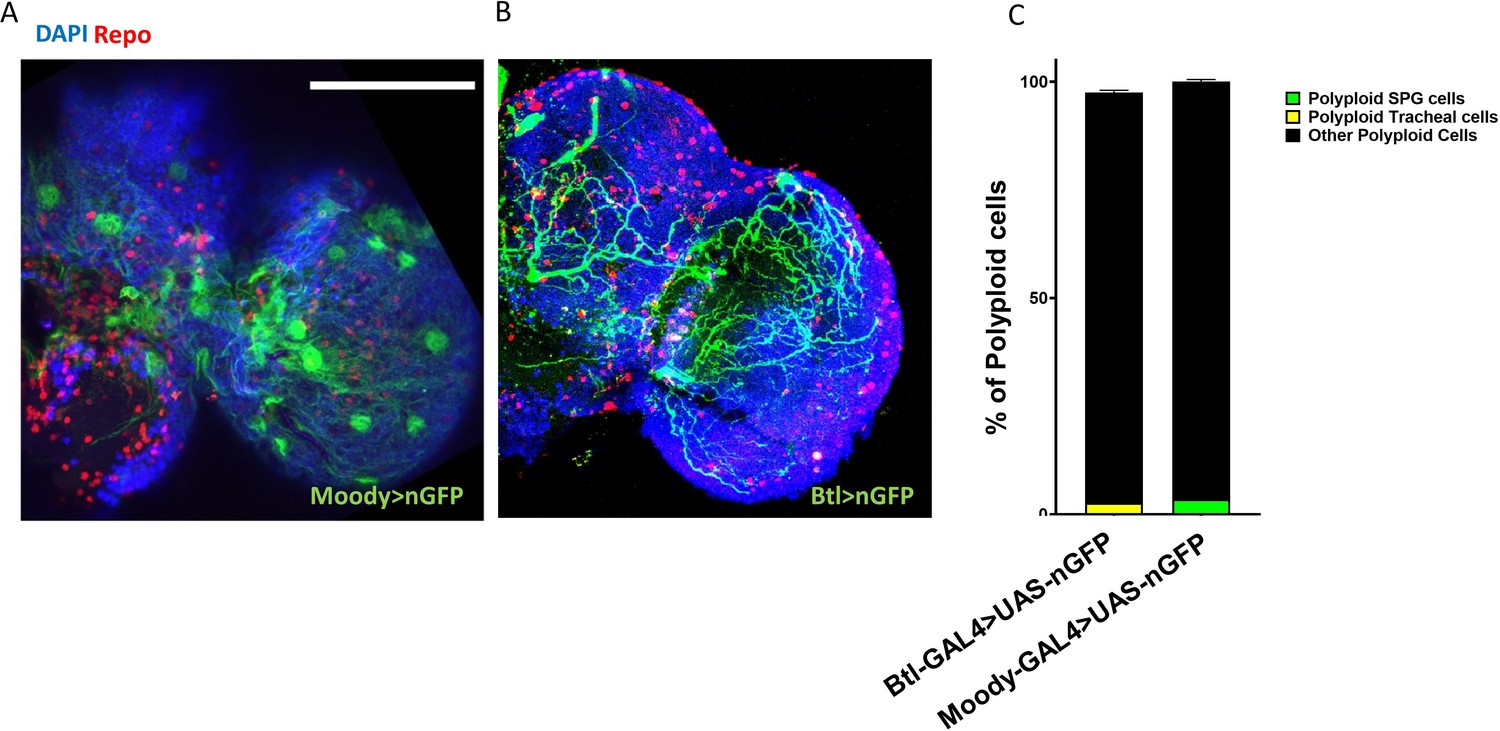
Trachea and Sub-perineurial glia comprise less than 5% of all polyploid cells.
(A,B) Micrographs showing expression pattern of moody-GAL4 (A) and (Breathless) btl-GAL4 (B) in the adult brain to label SPGs and tracheal cells respectively. (C) Flow cytometry based quantification showing the contribution of Btl-GAL4 (yellow) and moody-GAL4 (green) driving cells to total polyploidy observed in 10d adult brains.
Figure 3

Very few polyploid cells arise from cell fusion in the adult brain.
(A) Schematic of ‘early labeling’ using CoinFLP to identify potential cell fusion events. Early CoinFLP labeling will label diploid cells either with GFP or RFP. Any double-labeled cells in an older, polyploid brain will be a result of cell fusion. Representative images of 0 day (B) and 30 day polyploid optic lobes showing no double-labeled cells under ‘Early-FLP’ conditions when labeled using ey-FLP and membrane GFP and RFP. (C) Quantification of double labeled cells using nuclear GFP and RFP observed per brain lobe in early ‘FLP’ condition at 14 days. p value=0.0428 significance calculated using unpaired t-test with Welch’s correction. Early ‘FLP’ in (C) was induced at L2-early L3 stages using hs-FLP. Scale bars = 8.3 µm.
Figure 4 with 2 supplements
Cells in the Optic Lobes undergo cell cycle re-entry to become polyploid.
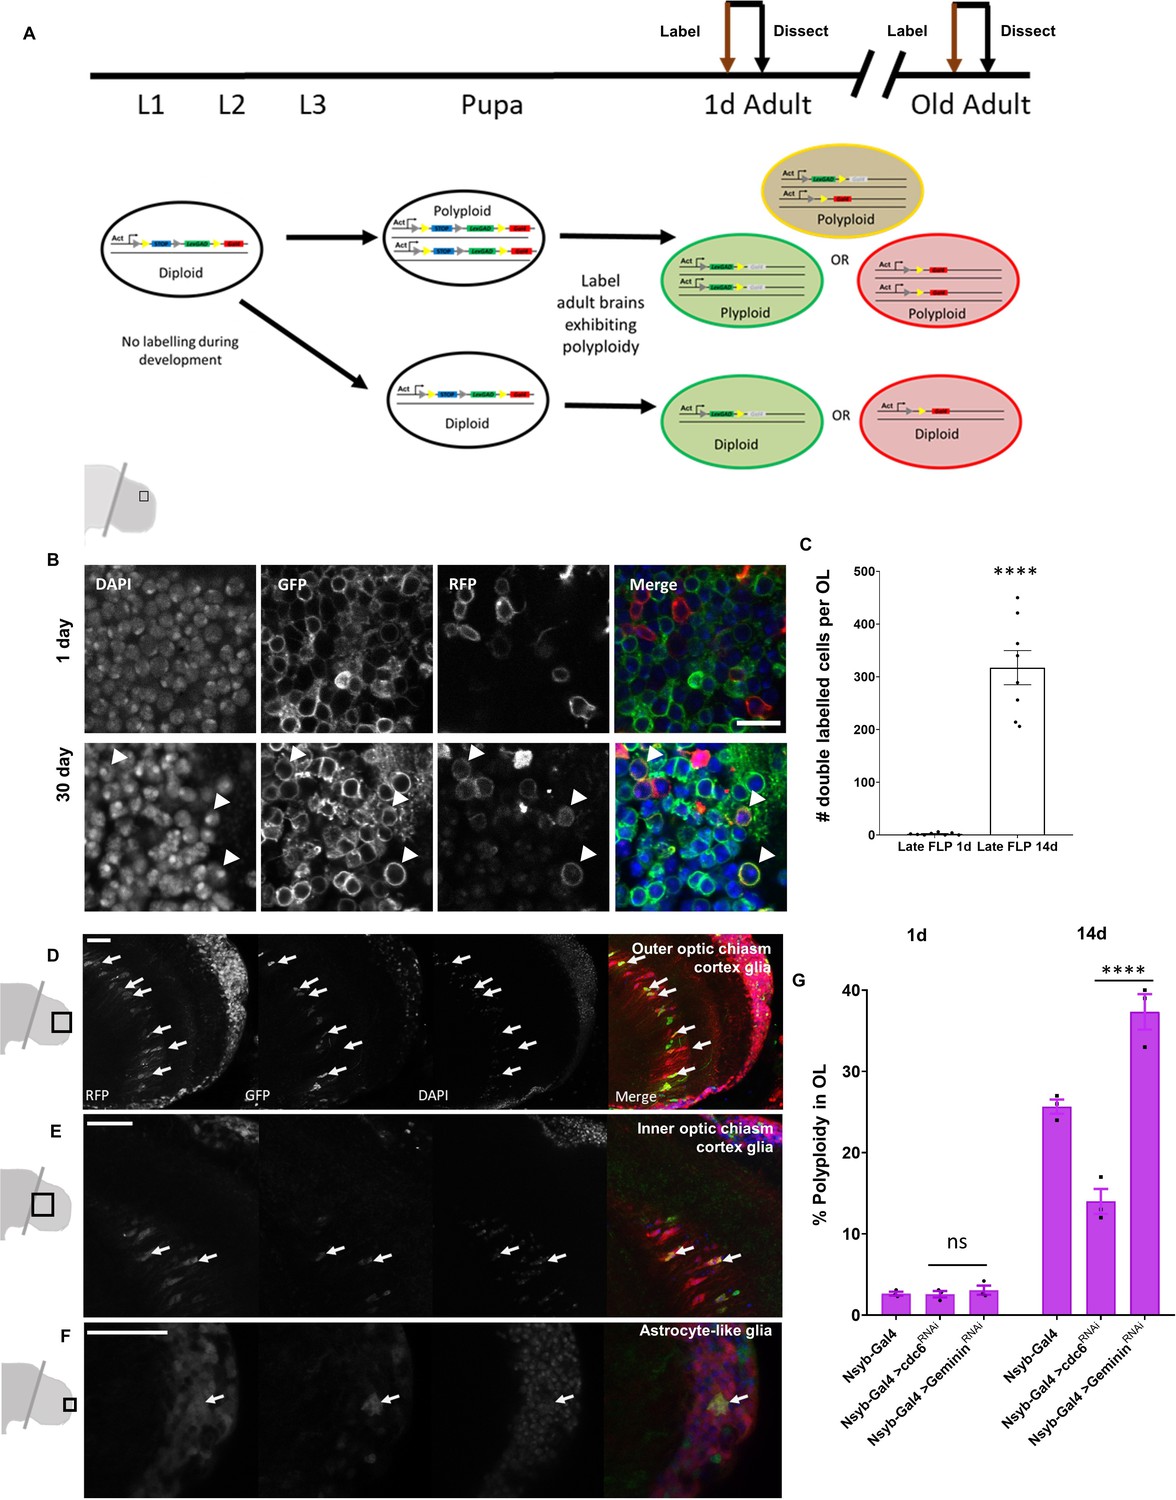
(A) Schematic showing labeling protocol for inducing a ‘late-FLP’ in brains where polyploidy is expected to identify polyploid cells in situ. A proportion of cells with multiple copies of the genome will be double-labeled. Representative images of 1 day optic lobe heat shocked soon after eclosion and a 30 day old optic lobe heat shocked at 29 days to induce labeling (B). Older optic lobes have double-labeled cells marked with membrane GFP and RFP. Scale bar = 8.3 µm. (C) Quantification of double labeled cells using nuclear GFP and RFP observed per brain lobe in ‘late-FLP’ condition. Labeling was induced 24 hr prior to dissection for both 1d and 14d using hs-FLP. P value < 0.0001 significance calculated using unpaired t-test with Welch’s correction. (D–F) Representative images showing cortex glia of the outer (D) and inner (E) optic chiasm as well as astrocyte-like (F) glial nuclei that can be identified as polyploid based on position and morphology using CoinFLP ‘late-FLP’ labeling method. Polyploid, double-labeled glia of each type are indicated with white arrows (G) Inhibition of DNA replication licensing factor cdc6 by RNAi in neurons using the driver nsyb-GAL4 results in lower levels of polyploidy (measured by flow cytometry) in male optic lobes compared to control (GAL4 driver alone). Knockdown of replication inhibitor geminin increases levels of polyploidy in 14 day old male optic lobes. Error bars show mean ± SEM, n = 3. (Two way anova with greenhouse geisser correction for unequal SDs followed by Holm-Sidak's multiple comparisons test p values: 0.1234 = ns;<0.0332 *;<0.0021 **;<0.0002 ***; ****<0.0001) Scale bars for D-F = 20 µm.
-
Figure 4—source data 1
Source Data for Figure 4C.
- https://cdn.elifesciences.org/articles/54385/elife-54385-fig4-data1-v1.csv
Figure 4—figure supplement 1
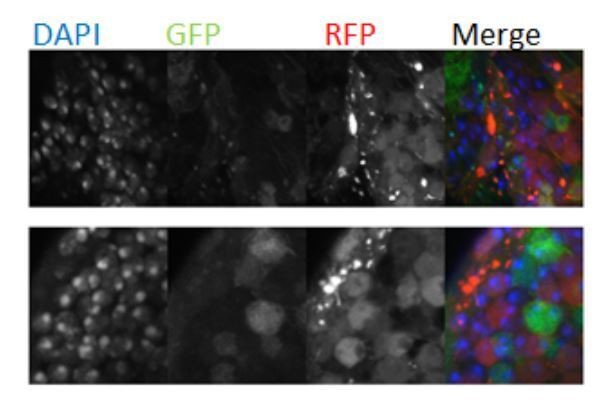
CoinFLP double positive cells are polyploid.
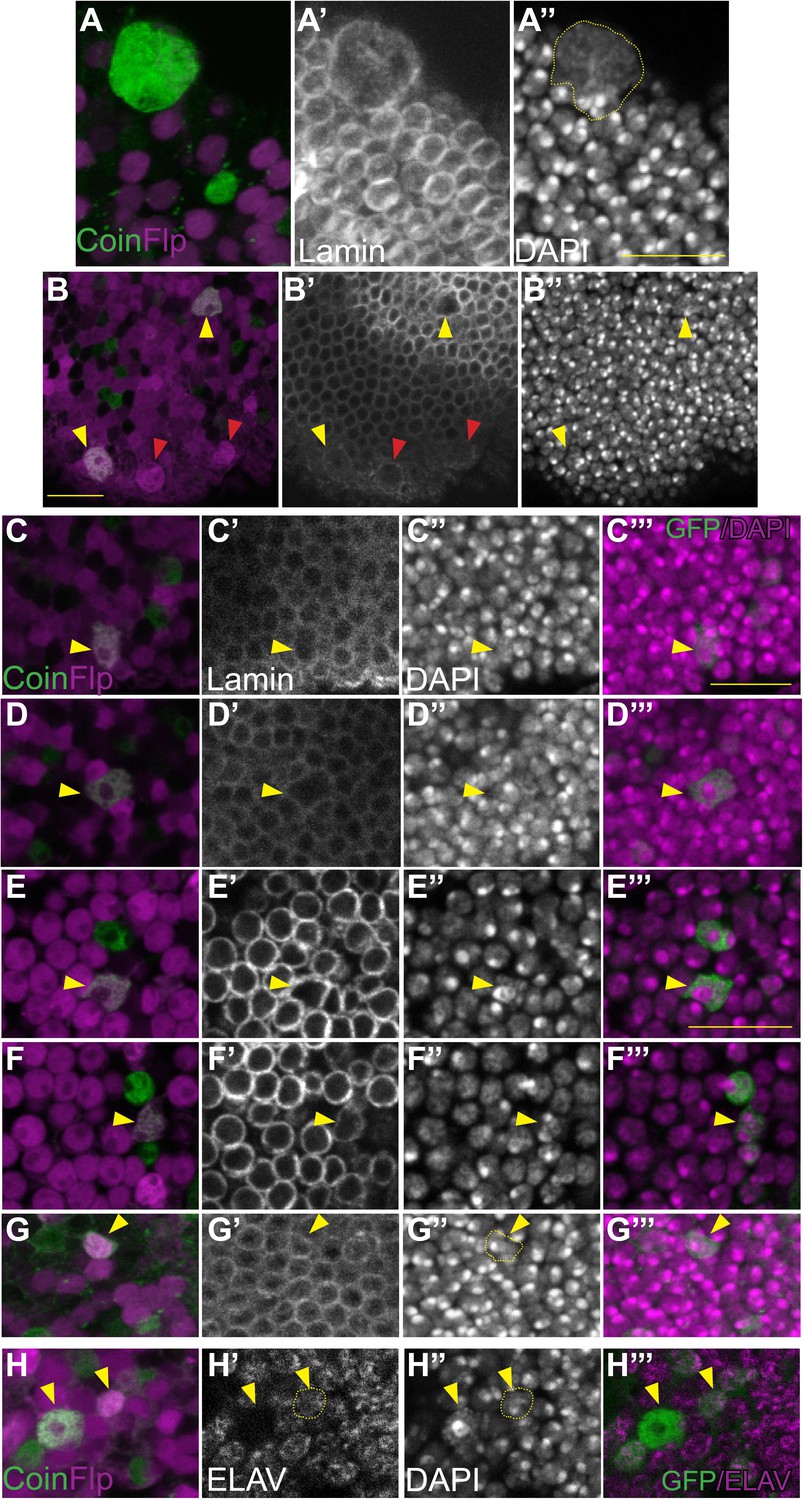
Heat-shock induced CoinFLP was used to stochastically label cells in the adult brain with UAS-GFPNLS (magenta), LexAop-RFPNLS (green), or both 24 hr prior to dissection. Optic lobes at 14 days (A–G) or 7 days (H) are shown. Projections of three one micron z-sections (A,B) or single z-sections (C–H) with anti-lamin and DAPI staining were used to delineate nuclear boundaries and quantify DNA content (Figure 4—figure supplement 2A). (A) Very large polyploid cells likely to be sub-perineurial glia, are easily discernible on the surface of optic lobes. (B) Visibly larger polyploid cells scattered throughout optic lobes are double-labeled with CoinFLP (yellow arrowheads) but can also be single-labeled (e.g. expressing UAS-RFPNLS/UAS RFPNLS, magenta arrowhead) due to the stochastic nature of CoinFLP labeling. (C–G) Arrowheads indicate examples of double-labeled CoinFLP cells. All were confirmed to be polyploid by Dapi quantifications (Figure 4—figure supplement 2A). Polyploid nuclei can exhibit a visibly dispersed chromocenter (C), intact chromocenters with decondensed peripheral chromatin (D,E) multiple chromocenters (F) or a normal nuclear appearance (G). (H) An example of a double-labeled CoinFLP, ELAV positive cell, confirmed to be tetraploid by Dapi quantification (yellow arrowhead) with a neighboring double-labeled CoinFLP, ELAV negative polyploid cell (white arrowhead). Scale bar = 10 µm.
Figure 4—figure supplement 2
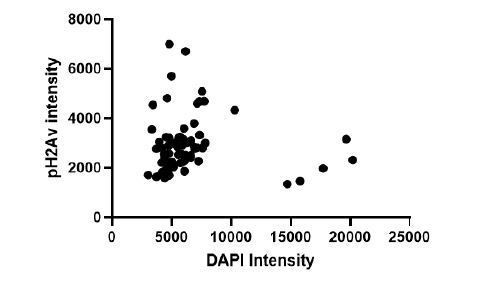
CoinFLP ‘double-labeled’ cells have polyploid DNA content.
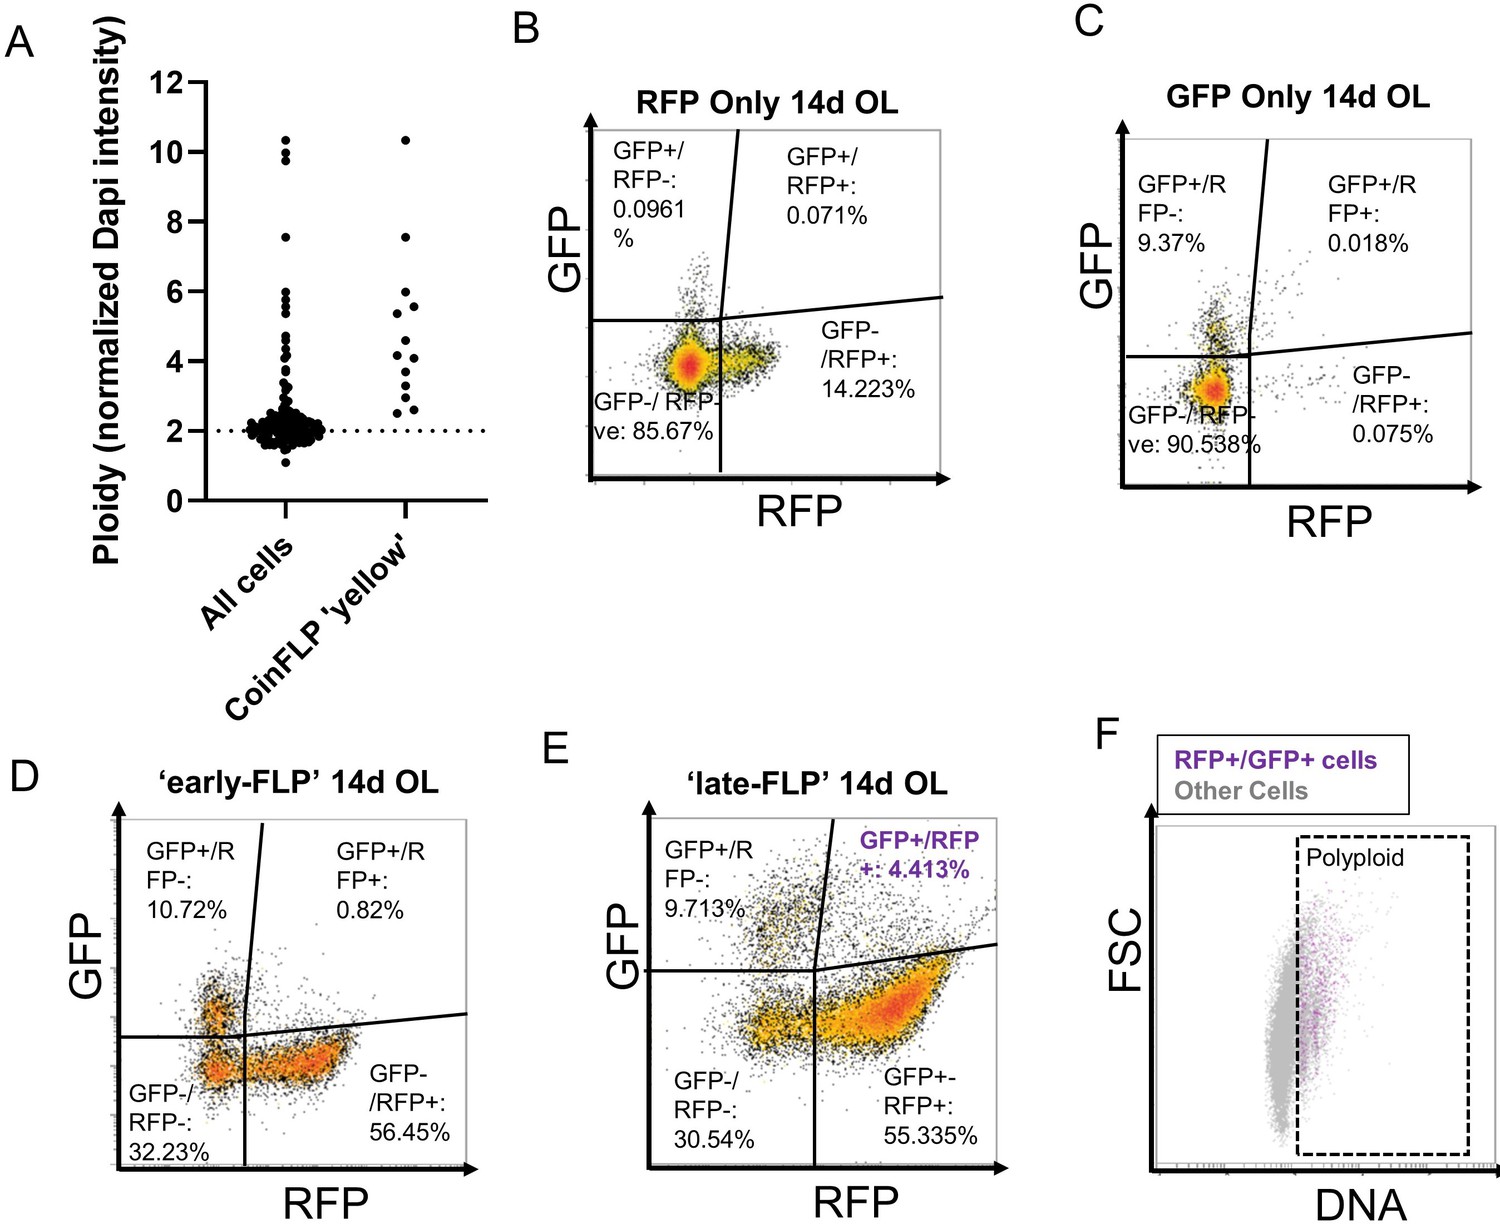
(A) DAPI integrated intensity was quantified for 132 nuclei from CoinFLP- labeled 14 day optic lobes using FIJI. Nuclear boundaries were guided by lamin staining for Dapi quantifications from at least 10 randomly chosen cells from 11 different representative images, from eight different brains. CoinFLP double-labeled cells are polyploid. (B,C) Single color controls used for gating. (B) shows RFP only and (C) shows GFP only controls. (D) CoinFLP animals were heat shocked at day of eclosion to induce labeling and brains were harvested at 14 days post eclosion. Inducing labeling at day one shows very few (0.82%) of cells in the OL that are double labeled. (E) CoinFLP labeling was performed 24 hr before harvesting. 4.413% of the OL are double labeled. (F) DNA content dot plot showing all cells in the brain in grey and the double labeled cells from (E) in purple. 97% of double labeled (GFP+/RFP+) cells from ‘late-FLP’ OL show polyploid DNA content. Single color controls in (B) and (C) are siblings from the cross y,w,hsflp;lexAop-nlsRFP/Cyo;UAS-nlsGFP/TM6B x y,w; CoinFLP. ‘RFP only’ and ‘GFP only’ are progeny that respectively, did not inherit the UAS-GFPnls and LexAop-RFPnls. cassettes and therefore contain balancer chromosomes. These controls were only used for gating purposes and not to estimate the efficiency of labeling.
-
Figure 4—figure supplement 2—source data 1
Source Data for Figure 4—figure supplement 2 panel A.
- https://cdn.elifesciences.org/articles/54385/elife-54385-fig4-figsupp2-data1-v1.csv
Figure 5 with 2 supplements
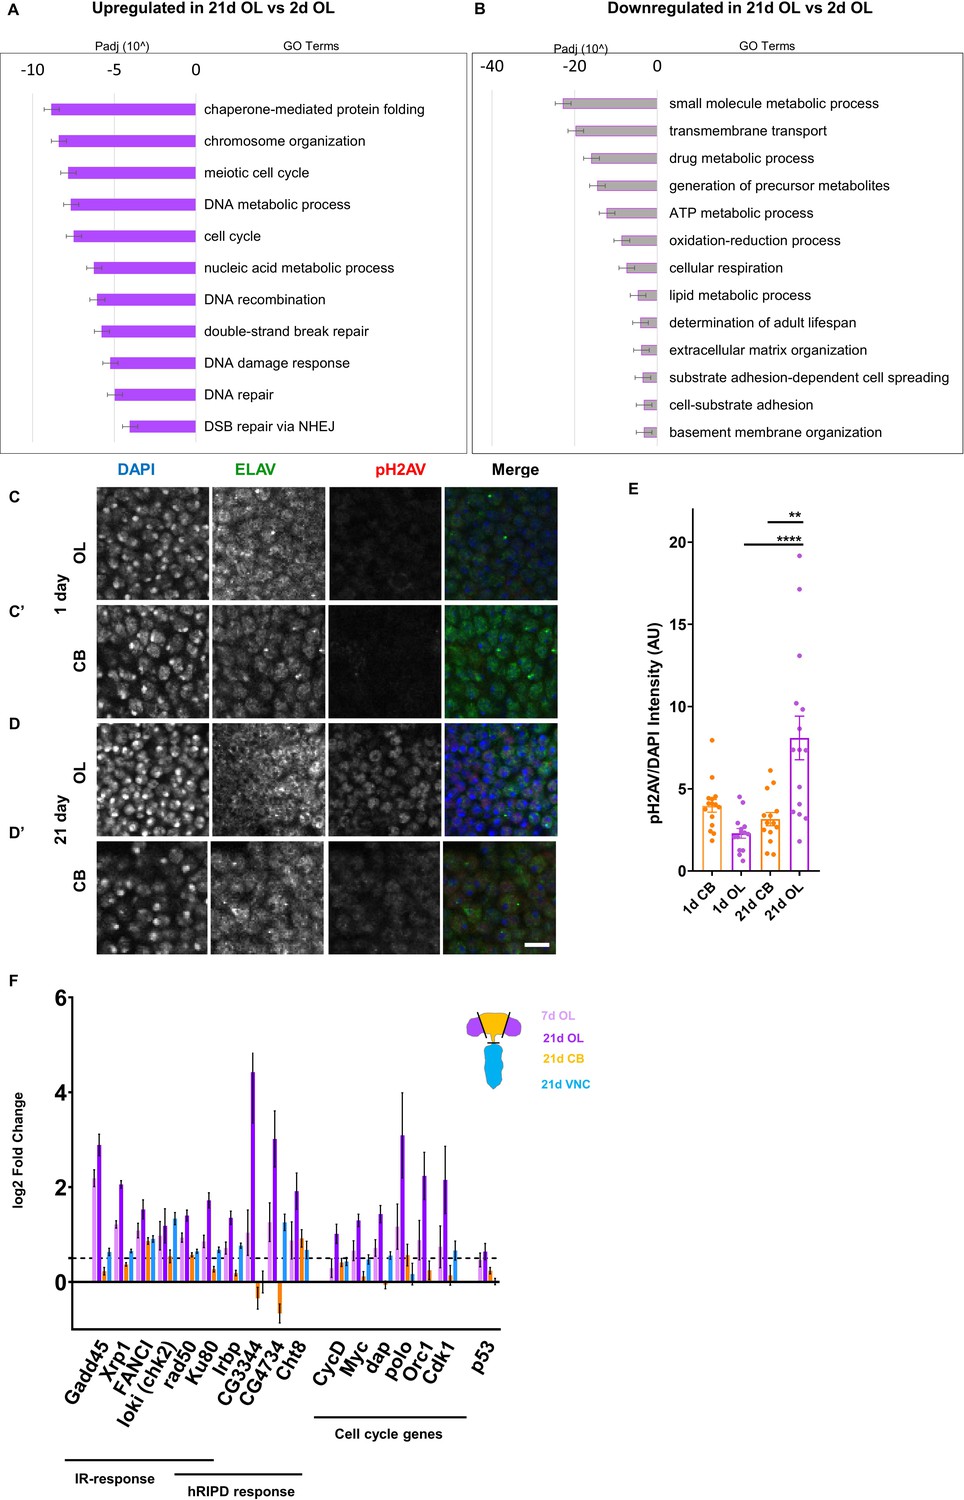
DNA damage accumulates with age in the Optic Lobes Changes in gene expression in 21d OL compared to 2d OL shown by GO term analysis.
Padj = adjusted P value. Upregulated GO terms shown in solid purple (A), downregulated GO terms shown in grey bars outlined with purple (B’). Representative images showing pH2AV foci in 1 (C,C’) and 21 day (D,D’) Central Brain (CB) and Optic Lobes (OL) Neurons are labeled in green (ELAV), phosphorylated histone 2A variant (pH2AV) in red nuclei are labeled in blue (DAPI). (E) Accumulation of DNA damage is quantified by measuring pH2AV intensity/DAPI intensity per frame in five brains per sample. Significance determined by performing unpaired t-test with Welch’s correction for unequal SD. Scale bars = 20 µm. (F) Genes involved in canonical Ionising Radiation (IR) response, head radiation induced p53 dependent (hRIPD) and cell cycle genes showing changes in expression compared to 2 day. Dotted line indicates threshold for significance. Genes showing changes in 7d OL are shown in light purple, 21d OL are shown in dark purple, 21D CB in yellow and 21d VNC in blue.
Figure 5—figure supplement 1

Supplemental RNAseq GO analysis.
(A) Most significantly upregulated GO terms in 7d OL compared to 2d OL. Most significantly upregulated (B) and downregulated (C) GO terms in 21d CB compared to 2d CB. Most significantly upregulated (D) and downregulated (E) GO terms in 21d VNC compared to 2d VNC.
Figure 5—figure supplement 2

Validation of RNAseq data Validation of our RNA sequencing dataset was performed by comparing our dataset to other published datasets.
Aggregated data based on (A) age (2d vs 21d, n = 6 replicates), sex (B, n = 9 replicates) or brain region (C n = 9 replicates) was compared to previously published datasets. Bar graphs show Mean log two fold change +/- SEM of select genes. Further details on references used are provided as a table in Figure 5—figure supplement 2—source data 1.
-
Figure 5—figure supplement 2—source data 1
The list of comparisons and references for validation of RNAseq dataset.
- https://cdn.elifesciences.org/articles/54385/elife-54385-fig5-figsupp2-data1-v1.docx
Figure 6 with 1 supplement
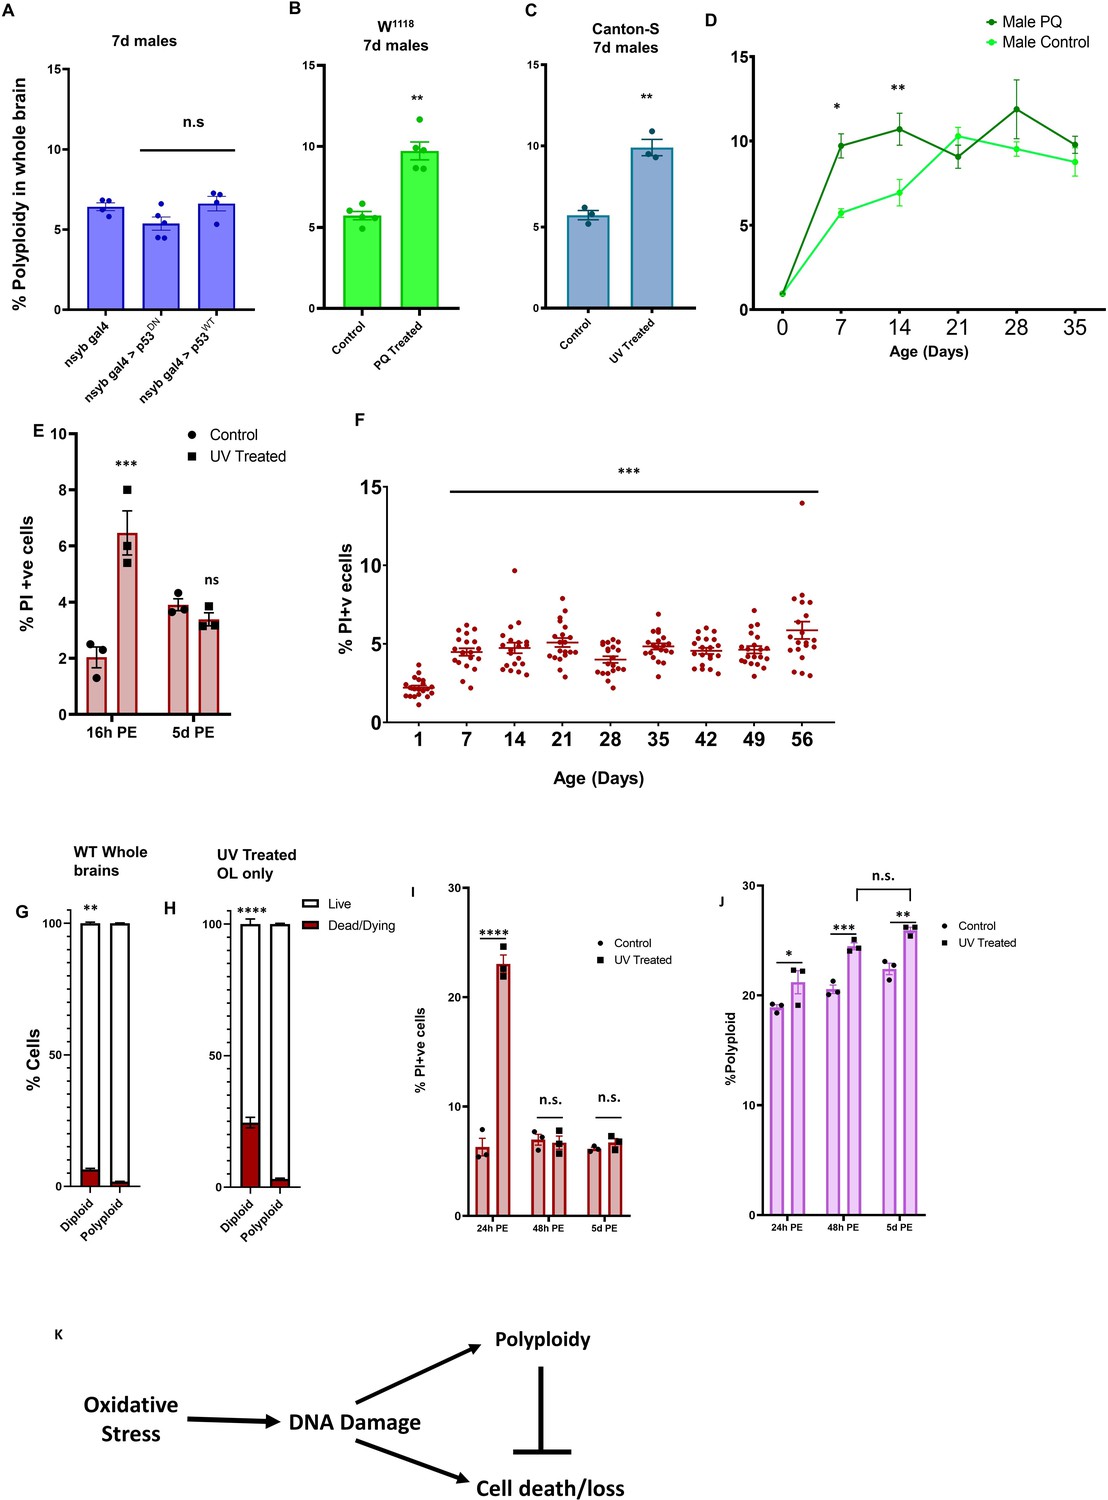
Oxidative stress and DNA damage results in increased polyploidy during early adulthood and polyploid cells are protected from cell death.
(A) Polyploidy in neurons is not p53 dependent. Percentage of polyploidy under each condition was measured in individual 7d male brains (n = 5). (B) w1118 males treated with 2 mM paraquat (PQ) from day of eclosion exhibit higher levels of polyploidy at 7 days compared to control w1118 males (n = 5). (C) UV treated (960mJ exposure 5 days prior to dissection and flow cytometry) Canton-S flies show greater levels of polyploidy at 7 days compared to control (n = 3). Error bars are mean ± SEM, significance was calculated by performing unpaired t-test with Welch’s correction for unequal SD. (D) Accumulation of polyploidy over a time course in w1118 males on 2 mM PQ (dark green) compared to control w1118 males (light green). Shapes show mean, bars show SEM. Significance was calculated using two way ANOVA with Greenhouse-geisser correction for unequal SDs, multiple comparisons with Holm-Sidak’s test; 0.1234 = ns;<0.0332 *;<0.0021 **;<0.0002 ***. (E) Cell death measured by Propidium Iodide incorporation in animals treated with 960mJ UV at 16 hr post-exposure and 5 days post-exposure. Cell death precedes accumulation of polyploidy upon induced DNA damage. Significance was calculated using two way ANOVA with Greenhouse-geisser correction for unequal SDs, multiple comparisons with Holm-Sidak’s test; 0.1234 = ns;<0.0332 *;<0.0021 **;<0.0002 ***; ****<0.0001. (F) PI incorporation shows percentage of dead/dying cells in individual brains, male and female, w1118 at different ages post-eclosion. Significance was calculated using two way ANOVA with Greenhouse-geisser correction for unequal SDs, multiple comparisons with Holm-Sidak’s test; 0.1234 = ns;<0.0332 *;<0.0021 **;<0.0002 ***; ****<0.0001 (G). Proportion of PI+ cells that are diploid (2C) and polyploid (>2C) in pooled 14 day old Canton-S male brains. (H–J) Animals were exposed to 480 mJ UV at 21 days and dissected 24 hr, 48 hr or 5d post exposure and cell death (H,I) and polyploidy (J) was measured by flow cytometry. (H) Proportion of PI+ cells that are diploid (2C) and polyploid (>2C) in pooled 21d w1118 male OL 24 hr post-exposure to 480mJ UV. (K) Proposed Model. For (G–I) n = 3, Error bars are mean ± SEM, significance was calculated by performing Two way ANOVA, multiple comparisons with Holm-Sidak’s test; 0.1234 = ns;<0.0332 *;<0.0021 **;<0.0002 ***; ****<0.0001.
-
Figure 6—source data 1
Source Data for Figure 6D.
- https://cdn.elifesciences.org/articles/54385/elife-54385-fig6-data1-v1.csv
-
Figure 6—source data 2
Source Data for Figure 6F.
- https://cdn.elifesciences.org/articles/54385/elife-54385-fig6-data2-v1.csv
-
Figure 6—source data 3
Source Data for Figure 6H.
- https://cdn.elifesciences.org/articles/54385/elife-54385-fig6-data3-v1.csv
-
Figure 6—source data 4
Source Data for Figure 6I.
- https://cdn.elifesciences.org/articles/54385/elife-54385-fig6-data4-v1.csv
-
Figure 6—source data 5
Source Data for Figure 6J.
- https://cdn.elifesciences.org/articles/54385/elife-54385-fig6-data5-v1.csv
Figure 6—figure supplement 1
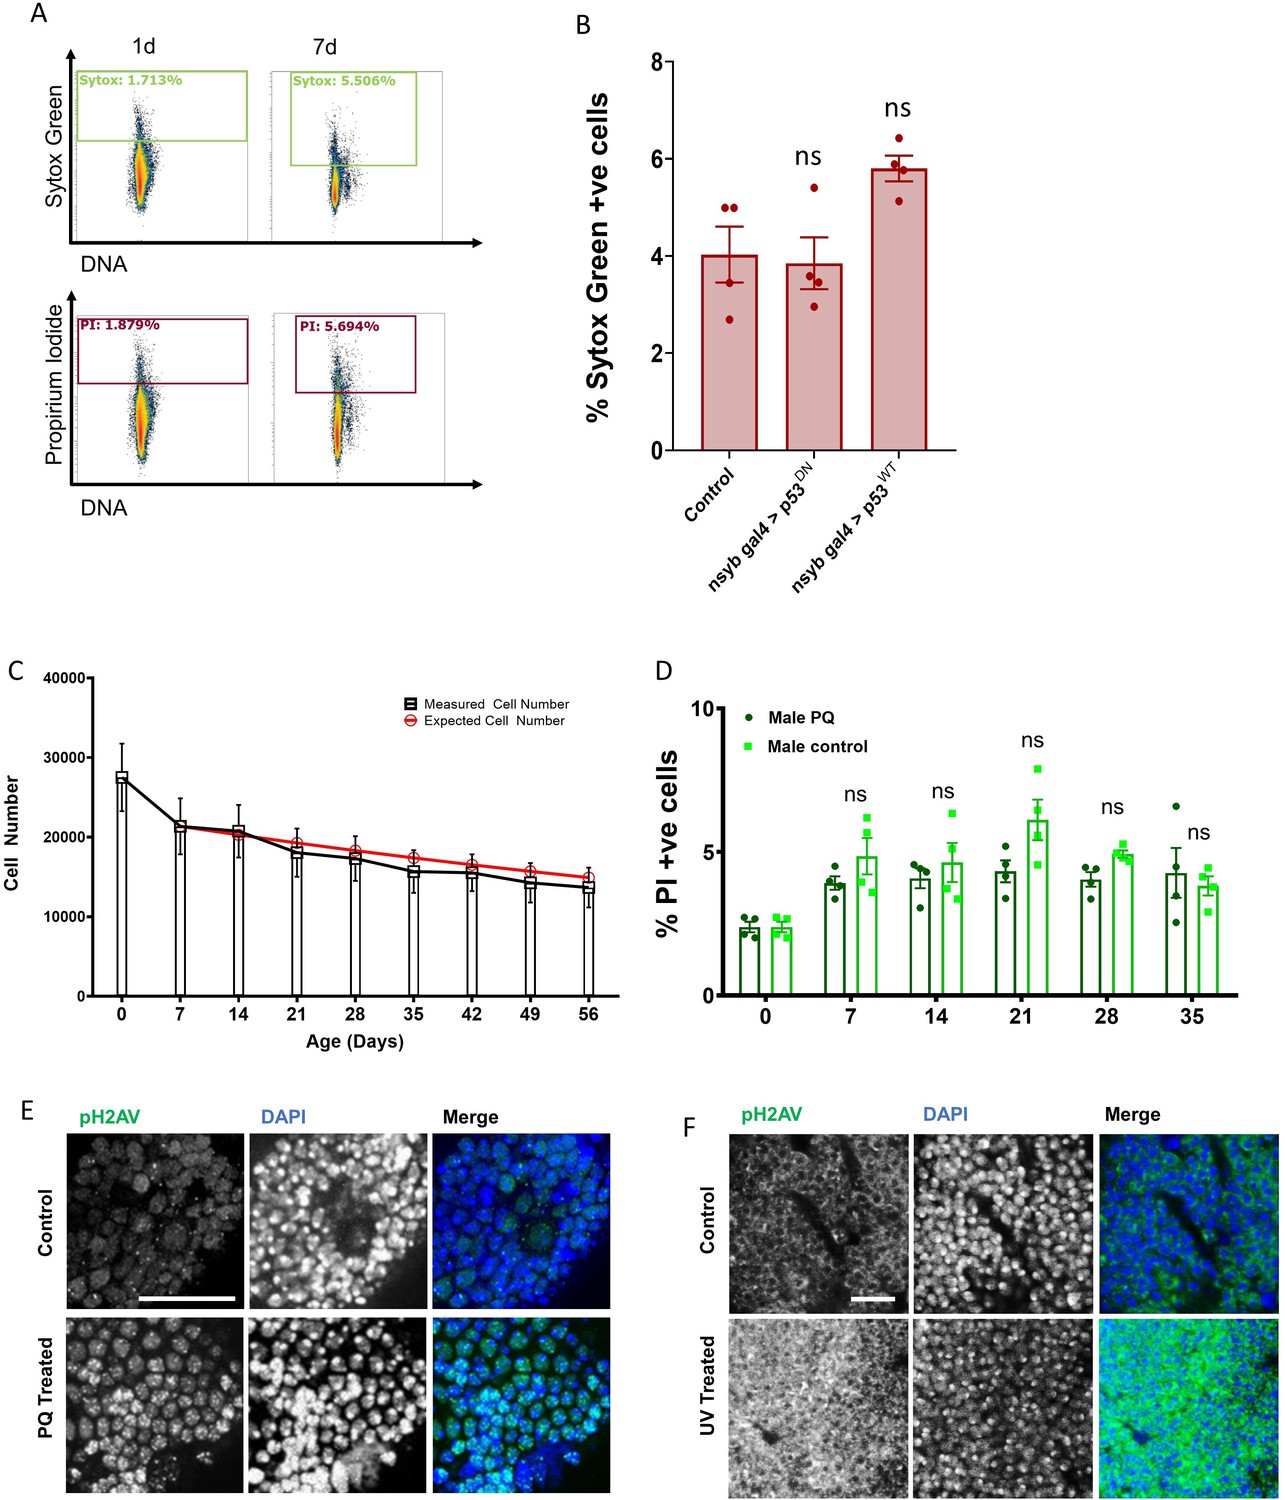
Supplemental Cell death and DNA damage data.
(A) One day and 7d Canton-S brains stained with both Sytox-Green (green) and Propidium Iodide (red) show similar labeling with both cell death markers. (B) Percentage of cells incorporating Sytox-green under each condition was measured in individual 7d male brains (n = 5) Error bars are mean ± SEM, significance was calculated by performing unpaired t-test with Welch’s correction for unequal SD. (C) Total cell counts from individual brains measured by flow cytometry in w1118 males. (black box = mean, bars = SEM) Red circles indicate the expected cell number, estimated by plotting 5% cell loss every week to model the death rate we observe in Figure 6F. (D) PI incorporation with 2 mM pQ treatment measured over a time course in w1118 males. 2 mM PQ (dark green) compared to control w1118 males (light green). Error bars show SEM. Significance was calculated using two way ANOVA with Greenhouse-geisser correction for unequal SDs, multiple comparisons with Holm-Sidak’s test. (E) 30d w1118 Control vs PQ-Treated brains stained with anti-pH2AV showing increased pH2AV immunofluorescence in PQ treated brains. Scale bar = 20 µm. (F) 21d w1118 Control vs UV-treated (480mJ) OL stained with anti-pH2AV showing increased pH2AV immunofluorescence in UV treated OL. Scale bar = 8 µm.
Author response image 1
Author response image 2
Tables
Key resources table
| Reagent type (species) or resource | Designation | Source or reference | Identifiers | Additional information |
|---|---|---|---|---|
| Genetic reagent (D. melanogaster) | w1118 | Bloomington Drosophila Stock Center | BDSC 5905 | isogenic |
| Genetic reagent (D. melanogaster) | Canton-S | O. Shafer lab | n/a | WT |
| Genetic reagent (D. melanogaster) | Oregon-R | C. Collins lab | n/a | WT |
| Genetic reagent (D. americana) | Drosophila americana | P. Wittkopp lab | n/a | Non melanogaster Drosophila |
| Genetic reagent (D. mauritiana) | Drosophila mauritiana | P. Wittkopp lab | n/a | Non melanogaster Drosophila |
| Genetic reagent (D. melanogaster) | glass60J | O. Shafer lab | n/a | Mutant for glass |
| Genetic reagent (D. melanogaster) | w;nSyb-GAL4/Cyo | M. Dus lab | n/a | pan-neuronal |
| Genetic reagent (D. melanogaster) | w;+;nSyb-GAL4 | M. Dus lab | n/a | pan-neuronal |
| Genetic reagent (D. melanogaster) | w;UAS-nGFP;Repo-GAL4, tubulin GAL80TS | Buttitta lab stocks | n/a | pan-glial |
| Genetic reagent (D. melanogaster) | w;UAS-nGFP | Buttitta lab stocks | n/a | UAS nuclear GFP |
| Genetic reagent (D. melanogaster) | w;+;UAS-nGFP | Buttitta lab stocks | n/a | UAS nuclear GFP |
| Genetic reagent (D. melanogaster) | w;Moody-GAL4 | C. Collins lab via Klambt Lab | n/a | Sub-perineurial glia |
| Genetic reagent (D. melanogaster) | y,w;mz19-mCD8::GFP | Bloomington Drosophila Stock Center | BDSC 23300 | Antennal lobe projection neuron |
| Genetic reagent (D. melanogaster) | w1118;ELAV-GAL4,UAS-nGFP | Bloomington Drosophila Stock Center | BDSC 49226 | pan-neuronal |
| Genetic reagent (D. melanogaster) | y,w;breathless-GAL4 | DGRC Kyoto | 105276 | Trachea |
| Genetic reagent (D. melanogaster) | w-;GAD1-GAL4/SM6 | O. Shafer lab | n/a | GABAergic |
| Genetic reagent (D. melanogaster) | w-;OK371-GAL4,UASn-GFP | Buttitta lab stocks | n/a | Glutamatergic |
| Genetic reagent (D. melanogaster) | w;ChaT-GAL4 | O. Shafer lab | n/a | Cholinergic |
| Genetic reagent (D. melanogaster) | w1118;+;GMR-12C11-GAL4 | Bloomington Drosophila Stock Center | BDSC 76324 | Tm3a |
| Genetic reagent (D. melanogaster) | w1118;+;GMR- 42H01-GAL4 | Bloomington Drosophila Stock Center | BDSC 48150 | Dm9 |
| Genetic reagent (D. melanogaster) | w1118;+;GMR-23G11-GAL4 | Bloomington Drosophila Stock Center | BDSC 49043 | Dm4 |
| Genetic reagent (D. melanogaster) | w1118;+;GMR-30B06-GAL4 | Bloomington Drosophila Stock Center | BDSC 47529 | Dm10 |
| Genetic reagent (D. melanogaster) | w1118;+;GMR-26H07-GAL4 | Bloomington Drosophila Stock Center | BDSC 49204 | Dm2 |
| Genetic reagent (D. melanogaster) | y;w;NP3233-GAL4/Cyo | DGRC Kyoto | 113173 | Astrocyte-like |
| Genetic reagent (D. melanogaster) | y;w;NP2222-GAL4/Cyo | DGRC Kyoto | 112830 | Cortex glia |
| Genetic reagent (D. melanogaster) | w;mz97-GAL4 | C. Collins lab via Klambt Lab | n/a | Wrapping glia |
| Genetic reagent (D. melanogaster) | y,w,UAS-mCD8::RFP,LexAop2-mCD8::GFP; CoinFLP-LexA::GAD.GAL4 | Bloomington Drosophila Stock Center | BDSC 59270 and 59271 | CoinFLP |
| Genetic reagent (D. melanogaster) | y,w,hs-FLP;LexAop-RFPnls; UAS-GFPnls | Buttitta lab stocks | n/a | hs-FLP used with with CoinFLP nuclear GFP and RFP |
| Genetic reagent (D. melanogaster) | ey-FLP | Bloomington Drosophila Stock Center | BDSC 5576 | ey-FLP |
| Genetic reagent (D. melanogaster) | y,sev,w;UAS-cdc6RNAi | Bloomington Drosophila Stock Center | BDSC 55734 | cdc6KD |
| Genetic reagent (D. melanogaster) | w; UAS-gemininRNAi | Bloomington Drosophila Stock Center | BDSC 30929 and 50720 | gemininKD |
| Genetic reagent (D. melanogaster) | w1118;GUS-p53 | Bloomington Drosophila Stock Center | BDSC 6584 | UAS-p53WT |
| Genetic reagent (D. melanogaster) | y,w1118; UAS-p53 259N | Bloomington Drosophila Stock Center | BDSC 6582 | UAS-p53DN |
| Antibody | anti-ELAV (rat monoclonal) | Developmental Studies Hybridoma Bank | Rat-ELAV-7E8A10 | 1: 100 |
| Antibody | anti-pH2AV (mouse monoclonal) | Developmental Studies Hybridoma Bank | UNC93-5.2.1 | 1: 100 |
| Antibody | anti-Repo (mouse monoclonal) | Developmental Studies Hybridoma Bank | 8D12 | 1: 100 |
| Antibody | anti-Lamin (mouse monoclonal) | Developmental Studies Hybridoma Bank | ADL67.10 | 1: 100 |
| Antibody | Alexa Fluor 568 anti-mouse (goat polyclonal) | ThermoFisher | A11031 | 1: 1000 |
| Antibody | Alexa Fluor 568 anti-rat (goat polyclonal) | ThermoFisher | A11077 | 1: 1000 |
| Antibody | Alexa Fluor 488 anti-mouse (goat polyclonal) | ThermoFisher | A11029 | 1: 1000 |
| Antibody | Alexa Fluor 488 anti-rat (donkey polyclonal) | ThermoFisher | A21208 | 1: 1000 |
| Other | DAPI | Sigma-Aldrich | D9542 | 1: 1000 |
| Other | Dye-cycle violet | ThermoFisher | V35003 | 2: 1000 |
| Other | Sytox Green | ThermoFisher | S7020 | 2: 1000 |
| Other | Propidium Iodide | Sigma-Aldrich | P4170 | 2.25: 1000 |
Additional files
-
Supplementary file 1
A list of antibodies and stains used.
- https://cdn.elifesciences.org/articles/54385/elife-54385-supp1-v1.docx
-
Supplementary file 2
A list of Drosophila stocks used.
- https://cdn.elifesciences.org/articles/54385/elife-54385-supp2-v1.docx
-
Supplementary file 3
Proportions of cell types polyploid in the whole brain.
- https://cdn.elifesciences.org/articles/54385/elife-54385-supp3-v1.docx
-
Supplementary file 4
Proportions of polyploid cell types in the OL.
- https://cdn.elifesciences.org/articles/54385/elife-54385-supp4-v1.docx
-
Transparent reporting form
- https://cdn.elifesciences.org/articles/54385/elife-54385-transrepform-v1.docx
Download links
A two-part list of links to download the article, or parts of the article, in various formats.
Downloads (link to download the article as PDF)
Open citations (links to open the citations from this article in various online reference manager services)
Cite this article (links to download the citations from this article in formats compatible with various reference manager tools)
Polyploidy in the adult Drosophila brain
eLife 9:e54385.
https://doi.org/10.7554/eLife.54385


