Mitochondrial ClpX activates an essential biosynthetic enzyme through partial unfolding
- Department of Biochemistry, Brandeis University, United States
- Department of Biology, Massachusetts Institute of Technology, United States
- Howard Hughes Medical Institute, Massachusetts Institute of Technology, United States
- Department of Chemistry and Chemical Biology, Northeastern University, United States
Figures
Figure 1 with 2 supplements
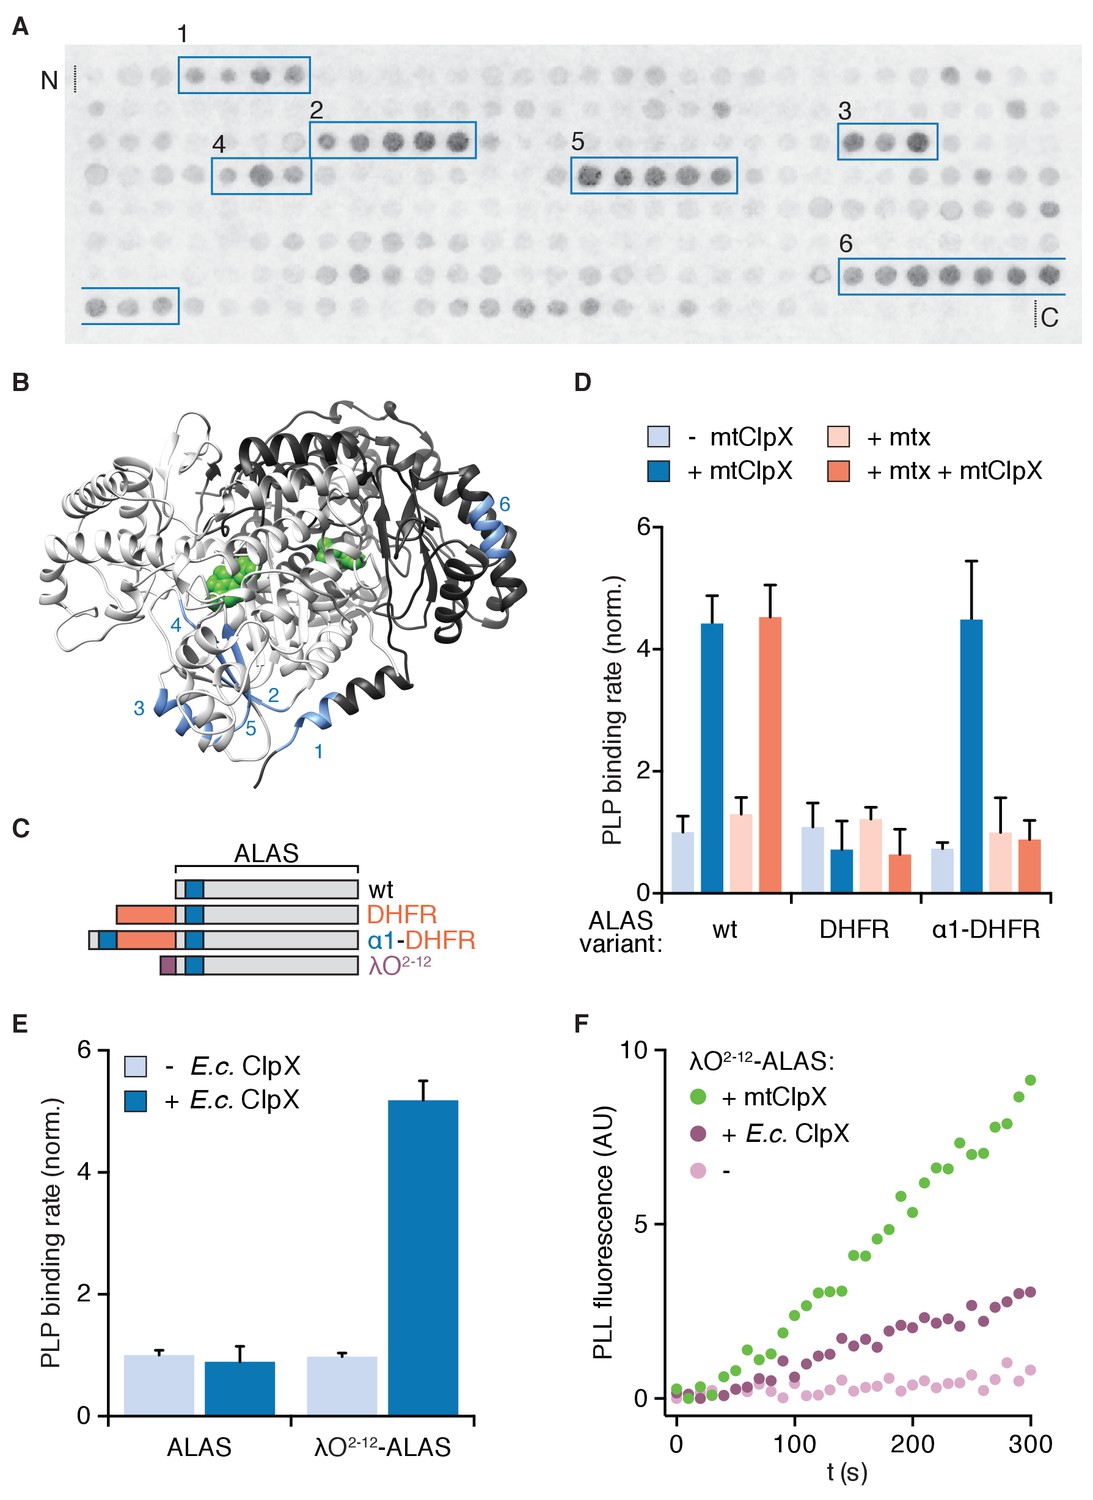
Interaction with the N-terminus of ALAS is necessary and sufficient for activation of ALAS by an unfoldase.
(A) Peptide array of the ALAS sequence (58–548, sliding window of fifteen amino acids, shifted two amino acids towards the C-terminus with each spot, N- to C-terminus arrayed left-to-right, top-to-bottom) probed with mtClpXE206Q-3xFLAG and detected by far-western blot as described in Materials and Methods. mtClpX-binding sequences are boxed in blue. See Figure 1—figure supplement 1A for control blot. (B) mtClpX-binding sequences identified by peptide blotting are mapped on one face of the structure of S. cerevisiae ALAS (PDB: 5TXR [Brown et al., 2018]; image created with UCSF Chimera [Pettersen et al., 2004]) in blue and numbered as in (A). Sequences were defined as the range between the two amino acids added at the beginning of the boxed region in (A) and the two amino acids removed after its end. PLP is depicted in green and the two protomers of ALAS are colored in light or dark gray. (C) Diagram of ALAS N-terminal variants. Blue indicates the N-terminal mtClpX-binding peptide in α1, orange indicates M. musculus dihydrofolate reductase (DHFR), and purple indicates a degradation tag recognized by E. coli ClpX (residues 2–12 of the phage λO replication protein). (D) Rate of PLP binding to ALAS and N-terminal DHFR-ALAS chimeras (5 μM monomer), ± mtClpX (2 μM hexamer), ± methotrexate (mtx) (30 μM). Reactions additionally contained 2 mM ATP, a regeneration system and 50 mM PLP (see Materials and Methods). PLP binding was monitored by fluorescence specific to protein-liganded PLP (ex. 434 nm, em. 515 nm). Rates were extracted by linear fits to values in the early linear phase and normalized to the rate for wildtype ALAS without methotrexate or mtClpX. p<0.001 for suppression of mtClpX activity by DHFR fusion (DHFR-ALAS) and suppression of mtClpX activity on α1-DHFR-ALAS by methotrexate addition. (E) PLP binding to ALAS and λO2-12-ALAS (5 μM monomer) ±E. coli ClpX (2 μM hexamer), assayed as in (C). p<10−4 for stimulation of PLP binding to λO2-12-ALAS by E. coli ClpX. (F) PLP-binding fluorescence traces for λO2-12-ALAS,±E. coli ClpX or mtClpX. Error bars represent standard deviation; n ≥ 3. P-values were calculated using Student’s t-test.
Figure 1—figure supplement 1
mtClpX-binding peptides of ALAS.
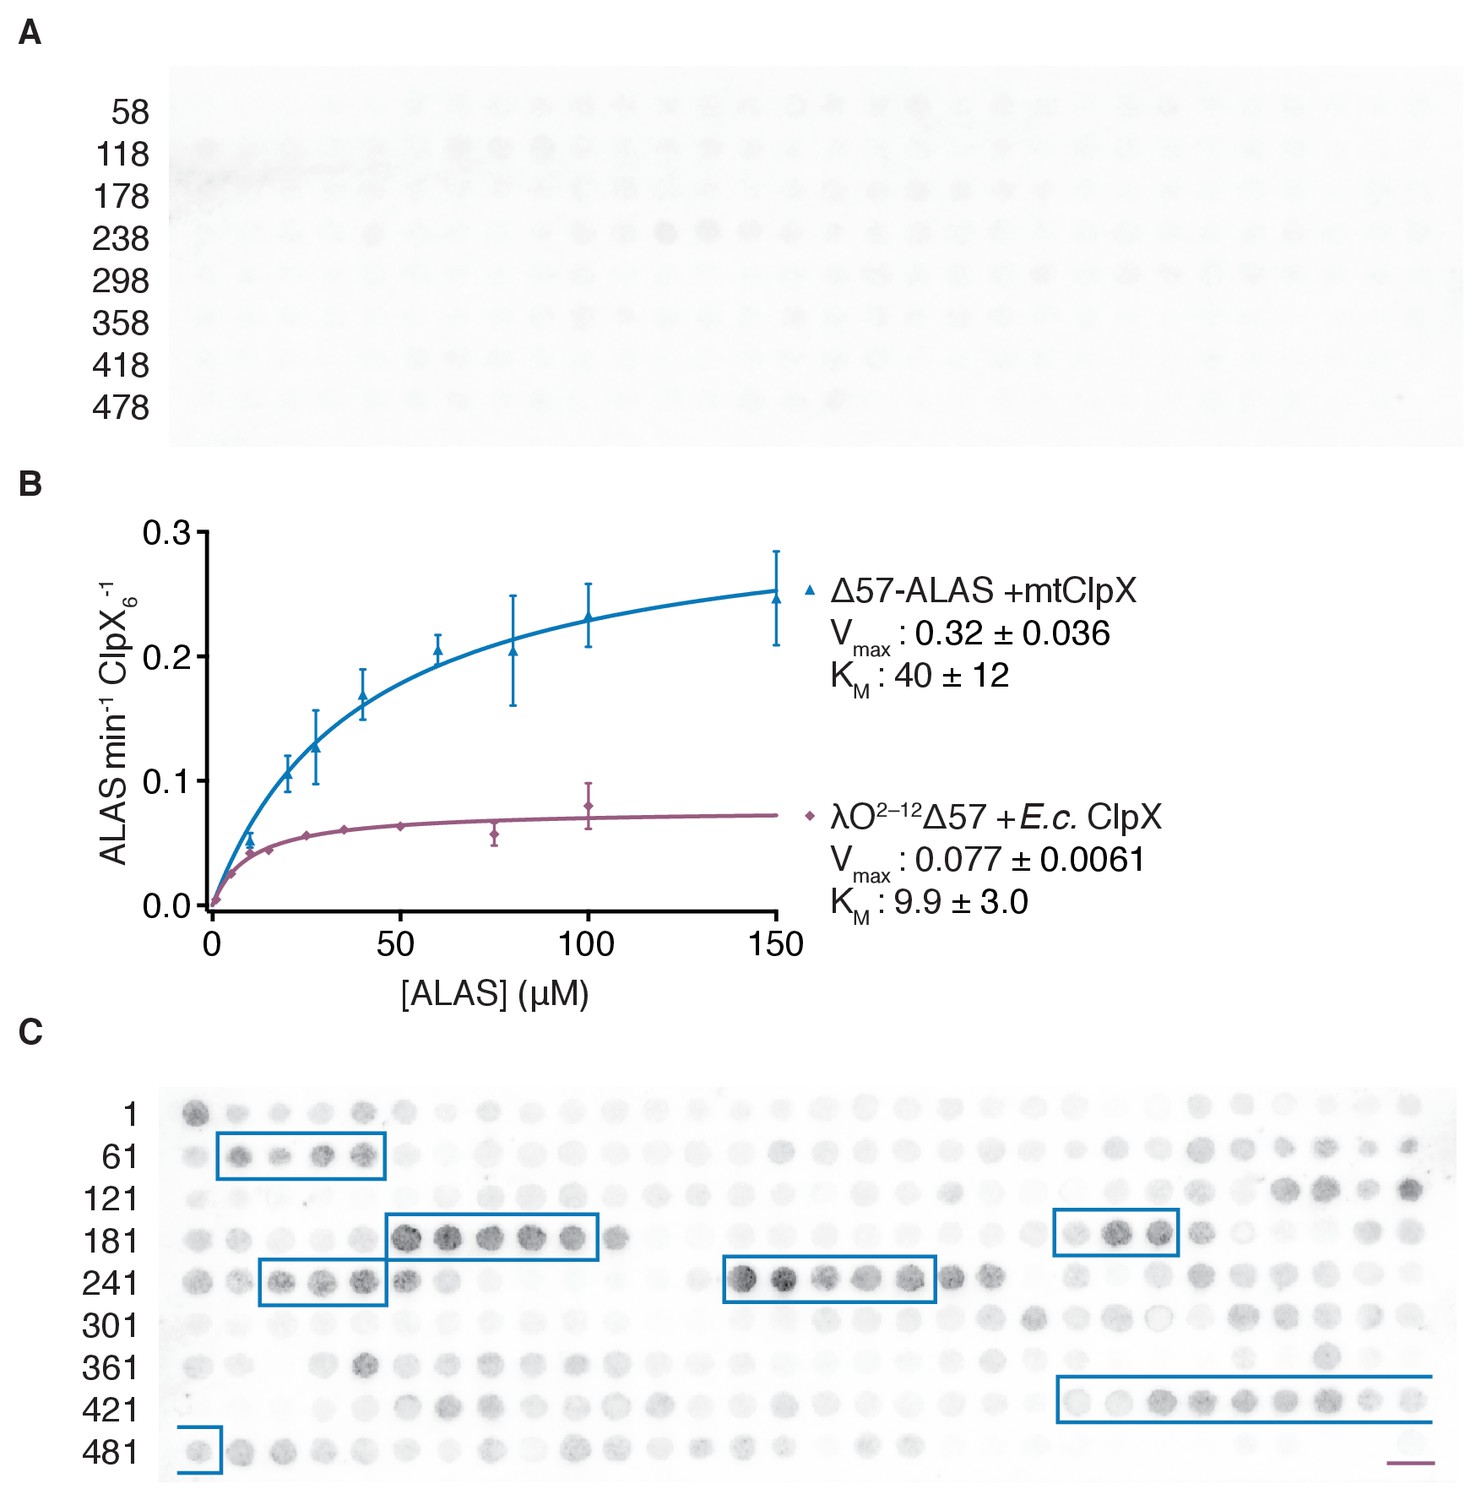
(A) Test of background antibody binding to peptide array of Δ57-ALAS sequence, as described in Figure 1A, omitting incubation with mtClpXE206Q-3xFLAG. Numbers indicate the first amino acid of the left-most peptide in each row. (B) Rates of mtClpX stimulated PLP binding to Δ57-ALAS (blue, n = 2) and E.c. ClpX stimulated PLP binding to λO2-12-Δ57-ALAS (purple, n = 2) are plotted as a function of ALAS monomer concentration. Curves and kinetic parameters represent fits of the Michaelis-Menten equation (Y = Vmax*X/(KM + X) to the data. (C) Peptide array of Δ34-ALAS sequence probed with mtClpXE206Q-3xFLAG and antibody as in (A). Numbers indicate the first amino acid of the left-most peptide in each row. λO2-12 peptide with an alanine spacer (TNTAKILNFGRAAAA) is also included at the lower right (underlined in purple).
Figure 1—figure supplement 2
PLP occupancy of ALAS.
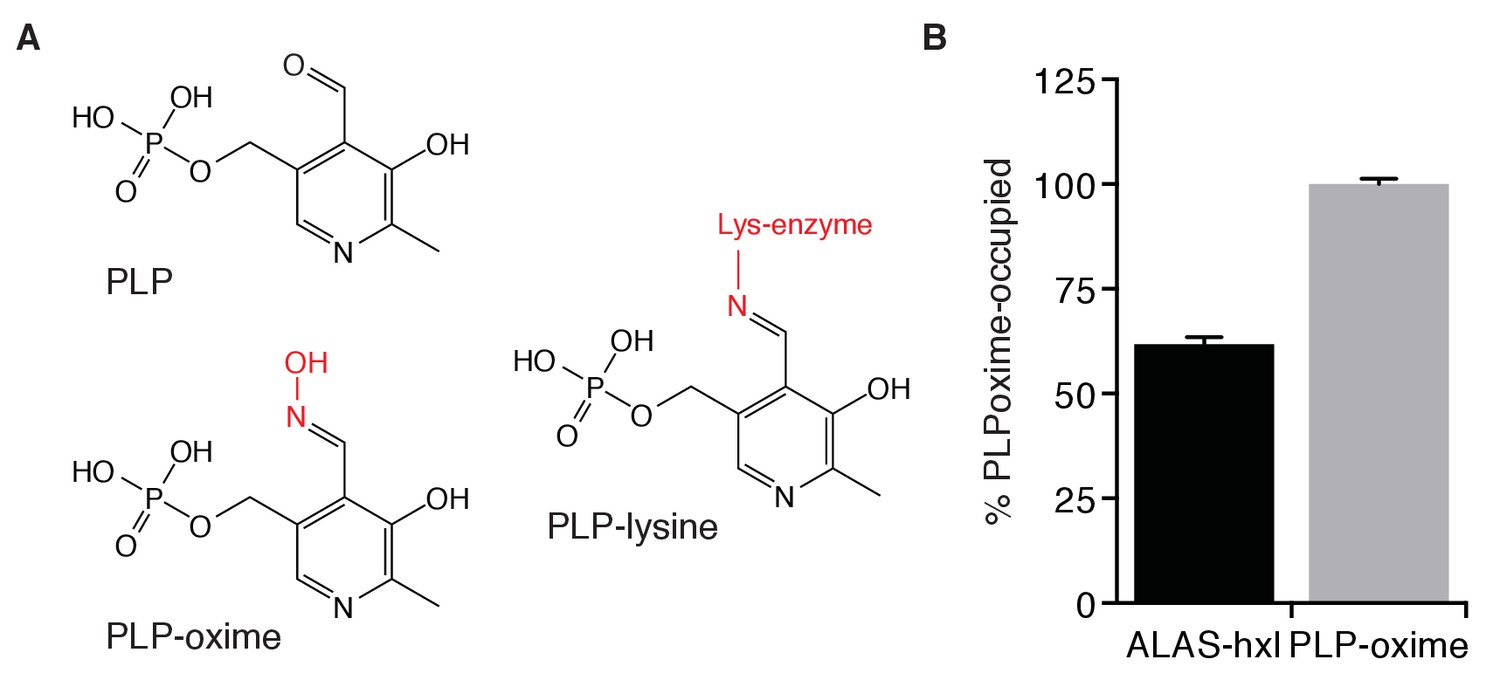
(A) Pyridoxal phosphate and derivatives. Modifications of the pyridoxal aldehyde group caused by conjugation in an enzyme active site or by reaction with hydroxylamine are indicated in red. (B) PLP-oxime content of 10 μM hydroxylamine-treated ALAS (ALAS-hxl), compared to 10 μM hydroxylamine-treated PLP (PLP-oxime), determined by fluorescence (ex. 380 nm, em. 460 nm) of the denatured and deproteinated solution.
Figure 2 with 1 supplement
mtClpX relies on an unstructured N-terminal extension for rapid activation of ALAS.
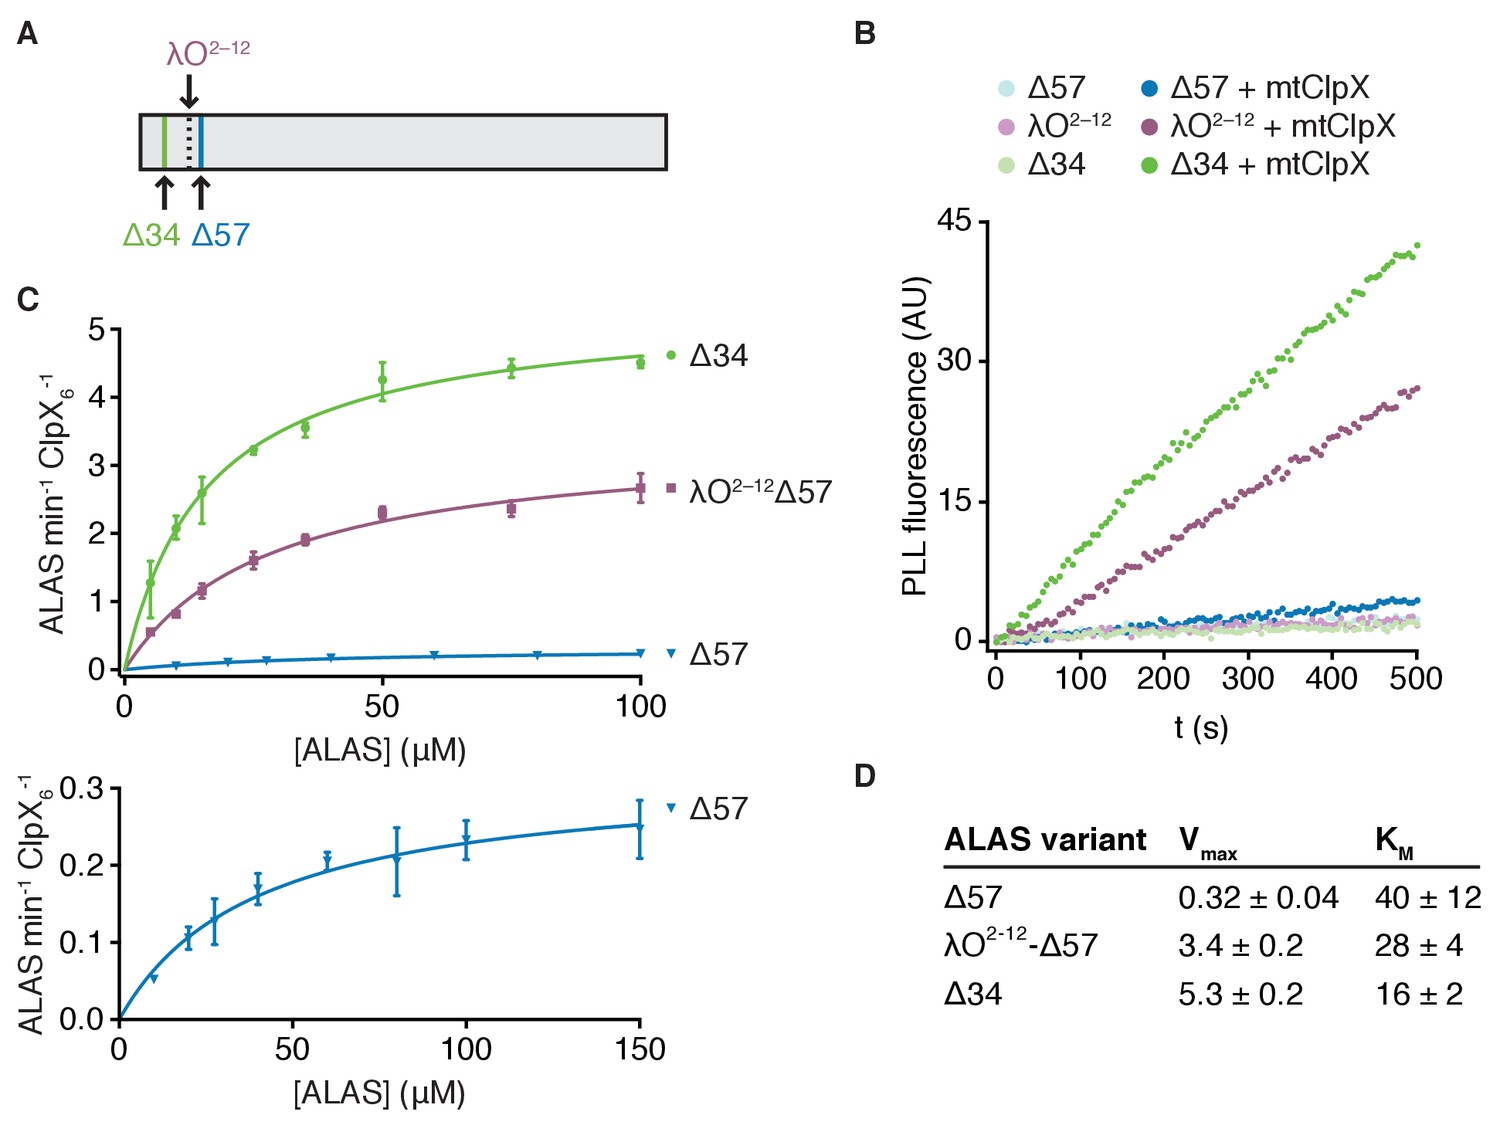
(A) Edman degradation of ALAS identified a single N-terminus corresponding to amino acid 35 of the preprotein. A C-terminal Myc-His7 tag was integrated at the genomic locus encoding ALAS and the tagged protein was purified from yeast cell extract by Ni-NTA affinity. (B) Fluorescence traces representing PLP binding to 5 μM ALAS variants ± 2 μM mtClpX hexamer, monitored as in Figure 1D. (C) The rates at which mtClpX stimulated PLP binding to Δ57-ALAS (blue, n = 2), λO2-12-Δ57-ALAS (purple, n = 2), or Δ34-ALAS (green, n = 3) are plotted as a function of ALAS monomer concentration. The lower graph shows the same fitted data for Δ57-ALAS as displayed in the upper graph with a smaller y-axis scale and an additional concentration (150 μM) not monitored for the other variants. mtClpX, when included, was present at 0.5 μM hexamer (λO2-12- and Δ34-ALAS variants) or 1 μM hexamer (Δ57-ALAS). PLP was included at 150 μM. Rates were extracted by linear fits to the early phase of PLP-binding fluorescence traces; the rate of mtClpX action was determined by subtracting the ALAS-alone PLP binding rate from the mtClpX-stimulated rate and normalizing to mtClpX concentration. Curves represent fits of the Michaelis-Menten equation (Y = Vmax*X/(Km + X) to the data. (D) Kinetic parameters for mtClpX action on ALAS variants, extracted from fits in (C). Standard error of the fit is stated.
Figure 2—figure supplement 1
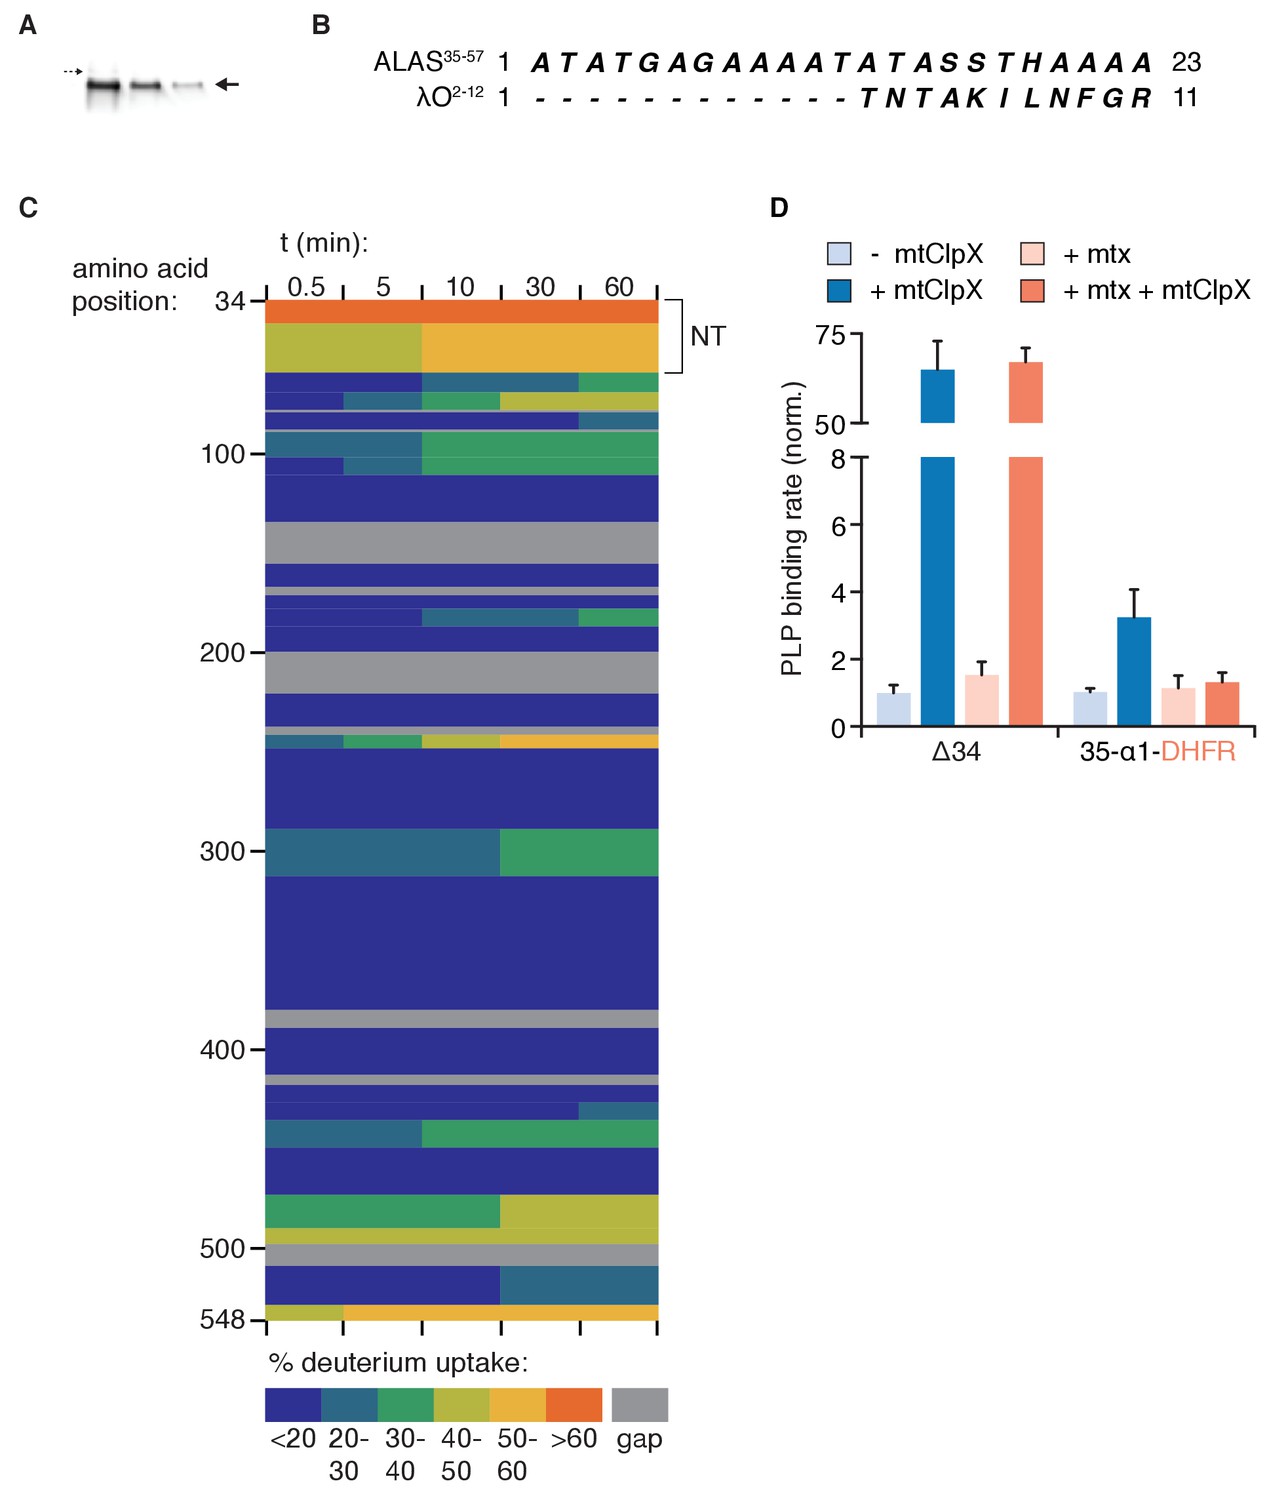
Determination and characterization of the mature N-terminus of ALAS.
(A) Western blot (mouse anti-Myc) of ALAS-Myc-His7 purified from yeast cell extracts by Ni-NTA affinity. Lanes are samples from three sequential elutions. The large arrow at right indicates major mature species subjected to Edman degradation; the small arrow at left represents indicates possible trace uncleaved preprotein. (B) Comparison of the natural ALAS sequence beyond the previously annotated mature N-terminus (35-57) and the λO2-12-ALAS fusion (λO2-12 sequence highlighted in purple). (C) Deuterium uptake in Δ34-ALAS, analyzed by HX MS. Only linear, non-overlapping peptides are shown; see Supplementary file 1 for deuterium uptake profiles of all peptides reproducibly detected. (D) Rate of PLP binding to Δ34-ALAS and corresponding DHFR fusion (35-α1-DHFR-Δ57-ALAS) (5 μM monomer), ± mtClpX (2 μM hexamer), ± methotrexate (mtx) (30 μM) were analyzed as in Figure 1C.
Figure 3 with 2 supplements

Multiple sequence-specific contacts direct mtClpX action on ALAS.
(A). The position of mutations that perturb mtClpX binding are mapped on one face of the structure of ALAS (PDB: 5TXR [Brown et al., 2018]) (F71 in yellow, Y73 in orange, and Y274 in dark blue). PLP is depicted in green. (B) Coimmunoprecipitation of ALAS variants with mtClpXE206Q-3xFLAG. 1 μM ALAS (monomer) and 0.5 μM mtClpXEQ-3xFLAG (hexamer) were incubated on ice with anti-FLAG antibody-conjugated magnetic beads. Coprecipitating proteins were eluted with 3xFLAG peptide. Eluted proteins were separated by SDS-PAGE and stained with Sypro Red. The bar graph above each lane of the gel represents the average intensity of the band from three independent experiments, normalized to wildtype Δ34-ALAS; error bars represent SD. (C–D) The rates at which mtClpX stimulated PLP binding to indicated ALAS variants are plotted as a function of ALAS monomer concentration; rates were determined and fit to the Michaelis-Menten equation as in Figure 2C. mtClpX was present at 0.5 μM hexamer (C) or 1 μM hexamer (D). Wildtype ALAS (Δ34-ALAS) data represented in Figure 2C is replotted in both panels. N = 3 for all variants. (E) Chart of parameters extracted from fits in (C–D) as in Figure 2C. Standard error of the fit is stated. (F) The levels of ALA in extracts from yeast strains harboring the indicated mutations in ALAS (HEM1 gene), with (MCX1) or without (mcx1Δ) the gene encoding mtClpX, were measured by colorimetric assay with modified Ehrlich’s reagent. p<0.001 for reduced ALA production in MCX1 strains by all mutations displayed in HEM1; p=0.05 for reduced ALA production in mcx1Δ hem1F71A/Y73A, n ≥ 3 for all strains; error bars represent SD.
Figure 3—figure supplement 1

mtClpX-binding sequences in ALAS.
15-amino-acid peptides derived from mtClpX-binding sequences determined in Figure 1A were scanned at each position with alanine and aspartate in a peptide array. The top row of the array contains the wildtype peptides (repeated twice, left to right) and non-binding peptides (peptides that mtClpX did not bind in Figure 1A). Non-binding peptides are arrayed in the following series, repeated three times: LIDSELQKKRLDKSY (76-90), DSELQKKRLD-KSYRY (78-92), LEQLLQSYPKSVPKL (234-248), QLLQSYPKSVPKLIA (236-250), VRDPIVKQLEVSSGI (532-546), DPIVKQLEVSSGIKQ (534-548). Blue boxes represent ALAS variants analyzed.
Figure 3—figure supplement 2
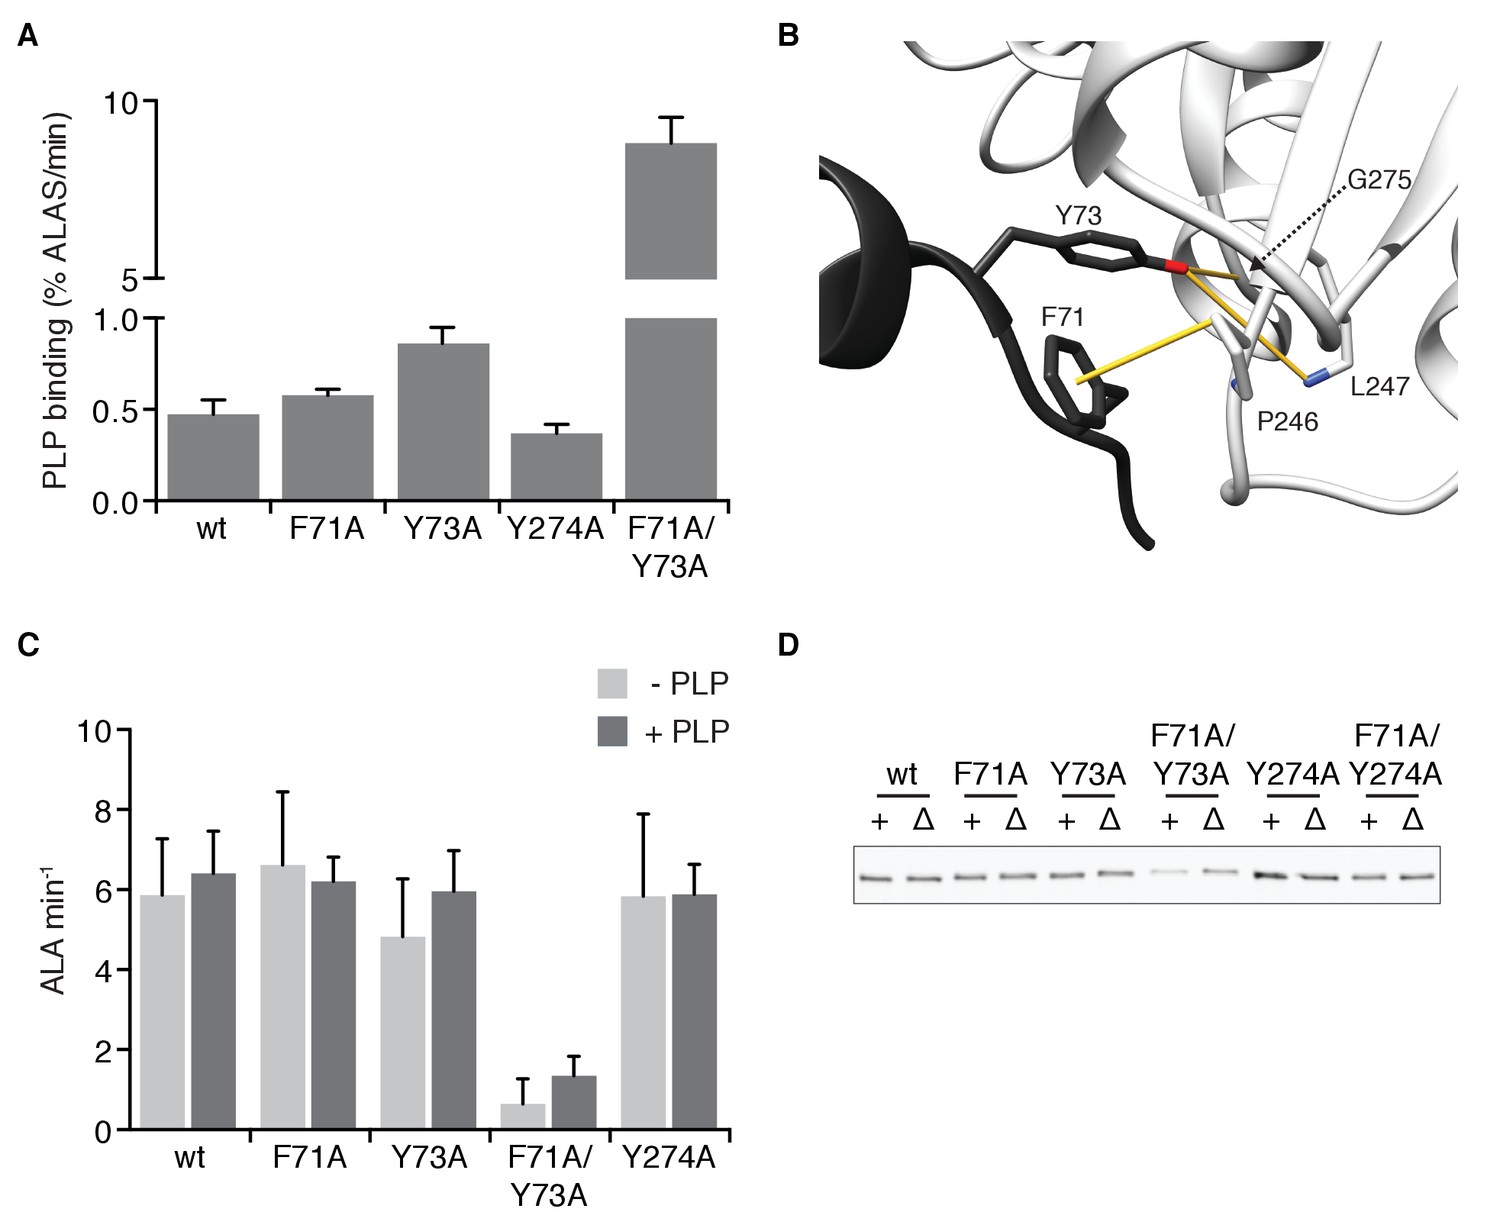
Structure and function of mtClpX-interacting residues in ALAS.
(A) Spontaneous binding rates of PLP to indicated ALAS variants. Rates were determined by linear fits to the pseudolinear early phase of PLP binding, measured by fluorescence (ex. 434 nm, em. 515 nm). ALAS variants were present at 10 μM, PLP at 150 μM, and ATP at 2 mM with a regenerating system. (B) CH-pi and H-bonding interactions (depicted as yellow bars) mediated by the side chains of mtClpX-interacting residues F71 and Y73 (in protomer rendered in dark gray) with residues on the other protomer (rendered in light gray). (C) Activity of purified ALAS variants was monitored in vitro using modified Ehrlich’s reagent in a colorimetric assay (see Materials and Methods). Error bars represent SD of three independent assays; p<0.01 for reduced ALASF71A/Y73A with or without PLP. (D) Relative protein levels of ALAS-3xMyc variants in vivo, determined by western blotting of yeast cell extracts with mouse anti-Myc antibody (9E10 clone, Sigma-Aldrich) and IRDye 800CW Goat anti-rabbit IgG (Li-Cor) and visualized with an Odyssey scanner (Li-Cor).
Figure 4 with 1 supplement
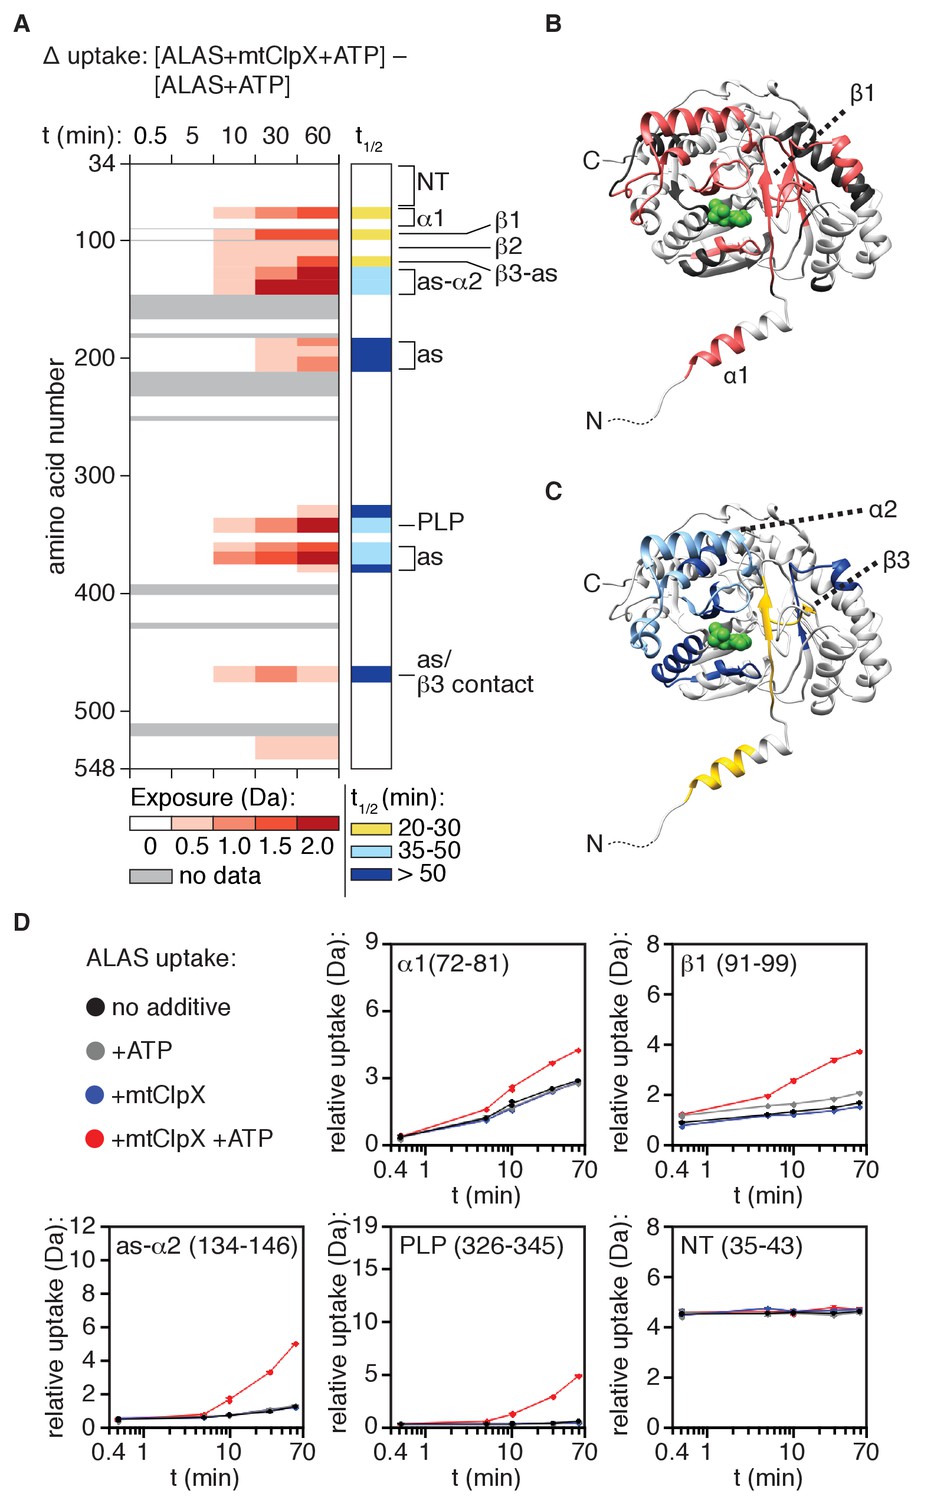
mtClpX remodels a limited region of ALAS that extends from its N-terminal binding site to the active site of ALAS.
(A) Left panel: mtClpX-induced deuterium uptake in PLP-depleted (hydroxylamine-treated) ALAS (difference in deuterium uptake of ALAS with mtClpX and ATP present and ALAS with ATP only). A set of linear, non-overlapping peptides is shown. Legend indicates minimum value of induced deuterium uptake for each color. See also Supplementary file 1 for difference maps of all peptides monitored. Peptides used in the linear map are indicated in this file. Right panel: half-life (t1/2) of mtClpX-induced exchange for peptides in which EX1 kinetics could be clearly assigned. To the right of both panels, the correspondence of structural and functional elements of interest in ALAS with detected peptides are indicated as follows: NT: (flexible N-terminus), 35–52, 53–71; α1: 72–81, 82–89; β1: 91–99; β2, 101–113; β3-A (β3 + active site-proximal sequence): 114–122; as-α2, 125–133, 134–152; as: 184–190, 191–199, 201–212; PLP (PLP-binding active site lysine): 326–345; as: 357–363, 364–374; as/β3 contact (tertiary structure contact with β3): 461–476. (B) mtClpX-induced deuterium uptake above 0.5 Da at 10 min from (A) is mapped in salmon on the structure of ALAS (PDB: 5TXR [Brown et al., 2018]). One protomer of the dimer is displayed; PLP is depicted in green. (C) t1/2 of the mtClpX-induced EX1 deuterium signatures from (A) mapped on one protomer of the ALAS dimer as in (B). Colors correspond to t1/2 as in the right panel of (A). (D) Plots of deuterium uptake over time ± ATP, ±mtClpX for selected peptides (amino acid coordinates in parentheses) from ALAS.
Figure 4—figure supplement 1

Deuterium uptake difference maps.
(A) Legend for deuterium uptake difference maps in (B–D). Legend indicates minimum value of induced deuterium uptake for each color. (B–D) Difference maps comparing the states indicated composed of linear array of peptides corresponding to those shown in Figure 4A. Deuterium uptake difference between the two states indicated was subtracted for each plot. See also Supplementary file 1 for difference maps of all peptides monitored. Specific peptides used in the linear maps are indicated in this file. (E) Plots of deuterium uptake over time for selected peptides that exhibit PLP-suppressed mtClpX-induced deuterium uptake (left) or PLP-insensitive mtClpX-induced deuterium uptake (right). 327–345 contains the PLP-bonding lysine (337); 72–78 lies in α1.
Figure 5 with 1 supplement
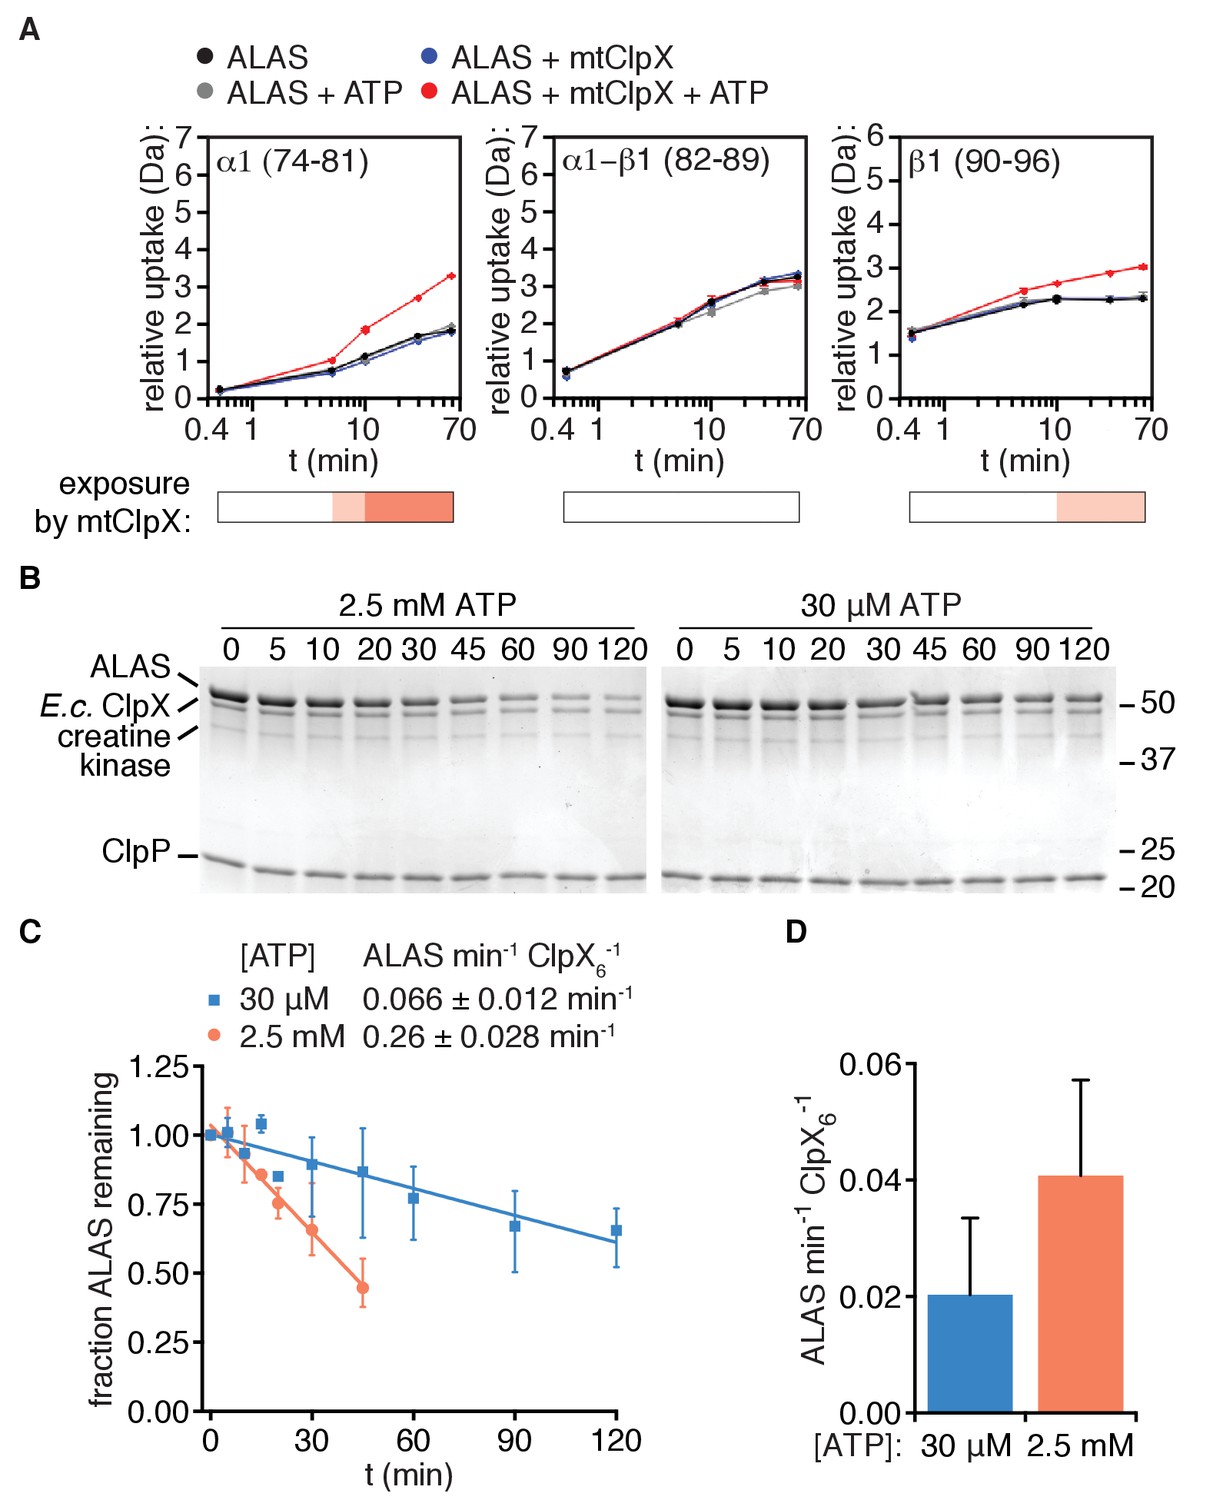
Unfolding is arrested near the N-terminus of the ordered structure of ALAS.
(A) Deuterium uptake plots of peptides in ALAS (amino acid coordinates indicated) indicate a break in the linear path of ClpX-induced uptale. The most N-terminal alpha helix displays ClpX-induced uptake (left), the α1-β1 junction does not (middle), and the following strand β1 (right) also displays ClpX-induced uptake. Bars below the plots indicate the magnitude of ClpX-induced uptake (uptake[ALAS+ATP] – uptake [ALAS+ATP+mtClpX] as in Figure 4 (white:≤0.5 Da; light salmon:≥0.5,≤1.0; orange:≥1.0,≤1.5. (B) Degradation of λO2-12-ALAS (10 μM) was monitored in the presence of E. coli ClpX and ClpP (0.5 μM hexamer, 0.8 μM 14-mer, respectively) in PD150 with the indicated ATP concentration, an ATP regenerating system (5 mM creatine phosphate and 50 μg/mL creatine kinase), and 150 μM PLP at 30°C. Samples were quenched with SDS at the indicated times, separated by SDS-PAGE, stained with Coomassie R250, and imaged using a Bio-Rad ChemiDoc MP. The positions of molecular weight markers are indicated on the right in kDa. (C) Degradation of λO2-12-ALAS by E. coli ClpXP as described in (B) was quantified from gel images using ImageJ and degradation rates were extracted by linear fit using Graphpad Prism (RRID:SCR_002798). (D) Stimulation of PLP binding to λO2-12-ALAS by E. coli ClpX was assessed at the indicated ATP concentrations, otherwise as described in Materials and Methods.
Figure 5—figure supplement 1

KM for ATP hydrolysis by E. coli ClpX.
Reactions were performed in a 384-well plate at 30°C in PD150 with 0.3 μM ClpX hexamer, indicated concentrations of ATP, and an NADH-oxidation-coupled assay system (1 mM NADH, 7.5 mM phosphoenolpyruvate, 20 units/mL lactate dehydrogenase, 20 units/mL pyruvate kinase; all obtained from Sigma-Aldrich), monitoring the absorbance at 340 nm using a Spectramax M5e plate reader (Molecular Devices). Curve represents a fit of the quadratic velocity equation (Y = Vmax*((E + X + KM) - sqrt((E + X + KM)^2 - (4*E*X)))/(2*E) to hydrolysis rates as a function of ATP concentration.
Figure 6 with 1 supplement
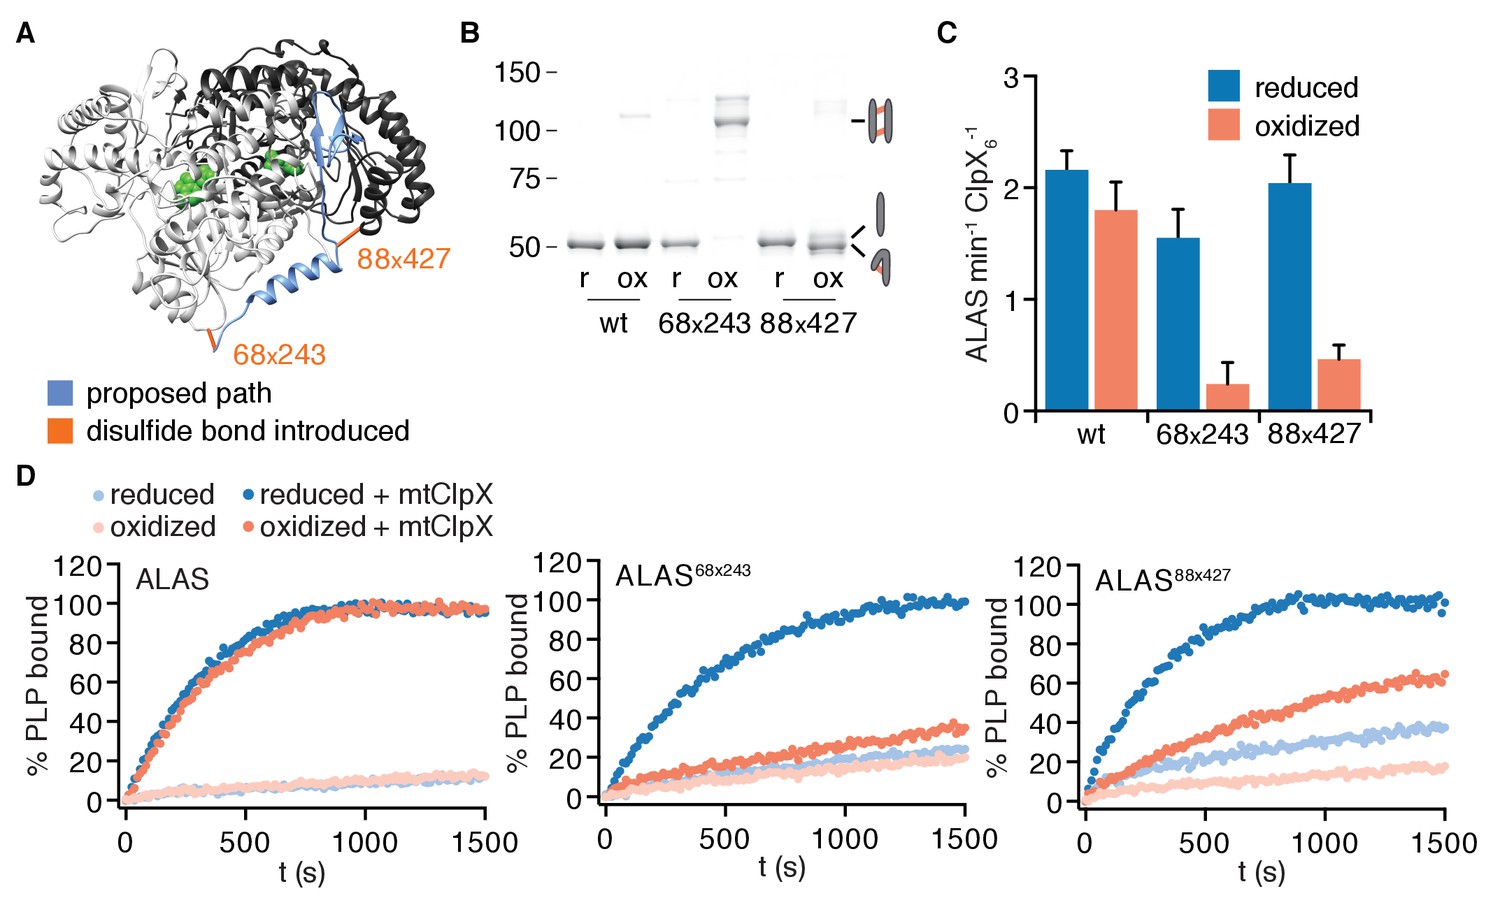
Unfolding of N-terminal secondary structure is required for mtClpX to activate ALAS.
(A) The proposed path of mtClpX unfolding of ALAS to the active site is indicated in blue on the structure of yeast ALAS (PDB: 5TXR (Brown et al., 2018); image created with UCSF Chimera (Pettersen et al., 2004). The positions of cysteine pairs (indicated by amino acid number) introduced into ALAS are indicated by orange bonds. (B) Samples of ALAS cysteine variants (wt, 68–243, and 88–427) were separated by nonreducing SDS-PAGE and stained with Sypro Red, after oxidation (induced by addition of copper phenanthroline) and after reduction of oxidized samples with TCEP. Molecular weight marker (MW) sizes are indicated in kD. Cartoons indicate expected migration of species with intermolecular crosslinks (top right), uncrosslinked (middle right), and intramolecular crosslinks (bottom right). (C) mtClpX stimulation of PLP binding to indicated ALAS variants after oxidation and after re-reduction, monitored by fluorescence (ex. 434 nm, em. 515 nm). ALAS variants were present at 10 μM (monomer), PLP at 150 μM, ATP at 2 mM + regenerating system, and mtClpX, when included, at 0.5 μM (hexamer). Error bars represent SD from three independent experiments. p=0.002 for suppression of mtClpX action by oxidation of ALAS68x243 and 10−4 for ALAS88x427 (compared to reduced form of same variant). (D) Representative traces of PLP binding to ALAS variants. 100% PLP-bound value was set to observed plateau of PLP fluorescence.
Figure 6—figure supplement 1

Model for mtClpX-directed remodeling and activation of ALAS.
A group of sequence-specific contacts (blue sidechains) position mtClpX on ALAS; this contacts are important for both avidity and efficiency of processing. A flexible N-terminal element extending from this group (dotted blue line) provides a grip from which mtClpX pulls (indicated by arrow) to unfold a limited region of ALAS (as indicated by deuterium uptake, depicted in green) to expose the PLP-binding active site (PLP depicted in dark blue). The predicted region at which mtClpX arrests is mapped in coral. The structure of S. cerevisiae ALAS (PDB: 5TXR) is shown, with each protomer of the dimer colored in light or dark gray.
Additional files
-
Supplementary file 1
Deuterium uptake and difference values for all peptides monitored in ALAS.
- https://cdn.elifesciences.org/articles/54387/elife-54387-supp1-v2.xlsx
-
Supplementary file 2
S. cerevisiae strains used in this work.
All strains were made in w303 mat a background (MATa ade2-1 leu2-3 ura3 trp1-1 his3-11,15 can1-100 GAL psi+).
- https://cdn.elifesciences.org/articles/54387/elife-54387-supp2-v2.docx
-
Transparent reporting form
- https://cdn.elifesciences.org/articles/54387/elife-54387-transrepform-v2.pdf
Download links
A two-part list of links to download the article, or parts of the article, in various formats.
Downloads (link to download the article as PDF)
Open citations (links to open the citations from this article in various online reference manager services)
Cite this article (links to download the citations from this article in formats compatible with various reference manager tools)
Mitochondrial ClpX activates an essential biosynthetic enzyme through partial unfolding
eLife 9:e54387.
https://doi.org/10.7554/eLife.54387


