A non-linear system patterns Rab5 GTPase on the membrane
- Max-Planck Institute of Molecular Cell Biology and Genetics, Germany
- Chair of Scientific Computing for Systems Biology, Faculty of Computer Science, Germany
- MOSAIC Group, Center for Systems Biology Dresden, Germany
Figures
Figure 1 with 1 supplement

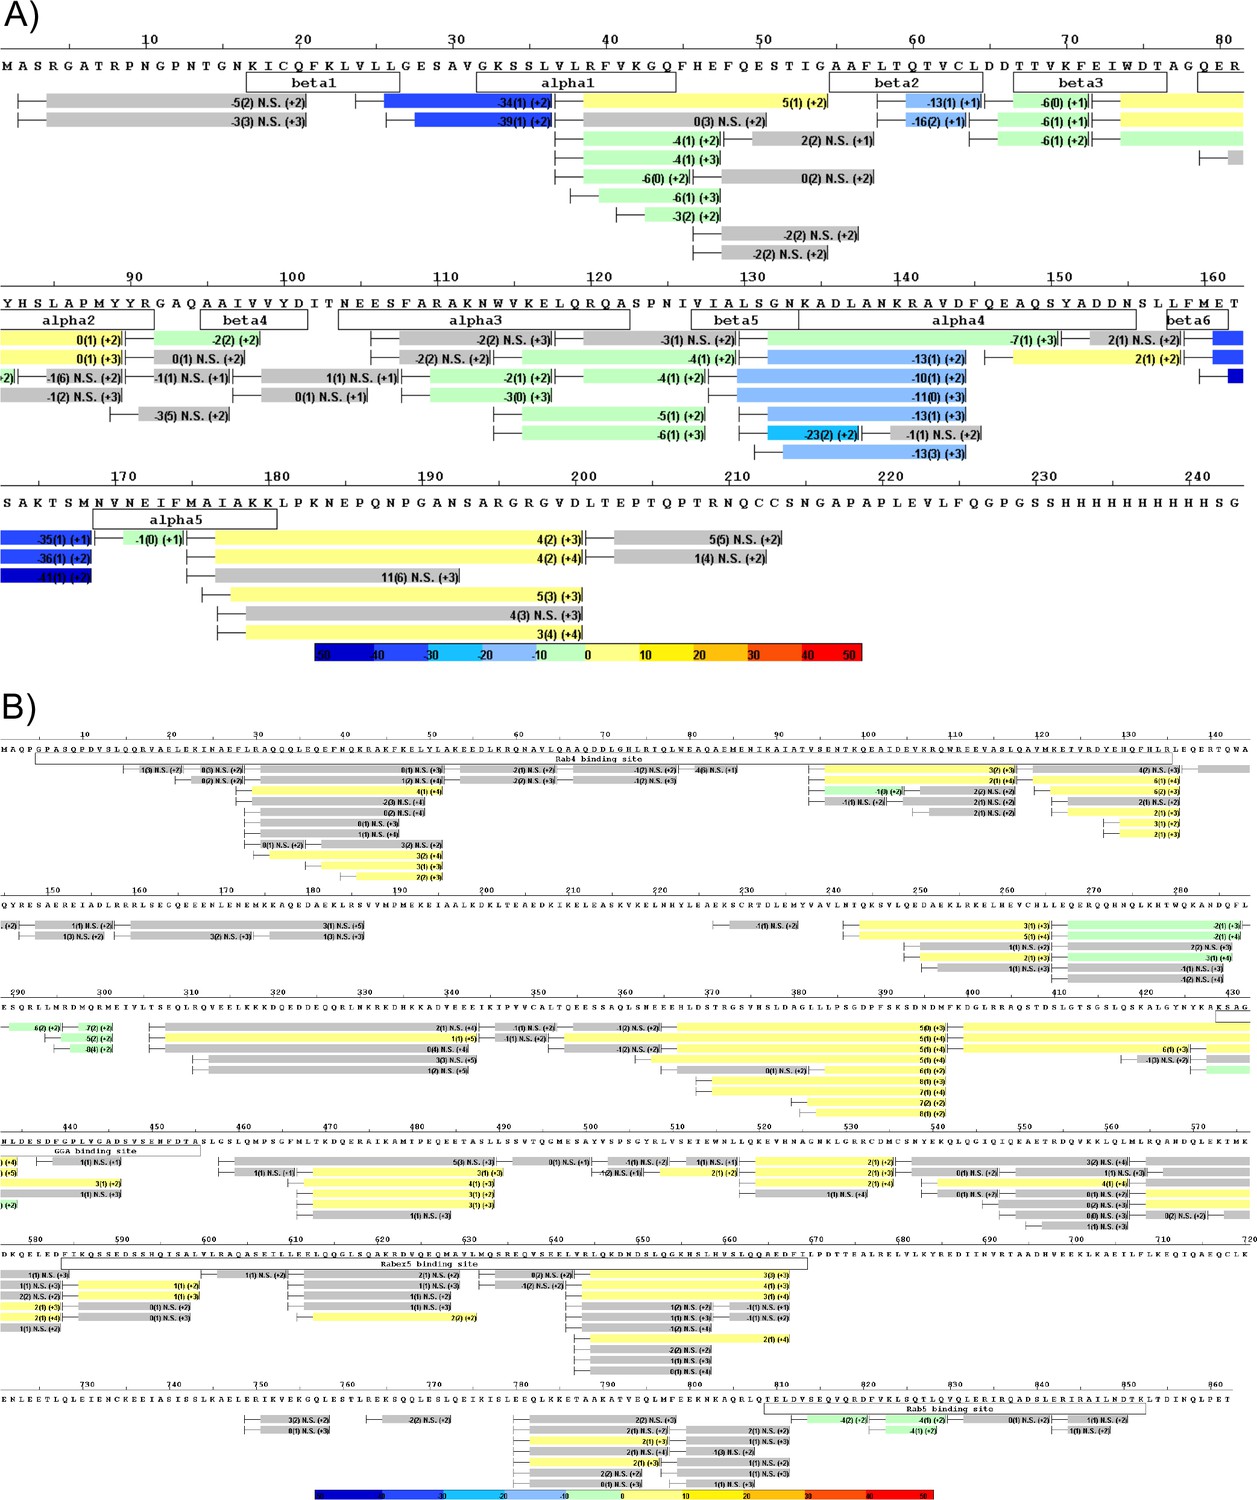
Rab5 backbone dynamics during nucleotide exchange.
(A) Scheme of reaction. The ternary complex (Rab5/Rabex5/Rabaptin5) was incubated in D2O for 1, 5 or 15 min in the presence or absence of GTPγS. (B) Crystal structure of Rab5:GTP (PDBID: 3MJH) pseudocolored to show differential uptake of ternary complex (Rab5/Rabex5/Rabaptin5)±GTPγS (average of 1 min, 5 min and 15 min timepoints). The Mg2+ ion is shown as a sphere (magenta) and GTPγS as a line structure. Color scheme: regions that are protected from exchange, i.e. stabilization, are colored with cool colors; regions with enhanced exchange with warm colors; regions with no statistically different uptake are colored in grey; and regions with no peptide coverage are white. (C) Deuterium incorporation over time in Rab5 β2 (aa 58–63, colored blue in B), in the ternary complex (Rab5/Rabex5/Rabaptin5)±GTPγS (n = 3) (D) Differential deuterium incorporation in Rabaptin5 during the nucleotide exchange reaction. Two areas of protection (decrease in deuterium uptake) correspond with the Rab5 binding sites.
Figure 1—figure supplement 1
Differential deuterium uptake of Rab5 and Rabaptin5 during nucleotide exchange.
(A) Differential uptake of Rab5 in the ternary complex (Rab5/Rabex5/Rabaptin5)±GTPγS (average of 1 min, 5 min and 15 min timepoints). See also Figure 1B. (B) Differential uptake of Rabaptin5 in the ternary complex (Rab5/Rabex5/Rabaptin5)±GTPγS (average of 1 min, 5 min and 15 min timepoints). See also Figure 1D.
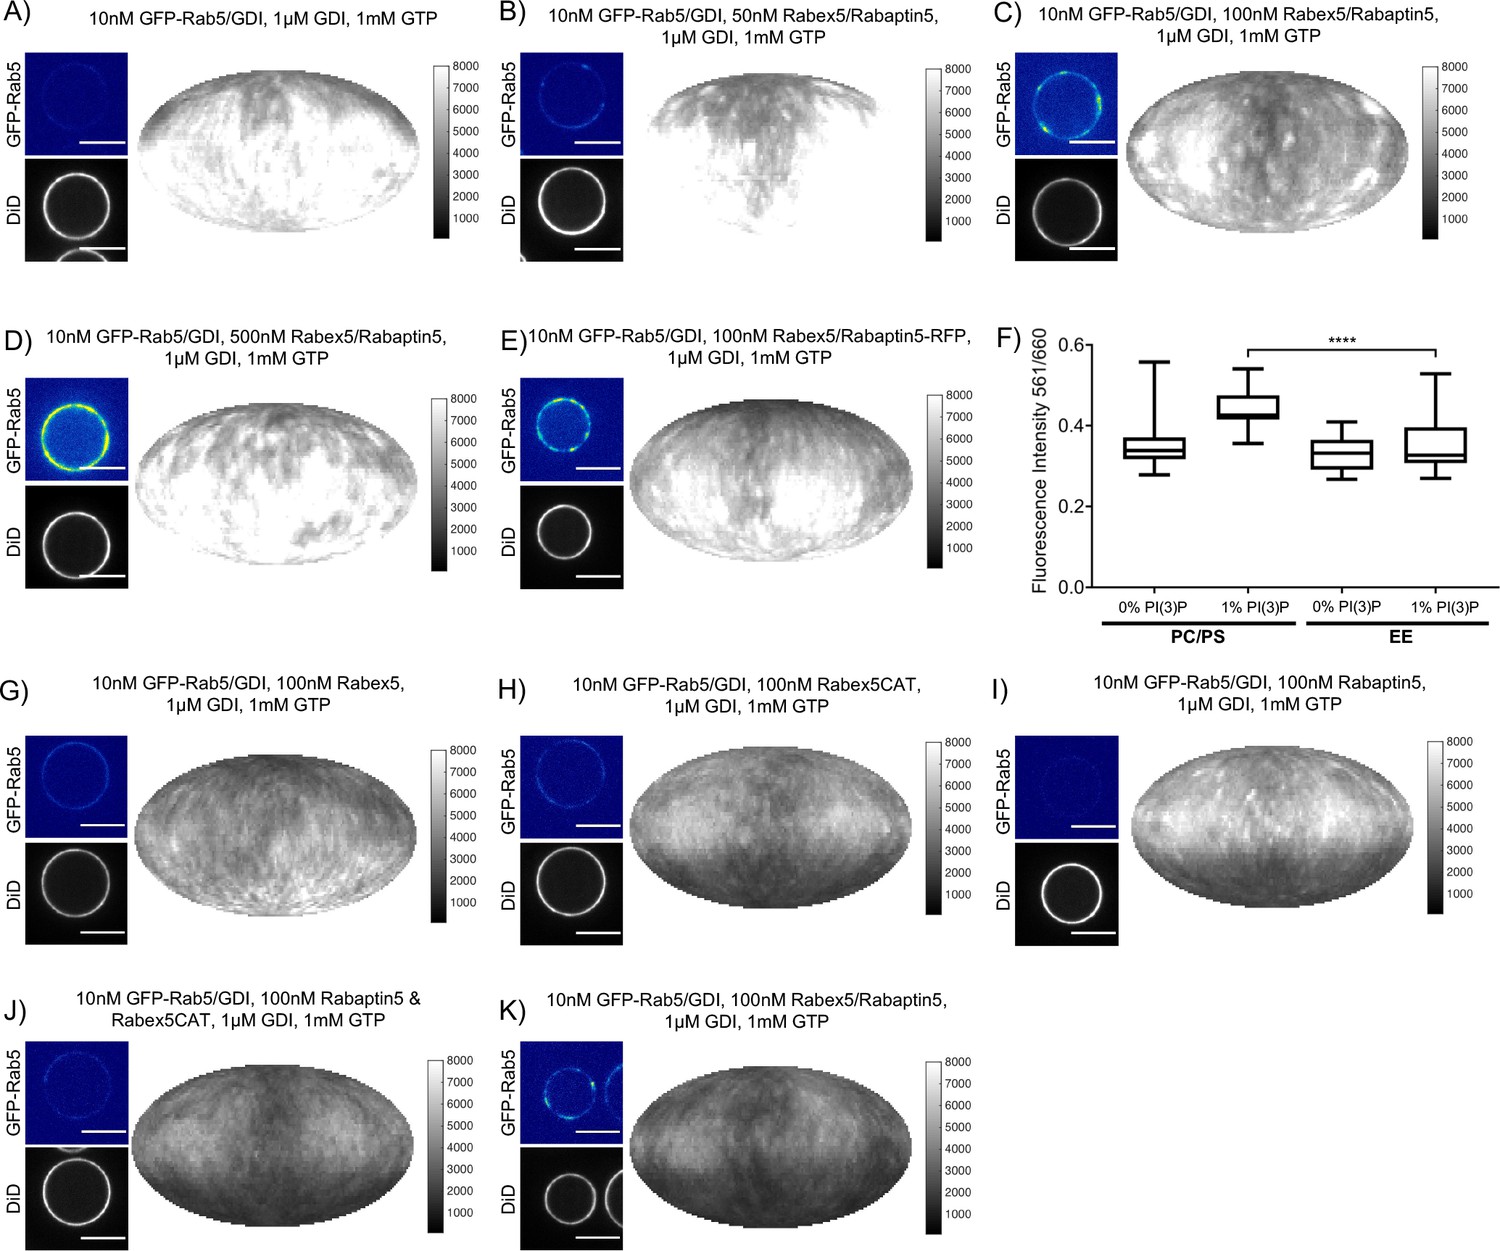
Figure 2 with 3 supplements
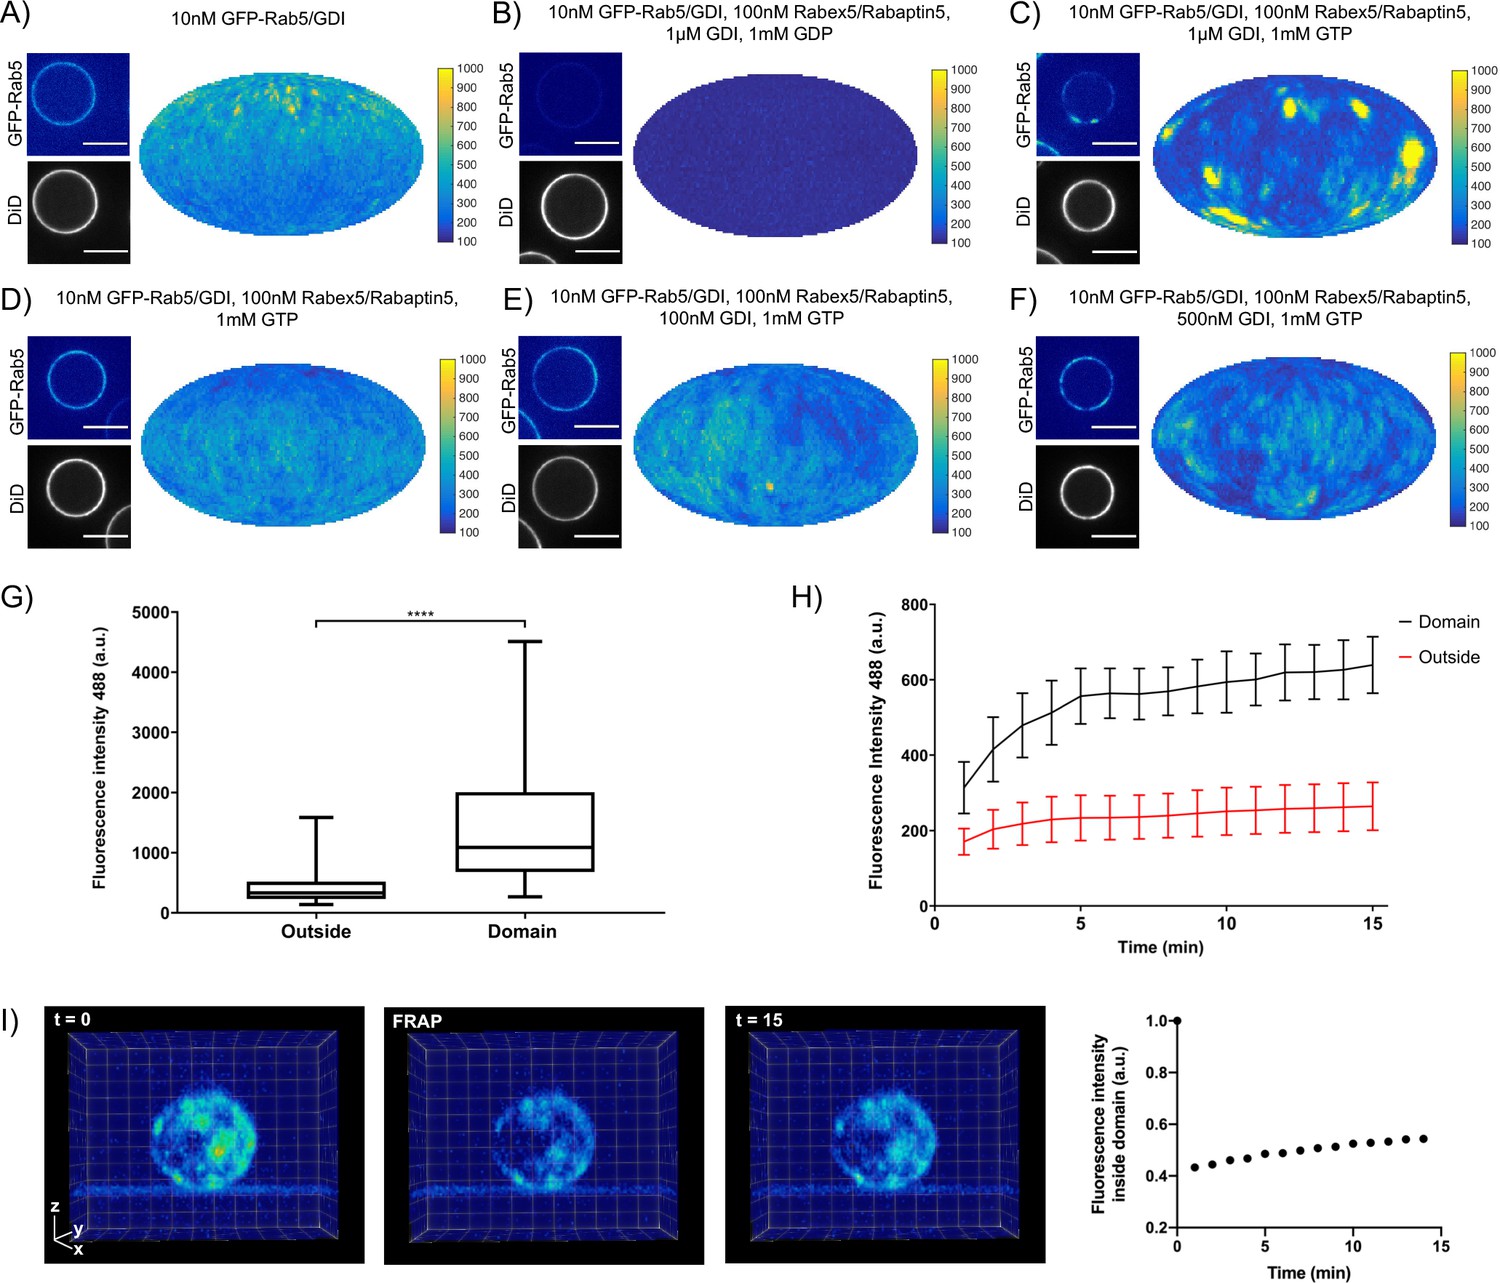
Rab5 domains can be reconstituted in vitro.
EE MCBs were incubated for 15 min at 23 °C with 10 nM GFP-Rab5/GDI A) and supplemented with 1 μM GDI, 100 nM Rabex5/Rabaptin5-RFP and 1 mM GDP (B) or GTP (C). (D–F) GDI is necessary for Rab5 domain formation. EE MCBs were incubated with 10 nM GFP-Rab5/GDI complex, 100 nM Rabex5/Rabaptin5 1 mM GTP and 0 nM (D), 100 nM (E) or 500 nM (F) GDI. Beads are presented as equatorial slices in GFP and DiD channels (left) and a Mollweide projection of the GFP channel (right). Scale Bar = 10 µm. (G) Mean GFP-Rab5 signal intensity outside of and within segmented domains in C) (See also Table 2) (p=<0.0001) (H) EE MCBs were at 23 °C with 10 nM GFP-Rab5/GDI 1 μM GDI, 100 nM Rabex5/Rabaptin5 and 1 mM GTP and imaged in 1 min intervals for a total of 15 min. Graph presents mean GFP-Rab5 signal intensity outside of and within segmented domains over time (n = 63).). (I) EE MCBs were incubated for 15 min at 23 °C with 10 nM GFP-Rab5/GDI 1 μM GDI, 100 nM Rabex5/Rabaptin5 and 1 mM GTP (panel 1; ‚t = 0‘) then bleached (panel 2; ‚FRAP‘) and imaged in 1 min intervals for a total of 15 min. Shown here are stills from Figure 2—Video 2 (panels 1–3) and average intensity within segmented domains over time (panel 4; n = 27).
-
Figure 2—source data 1
Rab5 domains can be reconstituted in vitro.
- https://cdn.elifesciences.org/articles/54434/elife-54434-fig2-data1-v1.xlsx
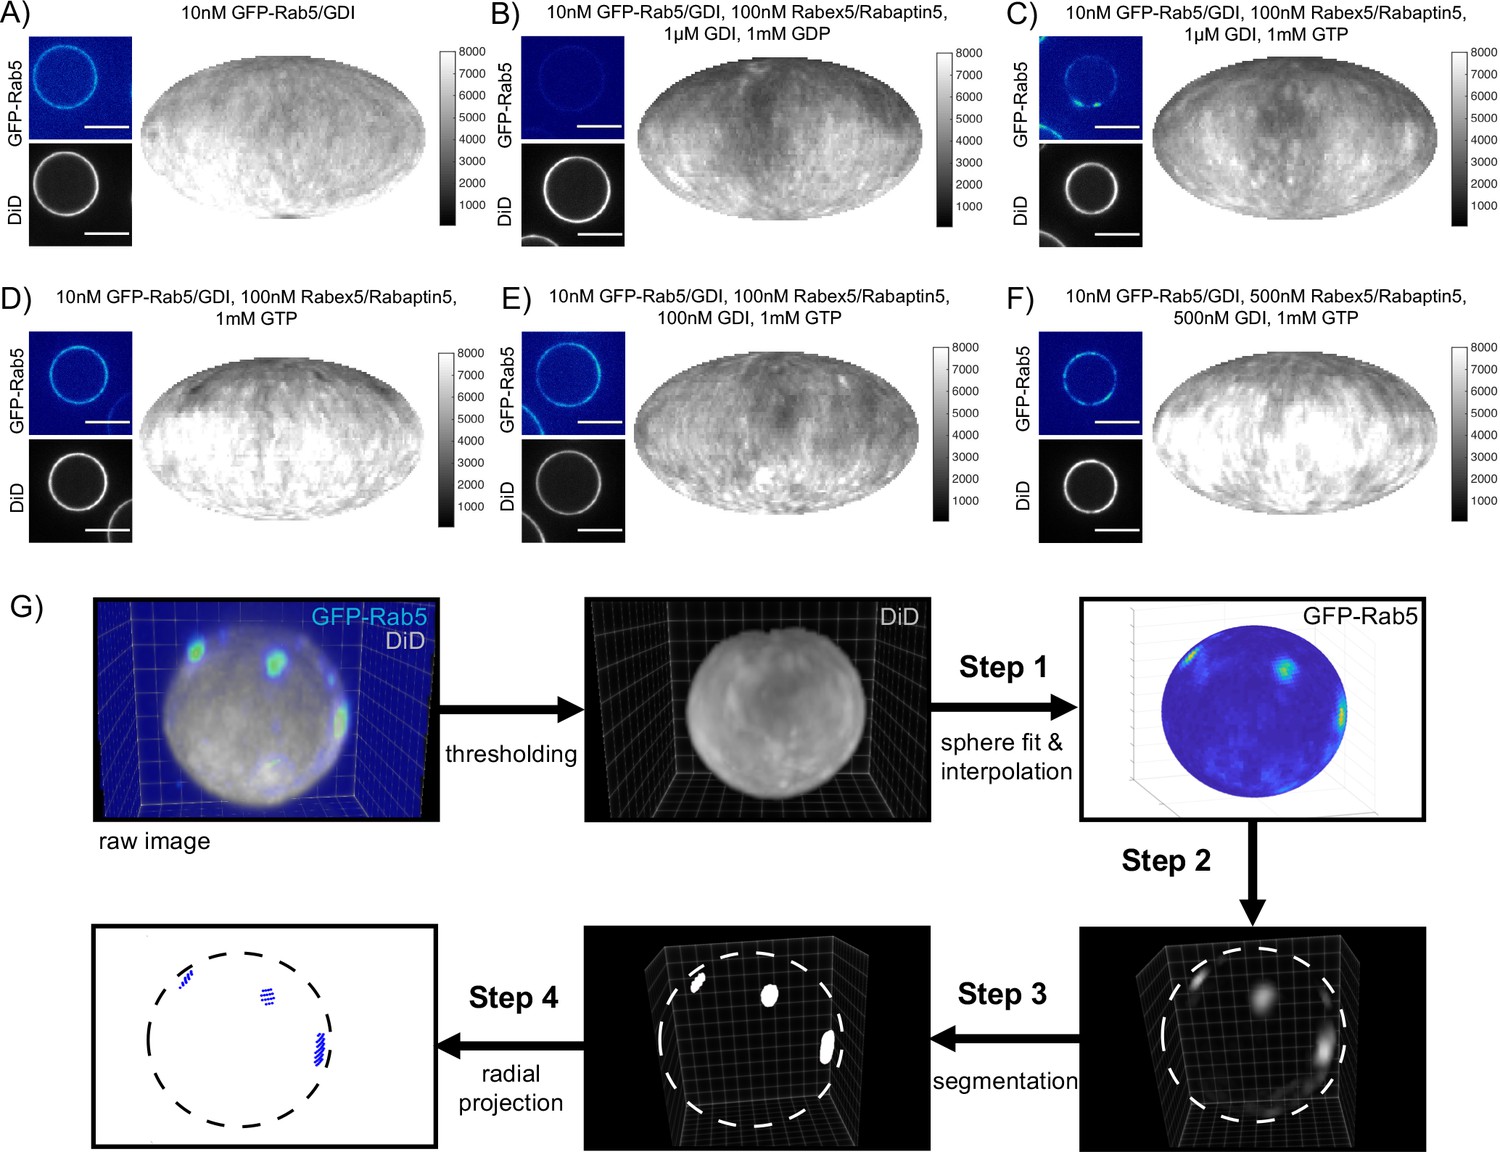
Figure 2—figure supplement 1
Rab5 domains can be reconstituted in vitro.
EE MCBs were incubated for 15 min at 23 °C with 10 nM GFP-Rab5/GDI A) and supplemented with 1 μM GDI, 100 nM Rabex5/Rabaptin5-RFP and 1 mM GDP (B) or GTP (C). (D–F) GDI is for Rab5 domain formation. EE MCBs were incubated with 10 nM GFP-Rab5/GDI complex, 100 nM Rabex5/Rabaptin5 1 mM GTP and 0 nM (D), 100 nM (E) or 500 nM (F) GDI. Beads are presented as equatorial slices in GFP and DiD channels (left) and Mollweide projection of the DiD channel (right). (G) Illustration of the main steps of the present pipeline for domain segmentation on spherical beads. Step 1: Sphere extraction on the membrane signal (DiD). Particle representation of the surface by a narrow band and interpolation of the intensity of Rab5 channel to the particle locations. Step 2: Background subtraction in tangential direction. Step 3: Model-based globally optimal segmentation on the volumetric data. Step 4: Normal mapping of the segmentation to the particles using a marching cubes algorithm and domain quantification and visualization.
Figure 2—video 1
Rab5 domains can be reconstituted in vitro.
Figure 2—video 2
Rab5 domains recover after photobleaching.
Figure 3 with 1 supplement
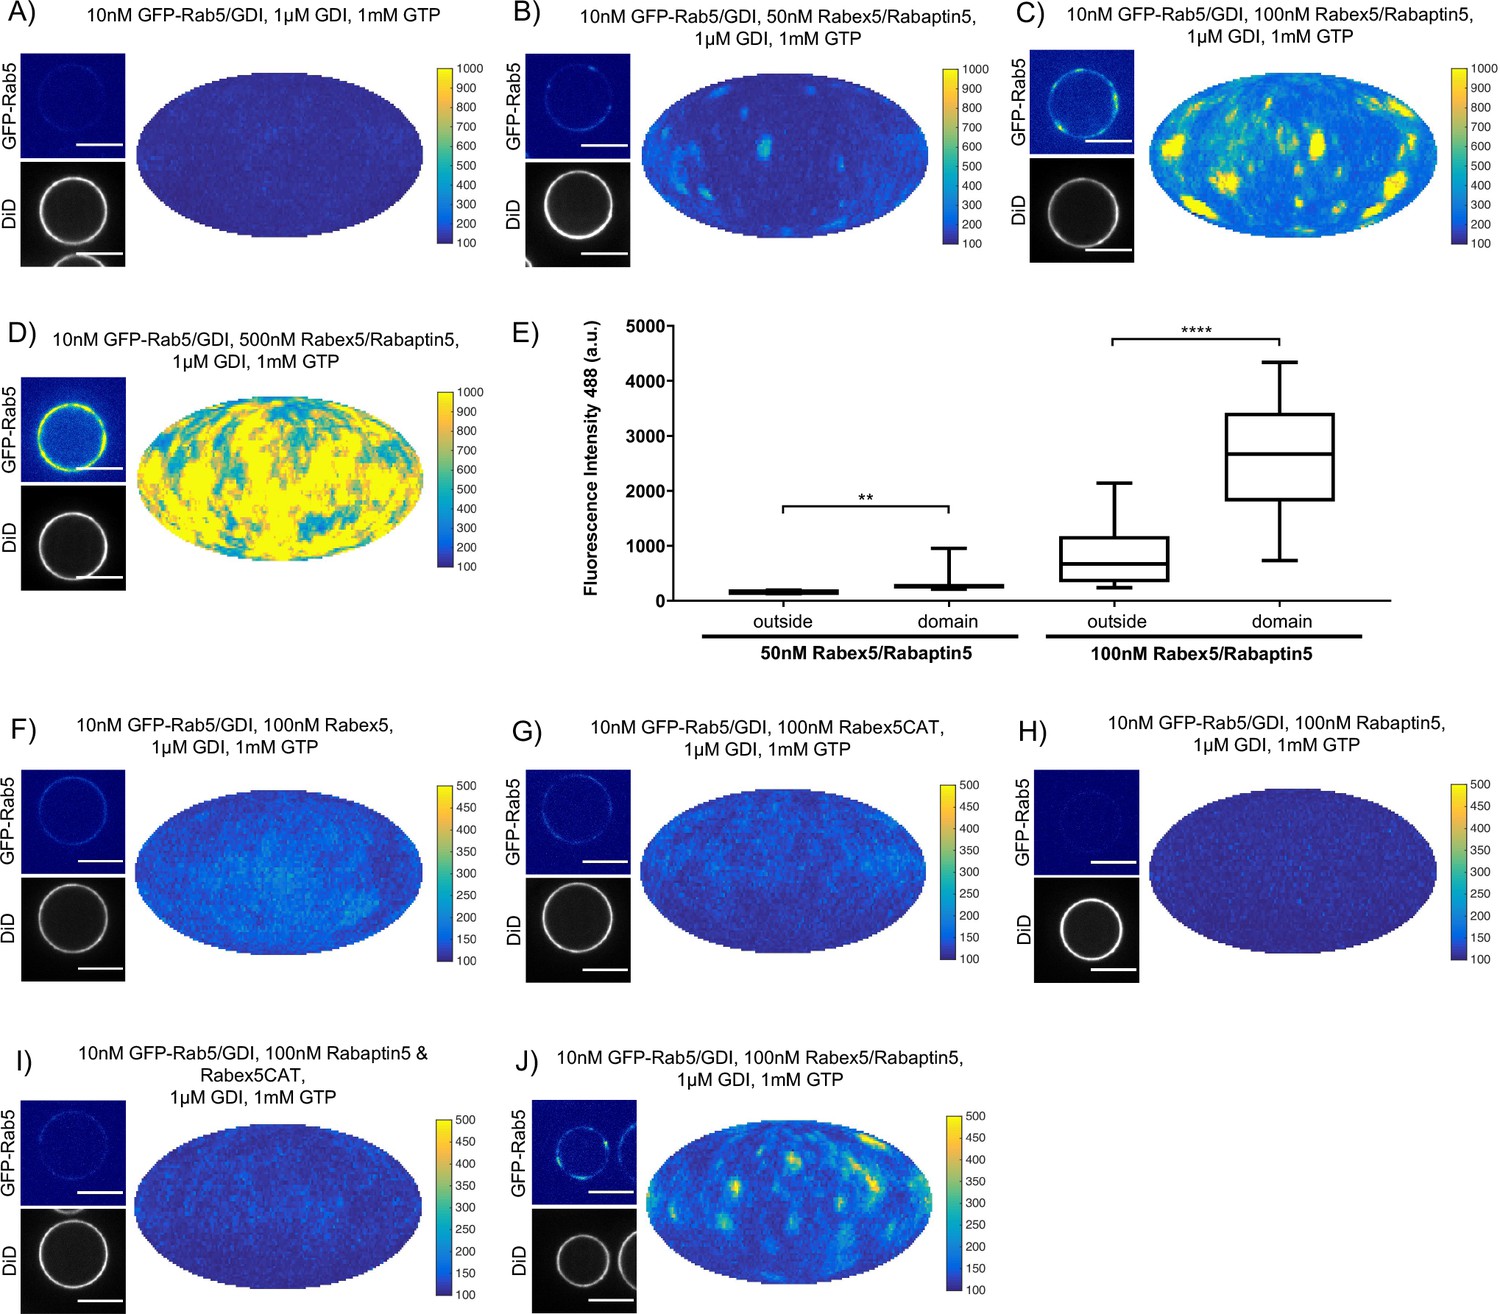
Rabex5/Rabaptin5 is essential for Rab5 domain formation in vitro.
(A - E) Domain formation is dependent on concentration of Rabex5/Rabaptin5. EE MCBs were incubated for 15 min at 23 °C with 10 nM GFP-Rab5/GDI, 1 μM GDI, 1 mM GTP and 0 nM (A), 50 nM (B), 100 nM (C), or 500 nM (D) Rabex5/Rabaptin5-RFP. (E) Mean GFP-Rab5 signal intensity outside of and within segmented domains as a function of Rabex5/Rabaptin5 concentration (50 nM Rabex5/Rabaptin5 p=0.001, n = 95; 100 nM Rabex5/Rabaptin5 p=<0.0001) See also Table 3) (F – J) Rabex5/Rabaptin5 cannot be split into component parts and still form domains. EE MCBs were incubated for 15 min at 23 °C with 10 nM GFP-Rab5/GDI, 1 μM GDI, 1 mM GTP and 100 nM Rabex (F), 100 nM RabexCAT (G), 100 nM Rabaptin5 (H), 100 nM Rabex5CAT and Rabaptin5 (I), or 100 nM Rabex5/Rabaptin5 (J). Beads are presented as equatorial slices in GFP and DiD channels (left) and a Mollweide projection of the GFP channel (right). Scale Bar = 10 µm.
Figure 3—figure supplement 1
Rabex5/Rabaptin5 is essential for Rab5 domain formation in vitro.
(A - E) Domain formation is dependent on concentration of Rabex5/Rabaptin5. EE MCBs were incubated for 15 min at 23 °C with 10 nM GFP-Rab5/GDI, 1 μM GDI, 1 mM GTP and 0 nM (A), 50 nM (B), 100 nM (C) and E); (E) MCB shown for GFP/RFP colocalization in Figure 3F), or 500 nM (D) Rabex5/Rabaptin5-RFP. (F) Mean equatorial RFP intensity of MCBs of different lipid compositions (See Table 1) incubated for 15 min at 23 °C with 100 nM Rabex5/Rabaptin5-RFP. (p=<0.0001) (G–K) Rabex5/Rabaptin5 cannot be split into component parts and still form domains. EE MCBs were incubated for 15 min at 23 °C with 10 nM GFP-Rab5/GDI, 1 μM GDI, 1 mM GTP and 100 nM Rabex (G), 100 nM RabexCAT (H), 100 nM Rabaptin5 (I), 100 nM Rabaptin5 and Rabex5CAT (J), or 100 nM Rabex5/Rabaptin5 (K). Beads are presented as equatorial slices in GFP and DiD channels (left) and Mollweide projection of the DiD channel (right). Scale Bar = 10 µm.
Figure 4

Rabex5/Rabaptin5 localises to the reconstituted Rab5 domain.
EE MCBs were incubated for 15 min at 23 °C with 10 nM GFP-Rab5/GDI, 1 μM GDI, 1 mM GTP and 50 nM or 100 nM Rabex5/Rabaptin5-RFP (See Figure 3A–E). (A) Rabaptin5-RFP signal is enriched in domains. (50 nM Rabaex5/Rabaptin5 p=0.001, n = 96; 100 nM Rabex5/Rabaptin5 p=0.0017, n = 90). Corresponding GFP enrichment in presented in Figure 3E. (B) Equatorial slices and mollweide representations of GFP signal (top), RFP signal (bottom) and pixelwise GFP-RFP colocalization (bottom). Beads are presented as equatorial slices (left) and Mollweide projections (right). Scale Bar = 10 µm.
Figure 5 with 1 supplement
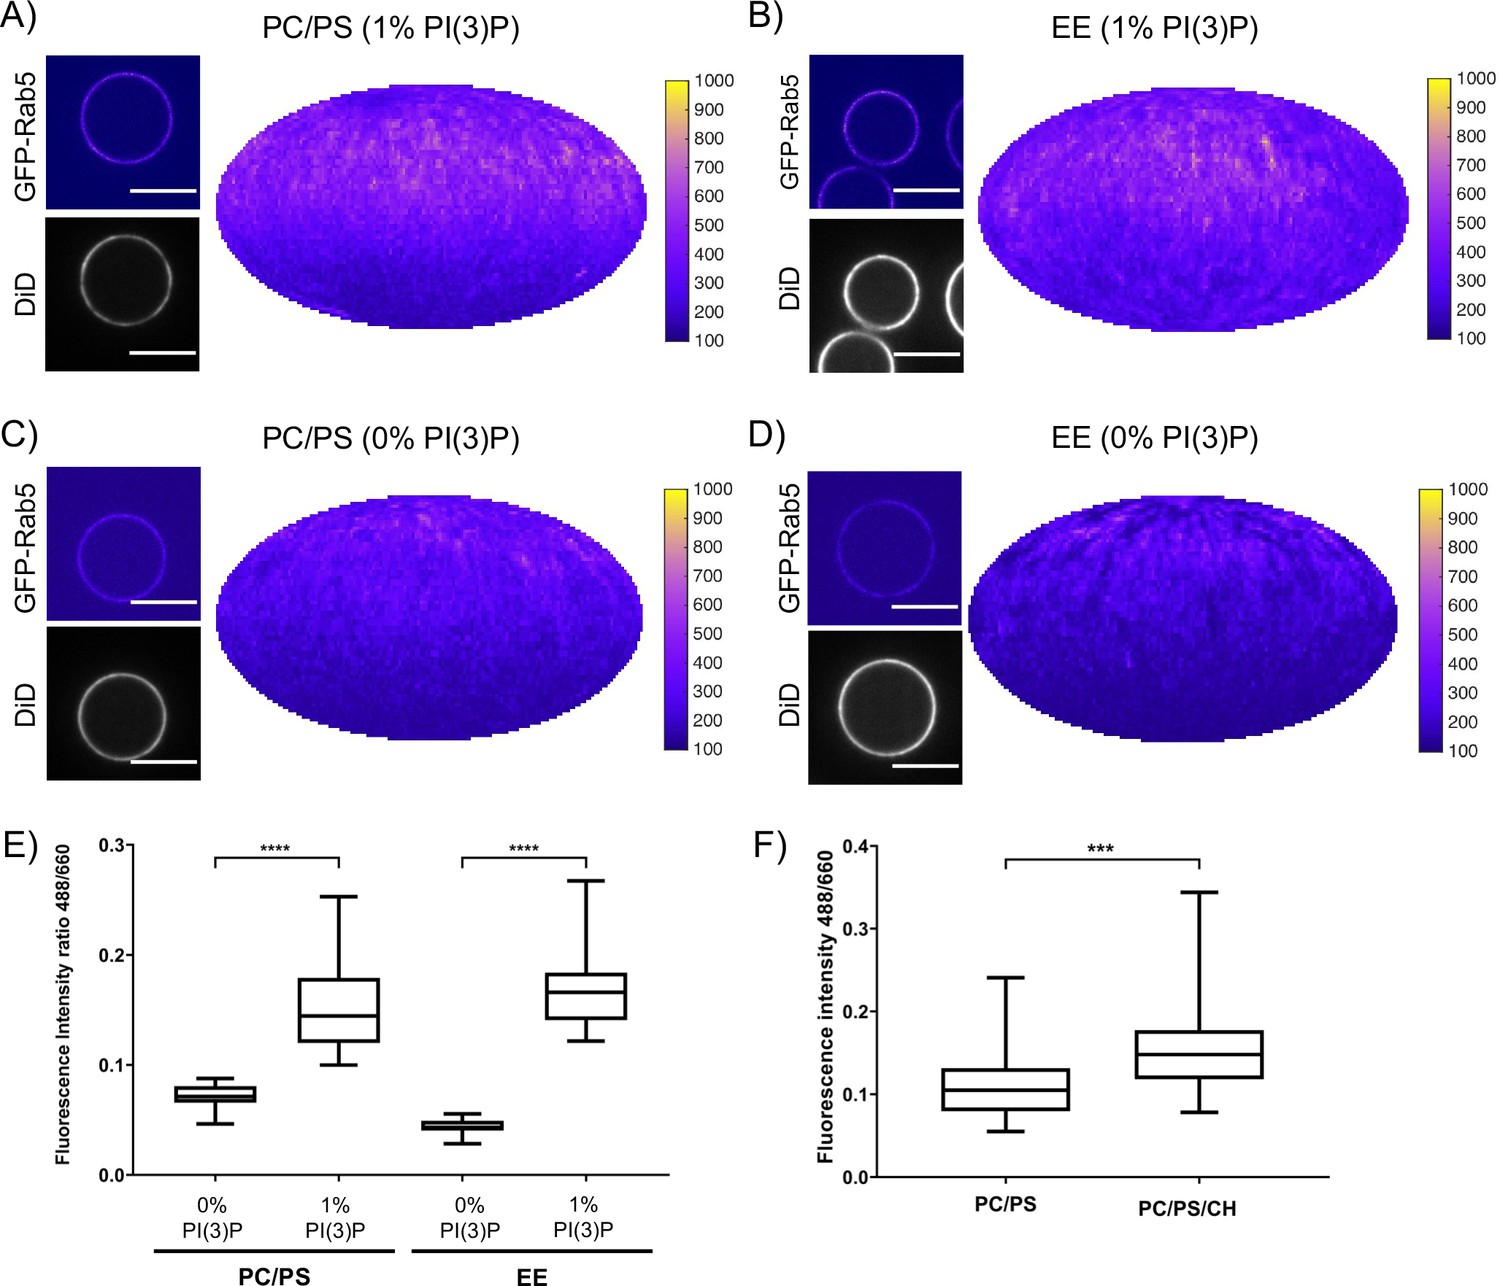
Recruitment of geranylgeranylated GFP-Rab5 to EE and PC/PS bilayers is enhanced by PI(3)P.
MCBs with PC/PS and EE lipid composition containing 1 mol% PI(3)P (A) and B) respectively) and MCBs with PC/PS and EE lipid composition containing 0 mol% PI(3)P (C) and D) respectively) were incubated with 10 nM GFP-Rab5/GDI for 15 min at 23 °C. Beads are presented as equatorial slices in GFP and DiD channels (left) and Mollweide projection of the GFP channel (right). Scale Bar = 10 µm. (E) Mean equatorial GFP signal intensity in A–D). (p=<0.0001; n = 20) (F) MCBs with PC/PS and PC/PS/CH lipid composition (0 mol% PI(3)P) incubated with 10 nM GFP-Rab5/GDI for 15 min at 23 °C. Graph presents mean equatorial GFP signal intensity (p=0.005; n = 25). For both E) and F) GFP signal intensity is normalized to DiD signal intensity, however the same pattern can be seen in the raw intensity values.
Figure 5—figure supplement 1
Recruitment of geranygeranylated GFP-Rab5 to EE and PC/PS bilayers is enhanced by PI(3)P.
MCBs with PC/PS and EE lipid composition containing 1 mol% PI(3)P (A) and B) respectively) and MCBs with PC/PS and EE lipid composition containing 0 mol% PI(3)P (C) and D) respectively) were incubated with 10 nM GFP-Rab5/GDI for 15 min at 23 °C. Beads are presented as equatorial slices in GFP and DiD channels (left) and Mollweide projection of the DiD channel (right). Scale Bar = 10 µm.
Figure 6 with 1 supplement
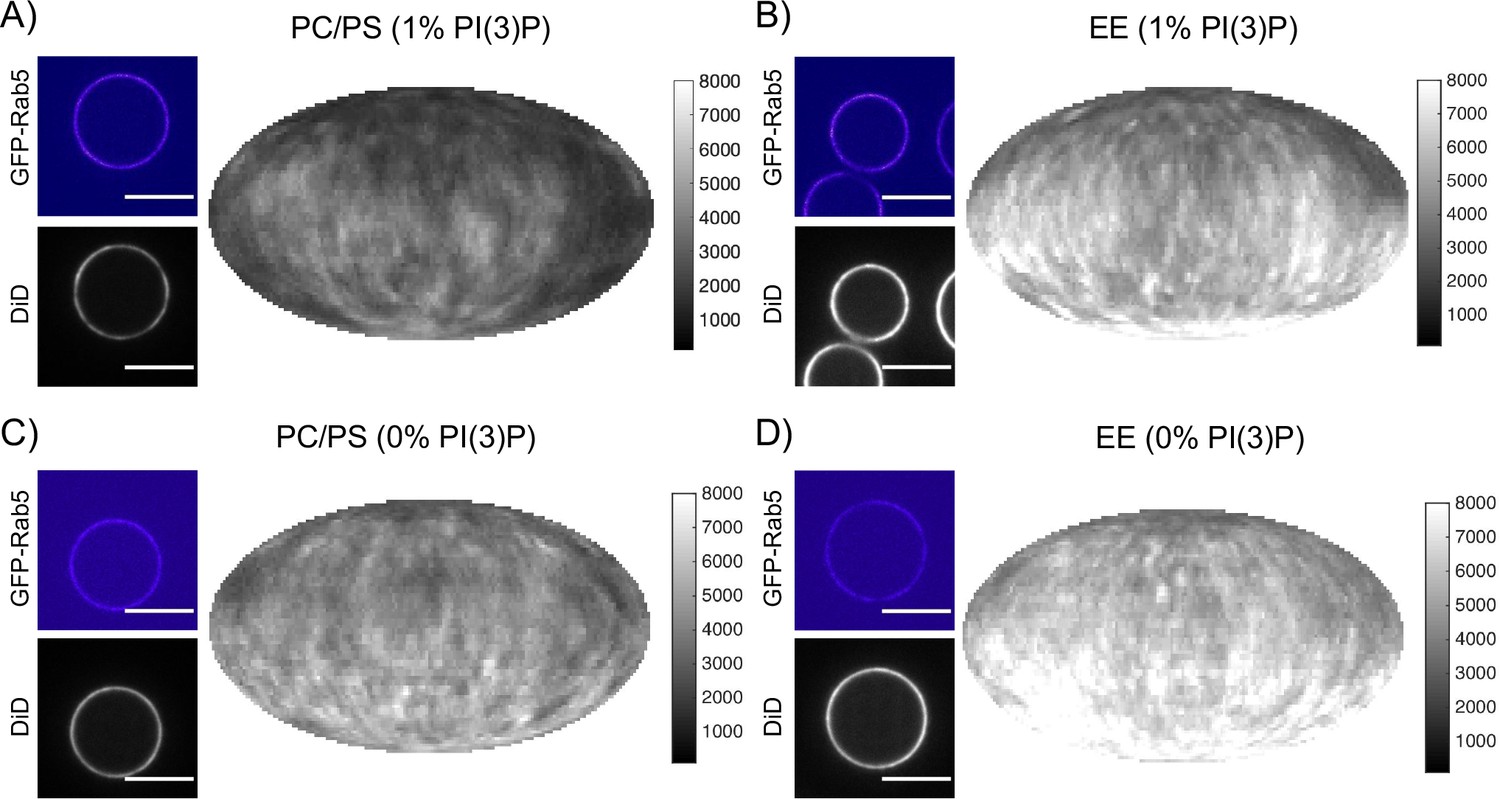
Rab5 domain formation in vitro is influenced by membrane composition.
MCBs with PC/PS and EE lipid composition containing 1 mol% PI(3)P (A) and B) respectively) and MCBs with PC/PS and EE lipid composition containing 0 mol% PI(3)P (C) and D) respectively) were incubated with 10 nM GFP-Rab5/GDI, 1 μM GDI, 100 nM Rabex5/Rabaptin5-RFP and 1 mM GTP for 15 min at 23 °C. Beads are presented as equatorial slices in GFP and DiD channels (left) and Mollweide projection of the GFP channel (right). Scale Bar = 10 µm. (E) Mean GFP-Rab5 signal intensity outside of and within segmented domains in B) and D) (p=<0.0001) (See also Table 2). (F) Mean GFP-Rab5 signal intensity outside of and within segmented domains on MCBs with PC/PS/CH/PlasmPE and PC/PS/CH/SM lipid composition containing 1 mol% PI(3)P (p=<0.0046) (See also Table 5).
Figure 6—figure supplement 1

Rab5 domain formation in vitro is influenced by membrane composition.
MCBs with PC/PS and EE lipid composition containing 1 mol% PI(3)P (A) and B) respectively) and MCBs with PC/PS and EE lipid composition containing 0 mol% PI(3)P (C) and D) respectively) were incubated with 10 nM GFP-Rab5/GDI, 1 μM GDI, 100 nM Rabex5/Rabaptin5-RFP and 1 mM GTP for 15 min at 23 °C. Beads are presented as equatorial slices in GFP and DiD channels (left) and Mollweide projection of the DiD channel (right). Scale Bar = 10 µm.
Tables
Table 1
Lipid compositions used in this study.
| EE-MCB (mol%) | PC/PS/CH/PI(3)P/SM-MCB (mol%) | PC/PS/CH/PI(3)P/PlasmPE-MCB (mol%) | PC/PS/CH-MCB (mol%) | PC/PS-MCB (mol%) | |
|---|---|---|---|---|---|
| Cholesterol | 32.2 | 32.2 | 32.2 | 32.2 | - |
| DOPC | 16.6/15.6 | 39.1 | 38.8 | 51.7 | 84.9/83.9 |
| Ethanolamine plasmalogen | 12.9 | - | 12.9 | - | - |
| Sphingomyelin | 12.6 | 12.6 | - | - | - |
| GM3 | 9 | - | - | - | - |
| DOPS | 6.1 | 15 | 15 | 15 | 15 |
| DOPE | 6.8 | - | - | - | - |
| Choline plasmalogen | 3.6 | - | - | - | - |
| PI(3)P | 0/1 | 1 | 1 | 0/1 | 0/1 |
| DiD | 0.1 | 0.1 | 0.1 | 0.1 | 0.1 |
Table 2
Rab5 domains can be reconstituted in vitro.
EE MCBs were incubated for 15 min at 23 °C with 10 nM GFP-Rab5/GDI and supplemented with 1 μM GDI, 100 nM Rabex5/Rabaptin5-RFP and 1 mM GDP or GTP.
| 10 nM GFP-Rab5/GDI | 10 nM GFP-Rab5/GDI, 100 nM Rabex5/Rabaptin5, 1 µM GDI, 1 mM GDP | 10 nM GFP-Rab5/GDI, 100 nM Rabex5/Rabaptin5, 1 µM GDI, 1 mM GTP | |
|---|---|---|---|
| # Domains | 0 | 0 | 449 |
| # Beads | 30 | 44 | 96 |
| Mean # Domains/Bead | 0 | 0 | 4.7 |
| Mean intensity/Bead (a.u.) | 212.31 ± 67.04 | 128.40 ± 4.91 | 447.96 ± 403.41 |
| Mean Standard Deviation/Bead | 46.70 ± 21.26 | 0.36 ± 0.04 | 237.24 ± 225.54 |
| Mean Intensity/Domain | - | - | 1326.95 ± 1026.96 |
| Mean Intensity/Outside | 212.31 ± 67.04 | 128.40 ± 4.91 | 454.63 ± 364.79 |
| Mean domain area, µm2 | - | - | 1.74 |
| Mean domain diameter, µm | - | - | 1.32 |
-
Table 2—source data 1
Rab5 domains can be reconstituted in vitro.
- https://cdn.elifesciences.org/articles/54434/elife-54434-table2-data1-v1.xlsx
Table 3
Domain formation is dependent on concentration of Rabex5/Rabaptin5.
EE MCBs were incubated for 15 min at 23 °C with 10 nM GFP-Rab5/GDI, 1 μM GDI, 1 mM GTP and 0 nM, 50 nM, 100 nM Rabex5/Rabaptin5-RFP. Beads incubated with 10 nM GFP-Rab5/GDI, 1 μM GDI, 1 mM GTP and 500 nM Rabex5/Rabaptin5-RFP could not be properly segmented due to the high GFP-Rab5 signal on the bead (See Figure 3D).
| 10 nM GFP-Rab5/GDI, 1 µM GDI, 1 mM GTP | 10 nM GFP-Rab5/GDI, 50 nM Rabex5/Rabaptin5, 1 µM GDI, 1 mM GTP | 10 nM GFP-Rab5/GDI, 100 nM Rabex5/Rabaptin5, 1 µM GDI, 1 mM GTP | |
|---|---|---|---|
| # Domains | 0 | 96 | 90 |
| # Beads | 17 | 23 | 16 |
| Mean # Domains/Bead | 0 | 4.17 | 5.63 |
| Mean intensity/Bead (a.u.) | 132.95 ± 6.23 | 164.66 ± 24.13 | 946.76 ± 669.27 |
| Mean Standard Deviation/Bead | 13.14 ± 2.68 | 41.63 ± 17.87 | 526.77 ± 332.23 |
| Mean Intensity/Domain | - | 282.58 ± 96.68 | 2767.14 ± 1039.34 |
| Mean Intensity/Outside | 132.95 ± 6.23 | 159.56 ± 18.33 | 856.22 ± 573.11 |
| Mean domain area, µm2 | - | 1.71 | 1.97 |
| Mean domain diameter, µm | - | 1.31 | 1.40 |
-
Table 3—source data 1
Domain formation is dependent on concentration of Rabex5/Rabaptin5.
- https://cdn.elifesciences.org/articles/54434/elife-54434-table3-data1-v1.xlsx
Table 4
Rab5 domain formation in vitro is influenced by membrane composition.
MCBs with EE and PC/PS lipid composition containing 1 mol% PI(3)P and MCBs with EE and PC/PS lipid composition containing 0 mol% PI(3)P were incubated with 10 nM GFP-Rab5/GDI, 1 μM GDI, 100 nM Rabex5/Rabaptin5-RFP and 1 mM GTP for 15 min at 23 °C.
| PC/PS (0% PI(3)P) | PC/PS (1% PI(3)P) | EE (0% PI(3)P) | EE (1% PI(3)P) | |
|---|---|---|---|---|
| # Domains | 0 | 0 | 13 | 164 |
| # Beads | 33 | 38 | 24 | 40 |
| Mean # Domains/Bead | 0 | 0 | 0.54 | 4.1 |
| Mean intensity/Bead (a.u.) | 135.48 ± 14.69 | 129.54 ± 11.79 | 140.88 ± 39.73 | 429.23 ± 217.66 |
| Mean Standard Deviation/Bead | 16.69 ± 8.60 | 13.23 ± 6.02 | 26.05 ± 25.50 | 245.40 ± 120.62 |
| Mean Intensity/Domain | - | - | 508.32 ± 143.37 | 1269.32 ± 556.54 |
| Mean Intensity/Outside | 135.48 ± 14.69 | 129.54 ± 11.79 | 138.59 ± 32.05 | 393.35 ± 194.66 |
| Mean domain area, µm2 | - | - | 2.12 | 1.42 |
| Mean domain diameter, µm | - | - | 1.46 | 1.19 |
-
Table 4—source data 1
Rab5 domain formation in vitro is influenced by membrane composition.
- https://cdn.elifesciences.org/articles/54434/elife-54434-table4-data1-v1.xlsx
Table 5
Acyl chain ordering influences Rab5 domain formation.
MCBs with EE, PC/PS, PC/PS/CH, PC/PS/CH/PlasmPE and PC/PS/CH/SM lipid composition, each containing 1 mol% PI(3)P, were incubated with 10 nM GFP-Rab5/GDI, 1 μM GDI, 100 nM Rabex5/Rabaptin5-RFP and 1 mM GTP for 15 min at 23 °C.
| PC/PS (1% PI(3)P) | PC/PS/CH (1% PI(3)P) | PC/PS/CH/PlasmPE (1% PI(3)P) | PC/PS/CH/SM (1% PI(3)P) | EE (1% PI(3)P) | |
|---|---|---|---|---|---|
| # Domains | 0 | 80 | 78 | 87 | 163 |
| # Beads | 18 | 30 | 21 | 25 | 32 |
| Mean # Domains/Bead | 0 | 2.67 | 3.71 | 3.48 | 5.09 |
| Mean intensity/Bead (a.u.) | 144.70±20.92 | 171.03±64.72 | 181.34±79.51 | 301.41±175.91 | 525.67±181.34 |
| Mean Standard Deviation/Bead | 18.88±8.45 | 44.18±41.94 | 50.59±35.40 | 146.88±89.56 | 189.43±63.05 |
| Mean Intensity/Domain | - | 303.44±129.53 | 381.67±178.58 | 743.88±400.00 | 830.66±323.40 |
| Mean Intensity/Outside | 144.70±20.92 | 163.96±53.54 | 139.62±111.45 | 265.97±170.82 | 512.97±181.20 |
| Mean domain area, µm2 | - | 2.45 | 2.26 | 2.09 | 2.52 |
| Mean domain diameter, µm | - | 1.57 | 1.50 | 1.45 | 1.59 |
-
Table 5—source data 1
Acyl chain ordering influences Rab5 domain formation.
- https://cdn.elifesciences.org/articles/54434/elife-54434-table5-data1-v1.xlsx
Key resources table
| Reagent type (species) or resource | Designation | Source or reference | Identifiers | Additional information |
|---|---|---|---|---|
| Recombinant DNA reagent | pOEM-1 N-His | Oxford Expression Technologies, MPI-CBG PEP facility | vector, NotI and AscI sites used for ligation | |
| Recombinant DNA reagent | pOEM-1 N-GST | Oxford Expression Technologies, MPI-CBG PEP facility | vector, NotI and AscI sites used for ligation | |
| Recombinant DNA reagent | pOEM-1 N-His-eGFP | Oxford Expression Technologies, MPI-CBG PEP facility | vector, NotI and AscI sites used for ligation | |
| Recombinant DNA reagent | pOEM-1 C-His-tagRFP | Oxford Expression Technologies, MPI-CBG PEP facility | vector, NotI and AscI sites used for ligation | |
| Transfected construct (Homo sapiens) | Rab5a | This paper | In vector pOEM-1 N-His-eGFP | |
| Transfected construct (Bos taurus) | Rabex5 (pOEM-1 N-His) | Lauer et al., 2019 | In vector pOEM-1 N-His | |
| Transfected construct (Bos taurus) | Rabex5CAT (pOEM-1 N-His) | Lauer et al., 2019 | In vector pOEM-1 N-His | |
| Transfected construct (Homo sapiens) | Rabaptin5 (pOEM-1 N-GST) | Lauer et al., 2019 | In vector pOEM-1 N-GST | |
| Transfected construct (Homo sapiens) | Rabaptin5-RFP-6xHis | This paper | pOEM-1 C-His-tagRFP | |
| Transfected construct (Homo sapiens) | GDIA (pOEM-1 N-His) | This paper | In vector pOEM-1 N-His | |
| Commercial assay or kit | Silica Beads (10 μm) | Corpuscular | C-SIO-10.0 | 10 μm standard microspheres for microscopy |
| Commercial assay or kit | Ni-NTA Agarose | Qiagen | ||
| Commercial assay or kit | Glutathione Sepharose 4B Resion | GE | ||
| Commercial assay or kit | BCA assay | Thermo Scientific | 23225 | |
| Other | GTP | Sigma | 10106399001 | |
| Other | Cholesterol (ovine wool) | Avanti | 700000 | |
| Other | 18:1 (Δ9-Cis) PC (DOPC) (1,2-dioleoyl-sn-glycero-3-phosphocholine) | Avanti | 850375 | |
| Other | C18(Plasm)−18:1 PC (1-(1Z-octadecenyl)−2-oleoyl-sn-glycero-3-phosphocholine) | Avanti | 852467 | |
| Other | Sphingomyelin (Egg, Chicken) | Avanti | 860061 | |
| Other | GM3 Ganglioside (Milk, Bovine-Ammonium Salt) | Avanti | 860058 | |
| Other | 18:1 PS (DOPS) (1,2-dioleoyl-sn-glycero-3-phospho-L-serine (sodium salt)) | Avanti | 840035 | |
| Other | 18:1 (Δ9-Cis) PE (DOPE) (1,2-dioleoyl-sn-glycero-3-phosphoethanolamine) | Avanti | 850725 | |
| Other | C18(Plasm)−18:1 PE (1-(1Z-octadecenyl)−2-oleoyl-sn-glycero-3-phosphoethanolamine) | Avanti | 852758 | |
| Other | Phosphatidylinositol 3-phosphate diC16 (PI(3)P diC16) | Echelon | P-3016 | |
| Other | DiD [DiIC18(5); 1,1’-dioctadecyl-3,3,3’,3’-tetramethylindodicar-bocyanine, 4-chlorobenzenesulfonate salt] | Thermo Fischer | D7757 |
Additional files
Download links
A two-part list of links to download the article, or parts of the article, in various formats.
Downloads (link to download the article as PDF)
Open citations (links to open the citations from this article in various online reference manager services)
Cite this article (links to download the citations from this article in formats compatible with various reference manager tools)
A non-linear system patterns Rab5 GTPase on the membrane
eLife 9:e54434.
https://doi.org/10.7554/eLife.54434


