Behavioral evidence for memory replay of video episodes in the macaque
- Shanghai Key Laboratory of Brain Functional Genomics, Key Laboratory of Brain Functional Genomics Ministry of Education, School of Psychology and Cognitive Science, East China Normal University, China
- Program of Brain and Cognitive Engineering, Korea Advanced Institute of Science and Technology, Republic of Korea
- Department of Bio and Brain Engineering, Korea Advanced Institute of Science and Technology, Republic of Korea
- Department of Computer Science, University of York, United Kingdom
- School of Psychology, Shenzhen University, China
- Shanghai Key Laboratory of Magnetic Resonance, East China Normal University, China
- NYU-ECNU Institute of Brain and Cognitive Science at NYU Shanghai, China
Figures
Figure 1 with 1 supplement
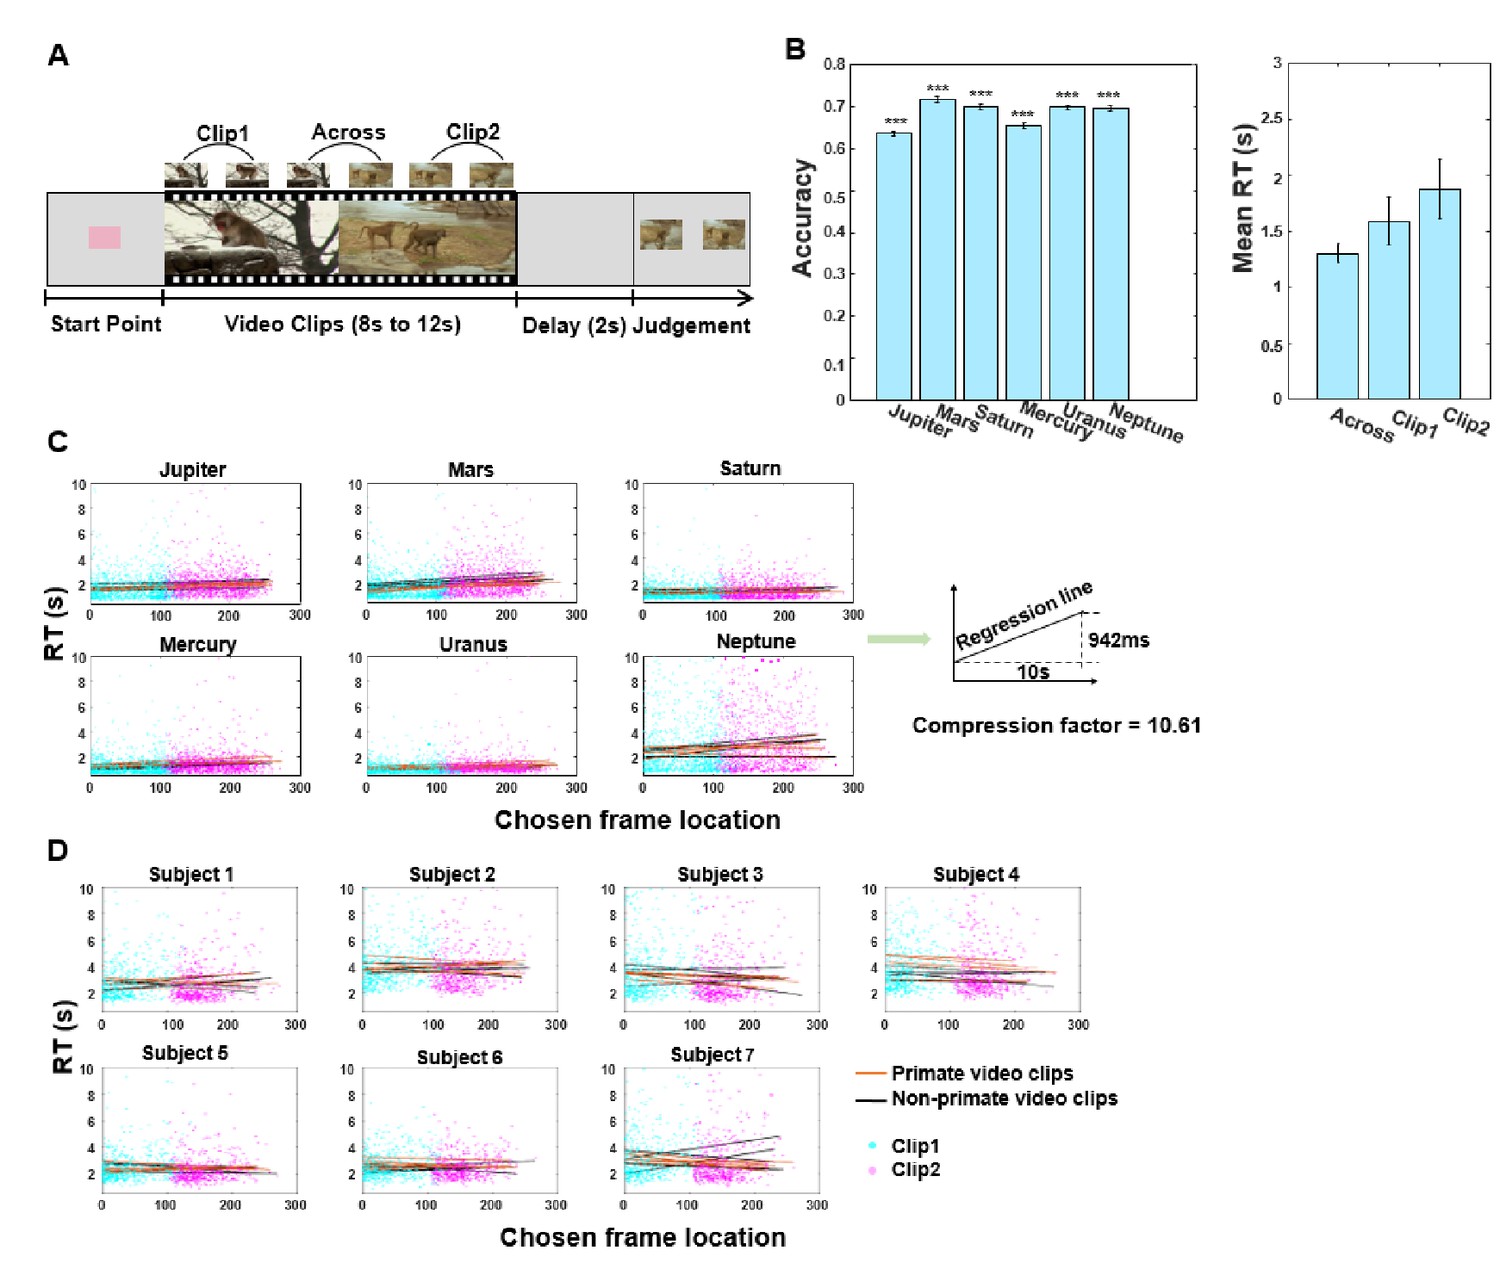
TOJ task schema and RT results.
(A) In each trial, the monkey watched a video (8–12 s, comprising two 4–6 s video clips), and following a 2 s retention delay, made temporal order judgement between two probe frames extracted from the video. The monkeys were required to choose the frame that was presented earlier in the video for water reward. (B) Task performance of six monkeys. Proportion correct for the six monkeys (left); mean reaction times for three trial types (right). Error bars are standard errors of the means over monkeys. *** denotes p<0.001. (C) Linear plots of reaction time (RT) for each monkey as a function of chosen frame location, see also Table 1. (D) Linear plots of RT as a function of chosen frame location for each human participant, see also Supplementary file 4. In panels (C) and (D), black lines and orange lines refer to lists of non-primate video clips and primate video clips, respectively (with five repetitions collapsed for monkeys and two repetitions collapsed for human participants). All responses in the within-context condition are shown, with cyan and magenta dots denoting whether the chosen probe frames were extracted from Clip 1 or Clip 2, respectively.
Figure 1—figure supplement 1
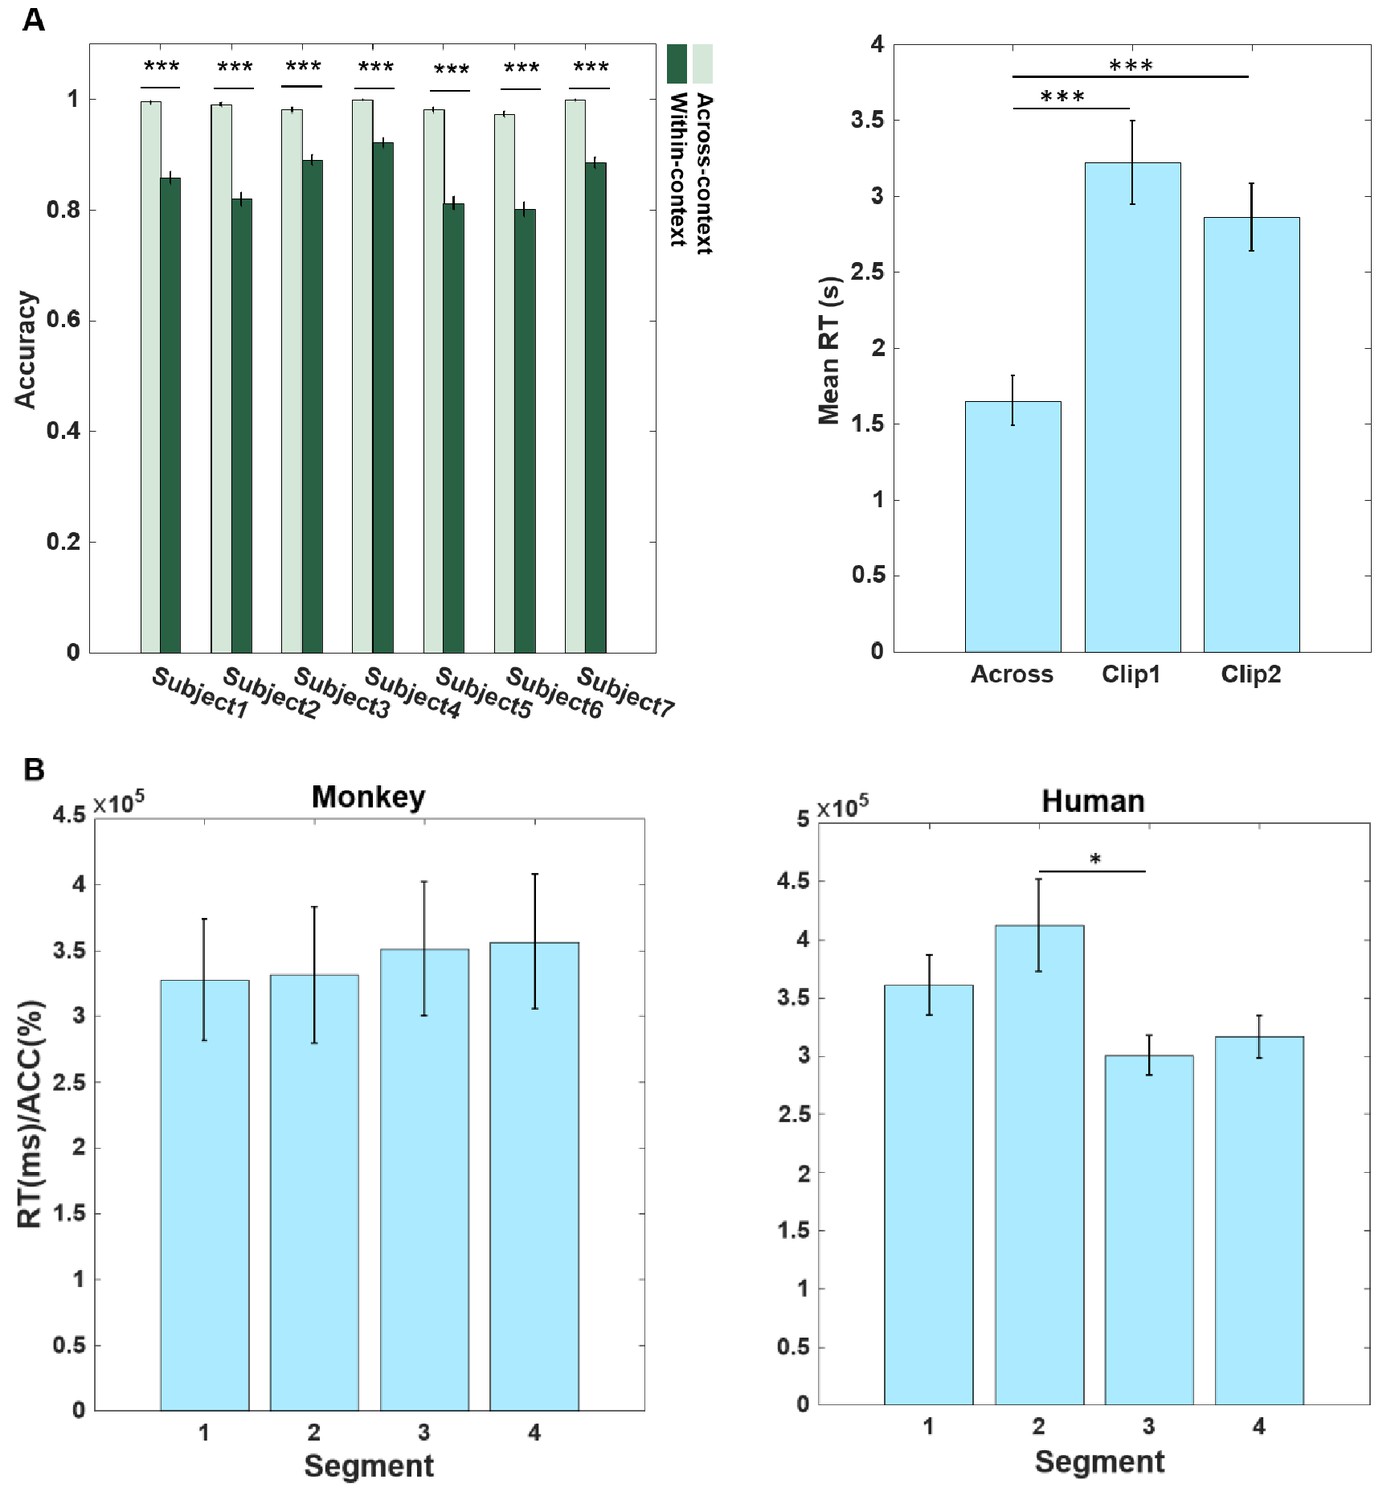
Performance of human participants and speed accuracy trade off results.
(A) (Left) Task performance of seven human participants. The proportions of correct responses for the across-context condition are significantly higher than those for the within-context condition (all p<0.001). (Right) Mean reaction times for the three trial types differ from each other, across- vs. within-Clip1 vs. within-Clip2: F (2, 18) = 18.65, p<0.001, and RT is significantly faster in the across-context condition than in the within-context conditions (Clip 1 and Clip 2). Error bars are standard errors of the means over participants. *** denotes p<0.001. (B) Speed accuracy trade-off analysis. The monkeys showed a mild numeral increase trend in inverse efficiency score across the four segments but this did not reach statistical significance (left); the humans show a lower inverse efficiency score for the video parts right after a boundary (F (3, 24) = 4.17, p=0.016), with post hoc tests showing significant difference between bars 2 and 3 (right).
Figure 2 with 1 supplement
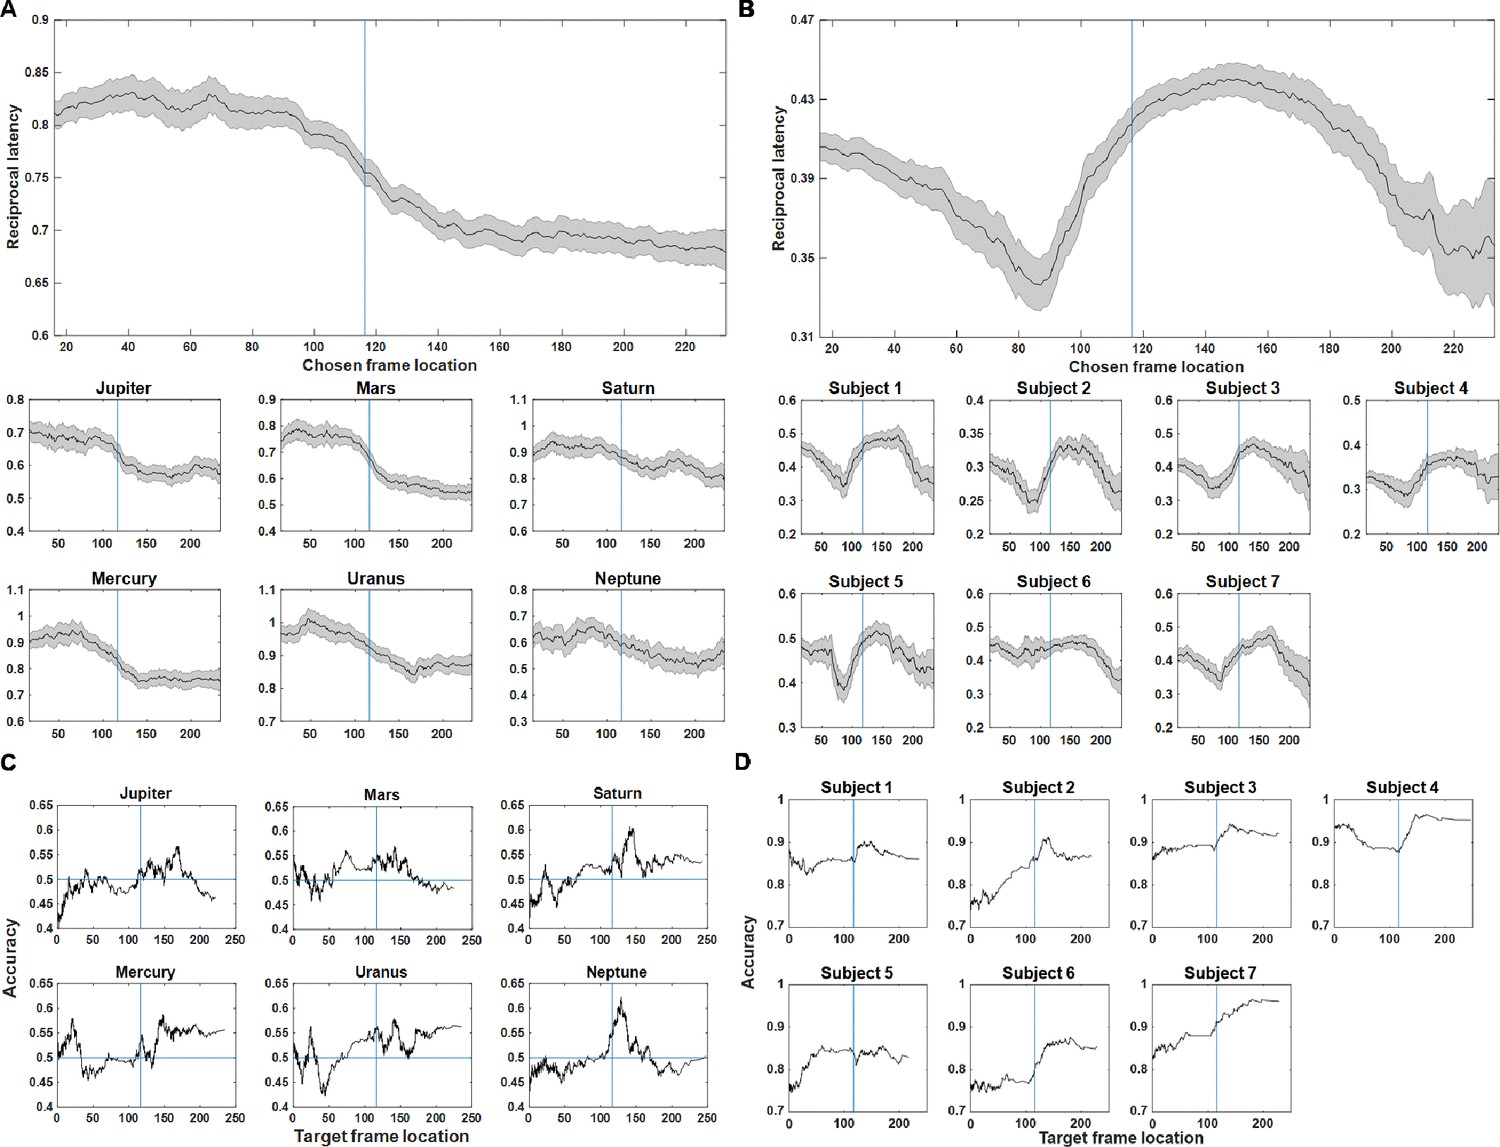
Moving average analysis based on reciprocal latency and accuracy for monkeys (left panel) and human participants (right panel).
(A) Reciprocal latency for monkeys as a function of chosen frame location for the average of all animals (upper panel) in the within-context condition, with the results for six individual monkeys are shown in the lower panel. The relationship between chosen frame location and RT follows a non-linear pattern. (B) Reciprocal latency for human participants as a function of chosen frame location for the average of all human subjects (upper panel) in the within-context condition, with results for individual subjects are shown in the lower panel. In panels (A) and (B), the shaded region denotes confidence intervals. (C) Proportion of correct answers for individual monkeys as a function of target frame location in the within-context condition. (D) Proportion of correct answers for individual human subjects as a function of target frame location in the within-context condition. In panels (C) and (D), the horizontal blue lines denote chance-level accuracy. Blue vertical lines in these plots denote the mean boundary location between Clip 1 and Clip 2 (116th frame).
Figure 2—figure supplement 1
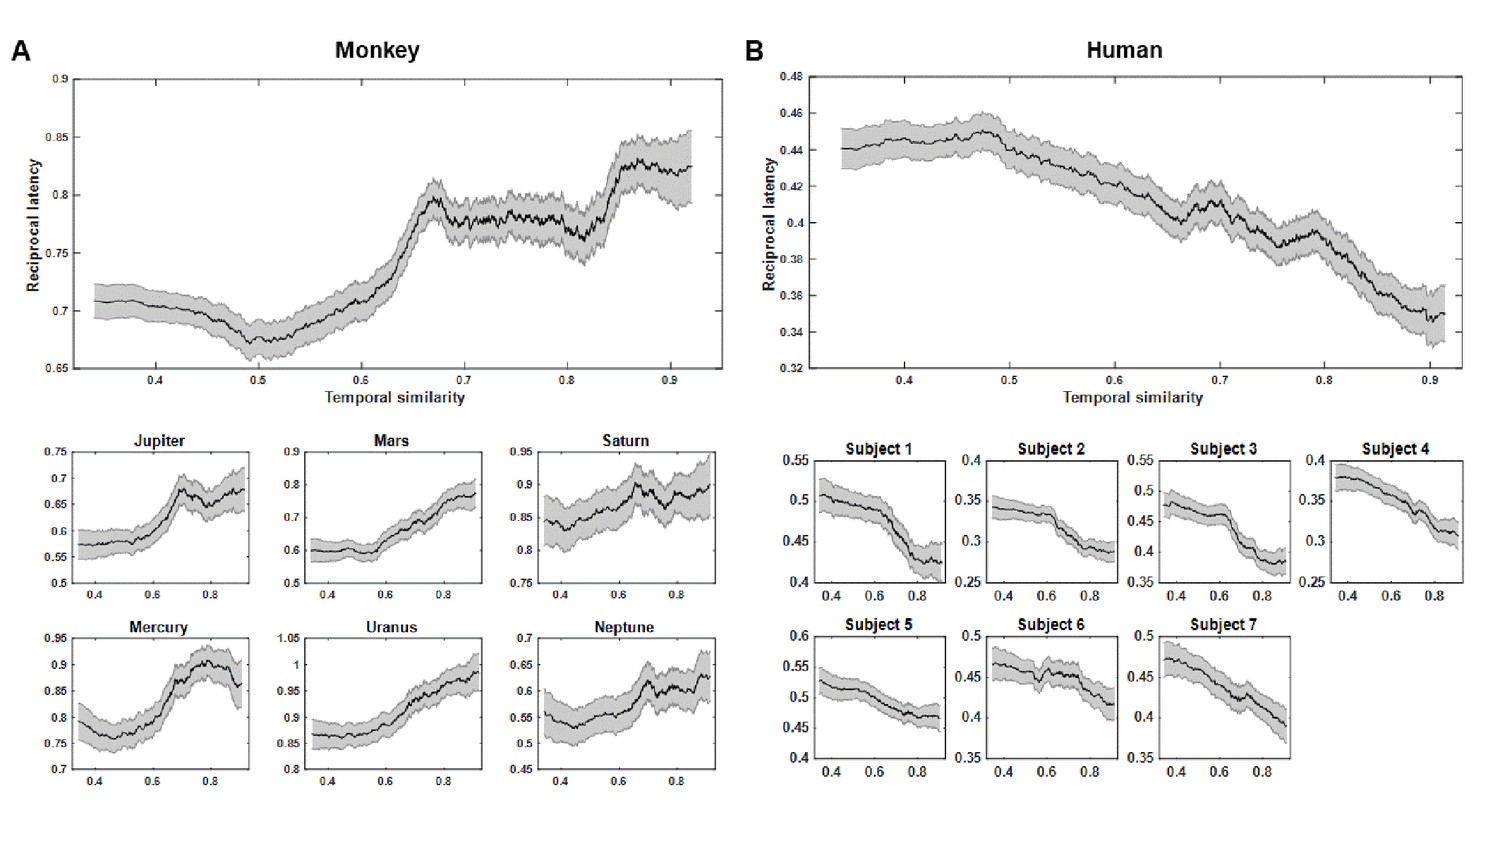
Relationship between temporal similarity and reciprocal latency for within-context trials in (A) monkeys and (B) humans.
Reciprocal latency as a function of temporal similarity for the average of all individuals (upper panel) and for each individual (bottom panel). The temporal similarity between two frames is mathematically the inverse of their respective frame locations in the video.
Figure 3
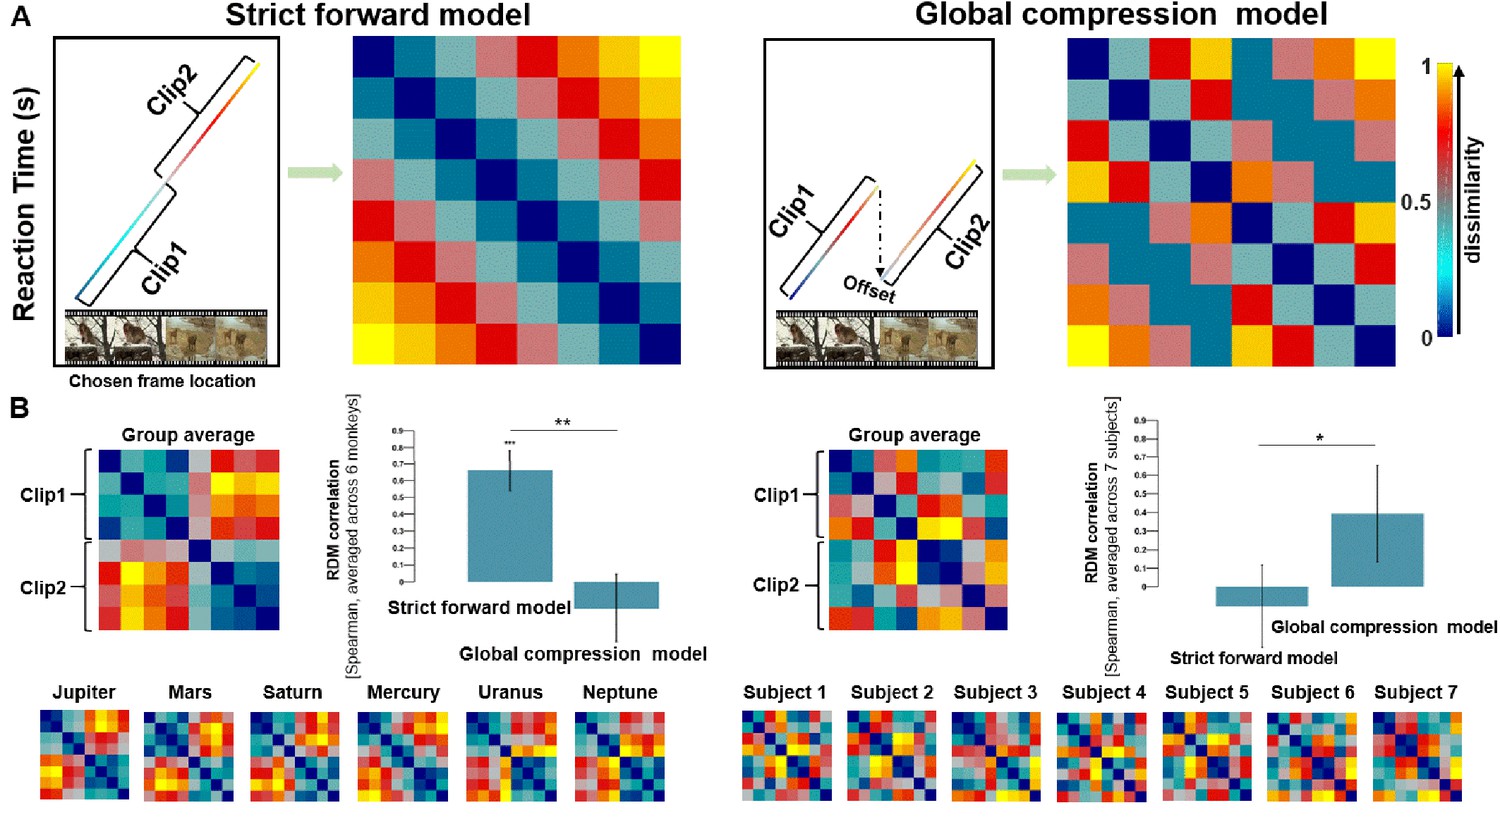
Model comparison using representative similarity analysis.
(A) Visualization of two candidate models as representational dissimilarity matrices (RDMs). Patterns of reaction time (rank-transformed values) as a function of chosen frame location for the the two hypothetical models. The colors of Clip 1 and Clip 2 evolve increasingly with the temporal progression of the video (left), and their respective hypothetical RDMs (right). The reduction in RT (indicated by an arrow) between Clip 1 and Clip 2 is defined as ‘offset’; the magnitude of such an ‘offset’ is arbitrary (but see further analysis in Figure 4). (B) We segmented the videos into eight equal segments, and the RDMs show pairwise Euclidean distances between these different segments for the species group average (monkeys: left; humans: right) and for each individual separately (monkeys: left bottom; humans: right bottom). RDM correlation tests between behavioral RDMs and two candidate RDMs show that the monkeys replay the footage using a Strict forward strategy (r = 0.66, p=0.009), and provide little evidence for the Global compression strategy (r = −0.16, p=0.802). Humans show an opposite pattern from the macaques. In the humans, the Global compression model shows a higher correlation with behavioral RDM (marginally insignificant r = 0.39, p=0.069) than with the Strict forward model (r = −0.11, p=0.703). Pairwise comparisons show that the two models are both statistically significant for monkeys (p<0.01) and humans (p<0.05). Error bars indicate the standard errors of the means based on 100 iterations of randomization. P values are FDR-corrected (***, p<0.001, **, p<0.01, *, p<0.05).
Figure 4
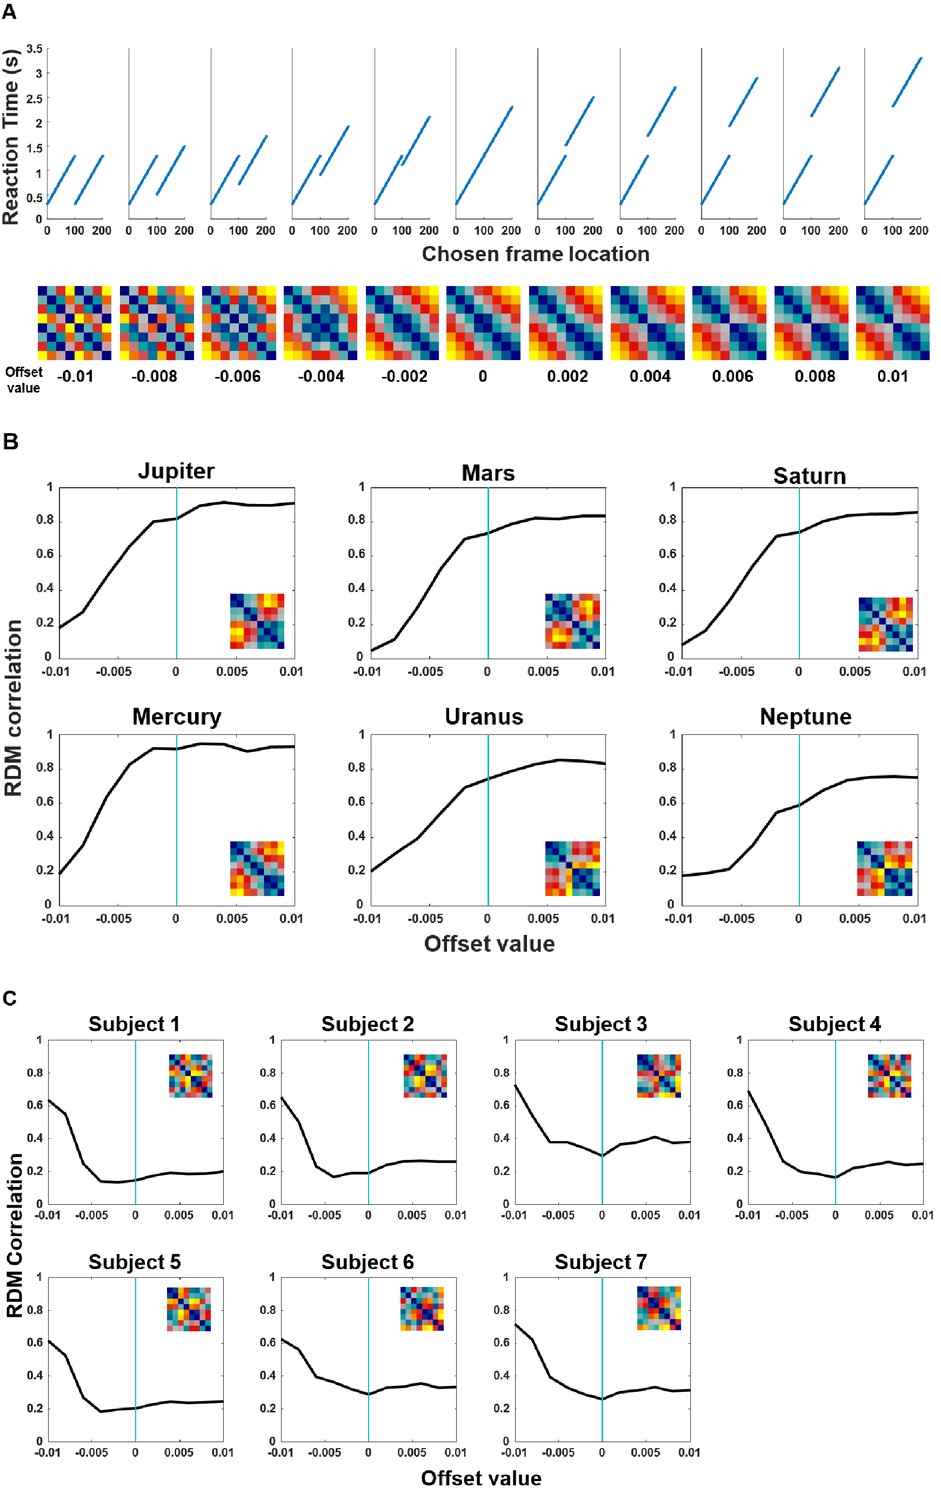
The Strict forward model provides a better fit to the RT data in monkeys but not in humans.
(A) ‘Offsets’ are defined as the magnitude of reduced RT when the frames were in Clip 2. 11 hypothetical models with their reaction time patterns (top) and RDMs (bottom). We systemically varied the ‘offset’ parameter while keeping a constant slope. These models progressively range from an absolute Global compression model (model 1, most left) to a Strict-forward model (model 6, middle), and beyond (7th to 11th models, right). The numerals below the RDMs denote the magnitude of the respective offsets. (B) Each monkey’s data were tested against each of these 11 hypothetical models. The Spearman correlations increase as a function of offset magnitude between Clip 1 and Clip 2 until reaching an asymptote when the offset value is around zero, which corresponds to the Strict forward model (model 6 in panel (A); see also Figure 3). Individuals’ RT RDMs are shown in insets. (C) Each human participant’s data were also tested against each of these 11 hypothetical models. The Spearman correlations decrease as a function of offset magnitude between Clip 1 and Clip 2 until reaching an asymptote when the offset value is around zero. This analysis confirms the hypothetical discrepancy between the two species (see also Figure 3B).
Figure 5
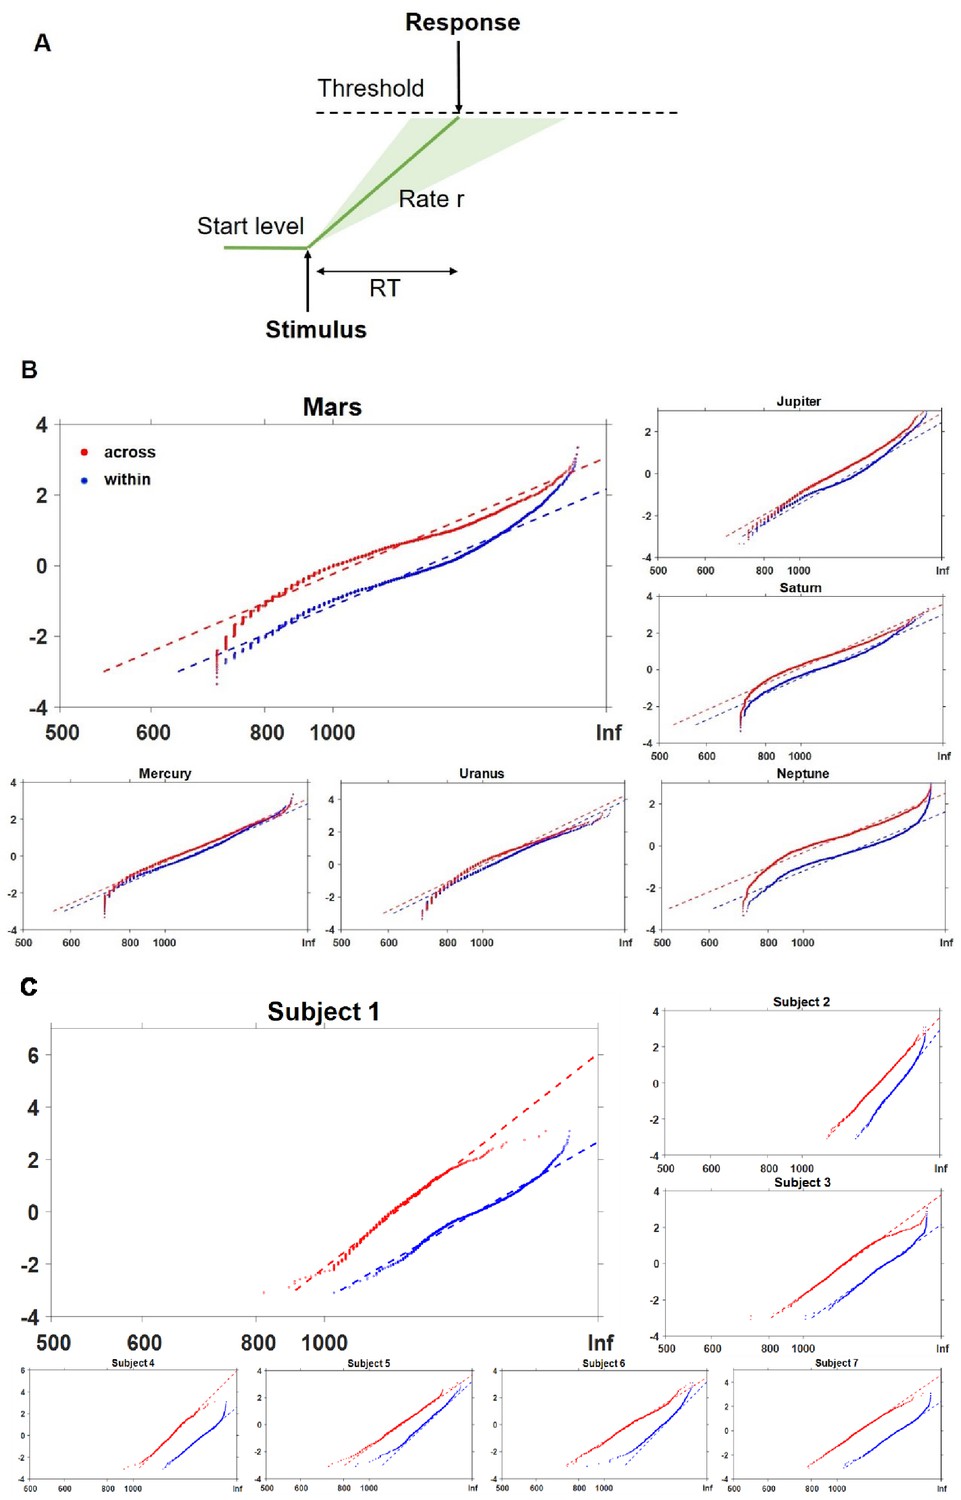
LATER model fitting of RT in across-context and within-context conditions for both species.
(A) Cartoon of the LATER model cartoon illustrating that a decision signal triggered by a stimulus rises from its start level, at a rate of information accumulation r, to the threshold. Once it reaches the threshold, a decision is initiated. The rate of rise r varies from trial to trial, obeying the Gaussian distribution (variation denoted as green shaded area). (B) Contextual change effect on the distribution of response latency for the monkeys; data from Monkey ‘Mars’ was chosen for larger display. (C) Contextual change effect on the distribution of response latency for humans; data from Subject 1 was chosen for larger display. The red and blue dashed lines show the best fits (maximum likelihood) of across-context trials and within-context trials, respectively (see also Supplementary file 3).
Figure 6 with 1 supplement
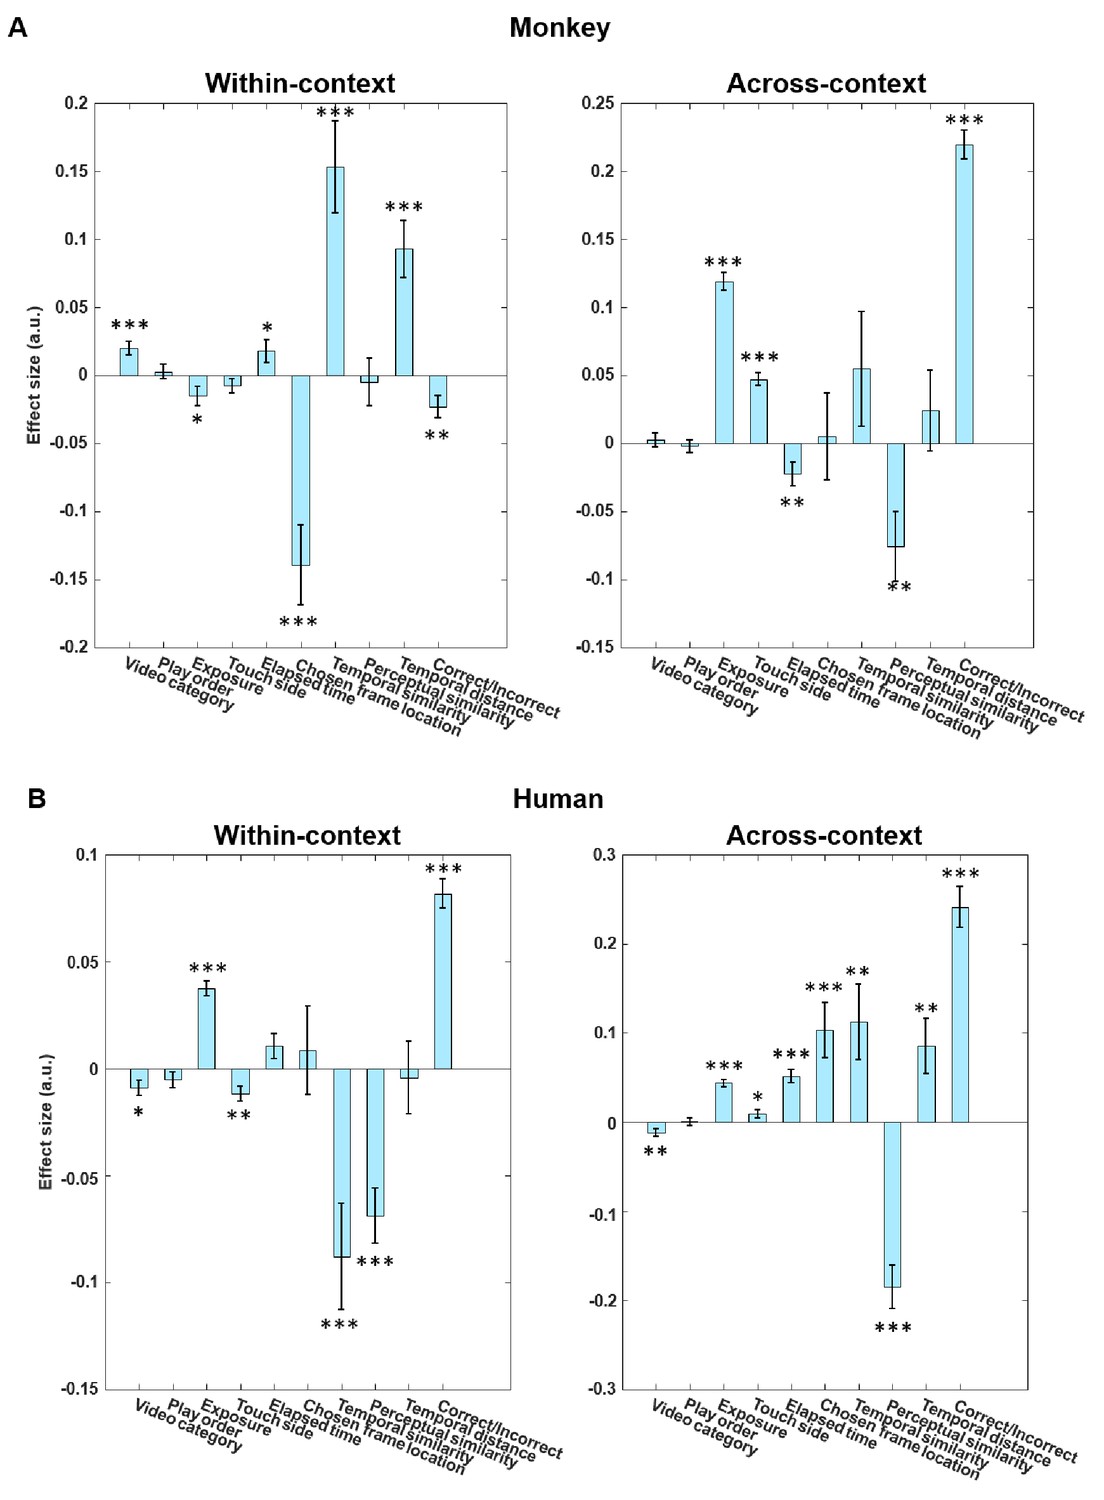
Full GLM analysis including a number of variables that might affect reciprocal latency separately for within-context and across-context conditions.
(A) Monkey data. (B) Human data. We included ten regressors, namely, a binary regressor indicating whether the video category is primate or non-primate (video category), a binary regressor indicating that a video is played forward or backward (play order), the repeated exposure of the trial (Monkey: 1–5; Human: 1–2) (exposure), the physical location of the selected probe on screen (left or right) (touch side), time elapsed within a session (elapsed time; to rule out fatigue or attentional confounds), chosen frame location, temporal similarity, SURF similarity as a perceptual similarity measure (perceptual similarity), temporal distance between two probe frames, and response of subjects (correct/incorrect). In the monkeys, the results confirm that chosen frame location is the most significant regressor in within-context trials, whereas perceptual similarity is the most significant regressor in across-context trials. ***, p<0.001, **, p<0.01, *, p<0.05.
Figure 6—figure supplement 1
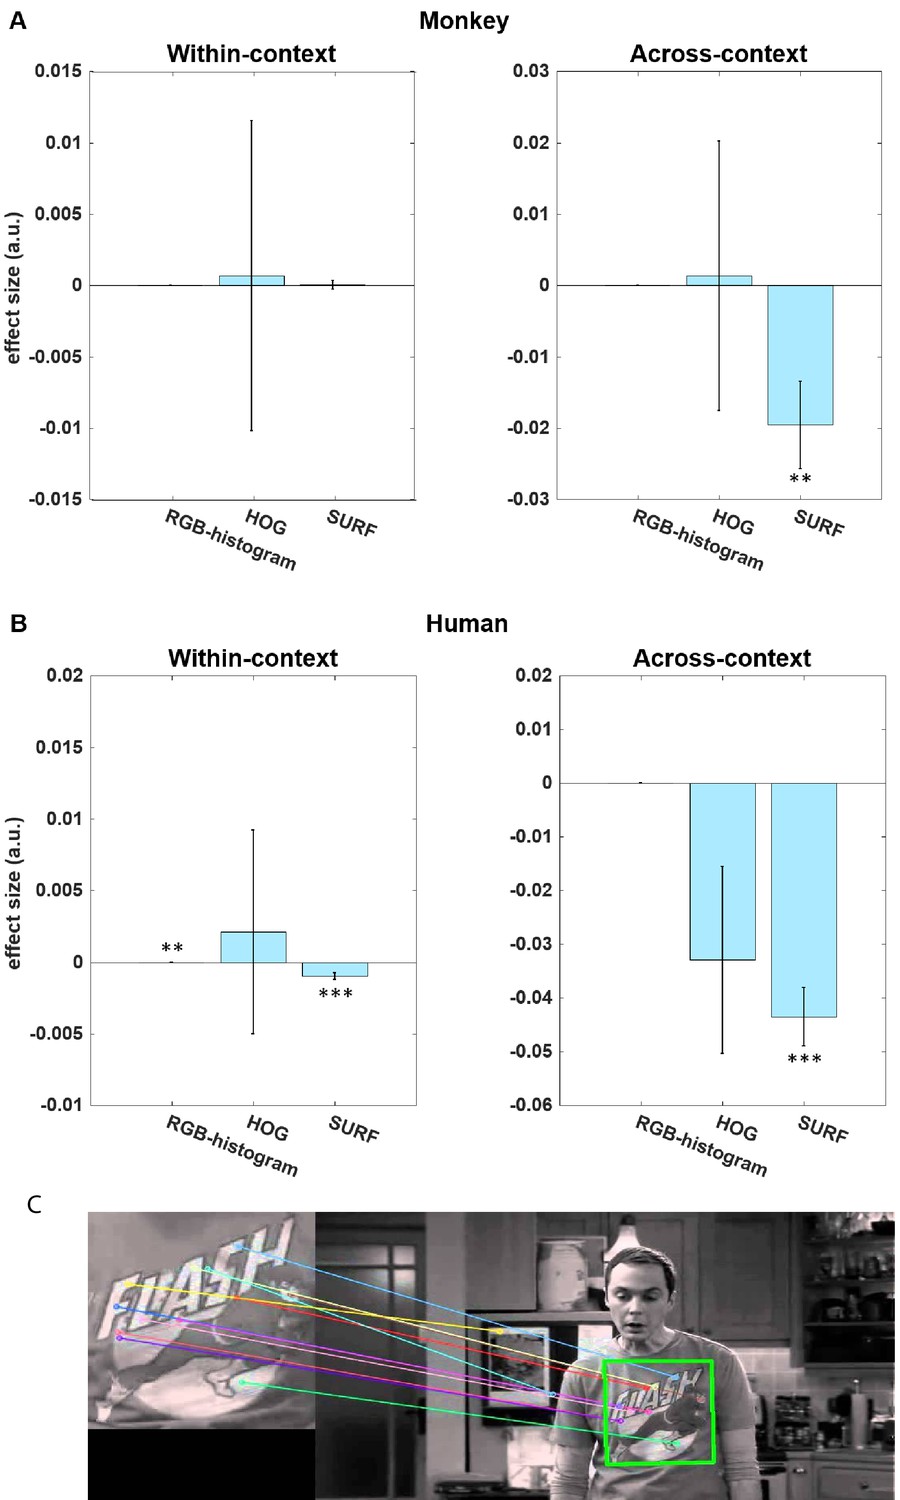
GLM results on the effects of image similarity measures on reciprocal latency for within-context and across-context conditions for (A) the monkeys and (B) humans, and (C) an example of SURF similarity.
Among the several indices (difference of distribution in RGB-histogram, Histogram of Oriented Gradients (HOG) similarity and SURF similarity), the SURF similarity measure was significantly correlated with reciprocal latency in the across-context condition in both species (monkeys: p=0.0015; humans: p<0.001). Higher perceptual dissimilarity leads to shorter RT. In panel (C), SURF uses various scales and orientations to identify unique features or key-points in an image. The cartoon illustrates how features from two images can be matched irrespective of their scale. Thus, if the same feature exits in another image that is smaller/larger in size or even at different orientations, SURF can still identify that feature (or key-point) as corresponding or similar in both images. We can see that features of the inset are matched to the T-shirt on the basis of how strongly they are related, but some feature points (mostly a minority) may still incorrectly match other parts of the image.
© 2011 Chuck Lorre Productions and Warner Bros. Television. All rights reserved. The still image in panel (C) is taken from 'The Big Bang Theory', in the episode titled 'The Agreement Dissection', with permission. It is not covered by the CC-BY 4.0 license and further reproduction of this panel would need permission from the copyright holder.
Figure 7
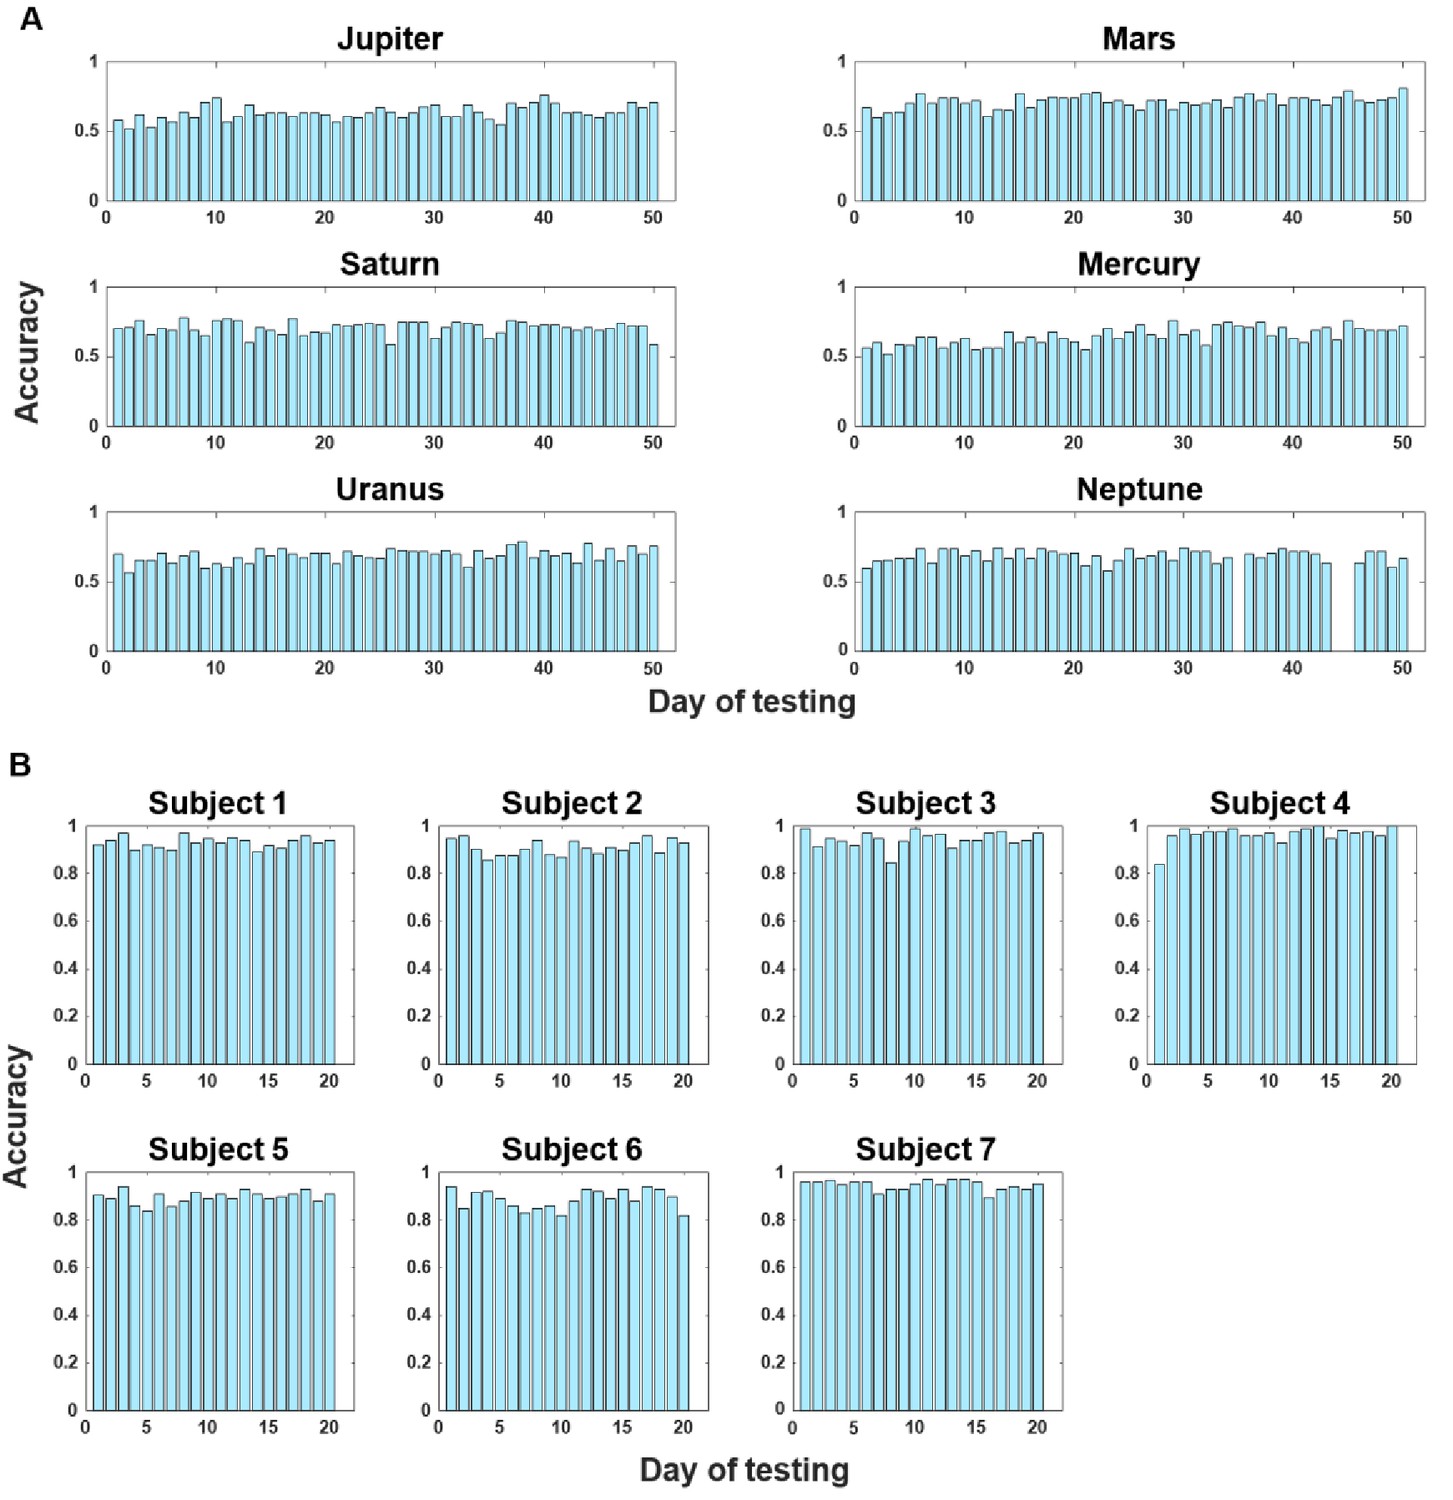
Sessional accuracy data expressed as proportion correct for each individual.
(A) Monkey data. (B) Human data. No obvious increase in performance was observed over the course of testing days in the experiment for either monkeys or humans.
Videos
Video 1
A monkey performing an example trial.
The monkey performs an across-context trial with a correct response (rewarded with liquid).
Tables
Table 1
One sample t-tests of the slopes of reciprocal latency as a function of chosen frame location for each monkey after having entered a range of nuisance variables as regressor-of-no-interest (see also Figure 6).
The three panels correspond to analyses performed using all trials (top), only correct trials (middle), and only incorrect trials (bottom). The same slope patterns were observed irrespective of response correctness.
| Monkeys | Beta | SEM | t-statistics | p-value | 95% confidence interval Lower Upper | |
|---|---|---|---|---|---|---|
| Slope of reciprocal latency/chosen frame location tested against zero (all trials) | ||||||
| Jupiter | –0.203 | 0.021 | –9.751 | <0.001 | –0.244 | –0.163 |
| Mars | –0.369 | 0.025 | –14.950 | <0.001 | –0.417 | –0.320 |
| Saturn | –0.157 | 0.027 | –5.810 | <0.001 | –0.210 | –0.104 |
| Mercury | –0.207 | 0.052 | –3.958 | <0.001 | –0.309 | –0.104 |
| Uranus | –0.164 | 0.022 | –7.595 | <0.001 | –0.207 | –0.122 |
| Neptune | –0.197 | 0.031 | –6.361 | <0.001 | –0.257 | –0.136 |
| Slope of reciprocal latency/chosen frame location tested against zero (correct trials) | ||||||
| Jupiter | –0.185 | 0.025 | –7.393 | <0.001 | –0.234 | –0.136 |
| Mars | –0.272 | 0.028 | –9.879 | <0.001 | –0.326 | –0.218 |
| Saturn | –0.092 | 0.032 | –2.857 | 0.004 | –0.155 | –0.029 |
| Mercury | –0.246 | 0.065 | –3.777 | <0.001 | –0.374 | –0.118 |
| Uranus | –0.153 | 0.024 | –6.259 | <0.001 | –0.201 | –0.105 |
| Neptune | –0.150 | 0.039 | –3.858 | <0.001 | –0.226 | –0.074 |
| Slope of reciprocal latency/chosen frame location tested against zero (Incorrect trials) | ||||||
| Jupiter | –0.175 | 0.027 | –6.619 | <0.001 | –0.227 | –0.123 |
| Mars | –0.366 | 0.031 | –11.705 | <0.001 | –0.428 | –0.305 |
| Saturn | –0.191 | 0.035 | –5.386 | 0.002 | –0.261 | –0.122 |
| Mercury | –0.075 | 0.077 | –0.975 | 0.330 | –0.227 | 0.076 |
| Uranus | –0.140 | 0.029 | –4.816 | <0.001 | –0.197 | –0.083 |
| Neptune | –0.209 | 0.041 | –5.148 | <0.001 | –0.288 | –0.129 |
Table 2
Number of days accrued in each training stage.
When we trained the two additional monkeys (Uranus and Neptune), we made them skip the 4th and 5th stages entirely. The performance patterns of these two monkeys were not different from those of the initial four.
| Monkeys | Stage 1 | Stage 2 | Stage 3 | Stage 4 | Stage 5 |
|---|---|---|---|---|---|
| Jupiter | 12 | 39 | 16 | 65 | 51 |
| Mars | 29 | 7 | 15 | 48 | 42 |
| Saturn | 25 | 42 | 31 | 64 | 95 |
| Mercury | 13 | 38 | 17 | 61 | 49 |
| Uranus | 14 | 17 | 11 | - | - |
| Neptune | 13 | 21 | 11 | - | - |
Additional files
-
Source data 1
Source data for all figures and tables.
- https://cdn.elifesciences.org/articles/54519/elife-54519-data1-v2.xlsx
-
Supplementary file 1
Data description tables used to illustrate all of the key variables contained in the ‘Source Data 1.xlsx’.
- https://cdn.elifesciences.org/articles/54519/elife-54519-supp1-v2.docx
-
Supplementary file 2
For monkeys: one sample t-test results for the slopes of reciprocal latency as a function of temporal similarity, having entered a range of nuisance variables as regressor-of-no-interest.
The three panels correspond to analyses performed using all trials (top), only correct trials (middle), and only incorrect trials (bottom). The same slope patterns were observed irrespective of correctness, as is consistent with the analyses of slopes of reciprocal latency as a function of chosen frame location for each monkey. Related to Figure 2—figure supplement 1A.
- https://cdn.elifesciences.org/articles/54519/elife-54519-supp2-v2.docx
-
Supplementary file 3
Hierarchical multiple regression results for individual monkeys (left panel) and for human participants (right panel) showing reaction time as a function of chosen frame location (CFL).
- https://cdn.elifesciences.org/articles/54519/elife-54519-supp3-v2.docx
-
Supplementary file 4
For human participants: one sample t-test results for the slopes of reciprocal latency as a function of temporal similarity (upper panel) and the slopes of reciprocal latency as a function of chosen frame location (bottom panel) against zero, after having entered a range of nuisance variables as regressor-of-no-interest.
Related to Figure 2—figure supplement 1B.
- https://cdn.elifesciences.org/articles/54519/elife-54519-supp4-v2.docx
-
Supplementary file 5
LATER model fitting results of six monkeys and seven human participants.
For ease of comparison, we computed the respective ΔBIC to index the strength of evidence for each model. Note that the model with the lowest BIC is the winning model. In all 6 monkeys, the shift model is superior to the other three models, whereas this effect is not consistent in the humans. Related to Figure 5.
- https://cdn.elifesciences.org/articles/54519/elife-54519-supp5-v2.docx
-
Transparent reporting form
- https://cdn.elifesciences.org/articles/54519/elife-54519-transrepform-v2.docx
Download links
A two-part list of links to download the article, or parts of the article, in various formats.
Downloads (link to download the article as PDF)
Open citations (links to open the citations from this article in various online reference manager services)
Cite this article (links to download the citations from this article in formats compatible with various reference manager tools)
Behavioral evidence for memory replay of video episodes in the macaque
eLife 9:e54519.
https://doi.org/10.7554/eLife.54519


