Different CFTR modulator combinations downregulate inflammation differently in cystic fibrosis
- Leeds Institute of Medical Research at St James's, University of Leeds, United Kingdom
- Leeds Cystic Fibrosis Trust Strategic Research Centre, University of Leeds, United Kingdom
- Leeds Institute of Rheumatic and Musculoskeletal Medicine, University of Leeds, United Kingdom
- Department of Biochemistry, University of Lausanne, Switzerland
- Department of Clinical Immunology and Allergy, St James’s University Hospital, United Kingdom
- Adult Cystic Fibrosis Unit, St James’s University Hospital, United Kingdom
- Division of Medical Sciences, University of Dundee, United Kingdom
Figures
Figure 1
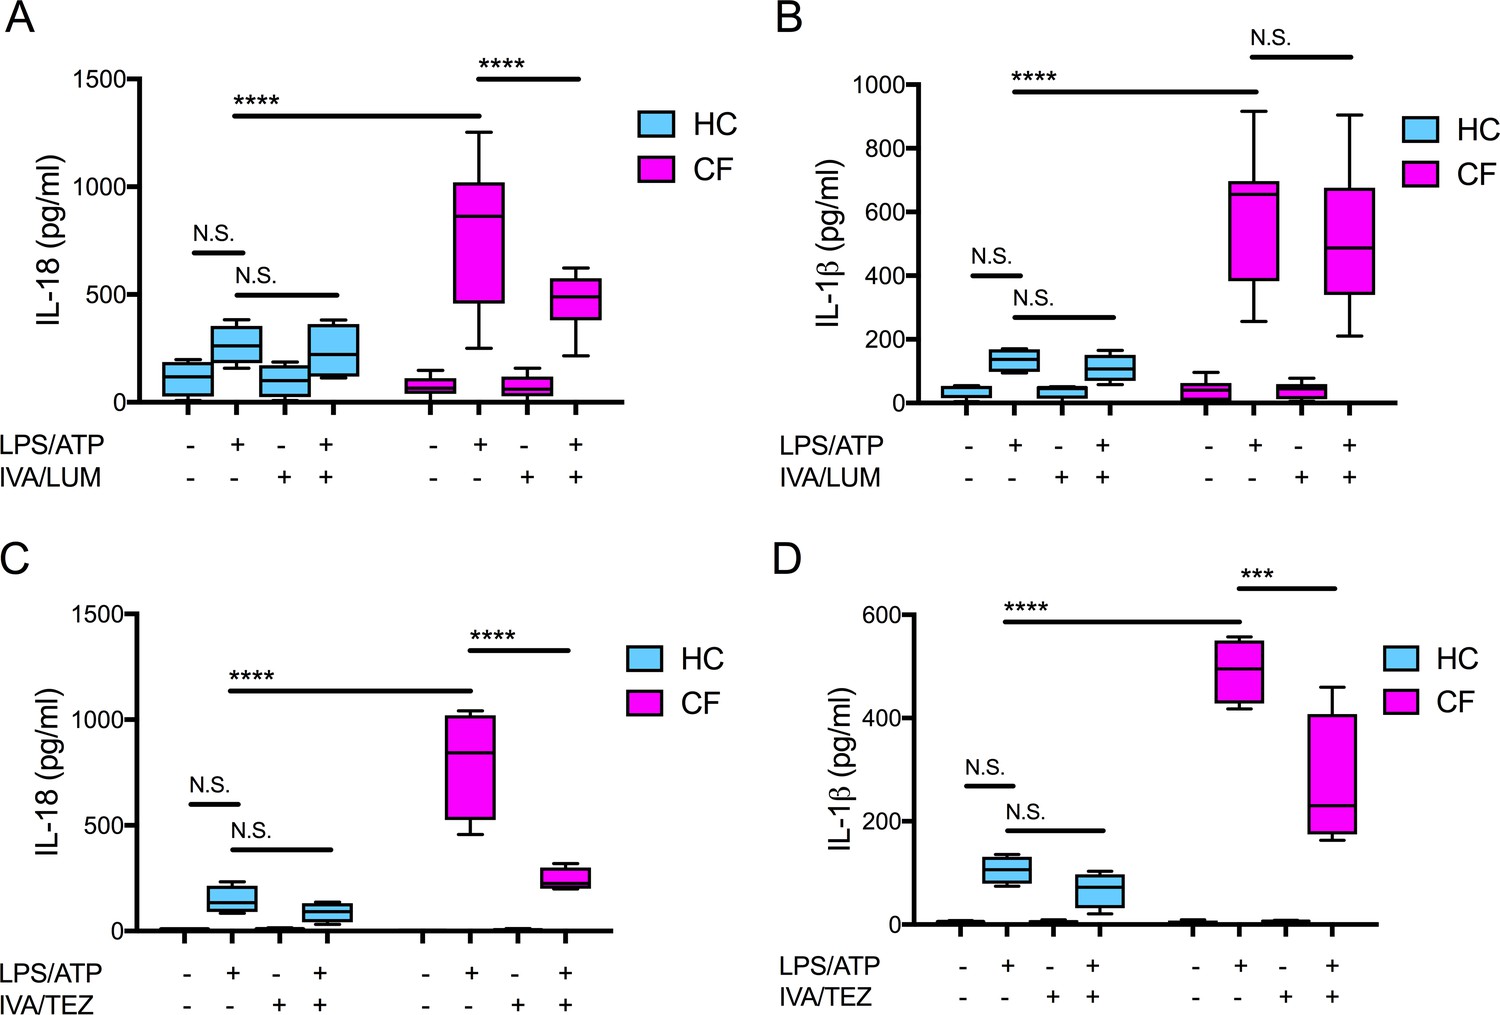
Cytokine secretion in NLRP3-stimulated monocytes with a differential response between CF (homozygous Phe508del) and HC (healthy controls) following in vitro exposure to either IVA/LUM or IVA/TEZ.
ELISA assays were used to detect A, C IL-18; B, D IL-1β secretion in monocytes from patients with CF-associated mutations (n = 10 IVA/LUM; n = 4 IVA/TEZ) vs HC (n = 4). Monocytes were treated with IVA/LUM (A, B) for 24 hr or IVA/TEZ (C, D) for 24 hr, then stimulated with LPS (10 ng/mL, 4 hr), and ATP (5 mM) for the final 30 min. A two-way ANOVA statistical test with Tukey’s multiple comparison was performed (p values * = ≤ 0.05, ** = ≤ 0.01, *** = ≤ 0.001 and **** = ≤ 0.0001). N.S. not-significant. IL-18 levels for HC (no treatment 10.84 pg/ml; IVA/TEZ 11.71 pg/ml); IL-1β levels for HC (no treatment 5.91 pg/ml; IVA/TEZ 5.27 pg/ml).
-
Figure 1—source data 1
Cytokine secretion in NLRP3-stimulated (LPS/ATP) monocytes isolated from CF (homozygous Phe508del) and HC (healthy controls) following in vitro exposure to either IVA/LUM or IVA/TEZ.
ELISA assays were used to detect IL-18 or IL-1β secretion (n = 10 IVA/LUM; n = 4 IVA/TEZ) vs HC (n = 4).
- https://cdn.elifesciences.org/articles/54556/elife-54556-fig1-data1-v2.xlsx
Figure 2 with 4 supplements
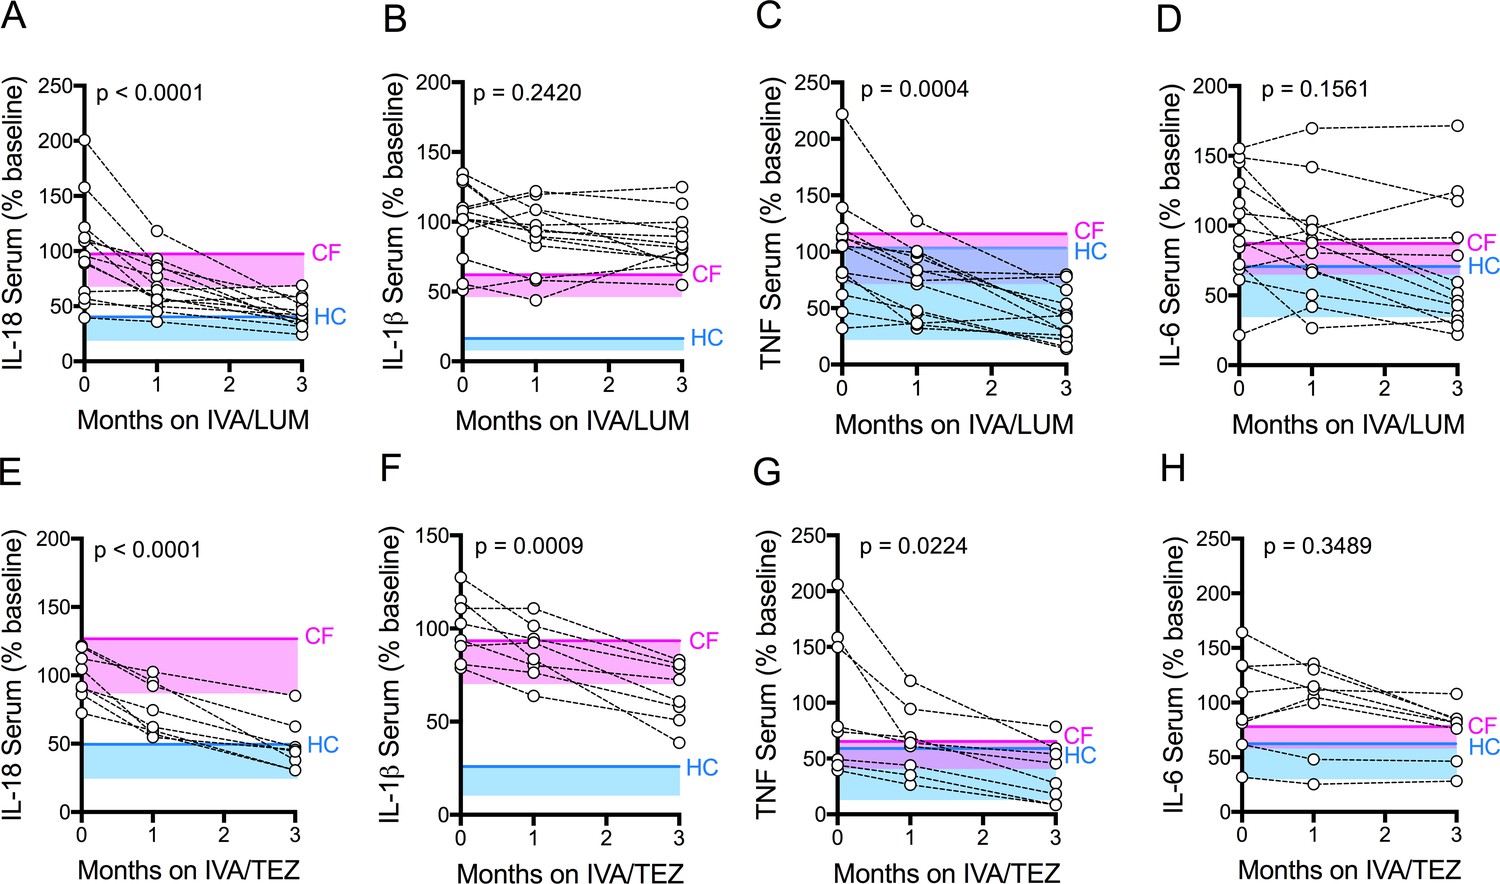
Serum cytokine levels in patients with CF (homozygous Phe508del), following treatment with IVA/LUM or IVA/TEZ.
Sera were collected at baseline, one month and three months of treatment from patients homozygous for Phe508del CFTR mutations receiving compassionate use IVA/LUM (n = 13) or IVA/TEZ (n = 8) therapy. ELISA assays were used to detect levels of A, IL-18; B, IL-1β; C, TNF and D, IL-6 in serum from the IVA/LUM treated group. ELISA assays were used to detect levels of E, IL-18; F, IL-1β; G,TNF; H, IL-6; in serum from the IVA/TEZ treated group. A one-way ANOVA statistical test with Tukey’s multiple comparison was performed. P value for baseline to three months shown on each graph. Baseline ranges were established for each cytokine from HC and clinically stable drug-naïve CF patients (Figure 2—figure supplement 3). Upper 95% confidence interval for baseline HC (solid blue line) or CF (solid pink line) with block colour shading (HC, blue; CF, pink) to lower 5% confidence interval is displayed for each cytokine.
-
Figure 2—source data 1
Serum cytokine levels in patients with CF (homozygous Phe508del), following treatment with IVA/LUM or IVA/TEZ.
The baseline (pre-therapy, zero month) values for each patient were calculated as a percentage of the average baseline within each patient group (IVA/LUM or IVA/TEZ). The one month and three month samples were calculated as a percentage of the baseline average. ELISA assays were used to detect IL-18, IL-1β, TNF or IL-6 secretion (n = 13 IVA/LUM; n = 8 IVA/TEZ).
- https://cdn.elifesciences.org/articles/54556/elife-54556-fig2-data1-v2.xlsx
Figure 2—figure supplement 1
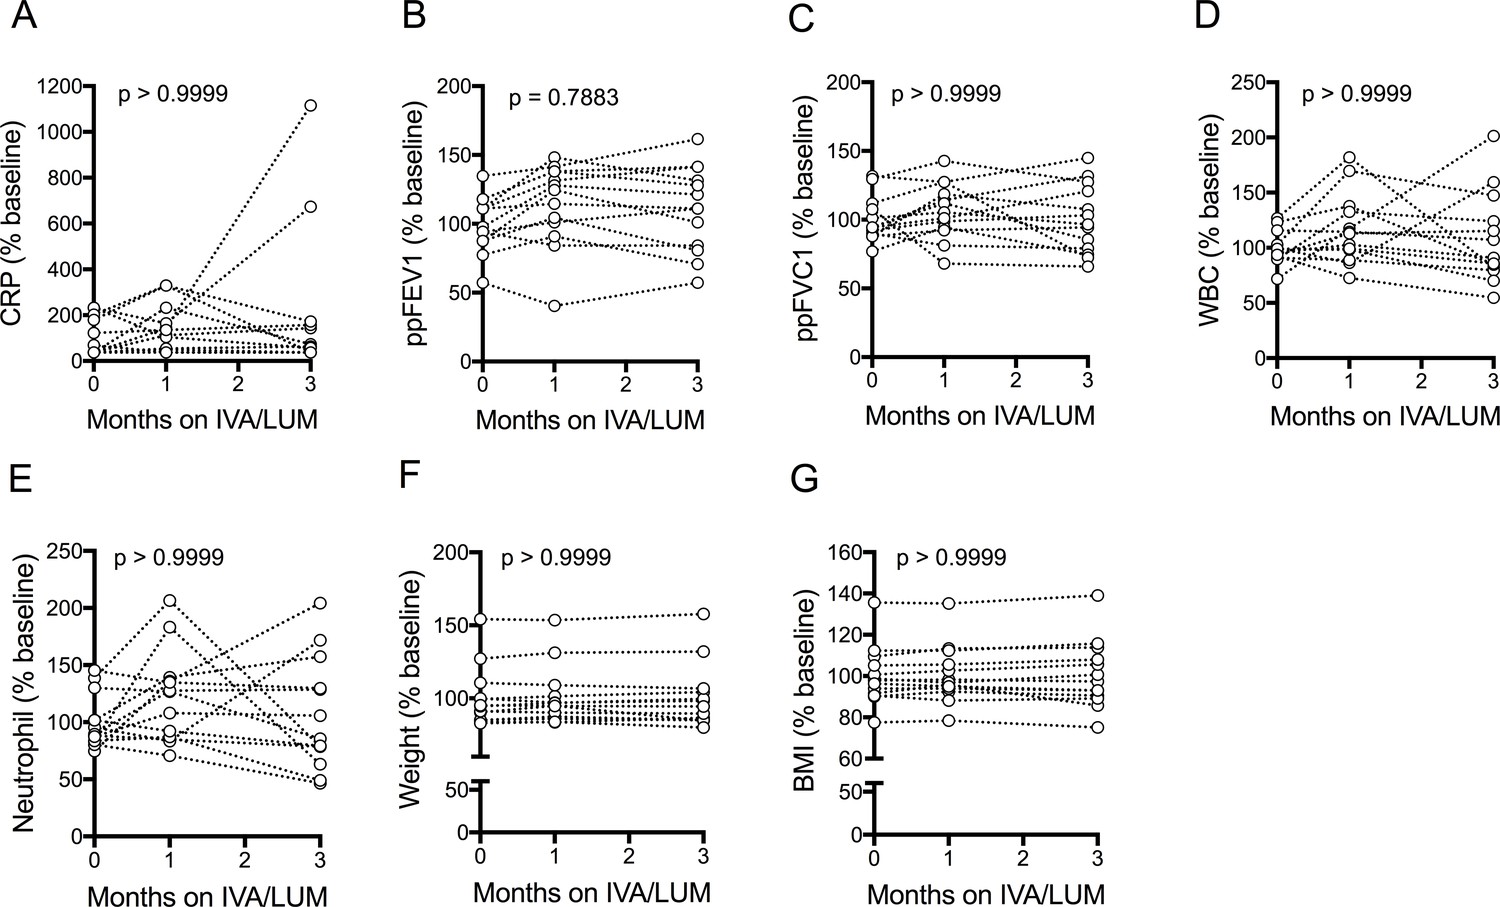
Clinical measurements of patients with CF (homozygous Phe508del) following IVA/LUM treatment.
Clinical measurements were taken at baseline, one month and three months from patients homozygous for Phe508del CFTR mutations receiving compassionate use IVA/LUM (n = 13). Measurements were plotted as % baseline. A, CRP; B, ppFEV1; C, ppFVC1; D, WBC; E, Neutrophil; F, Weight; G, BMI. A non-parametric Kruskal-Wallis statistical test with Dunn’s multiple comparison was performed. P value for baseline to three months is shown on each graph.
Figure 2—figure supplement 2
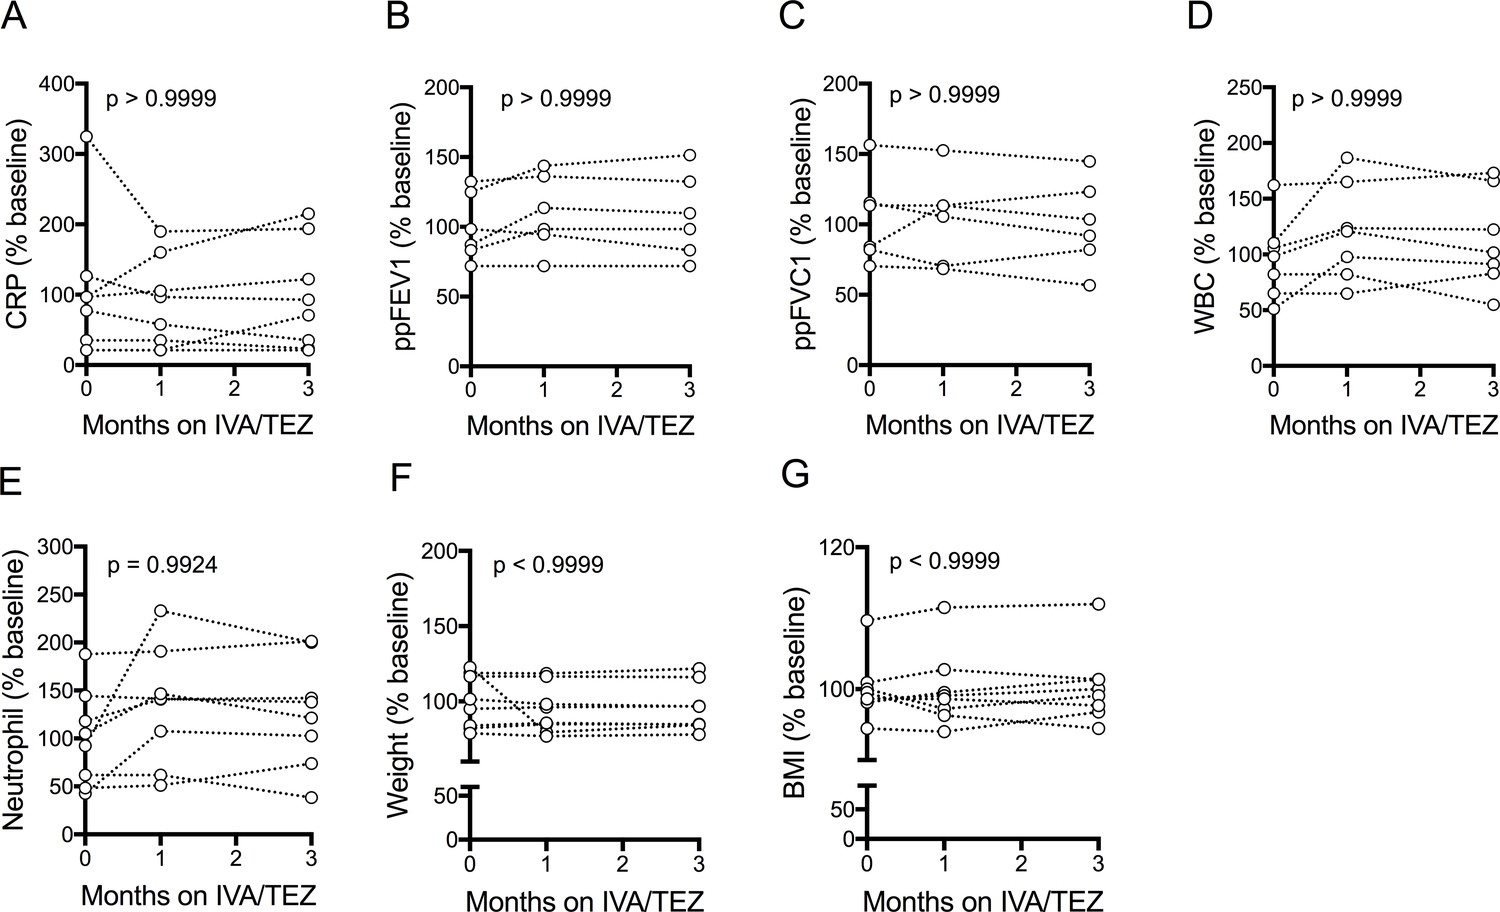
Clinical measurements of patients with CF (homozygous Phe508del) following IVA/TEZ treatment.
Clinical measurements were taken at baseline, one month and three months from patients homozygous for Phe508del CFTR mutations receiving compassionate use IVA/TEZ therapy. Measurements were plotted as % baseline. A, CRP (n = 8); B, ppFEV1 (n = 6); C, ppFVC1 (n = 6); D, WBC (n = 7); E, Neutrophil (n = 8); F, Weight (n = 8); G, BMI (n = 8). A non-parametric Kruskal-Wallis statistical test with Dunn’s multiple comparison was performed. P value for baseline to three months is shown on each graph.
Figure 2—figure supplement 3

Baseline serum cytokine levels in HC and CF (homozygous Phe508del) and corresponding baseline cytokine levels in NLRP3-stimulated HC and CF immune cells.
Serum collected and PBMCs isolated at baseline from patients homozygous for Phe508del CFTR mutations (HC, n = 10; CF, n = 51). ELISA assays were used to detect levels of A, IL-18; B, IL-1β; C, TNF and D, IL-6 in serum. ELISA assays were used to detect levels of E, IL-18; F, IL-1β; G,TNF; H, IL-6; I, IL-10 secretion in PBMCs. PBMCs were stimulated with LPS (10 ng/mL, 4 hr), and ATP (5 mM) for the final 30 min. For PBMC data IL-18, IL-1β (HC n = 11, CF n = 32); TNF (HC n = 6, CF n = 27); IL-6 and IL-10 (CF n = 20) A non-parametric Mann Whitney test was performed. Error bars displayed as 5–95% percentile range with median (p values * = ≤ 0.05, ** = ≤ 0.01, *** = ≤ 0.001 and **** = ≤ 0.0001).
Figure 2—figure supplement 4
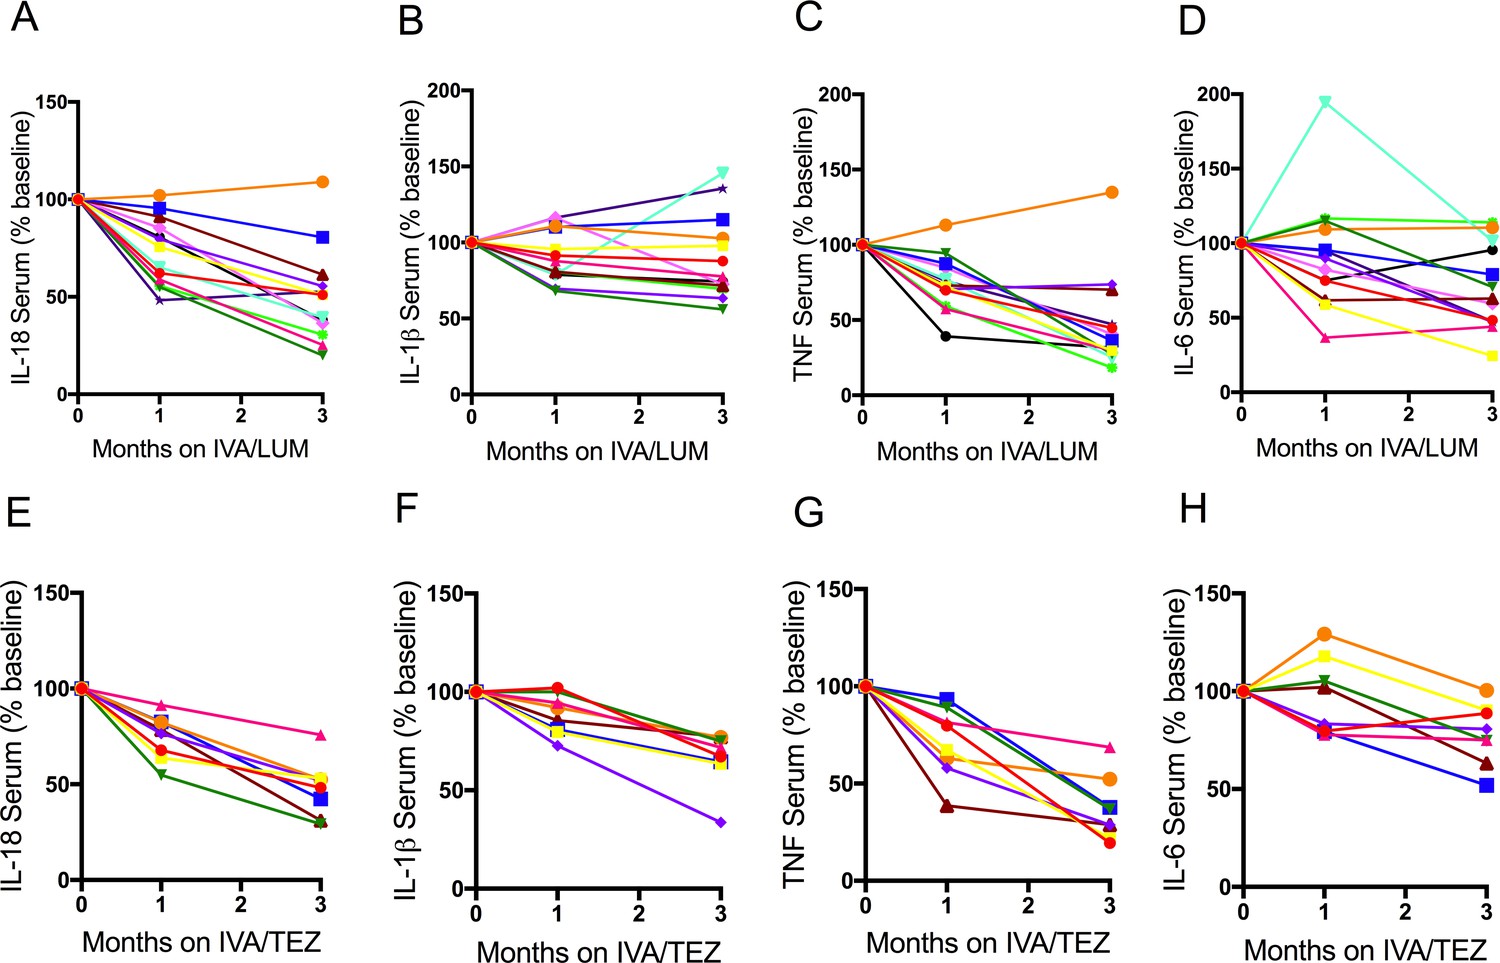
Individual therapy serum cytokine response in patients with CF (homozygous Phe508del) following IVA/LUM or IVA/TEZ treatment.
Serum collected at baseline, one month and three months from patients homozygous for Phe508del CFTR mutations receiving compassionate use IVA/LUM (n = 13) or IVA/TEZ (n = 8) therapy. ELISA assays were used to detect A, IL-18; B, IL-1β; C, TNF and D, IL-6 in serum from the IVA/LUM treated group. ELISA assays were used to detect levels of E, IL-18; F, IL-1β; G,TNF; H, IL-6; in serum from the IVA/TEZ treated group. Baseline for each patient set at 100% and proportional change at one and three months plotted.
Figure 3 with 1 supplement
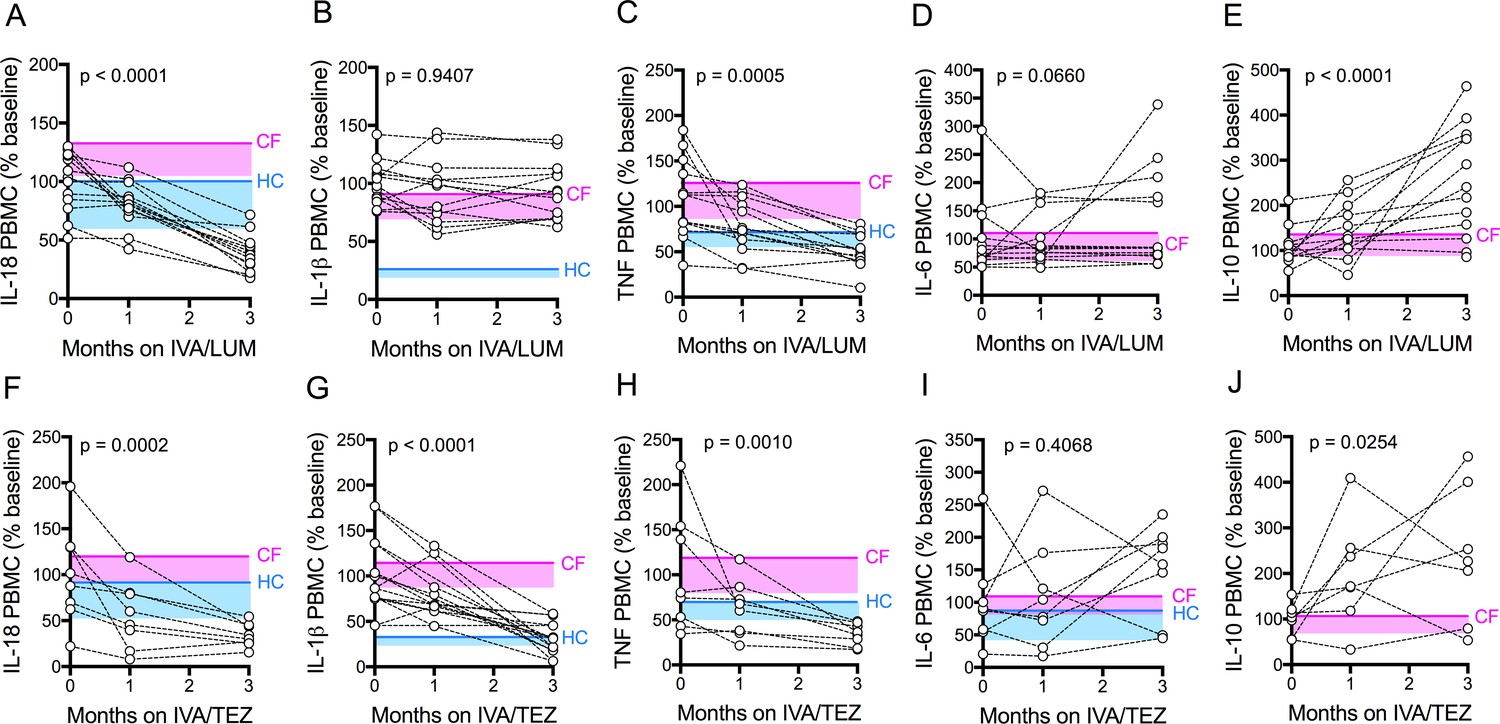
Cytokine secretion in NLRP3-stimulated CF immune cells isolated from patients with CF (homozygous Phe508del), following treatment with IVA/LUM or IVA/TEZ.
PBMCs isolated at baseline, one month and three months from patients homozygous for Phe508del CFTR mutations receiving compassionate use IVA/LUM (n = 12/13) or IVA/TEZ (n = 8) therapy. Following isolation, PBMCs were immediately stimulated with LPS (10 ng/mL, 4 hr), and ATP (5 mM) for the final 30 min. ELISA assays were used to detect levels of A, IL-18; B, IL-1β; C, TNF; D, IL-6 and E, IL-10 secretion from PBMCs in the IVA/LUM treated group. ELISA assays were used to detect levels of F, IL-18; G, IL-1β; H,TNF; I, IL-6; J, IL-10 secretion from PBMCs in the IVA/TEZ treated group. For IVA/LUM: IL-18 (n = 13); IL-1β (n = 13); TNF (n = 12); IL-6 (n = 13); IL-10 (n = 12). A two-way ANOVA statistical test with Tukey’s multiple comparison was performed. P value for baseline to three months is shown on each graph. For IL-6 (IVA/LUM), a non-parametric Kruskal-Wallis statistical test with Dunn’s multiple comparison was performed. Baseline ranges were established for each cytokine from HC and clinically stable drug-naïve CF patients (Figure 2—figure supplement 3). Upper 95% confidence interval for baseline HC (solid blue line) or CF (solid pink line) with block colour shading (HC, blue; CF, pink) to lower 5% confidence interval is displayed for each cytokine.
-
Figure 3—source data 1
Cytokine secretion in NLRP3-stimulated (LPS/ATP) CF immune cells isolated from patients with CF (homozygous Phe508del), following treatment with IVA/LUM or IVA/TEZ.
The baseline (pre-therapy, zero month) values for each patient were calculated as a percentage of the average baseline within each patient group (IVA/LUM or IVA/TEZ). The one month and three month samples were calculated as a percentage of the baseline average. ELISA assays were used to detect IL-18, IL-1β, TNF, IL-6 or IL-10 secretion (n = 13 IVA/LUM; n = 8 IVA/TEZ).
- https://cdn.elifesciences.org/articles/54556/elife-54556-fig3-data1-v2.xlsx
Figure 3—figure supplement 1
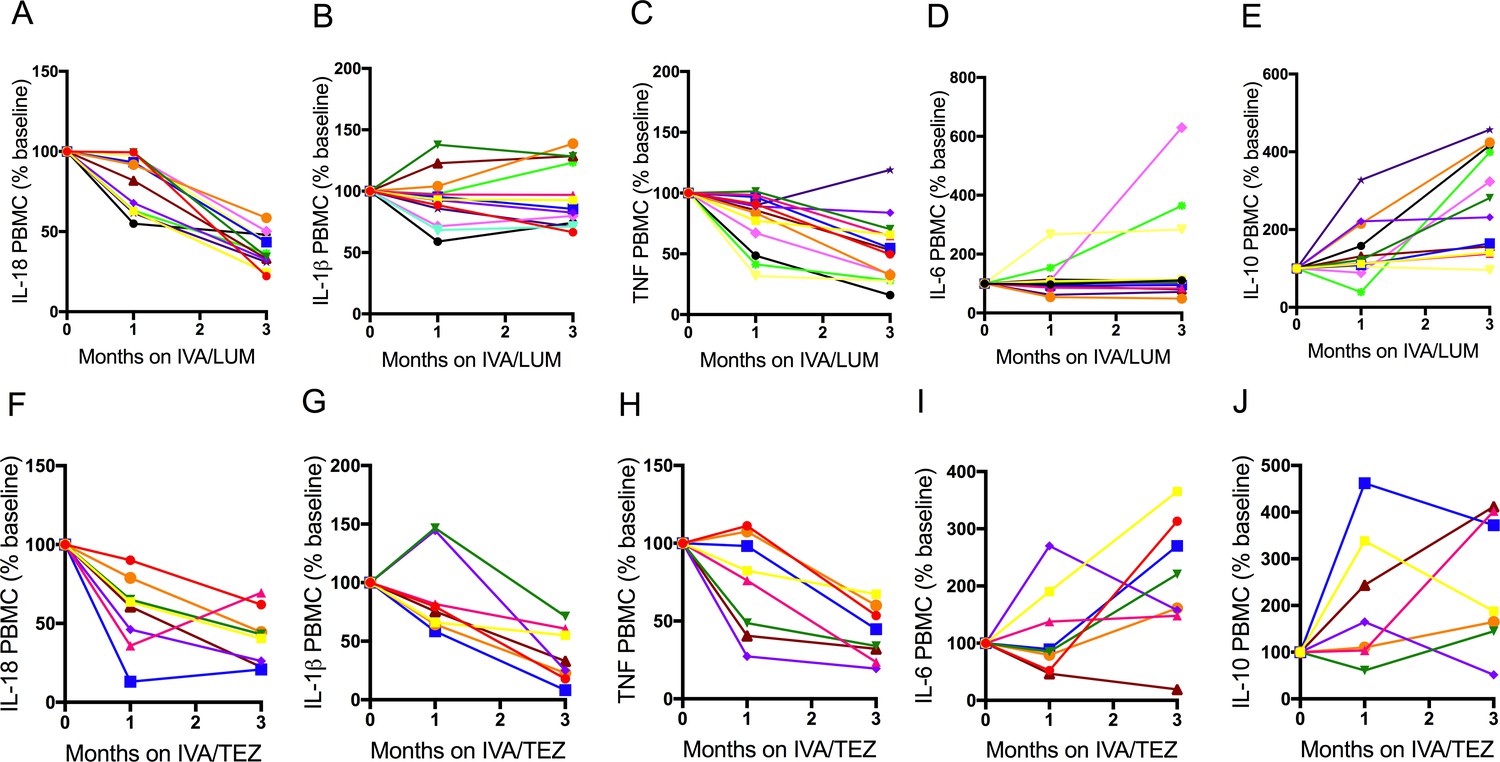
Individual therapy PBMC cytokine response in NLRP3- stimulated CF immune cells isolated from patients with CF (homozygous Phe508del) following treatment with IVA/LUM or IVA/TEZ.
PBMCs isolated at baseline, one month and three months from patients homozygous for Phe508del CFTR mutations receiving compassionate use IVA/LUM (n = 12/13) or IVA/TEZ (n = 8) therapy. Following isolation, PBMCs were immediately stimulated with LPS (10 ng/mL, 4 hr), and ATP (5 mM) for the final 30 min. ELISA assays were used to detect levels of A, IL-18; B, IL-1β; C, TNF; D, IL-6 and E, IL-10 secretion from PBMCs in the IVA/LUM treated group. ELISA assays were used to detect levels of F, IL-18; G, IL-1β; H,TNF; I, IL-6; J, IL-10 secretion from PBMCs in the IVA/TEZ treated group. Baseline for each patient set at 100% and proportional change at one and three months plotted. For IVA/LUM: IL-18 (n = 13); IL-1β (n = 13); TNF (n = 12); IL-6 (n = 13); IL-10 (n = 12).
Figure 4 with 1 supplement
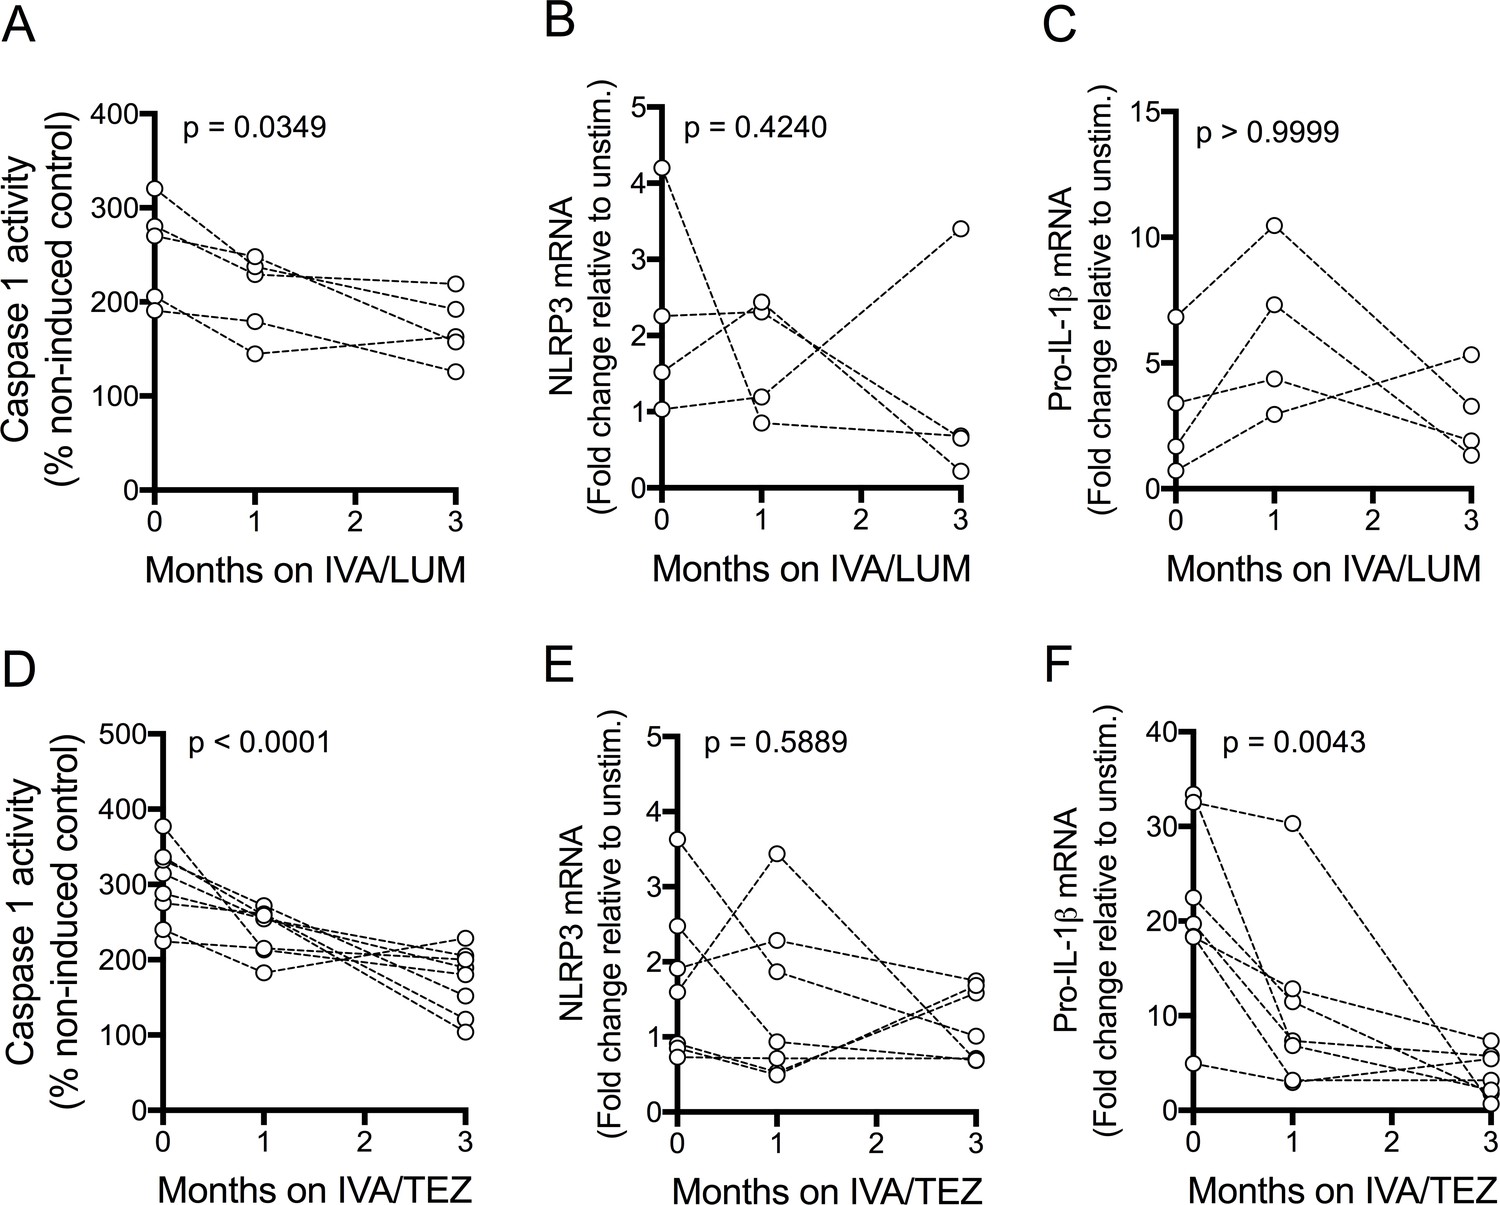
NLRP3-inflammasome activation in patients with CF (homozygous Phe508del) receiving IVA/LUM or IVA/TEZ treatment.
PBMCs isolated at baseline, one month and three months from patients homozygous for Phe508del CFTR mutations receiving compassionate use IVA/LUM or IVA/TEZ therapy. Following isolation, PBMCs were immediately stimulated with LPS (10 ng/mL, 4 hr), and ATP (5 mM) for the final 30 min. Caspase-1 activity was detected in stimulated PBMCs at each time point for A, IVA/LUM (n = 4) and D, IVA/TEZ (n = 8). qPCR analysis was used to asses a fold change in mRNA expression of B, E NLRP3, and C, F pro-IL-1β for IVA/LUM (n = 4) (B–C) or IVA/TEZ (n = 7) (E–F). A one-way ANOVA with Tukey’s multiple comparison was performed on caspase-1 activity data and a non-parametric Kruskal-Wallis statistical test with Dunn’s multiple comparison was performed on the mRNA data. P value for baseline to three months indicated on each graph.
Figure 4—figure supplement 1
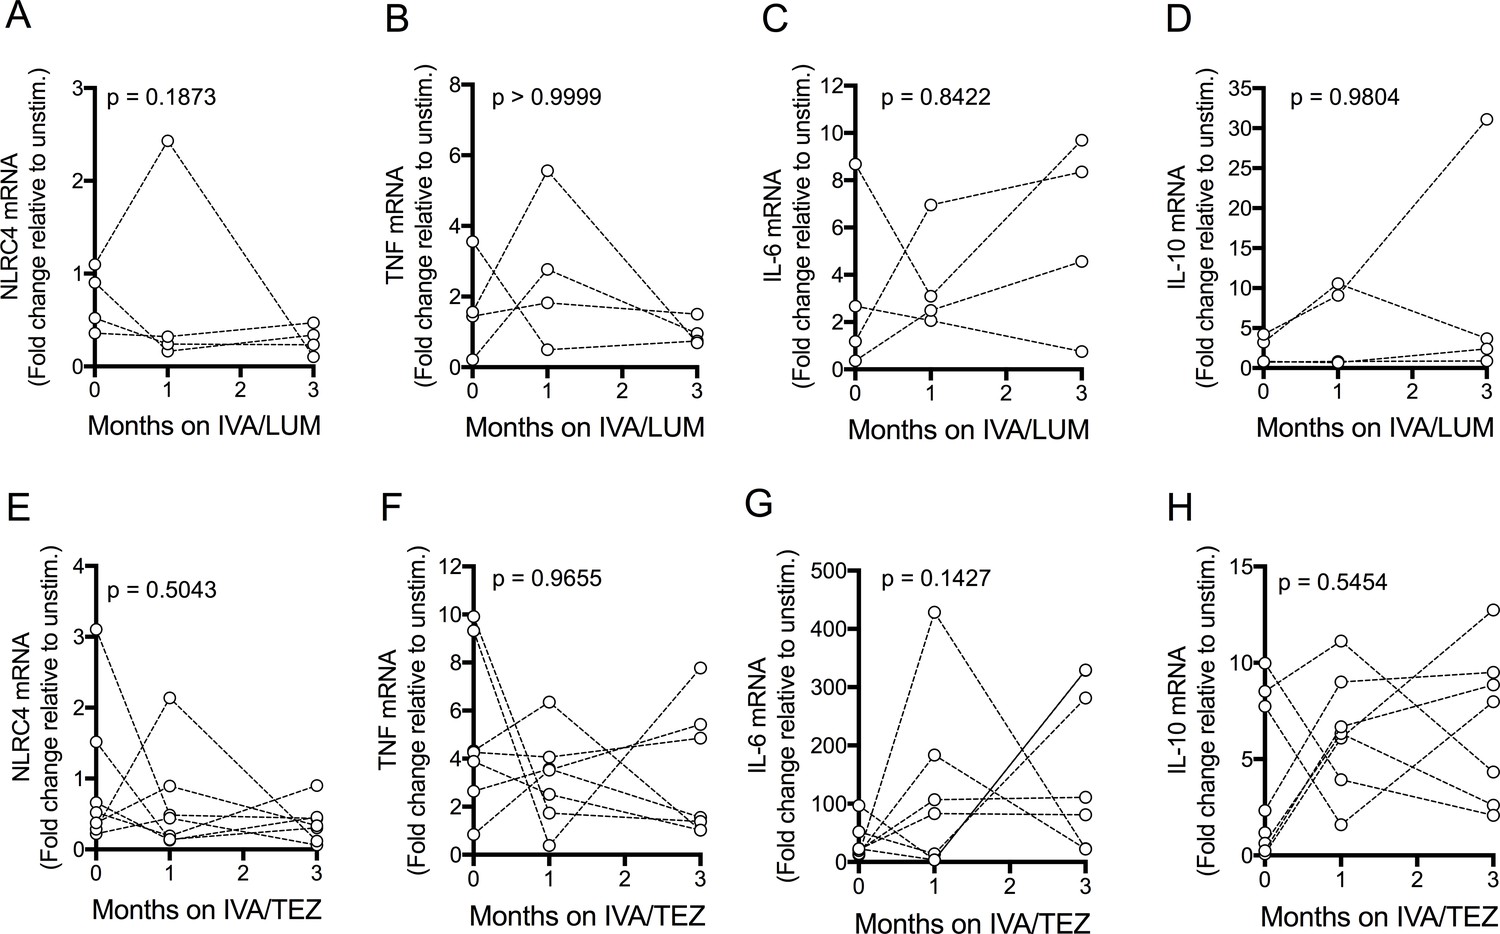
mRNA expression in NLRP3-stimulated PBMCs isolated from patients with CF (homozygous Phe508del) following IVA/LUM or IVA/TEZ treatment.
PBMCs isolated at baseline, one month and three months from patients homozygous for Phe508del CFTR mutations receiving compassionate IVA/LUM or IVA/TEZ treatment. Following isolation, PBMCs were immediately stimulated with LPS (10 ng/mL, 4 hr), and ATP (5 mM) for the final 30 min. qPCR analysis was used to asses a fold change in mRNA expression of A, E NLRC4, B, F TNF, C, G IL-6, D, H IL-10 for IVA/LUM (n = 4) (A–D) or IVA/TEZ (n = 7) (E–H). A non-parametric Kruskal-Wallis statistical test with Dunn’s multiple comparison was performed on mRNA data. P value for baseline to three months indicated on each graph.
Figure 5
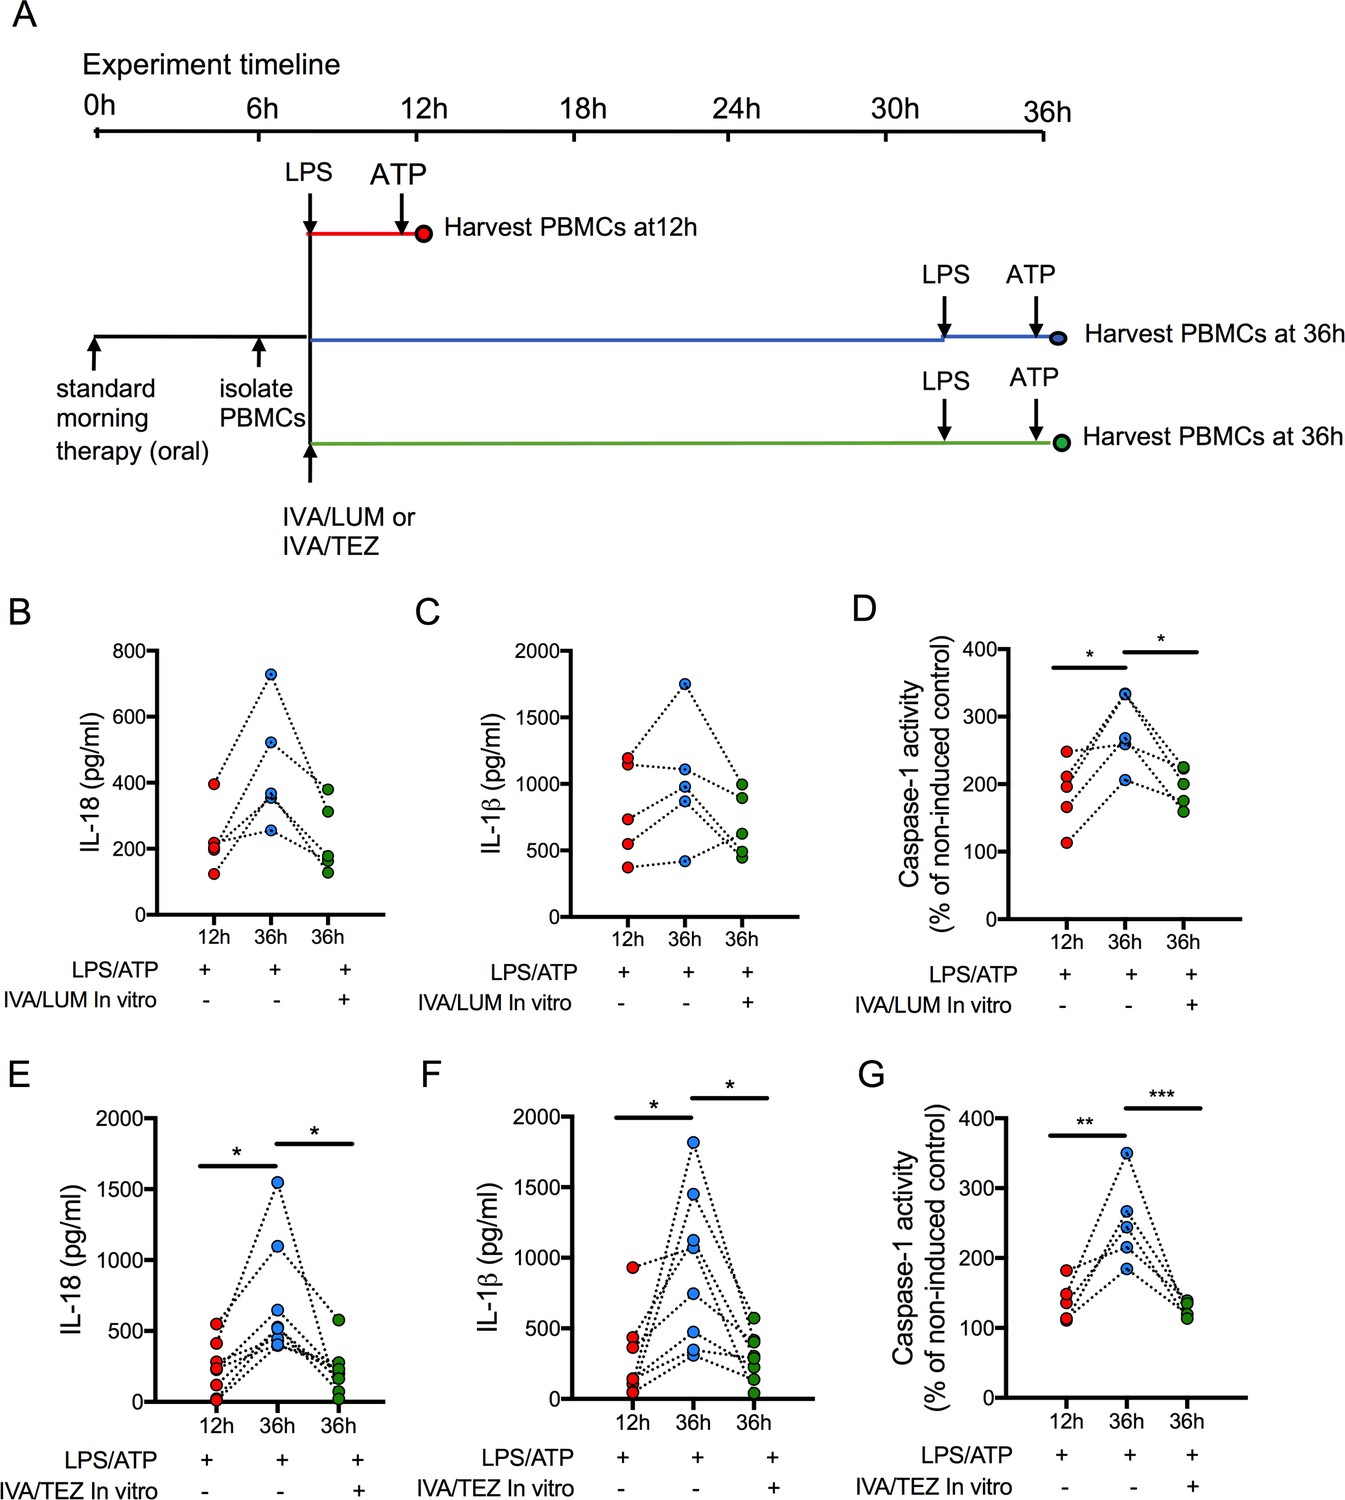
Sustainability of oral drug therapy (IVA/LUM or IVA/TEZ) on NLRP3-stimulated cytokine production in PBMCs isolated from patients on therapy for three months.
PBMCs were isolated from patients receiving IVA/LUM or IVA/TEZ treatment for three months or longer. PBMCs were stimulated with LPS (10 ng/mL, 4 hr), and ATP (5 mM) for the final 30 min at 12 hr post oral therapy and at 36 hr post oral therapy with or without pre-treatment with IVA/LUM or IVA/TEZ as shown in schematic A. ELISA assays were used to detect levels of (B, E), IL-18; (C, F), IL-1β; secretion in media from PBMCs (IVA/LUM, n = 5; IVA/TEZ. n = 8). (D, G), Caspase-1 activity was detected in stimulated PBMCs at each time point, (IVA/LUM, n = 5; IVA/TEZ, n = 5). A one-way ANOVA with Tukey’s multiple comparison was performed on caspase-1 activity data and a non-parametric Kruskal-Wallis statistical test with Dunn’s multiple comparison was performed on IL-18 and IL-1β data (p values * = ≤ 0.05, ** = ≤ 0.01, *** = ≤ 0.001 and **** = ≤ 0.0001).
Tables
Key resources table
| Reagent type (species) or resource | Designation | Source or reference | Identifiers | Additional information |
|---|---|---|---|---|
| Biological sample (Homo sapiens) | Human Blood Samples | St James's University Hospital | Health Research Authority REC reference 17/YH/0084 | |
| Chemical compound, drug | Lymphoprep | Axis Shield | Cat# 1114544 | |
| Chemical compound, drug | Pan Monocyte Isolation Kit, human | Miltenyi Biotec | Cat# 130-096-537 | |
| Chemical compound, drug | Lipopolysacchride Ultrapure EK | InvivoGen | Cat# tlrl-eklps | 10ng/ml |
| Chemical compound, drug | ATP | InvivoGen | Cat# tlrl-atpl | 5 mM, 30 min |
| Chemical compound, drug | Lumacaftor (LUM) | AdooQ Bioscience | Cat#A10986 | 3 μM, 24 hr |
| Chemical compound, drug | Ivacaftor (IVA) | Cayman chemicals | Cat#15145 | 5 μM, 24 hr |
| Chemical compound, drug | Tezacaftor (TEZ) | TargetMol | Cat#T2263 | 5 μM, 24 hr |
| Commercial assay or kit | IL-1 beta Human Matched Antibody Pair | ThermoFisher Scientific | Cat# CHC1213 | Assay sensitivity < 31.2 pg/mL |
| Commercial assay or kit | IL-18 Human Matched Antibody Pair | ThermoFisher Scientific | Cat# BMS267/2MST | Assay sensitivity 78 pg/mL |
| Commercial assay or kit | IL-6 Human Matched Antibody Pair | ThermoFisher Scientific | Cat# CHC1263 | Assay sensitivity 15.6 pg/mL |
| Commercial assay or kit | TNF alpha Human Matched Antibody Pair | ThermoFisher Scientific | Cat# CHC1753 | Assay sensitivity < 15.6 pg/mL |
| Commercial assay or kit | IL1RA Human Matched Antibody Pair | ThermoFisher Scientific | Cat# CHC1183 | Assay sensitivity < 31.2 pg/mL |
| Chemical compound, drug | (TMB) substrate solution | Sigma | Cat# T0440 | |
| Commercial assay or kit | Caspase-1 Colorimetrix Assay | R and D Systems | Cat# BF15100 | |
| Commercial assay or kit | High-Capacity cDNA Reverse Transcription Kit | ThermoFisher Scientific | Cat# 4368814 | |
| Software, algorithm | GraphPad Prism7 | Graphpad software |
Additional files
-
Supplementary file 1
Demographic and clinical characteristics for CF patients on ivacaftor/lumacaftor (IVA/LUM) and ivacaftor/tezacaftor (IVA/TEZ).
Data are expressed as median and range. BMI: Body Mass Index; ppFEV: percent predicted forced expiratory volume, ppFVC: forced vital capacity, CRP: C-reactive protein. WBC: white blood count.
- https://cdn.elifesciences.org/articles/54556/elife-54556-supp1-v2.docx
-
Supplementary file 2
Cytokine secretion in unstimulated CF PBMCs following IVA/LUM (n = 13) or IVA/TEZ (n = 8) treatment.
ELISA assays were used to detect IL-18, IL-1β, TNF, IL-6 and IL-10 secretion in PBMCs.
- https://cdn.elifesciences.org/articles/54556/elife-54556-supp2-v2.docx
-
Transparent reporting form
- https://cdn.elifesciences.org/articles/54556/elife-54556-transrepform-v2.pdf
Download links
A two-part list of links to download the article, or parts of the article, in various formats.
Downloads (link to download the article as PDF)
Open citations (links to open the citations from this article in various online reference manager services)
Cite this article (links to download the citations from this article in formats compatible with various reference manager tools)
Different CFTR modulator combinations downregulate inflammation differently in cystic fibrosis
eLife 9:e54556.
https://doi.org/10.7554/eLife.54556


