3,6’-dithiopomalidomide reduces neural loss, inflammation, behavioral deficits in brain injury and microglial activation
- Graduate Institute of Medical Sciences, Taipei Medical University, Taiwan
- Drug Design & Development Section, Translational Gerontology Branch, Intramural Research Program National Institute on Aging, NIH, United States
- AevisBio Inc, United States
- AevisBio Inc, Republic of Korea
- Department of Pharmacology, School of Medicine, College of Medicine, Taipei Medical University, Taiwan
- Department of Neurological Surgery, Case Western Reserve University, United States
- Department of Neurosurgery, Taipei Medical University Hospital, Taipei Medical University, Taiwan
- Neuroscience Research Center, Taipei Medical University, Taiwan
Figures
Figure 1
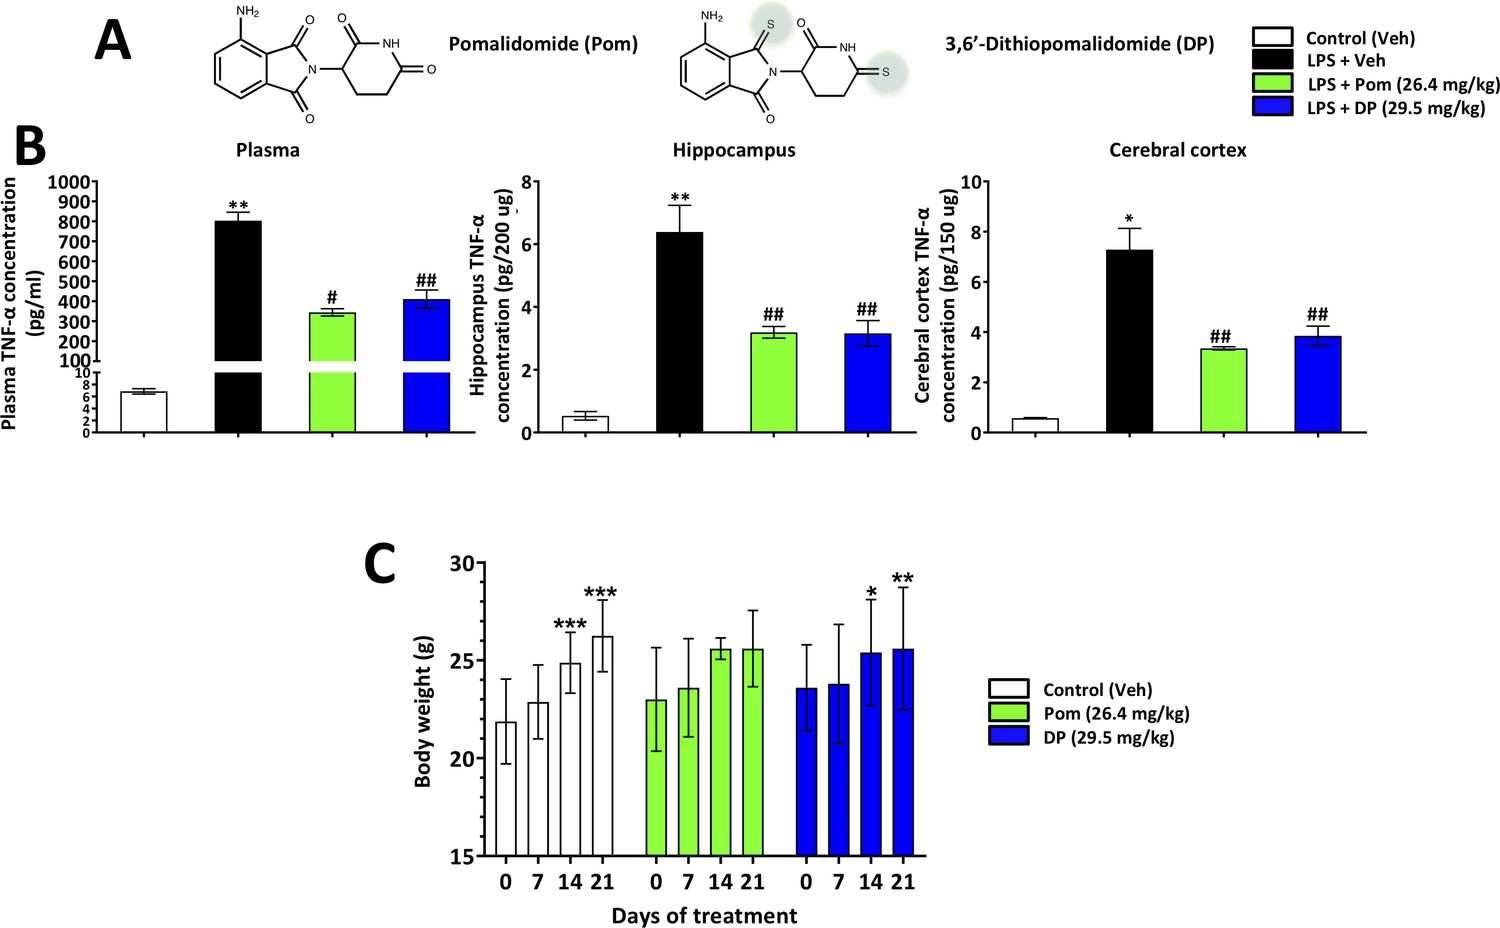
Pom and DP, at doses well tolerated by rodents, significantly reduce LPS-induced TNF-α levels in rat plasma, and hippocampal and cerebral cortical tissues.
(A) Chemical structures of Pomalidomide (Pom) and the novel analog 3,6’-Dithiopomalidomide (DP). (B) Treatment of animals with LPS markedly elevated levels of TNF-α. Pretreatment of the animals with Pom and DP significantly reduced these LPS-induced TNF-α increases across plasma and brain tissues. *, ** Refers to the effects of LPS compared to control (Veh). #, ## refers to the effect of drug treatments vs. the LPS + Veh. Values are presented as mean ± S.E.M., of n observations (Veh n = 3; LPS + Veh n = 3; LPS + Pom n = 4; LPS + DP n = 4). (C) The effects of daily administrations of Veh, Pom and DP on mouse body weight are illustrated to evaluate drug tolerability. Following 21 days of daily administration there were no adverse effects of agents on animal body weights; animals appeared well groomed and were indistinguishable from one another. *p<0.05, **p<0.01, ***p<0.001 refers to significant changes in body weight compared to body weight at day 0 (i.e. body weight prior to treatment in the same animals). Values are presented as mean ± S.E.M., of n observations (Veh n = 8; Pom n = 5; DP n = 5). There were no significant differences in body weight seen across groups following the same days of treatment.
-
Figure 1—source data 1
LPS challenge/drug tolerability.
- https://cdn.elifesciences.org/articles/54726/elife-54726-fig1-data1-v2.xlsx
Figure 2
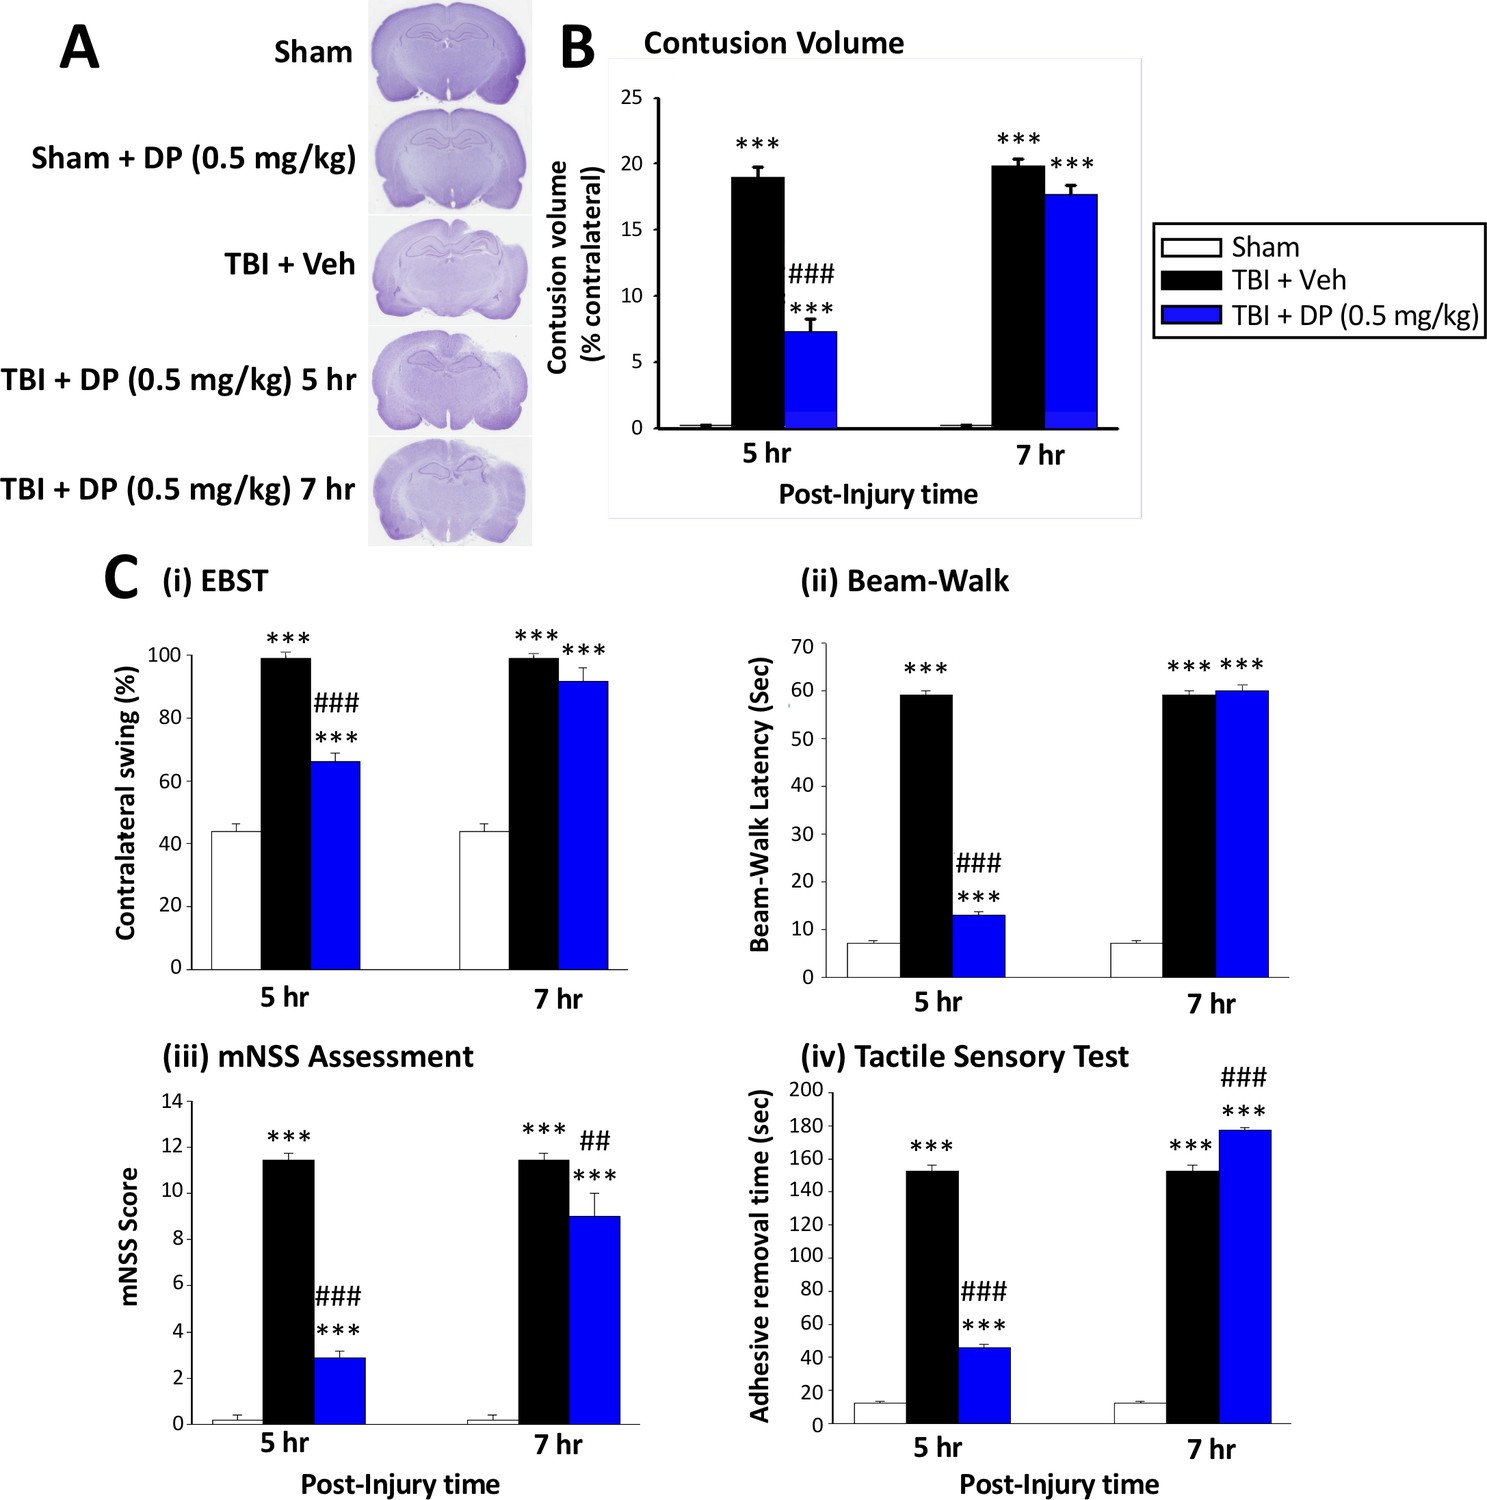
Intravenous administration of DP (0.5 mg/kg) at 5 hr but not at 7 hr after TBI significantly reduced contusion volume and behavioral impairments measured at 24 hr after TBI.
(A) Representative cresyl violet stained coronal brain sections from Sham (control without TBI), DP-treated Sham (Sham + DP 0.5 mg/kg), TBI-vehicle (TBI + Veh), and DP-treated TBI rats (TBI + DP, 0.5 mg/kg) following 5 or 7 hr treatment, (B) Intravenous administration of DP (0.5 mg/kg) at 5 hr but not at 7 hr after TBI induced a significant reduction in contusion volume relative to the TBI + Veh group. (C) Four separate behavioral outcome measures were quantified to evaluate TBI-induced deficits and their remediation by DP. These involved (i) postural asymmetry, as assessed by the elevated body swing test (EBST), (ii) motor coordination and balance measured by beam walking test, (iii) functional deficits appraised by the mNSS test, and (iv) sensory and motor function, revealed by latency in the adhesive removal test. Across all behavioral outcome measures, DP (0.5 mg/kg) significantly mitigated deficits when administered at 5 hr after TBI. Data represent the mean ± S.E.M. (n = 5 in each group). ***p<0.001 vs. Sham group; ##p<0.01, ###p<0.001 vs. TBI + Veh group.
-
Figure 2—source data 1
Initial DP TBI activity 5 vs. 7 hr post-insult administration.
- https://cdn.elifesciences.org/articles/54726/elife-54726-fig2-data1-v2.pdf
-
Figure 2—source data 2
Initial DP TBI activity 5 vs. 7 hr post-insult administration.
- https://cdn.elifesciences.org/articles/54726/elife-54726-fig2-data2-v2.xlsx
-
Figure 2—source data 3
Initial DP TBI activity 5 vs. 7 hr post-insult administration.
- https://cdn.elifesciences.org/articles/54726/elife-54726-fig2-data3-v2.xlsx
Figure 3
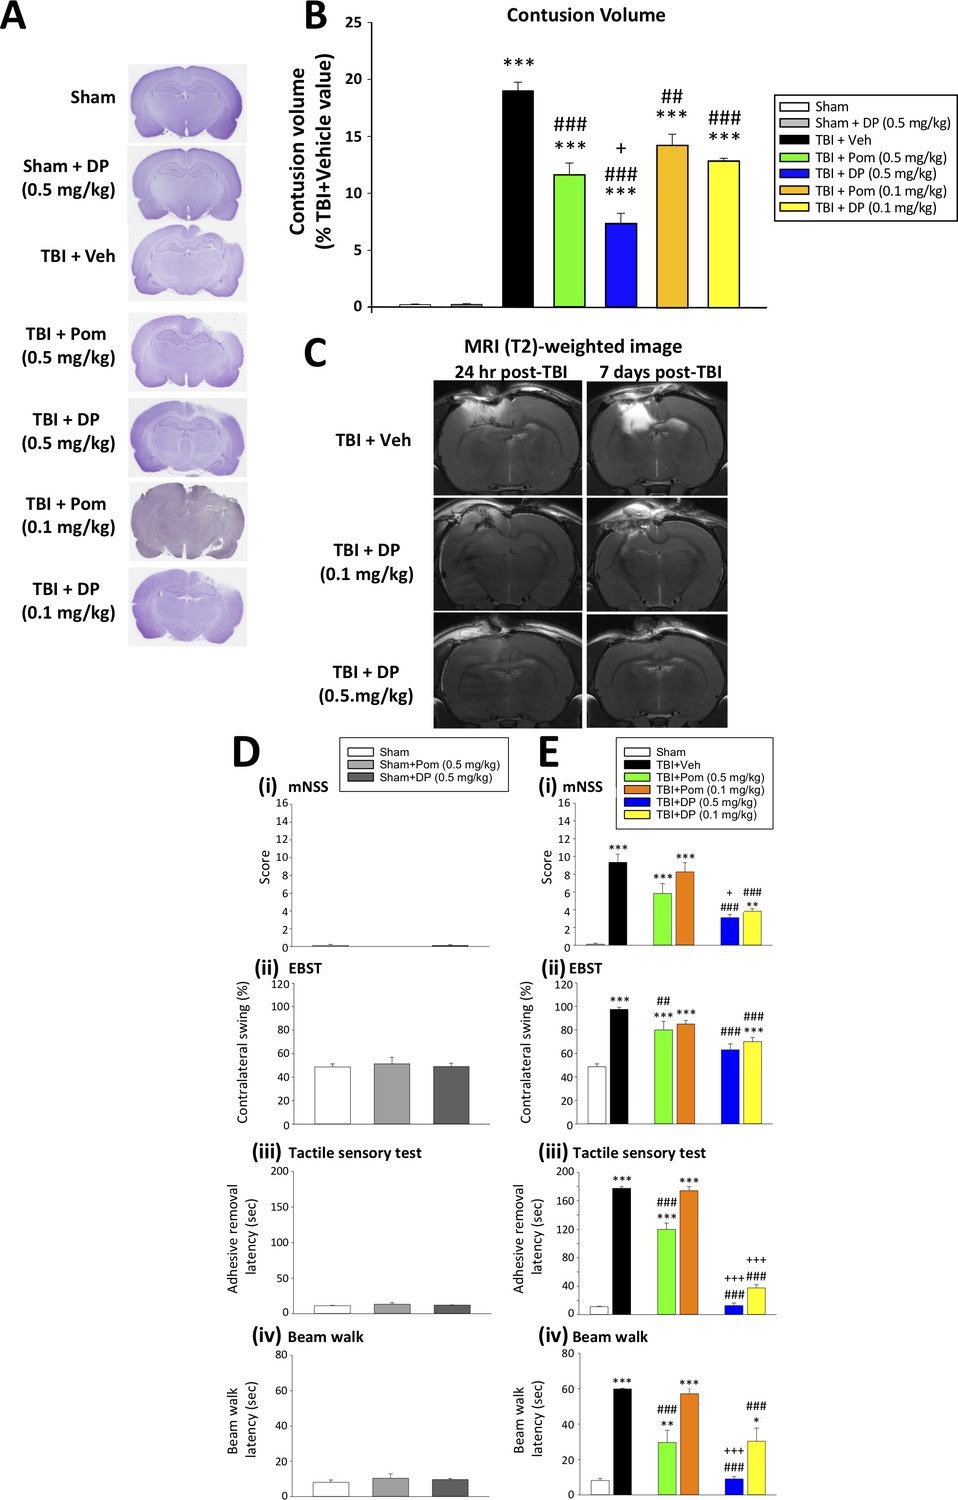
DP (0.1 and 0.5 mg/kg) and Pom (0.5 but not 0.1 mg/kg) administered at 5 hr post-injury reduce TBI-induced contusion volume and improve functional outcomes as revealed by behavioral evaluation at 24 hr after TBI.
(A) Representative cresyl violet stained coronal brain sections from Sham (control without TBI), Sham + DP (0.5 mg/kg), TBI + Veh, and TBI animals treated with DP (0.1 or 0.5 mg/kg) or with Pom (0.1 or 0.5 mg/kg). (B) The intravenous administration of DP (0.1 and 0.5 mg/kg) and Pom (0.5 and 0.1 mg/kg) resulted in a significant decrease in contusion volume relative to the TBI + Veh group, with DP (0.5 mg/kg) demonstrating significantly greater activity than Pom (0.5 mg/kg). (C) The reduction in contusion volume, evaluated by cresyl violet staining, was cross-validated in a separate cohort of TBI + DP (0.1 and 0.5 mg/kg)-dosed animals by (T2)-weighted MRI imaging at 24 hr and 7 days. Behavioral outcome measures were evaluated across (D) Sham and Sham + DP or Pom (0.5 mg/kg)-treated animals, and in (E) Sham, TBI + Veh, and TBI animals treated with DP (0.1 or 0.5 mg/kg) or Pom (0.1 or 0.5 mg/kg). Notably, DP (0.1 and 0.5 mg/kg) and Pom (0.5 mg/kg) mitigated TBI-induced deficits, with DP (0.5 mg/kg) demonstrating superior activity compared to Pom (0.5 mg/kg); importantly, Pom (0.1 mg/kg) was without efficacy. Behavioral measures involved quantification of (i) mNSS score, (ii) motor asymmetry (EBST), (ii) a tactile adhesive removal test to assess sensory and motor functioning, and (iv) beam walking for motor coordination and balance. Data represent the mean ± S.E.M. (n = 5 in each group). *p<0.05, **p<0.01, ***p<0.001 vs. the Sham group; #p<0.01, ###p<0.001 vs. the TBI + Veh group; +p<0.05, +++p<0.001 vs. the TBI + Pom (0.5 mg/kg) group.
-
Figure 3—source data 1
DP vs. Pom (5 hr post-TBI administration) comparable efficacy to mitigate contusion volume & behavioral impairments.
- https://cdn.elifesciences.org/articles/54726/elife-54726-fig3-data1-v2.pdf
-
Figure 3—source data 2
DP vs. Pom (5 hr post-TBI administration) comparable efficacy to mitigate contusion volume & behavioral impairments.
- https://cdn.elifesciences.org/articles/54726/elife-54726-fig3-data2-v2.xlsx
-
Figure 3—source data 3
DP vs. Pom (5 hr post-TBI administration) comparable efficacy to mitigate contusion volume & behavioral impairments.
- https://cdn.elifesciences.org/articles/54726/elife-54726-fig3-data3-v2.xlsx
Figure 4

Intravenous administration of DP (0.5 mg/kg) and Pom (0.5 mg/kg) at 5 hr after TBI attenuated neuronal loss at 24 hr after TBI.
(A) Low power brain section image of NeuN antibody immunohistochemical staining of the cortical region from a TBI animal showing the contusion site and area of observation (Black square). (B) Photomicrographs showing cell structures revealed by NeuN immunocytochemical staining in the ipsilateral cortex. (C) There was a significant decrease in the number of NeuN positive cells in the TBI + Veh group. Five hours post-TBI administration of DP (0.5 mg/kg) or Pom (0.5 mg/kg), with a non-significant trend for DP (0.1 mg/kg), attenuated TBI-induced neuronal loss at 24 hr. Mean ± S.E.M. (n = 4 in each group). **p<0.01, ***p<0.001 vs. the Sham group. ##p<0.01, ###p<0.001 vs. the TBI + Veh group. Scale bar in (B) = 100 μm.
-
Figure 4—source data 1
DP vs. Pom (5 hr post-TBI administration) comparable efficacy to mitigate neuronal (NeuN) cell loss.
- https://cdn.elifesciences.org/articles/54726/elife-54726-fig4-data1-v2.xlsx
Figure 5
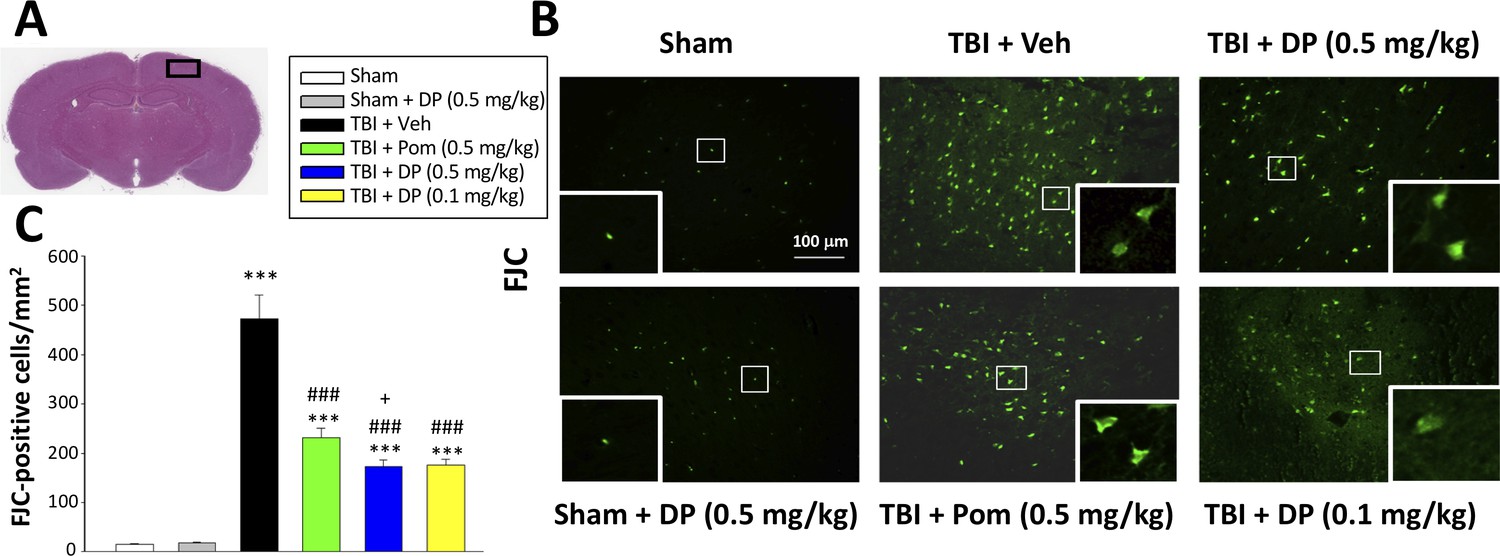
FJC staining confirms TBI-induced neurodegeneration within the contusion region, as well as significant mitigation by DP and Pom.
(A) Low power HE-stained coronal brain section from a sham animal showing area of evaluation (black rectangular box). (B) Representative photomicrographs showing the FJC-stained cortical region across animal groups at 24 hr after TBI. (C) Quantitative comparisons of mean densities of FJC-positive cells per field in the cortical contusion area at 24 hr post-injury. Notably, DP (0.1 and 0.5 mg/kg) and Pom (0.5 mg/kg) significantly reduced FJC positive neurons within the contusion area, with DP (0.5 mg/kg) showing significantly greater activity than the similar dose of Pom. Mean ± S.E.M. (n = 5 in each group). ***p<0.001 vs. the Sham group. ### p<0.001 vs. the TBI + Veh group. + p<0.05 vs. the TBI + Pom group. Scale bar = 100 μm.
-
Figure 5—source data 1
DP vs. Pom (5 hr post-TBI administration) comparable efficacy to lower FJC-labeled degenerating cells.
- https://cdn.elifesciences.org/articles/54726/elife-54726-fig5-data1-v2.xlsx
Figure 6

TBI induced elevated mRNA expression of caspase-3 and an increase of cleaved caspase-3 protein-containing neurons within the contusion margin.
Both were mitigated by DP or Pom. (A) TBI induced a marked elevation in mRNA levels of caspase-3, which was fully mitigated by DP (0.5 mg/kg) and significantly lowered by Pom (0.5 mg/kg). Mean ± S.E.M. (n = 5 in each group). **p<0.01 vs. the Sham group. #p<0.05, ###p<0.001 vs. the TBI + Veh group. (B) Representative photomicrographs demonstrating, by immunofluorescence, the preferential localization of cleaved caspase-3 protein, a marker of cellular apoptosis, within neurons following TBI. Cleaved caspase-3 immunoreactivity is shown in green, NeuN (a marker for neurons) is shown in red, and yellow indicates colocalization. (C) Quantitative comparison of numbers of cleaved-caspase-3 containing neurons per field in the cortical contusion area across animal groups at 24 hr. Notably, DP (particularly the 0.5 mg/kg dose) substantially mitigated the TBI-induced increase in cleaved caspase-3 containing neurons, with greater efficacy than a similar Pom dose. Mean ± S.E.M. (n = 4 in each group). **p<0.01, ***p<0.001 vs. the Sham group. #p<0.05, ###p<0.001 vs. the TBI + Veh group. ++p<0.01 vs. the TBI + Pom group. Scale bar in (B) = 100 μm.
-
Figure 6—source data 1
DP vs. Pom (5 hr post-TBI administration) comparable efficacy to reduce cleaved caspase-3 protein-containing neurons.
- https://cdn.elifesciences.org/articles/54726/elife-54726-fig6-data1-v2.xlsx
-
Figure 6—source data 2
DP vs. Pom (5 hr post-TBI administration) comparable efficacy to reduce cleaved caspase-3 protein-containing neurons.
- https://cdn.elifesciences.org/articles/54726/elife-54726-fig6-data2-v2.xlsx
Figure 7
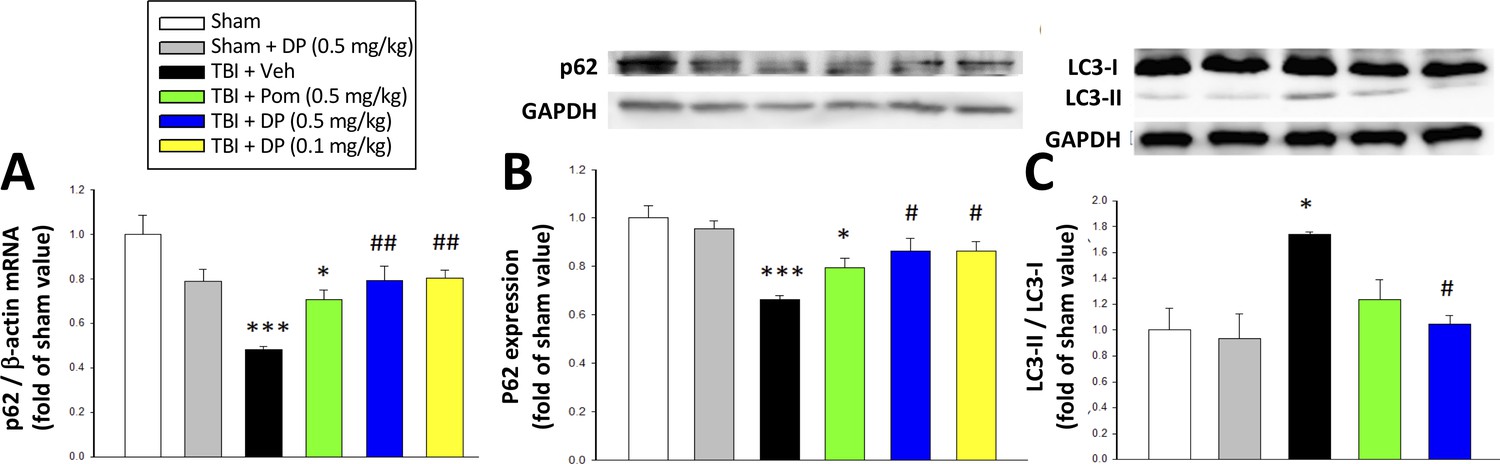
Post-injury administration of DP but not Pom attenuated TBI-induced markers of autophagy, as evidenced by mitigation of TBI-induced changes in mRNA and protein expression of p62 and the conversion of LC3-I to LC3-II.
(A) TBI induced a reduction in the mRNA expression of p62, resulting in (B) a decrease in p62 protein levels and, additionally, (C) an increase in the expression in the LC3-II/LC3-I ratio (an indicator for late-stage autophagy) in the cortical contusion region at 24 hr. Importantly, each of these TBI-induced changes was significantly inhibited by DP, but not Pom (0.5 mg/kg).Data are expressed as mean ± S.E.M. (n = 5 in each group). *p<0.05, ***p<0.001 vs. the Sham group. #p<0.05, ##p<0.01 vs. the TBI + Veh group.
-
Figure 7—source data 1
DP vs. Pom (5 hr post-TBI administration) comparable efficacy to mitigate autophagy impairments.
- https://cdn.elifesciences.org/articles/54726/elife-54726-fig7-data1-v2.xlsx
-
Figure 7—source data 2
DP vs. Pom (5 hr post-TBI administration) comparable efficacy to mitigate autophagy impairments.
- https://cdn.elifesciences.org/articles/54726/elife-54726-fig7-data2-v2.xlsx
-
Figure 7—source data 3
DP vs. Pom (5 hr post-TBI administration) comparable efficacy to mitigate autophagy impairments.
- https://cdn.elifesciences.org/articles/54726/elife-54726-fig7-data3-v2.xlsx
Figure 8
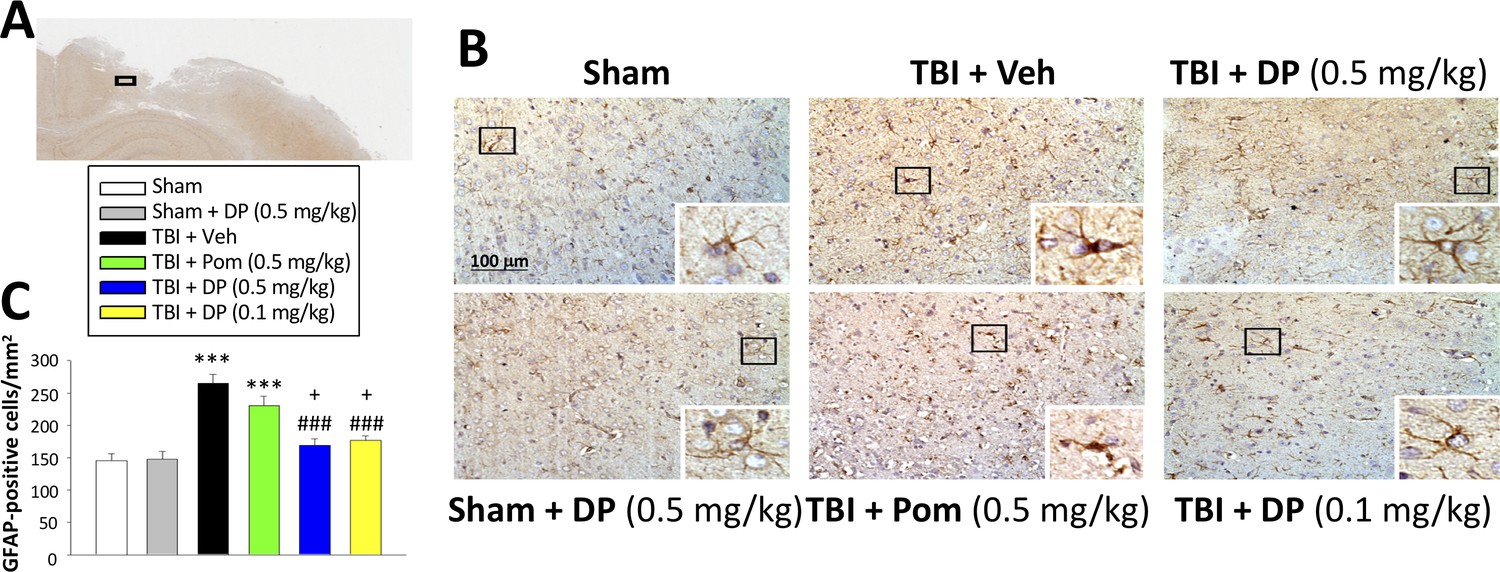
Post-injury administration of DP but not Pom ameliorated TBI-induced astrogliosis.
(A) A low power image of a coronal brain section immunohistochemically stained with GFAP antibody (a marker for astrocytes) in the cortical region from a TBI + Veh animal showing the area of observation (black rectangle). (B) Representative photomicrographs showing GFAP immunocytochemical staining across animal groups at 24 hr post TBI or sham challenge, with astrocyte cell morphology magnified in lower right boxes. (C) There was a significant elevation in the number of GFAP positive cells in TBI + Veh animals, in which post-injury treatment with DP (0.1 and 0.5 mg/kg) but not Pom (0.5 mg/kg) significantly and substantially mitigated. Mean ± S.E.M. (n = 4 in each group). ***p<0.001 compared with the sham group. ###p<0.001 compared with the TBI + Veh group. +p<0.05 compared with the TBI + Pom group. Scale bar (B) = 100 μm.
-
Figure 8—source data 1
DP vs. Pom (5 hr post-TBI administration) comparable efficacy to lower astrogliosis (GFAP elevation).
- https://cdn.elifesciences.org/articles/54726/elife-54726-fig8-data1-v2.xlsx
Figure 9
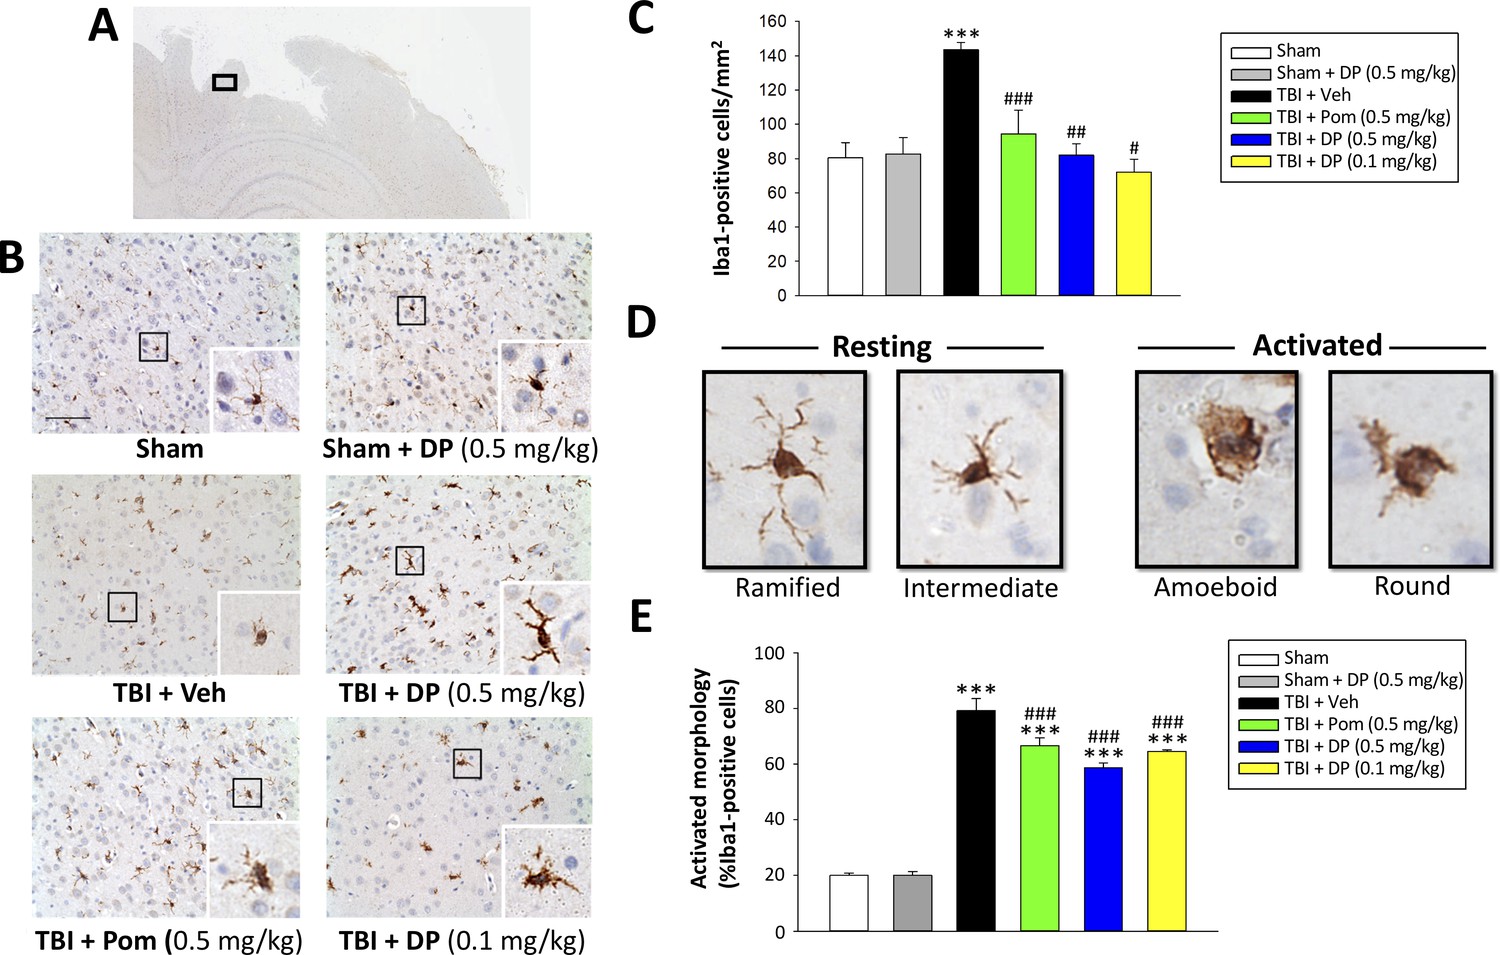
Post-injury administration of DP and Pom reduced TBI-induced microglial activation, as evaluated by Iba-1 immunohistochemistry at 24 hr in the cortical contusion area.
(A) A low power image of a brain section immuno-histochemically stained with Iba-1 antibody in the cortical region from a TBI + Veh animal showing the contusion site and area of observation (black rectangular box). (B) Representative photomicrographs of immunostaining with Iba-1 showing an increase in microglial activation after TBI, as revealed by an elevation in the number of Iba-1 positive cells/mm2 and a change in their morphologic phenotype from a ‘resting’ ramified/intermediate form in the sham group to a ‘reactive’ amoeboid/round morphology (detailed in D).(C) Quantification of Iba-1 positive cells/mm2 across groups demonstrated a DP (0.1 and 0.5 mg/kg) and Pom (0.5 mg/kg)-mediated reduction in TBI-induced microglial changes. (E) Iba-1-positive cells were morphologically characterized in relation to their activation/resting state and expressed as a percent of their total number. Mean ± S.E.M. (n = 5 in each group). ***p<0.001 vs. the sham group. #p<0.05, ##p<0.01, ###p<0.001 vs. the TBI + veh group. Scale bar (B) = 100 μm.
-
Figure 9—source data 1
DP vs. Pom (5 hr post-TBI administration) comparable efficacy to mitigate microglial cell activation.
- https://cdn.elifesciences.org/articles/54726/elife-54726-fig9-data1-v2.xlsx
Figure 10
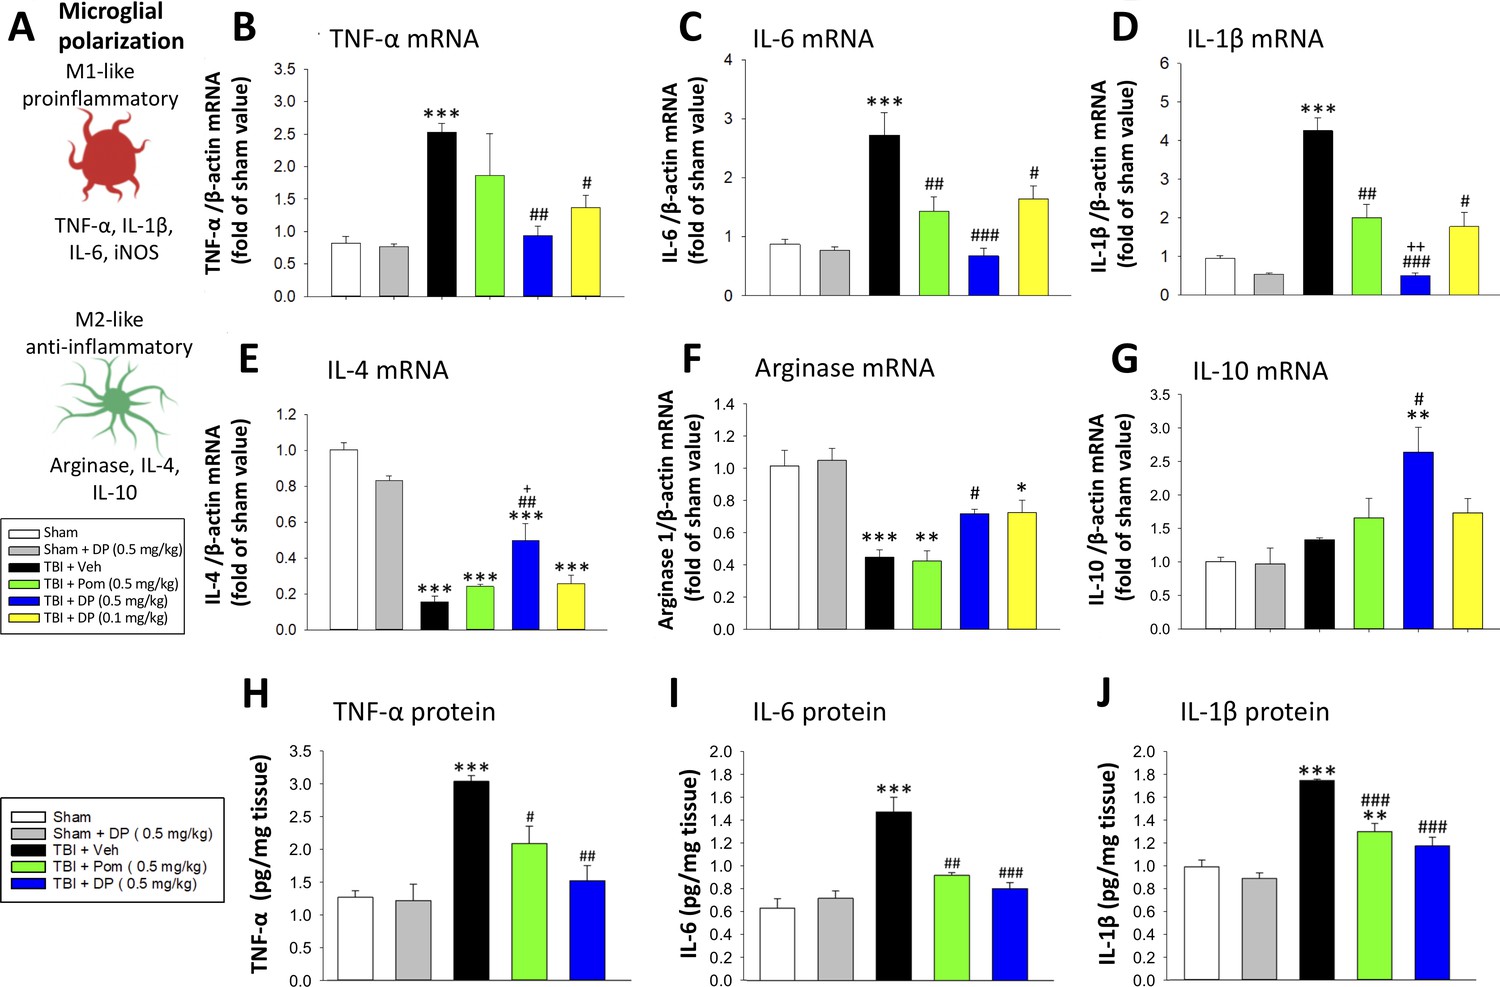
Post-injury treatment with DP or Pom significantly reduced TBI-induced cortical pro-inflammatory cytokine mRNA expression and protein levels.
(A) The expression levels of markers of a pro- and anti-inflammatory microglial (M1-, M2-like) state were quantified. TBI-induced significant elevations in mRNA levels of (B) TNF-α, (C) IL-6 and (D) IL-1β and declines in (E) IL-4 and (F) arginase-1 within the cortical contusion region, when evaluated 24 hr post injury. These changes were substantially and significantly mitigated by DP (0.1 and 0.5 mg/kg) and, to a lesser degree, by Pom (0.5 mg/kg) treatment, with DP 0.5 mg/kg demonstrating greater efficacy. (G) IL-10 mRNA levels were mildly elevated by TBI, and significantly elevated in the DP (0.5 mg/kg)-treated group. TBI-induced changes in pro-inflammatory cytokine mRNA expression were mirrored in protein levels (H, I, J), and DP (0.5 mg/kg) and, to a lesser extent, Pom (0.5 mg/kg) mitigated these. Mean ± S.E.M. (n = 5 in each group). ***p<0.001 vs. the Sham group. #p<0.05, ##p<0.01, ###p<0.001 vs. the TBI + Veh group. ++ p<0.01 vs. the TBI + Pom group.
-
Figure 10—source data 1
DP vs. Pom (5 hr post-TBI administration) comparable efficacy to normalize brain cytokines.
- https://cdn.elifesciences.org/articles/54726/elife-54726-fig10-data1-v2.xlsx
-
Figure 10—source data 2
DP vs. Pom (5 hr post-TBI administration) comparable efficacy to normalize brain cytokines.
- https://cdn.elifesciences.org/articles/54726/elife-54726-fig10-data2-v2.xlsx
-
Figure 10—source data 3
DP vs. Pom (5 hr post-TBI administration) comparable efficacy to normalize brain cytokines.
- https://cdn.elifesciences.org/articles/54726/elife-54726-fig10-data3-v2.xlsx
-
Figure 10—source data 4
DP vs. Pom (5 hr post-TBI administration) comparable efficacy to normalize brain cytokines.
- https://cdn.elifesciences.org/articles/54726/elife-54726-fig10-data4-v2.xlsx
-
Figure 10—source data 5
DP vs. Pom (5 hr post-TBI administration) comparable efficacy to normalize brain cytokines.
- https://cdn.elifesciences.org/articles/54726/elife-54726-fig10-data5-v2.xlsx
-
Figure 10—source data 6
DP vs. Pom (5 hr post-TBI administration) comparable efficacy to normalize brain cytokines.
- https://cdn.elifesciences.org/articles/54726/elife-54726-fig10-data6-v2.xlsx
-
Figure 10—source data 7
DP vs. Pom (5 hr post-TBI administration) comparable efficacy to normalize brain cytokines.
- https://cdn.elifesciences.org/articles/54726/elife-54726-fig10-data7-v2.xlsx
-
Figure 10—source data 8
DP vs. Pom (5 hr post-TBI administration) comparable efficacy to normalize brain cytokines.
- https://cdn.elifesciences.org/articles/54726/elife-54726-fig10-data8-v2.xlsx
-
Figure 10—source data 9
DP vs. Pom (5 hr post-TBI administration) comparable efficacy to normalize brain cytokines.
- https://cdn.elifesciences.org/articles/54726/elife-54726-fig10-data9-v2.xlsx
Figure 11
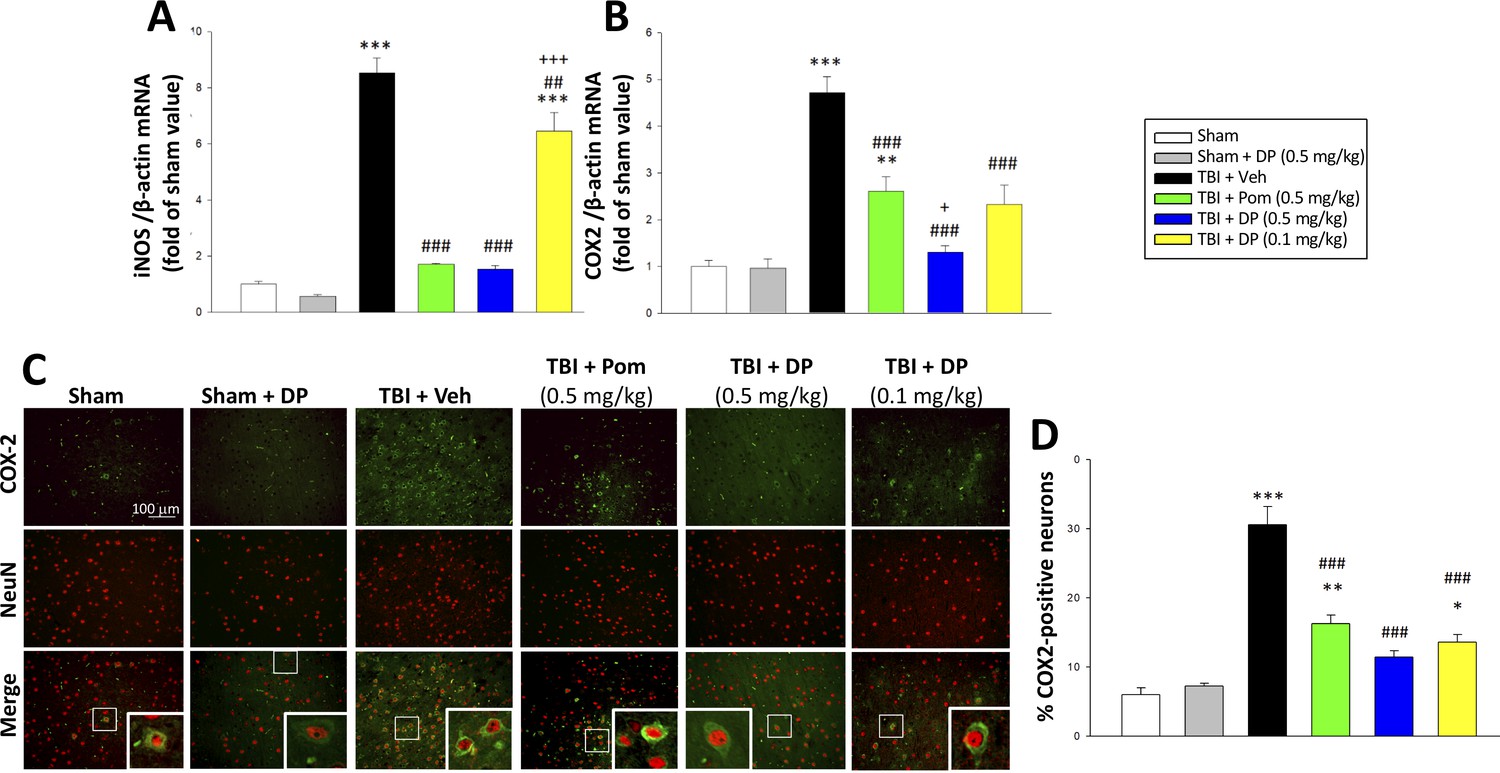
TBI-induced elevations in mRNA expression levels of iNOS and COX2, as well as of COX2 protein expressing neurons, which were largely reversed by post-injury treatment with DP or Pom.
TBI induced a significant increase in mRNA levels of (A) iNOS, and (B) COX2, markers of inflammation. DP and Pom mitigated these elevations in iNO2 and COX2. Mean ± S.E.M. (n = 5 in each group). **p<0.01, ***p<0.001 vs. the sham group. ##p<0.01, ###p<0.001 compared with the TBI + Veh group. +p<0.05, +++p<0.001 vs. the TBI + Pom group. (C) The immunofluorescence of COX-2 and NeuN protein was evaluated in ipsilateral cortical brain tissue across groups and is shown in representative photomicrographs. COX-2 immunoreactivity is shown in green, and NeuN (a marker for neurons) is shown in red. Colocalization is indicated by yellow. (D) TBI induced a significant increase in the fraction of neurons expressing COX2, which was significantly attenuated by DP and Pom. There was a significant decrease in the number of COX-2 positive neurons in TBI + DP group. Mean ± S.E.M. (n = 4 in each group). *p<0.05, **p<0.01, ***p<0.001 vs. the sham group. ###p<0.001 vs. the TBI + Veh group. Scale bar (B) = 100 μm.
-
Figure 11—source data 1
DP vs. Pom (5 hr post-TBI administration) comparable efficacy to normalize brain inflammatory enzymes iNOS and COX2.
- https://cdn.elifesciences.org/articles/54726/elife-54726-fig11-data1-v2.xlsx
-
Figure 11—source data 2
DP vs. Pom (5 hr post-TBI administration) comparable efficacy to normalize brain inflammatory enzymes iNOS and COX2.
- https://cdn.elifesciences.org/articles/54726/elife-54726-fig11-data2-v2.xlsx
-
Figure 11—source data 3
DP vs. Pom (5 hr post-TBI administration) comparable efficacy to normalize brain inflammatory enzymes iNOS and COX2.
- https://cdn.elifesciences.org/articles/54726/elife-54726-fig11-data3-v2.xlsx
Figure 12
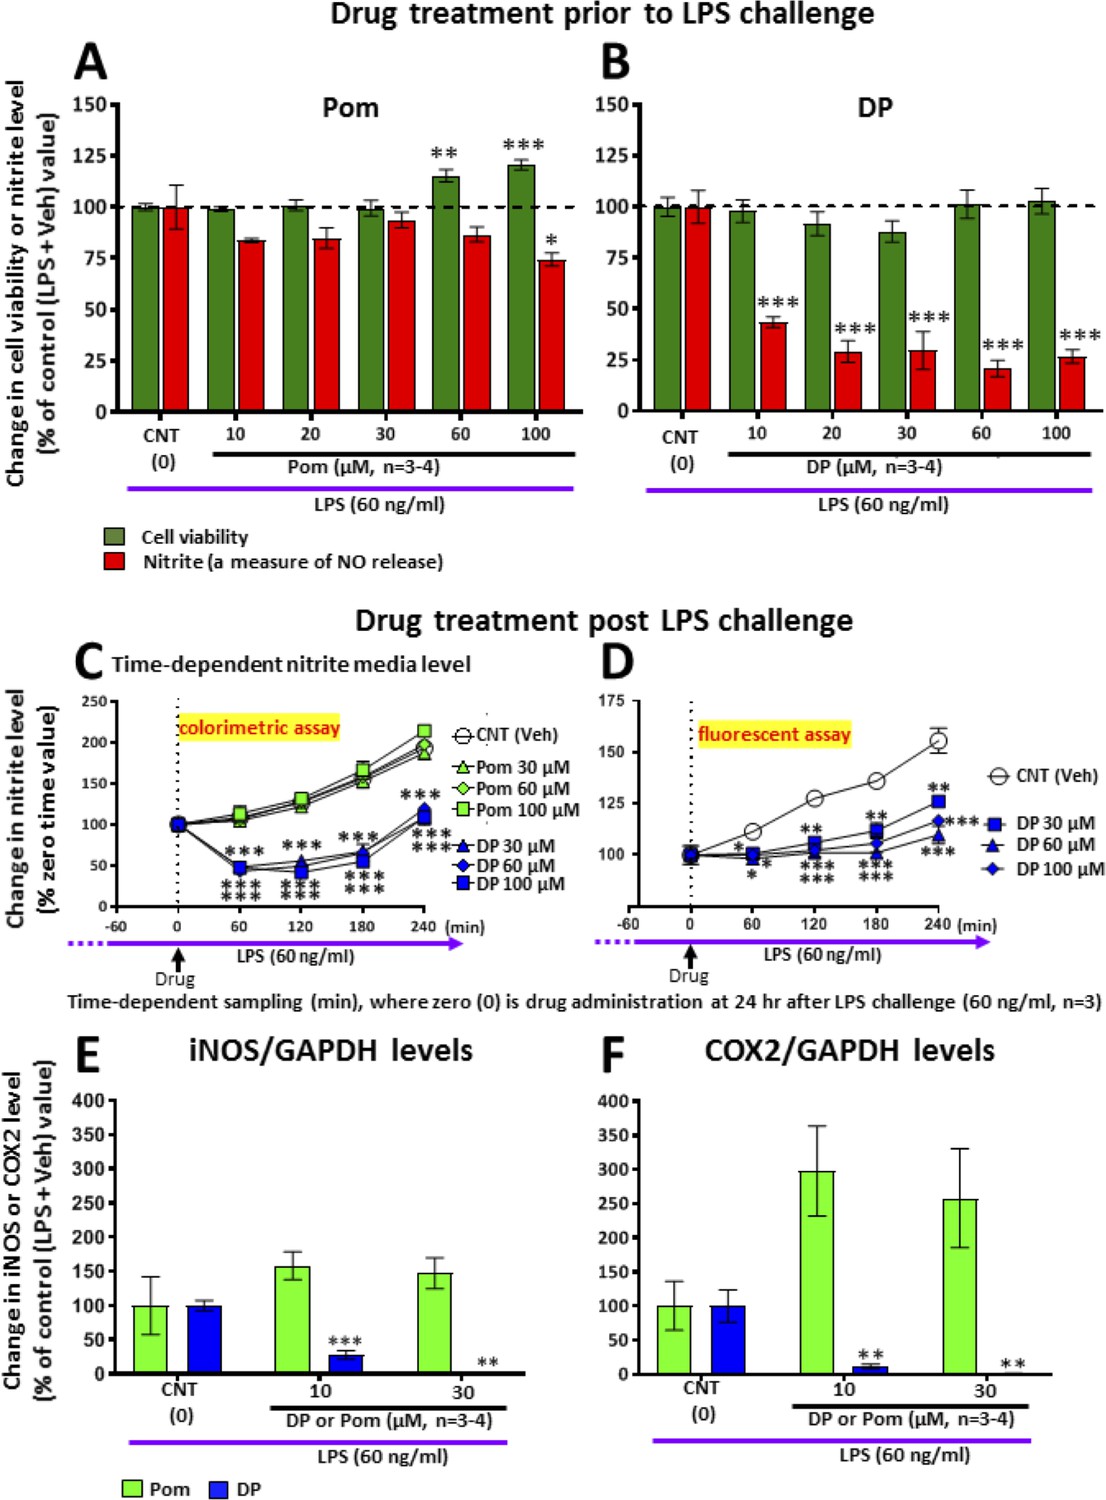
LPS challenge in cultured RAW 264.7 cells induced an increase in nitrite (a stable marker of NO), iNOS and COX2, which were mitigated by pre- and post-treatment with DP.
Cultured RAW 264.7 cells were pre-treated with either (A) Pom or (B) DP (10–100 μM) and challenged with LPS (60 ng/ml) 1 hr later. At 24 hr following LPS challenge, cellular viability and nitrite levels, together with (E) iNOS and (F) COX2 (normalized to GAPDH protein levels) were quantified. DP and Pom were well tolerated at concentrations up to 100 μM, and DP significantly lowered LPS-induced elevations in nitrite, iNOS and COX2 levels. To evaluate whether DP could mitigate LPS-induced nitrite elevation when inflammation was already established, RAW 264.7 cells were challenged with LPS (60 ng/ml) and with post-treatment with DP and Pom 24 hr thereafter (C, D). Effects of drugs on nitrite levels were cross-validated using different nitrite assays, DP significantly lowered LPS-induced nitrite levels. *p<0.05, **p<0.01, ***p<0.001 vs. the Control (LPS + Veh) group.
-
Figure 12—source data 1
DP vs. Pom comparable efficacy to mitigate inflammation measures in RAW 264.7 cells challenged with LPS.
- https://cdn.elifesciences.org/articles/54726/elife-54726-fig12-data1-v2.xlsx
Figure 13
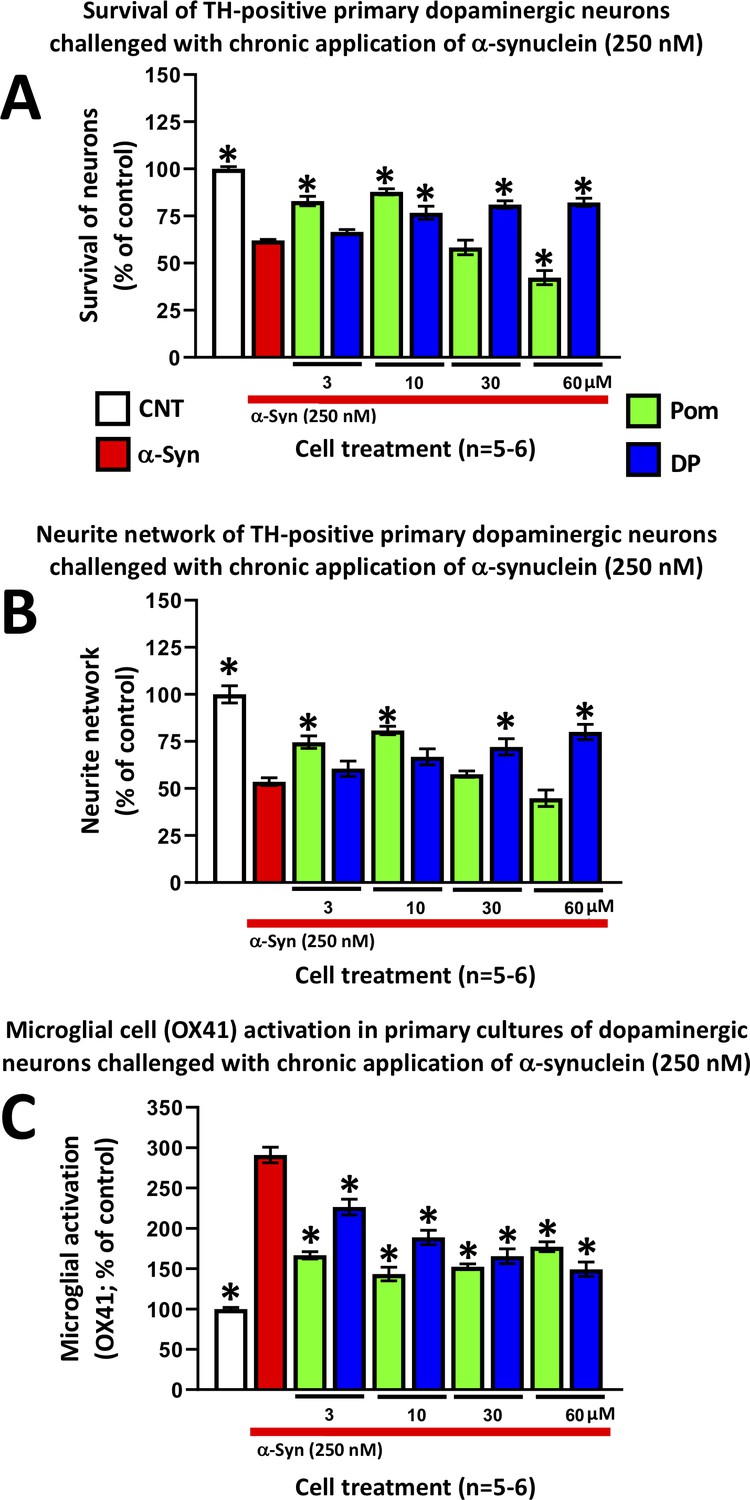
DP and Pom mitigate α-synuclein-induced losses of dopaminergic neurons and neurites as well as microglial cell activation in primary cultures.
Chronic (72 hr) application of oligomeric α-synuclein (250 nM) to a primary co-culture of dopaminergic neurons and microglia resulted in (A) a reduction of dopaminergic neuronal cell survival, (B) a reduction in neurite number per cell, and (C) an elevated expression of OX41-positive microglial cells, indicative of microglial activation. A 1 hr pretreatment with DP or Pom significantly mitigated these α-synuclein-induced effects. Mean ± S.E.M. (n = 5–6 per group). *p<0.05 vs. the α-synuclein alone (red bar) group.
-
Figure 13—source data 1
DP vs. Pom comparable efficacy to mitigate a-synuclein-induced impairments in primary dopaminergic cell cultures.
- https://cdn.elifesciences.org/articles/54726/elife-54726-fig13-data1-v2.docx
Tables
Table 1
Six classical physicochemical factors are used to calculate a CNS MPO score that provides a predictive drug-like value.
A set of 6 important physicochemical parameters (i) lipophilicity (cLogP), (ii) calculated distribution coefficient at physiological pH (7.4) (cLogD), molecular weight, (iv) topological polar surface area, (v) number of hydrogen bond donors, and (vi) the most basic center (pKa), are combined together to provide a composite MPO score of predictive drug-like attributes for the central nervous system.
| Compound | cLogP | cLogD (pH7.4) | Molecular weight (g/mol) | Topological polar surface area (Å2) | No. hydrogen bond donors | Strongest basic pKa calculation | CNS MPO score |
|---|---|---|---|---|---|---|---|
| Pomalidomide | –0.16 | –0.16 | 273.2 | 109.57 | 2 | 1.56 | 4.8 |
| 3,6′ Dithiopomalidomide | 0.97 | 0.96 | 305.4 | 5.43 | 2 | 2.33 | 5.5 |
Additional files
Download links
A two-part list of links to download the article, or parts of the article, in various formats.
Downloads (link to download the article as PDF)
Open citations (links to open the citations from this article in various online reference manager services)
Cite this article (links to download the citations from this article in formats compatible with various reference manager tools)
3,6’-dithiopomalidomide reduces neural loss, inflammation, behavioral deficits in brain injury and microglial activation
eLife 9:e54726.
https://doi.org/10.7554/eLife.54726


