Gut Helicobacter presentation by multiple dendritic cell subsets enables context-specific regulatory T cell generation
- Department of Internal Medicine, Division of Rheumatology, Washington University School of Medicine, United States
- Lymphocyte Biology Section, Laboratory of Immune System Biology, National Institute of Allergy and Infectious Diseases, National Institutes of Health, United States
- Department of Pathology, Division of Immunobiology, Washington University School of Medicine, United States
- Department of Dermatology, Department of Immunology, Pittsburgh Center for Pain Research, University of Pittsburgh, United States
Figures
Figure 1 with 1 supplement
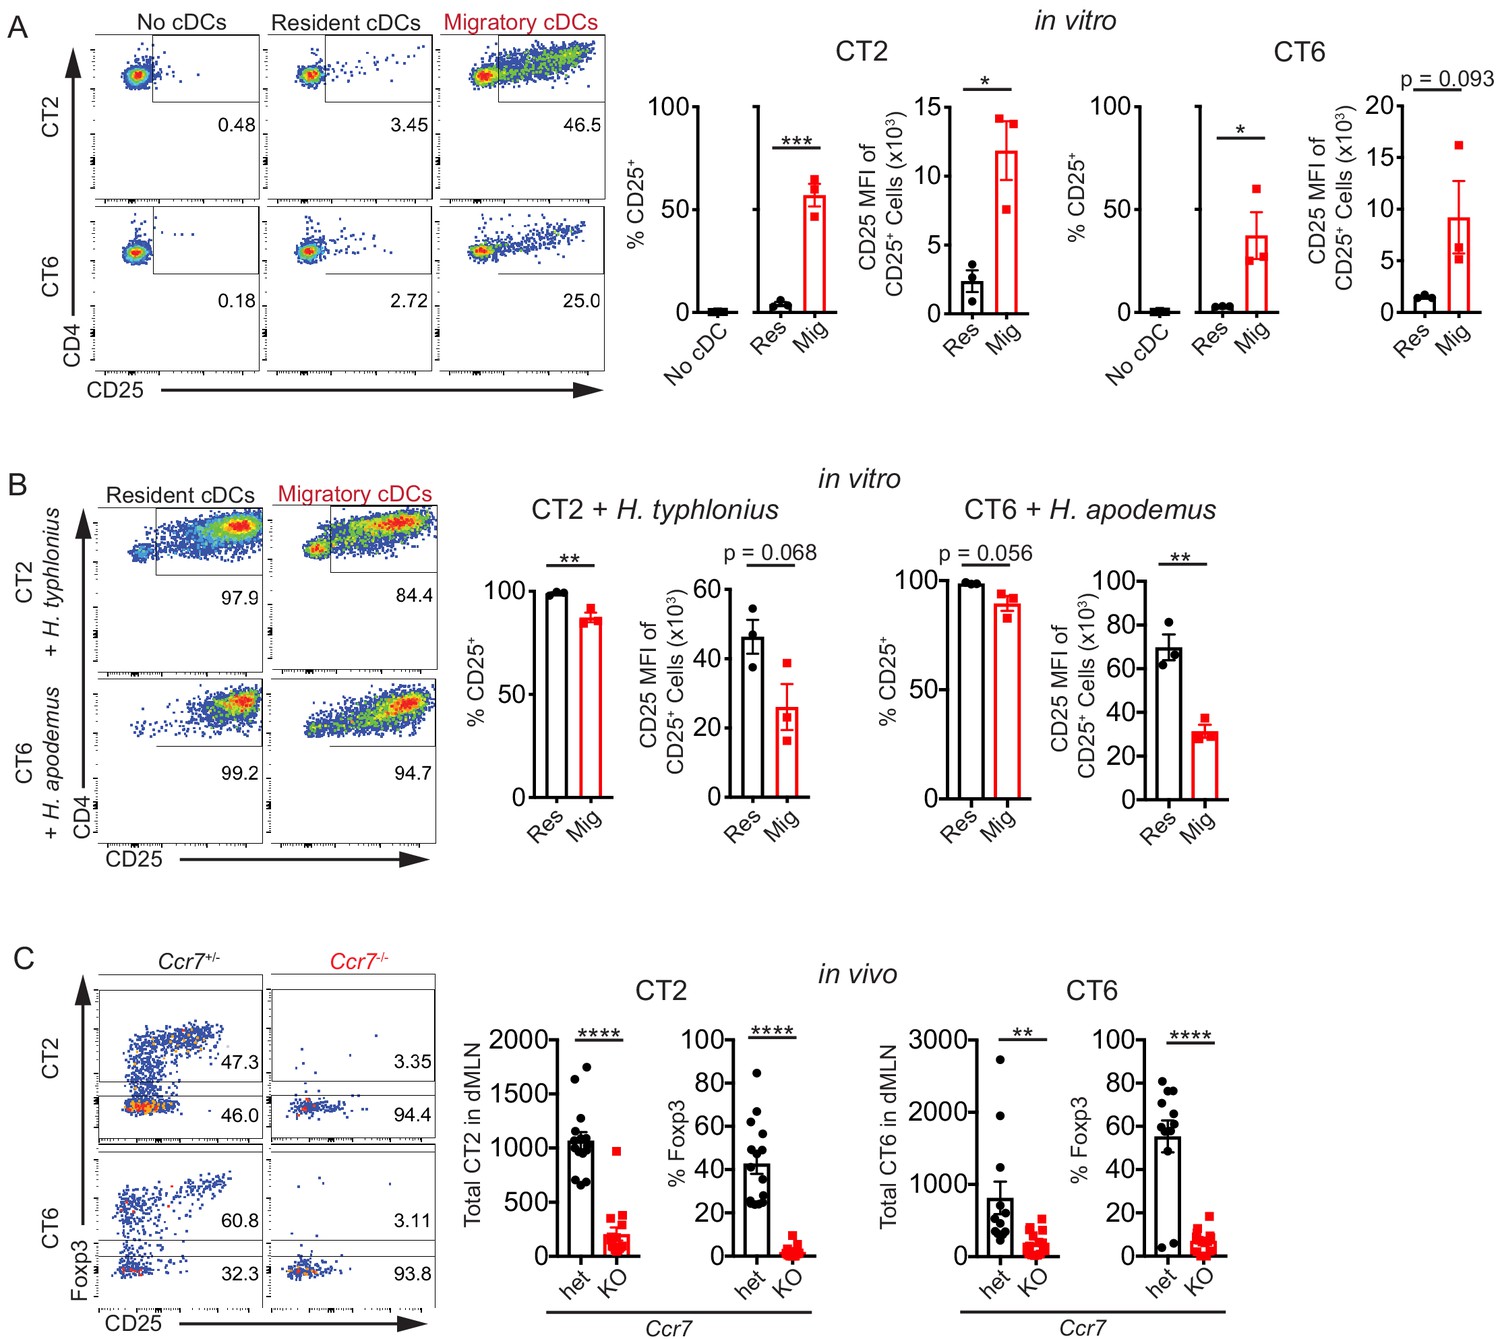
Migratory conventional dendritic cells (cDCs) present Helicobacter antigens to naïve T cells.
(A) Migratory cDCs present endogenously loaded Helicobacter antigens to T cells. Resident (MHCIIint CD11chi) or migratory (MHCIIhi CD11cint) cDCs from the distal mesenteric lymph node (dMLN) were cultured with naïve (CD44lo CD62Lhi CD4+) CT2 or CT6 T cells for 2 days. The percentage of CT2 and CT6 T cells that upregulated CD25 and the CD25 median fluorescence intensity (MFI) of CD25+ cells were analyzed by flow cytometry (expt. = 3). (B) Both resident and migratory cDCs can present exogenous Helicobacter antigens. dMLN resident and migratory cDCs were cultured as in (A) with the addition of autoclaved isolates of H. typhlonius (CT2) or H. apodemus (CT6) (expt. = 3). (C) Migratory cDCs are necessary for CT2 and CT6 activation in vivo. Naïve CT2 or CT6 (5 × 10⁴) were injected into littermate Ccr7+/– or Ccr7–/– mice. Transferred cells in the dMLN were analyzed 1 week later for total cells recovered and Foxp3IRES-GFP or Thy1.1 expression (expt. = 3). Each dot represents an independent experiment except in (C), where each dot represents one mouse. Mean ± SEM shown. p-values from Student’s t-test (A–C) excluding no cDC condition (A); *p<0.05, **p<0.01, ***p<0.001, ****p<0.0001. The following figure supplement is available for Figure 1—figure supplement 1.
Figure 1—figure supplement 1
Migratory conventional denditic cells (cDCs) present Helicobacter antigens to naïve T cells.
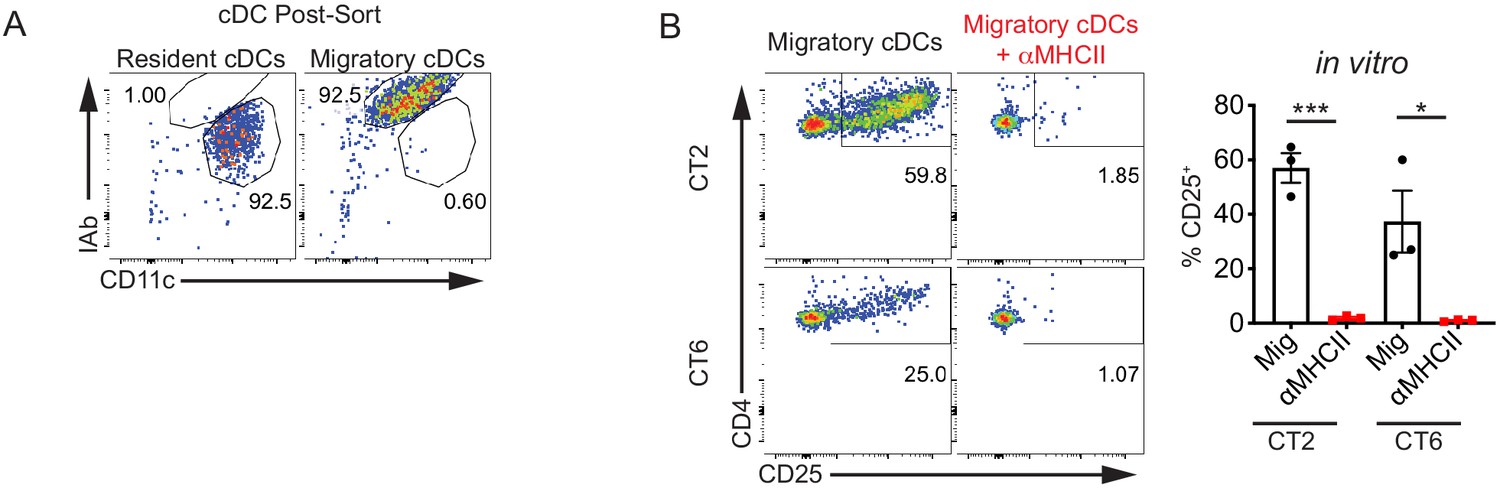
(A) Representative post-sort analysis of resident (MHCIIint CD11chi) or migratory (MHCIIhi CD11cint) conventional dendritic cells (cDCs) from the distal mesenteric lymph node (dMLN) used in Figure 1A,B.
(B) CT2 and CT6 activation ex vivo by migratory cDCs is MHC Class II-dependent. Migratory cDCs from the dMLN were cultured as in Figure 1A in the absence or presence of blocking MHC Class II antibody (expt. = 3). Each dot represents an independent experiment. Mean ± SEM shown. p-values from Student’s t-test (B); *p<0.05, **p<0.01, ***p<0.001, ****p<0.0001.
Figure 2 with 1 supplement
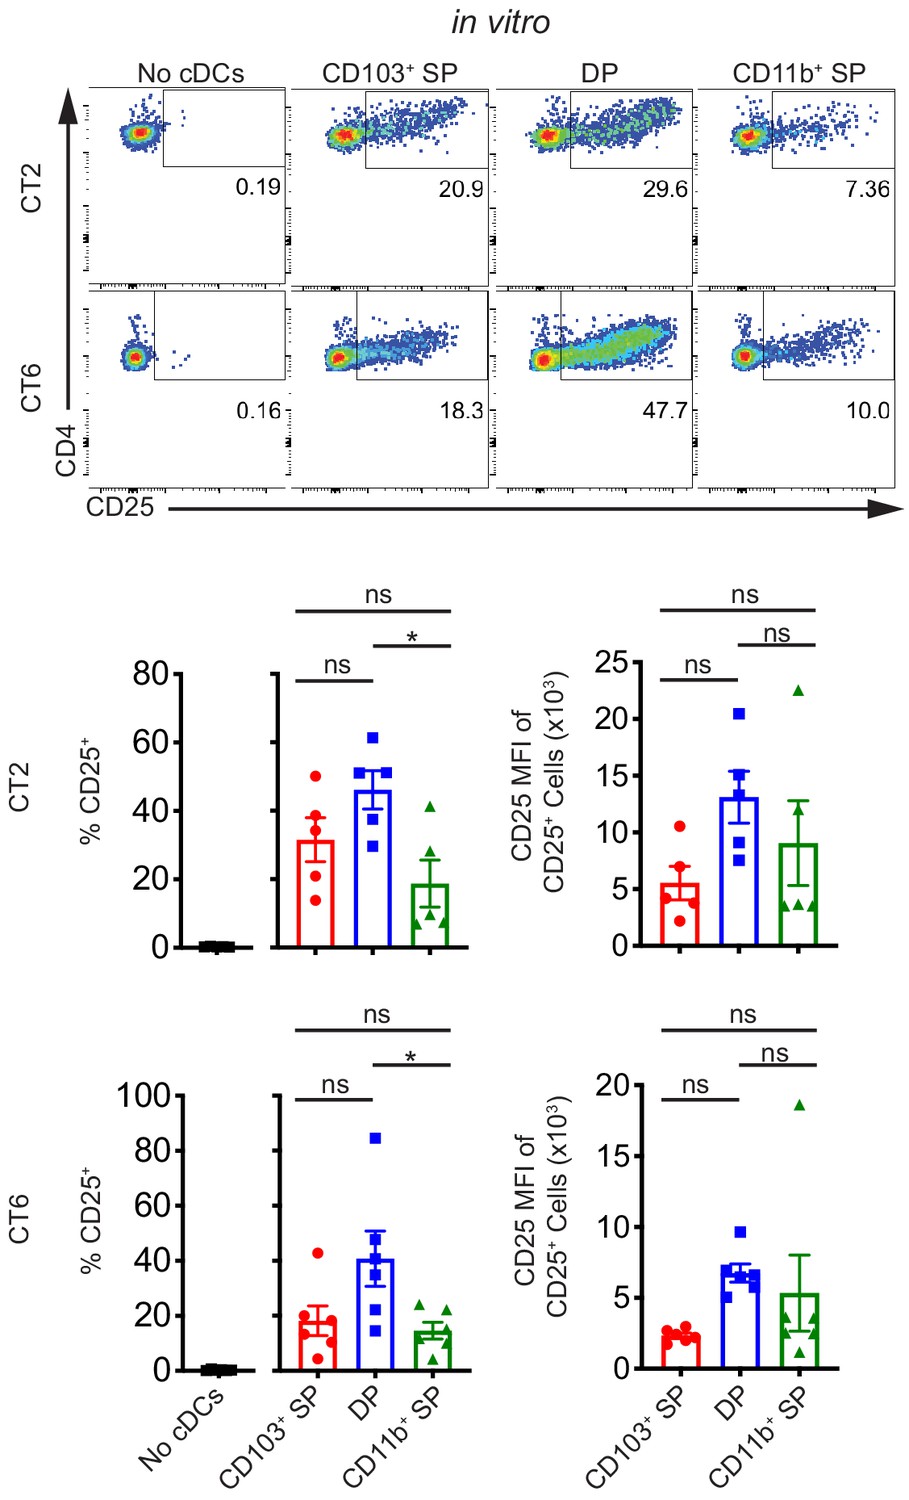
Multiple subsets of migratory conventional dendritic cells (cDCs) present Helicobacter antigens to naïve T cells at homeostasis.
All three main subsets of migratory cDCs present endogenous Helicobacter antigens to T cells ex vivo. Migratory CD103+ CD11b– cDC1s (CD103+ SP), CD103+ CD11b+ cDC2s (DP), or CD103– CD11b+ cDC2s (CD11b+ SP) were sorted from the distal mesenteric lymph node (dMLN) and cultured with naïve CT2 and CT6 T cells as in Figure 1A (expt. = 5–6). Each dot represents an individual experiment. Mean ± SEM is shown. p-values from Tukey’s multiple comparisons test excluding no cDC condition; *p<0.05, **p<0.01, ***p<0.001, ****p<0.0001. The following figure supplement is available for Figure 2—figure supplement 1.
Figure 2—figure supplement 1
Multiple subsets of migratory conventional dendritic cells (cDCs) present Helicobacter antigens to naïve T cells at homeostasis.
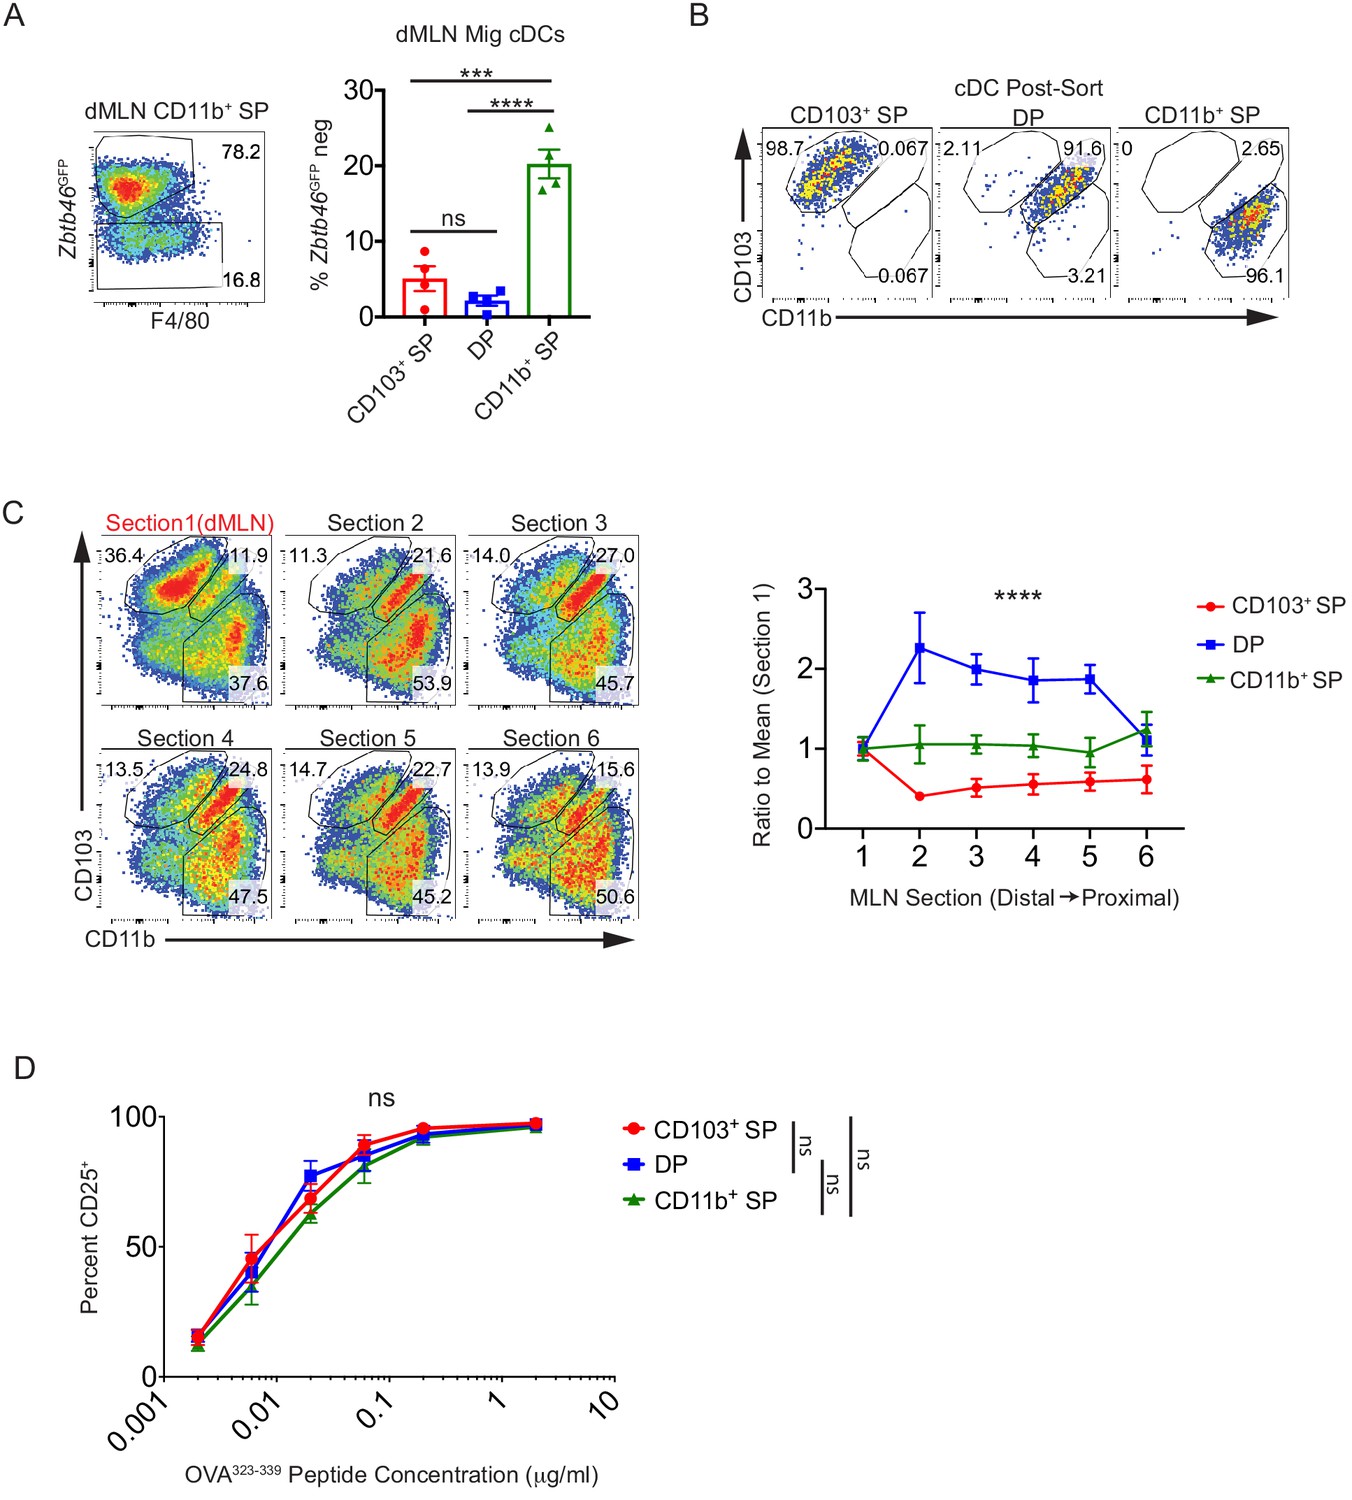
(A) Antigen presenting cells (APCs) in the CD103– CD11b+ cDC2 (CD11b+ SP) gate are mostly conventional dendritic cells (cDCs) by Zbtb46GFP expression.
Representative fluorescence-activated cell sorting (FACS) plots of CD11b+ SP APCs showing low/intermediate F4/80 expression in Zbtb46GFP– cells. (B) Representative post-sort analysis of CD103+ CD11b– cDC1s (CD103+ SP), CD103+ CD11b+ cDC2s (DP), or CD11b+ SP migratory cDCs from the distal mesenteric lymph node (dMLN) used for experiments in Figure 2. (C) Migratory cDC1s are increased in the dMLN of wild-type mice relative to the proximal MLN. Migratory cDC subset compositions were analyzed by dividing the mesenteric LN chain into six sections, roughly corresponding to one lymph node per section, from the colon-draining dMLN (section 1, red) to the proximal LN (section 6). Data was normalized to the subset frequency in the dMLN (MLN1) (expt. = 2, n = 3). (D) There is comparable T cell activation by all subsets of migratory cDCs. T cell activation potential of migratory cDC subsets was quantified by coculturing cDCs with naïve OT-II T cells as in Figure 1A as well as indicated concentrations of OVA323-339 peptide (expt. = 5). Each dot represents an individual mouse (A) or the mean of indicated experiments (C and D). Mean ± SEM (A, C, and D) shown. p-values from Tukey’s multiple comparisons tests (A); two-way repeated measures ANOVA of cDC subset (C); mixed effects analysis of repeated measures of cDC subset with Tukey’s multiple comparisons tests (D); *p<0.05, **p<0.01, ***p<0.001, ****p<0.0001. The following source data are available for (A and B): Figure 2—figure supplement 1—source data 1 (C) and Figure 2—figure supplement 1—source data 2 (D).
-
Figure 2—figure supplement 1—source data 1
Migratory cDC1s are increased in the dMLN of wild-type mice relative to the proximal MLN (pMLN), Figure 2—figure supplement 1C raw data.
- https://cdn.elifesciences.org/articles/54792/elife-54792-fig2-figsupp1-data1-v2.xlsx
-
Figure 2—figure supplement 1—source data 2
Comparable T cell activation by all subsets of migratory conventional dendritic cells (cDCs), Figure 2—figure supplement 1D raw data.
- https://cdn.elifesciences.org/articles/54792/elife-54792-fig2-figsupp1-data2-v2.xlsx
Figure 3 with 1 supplement
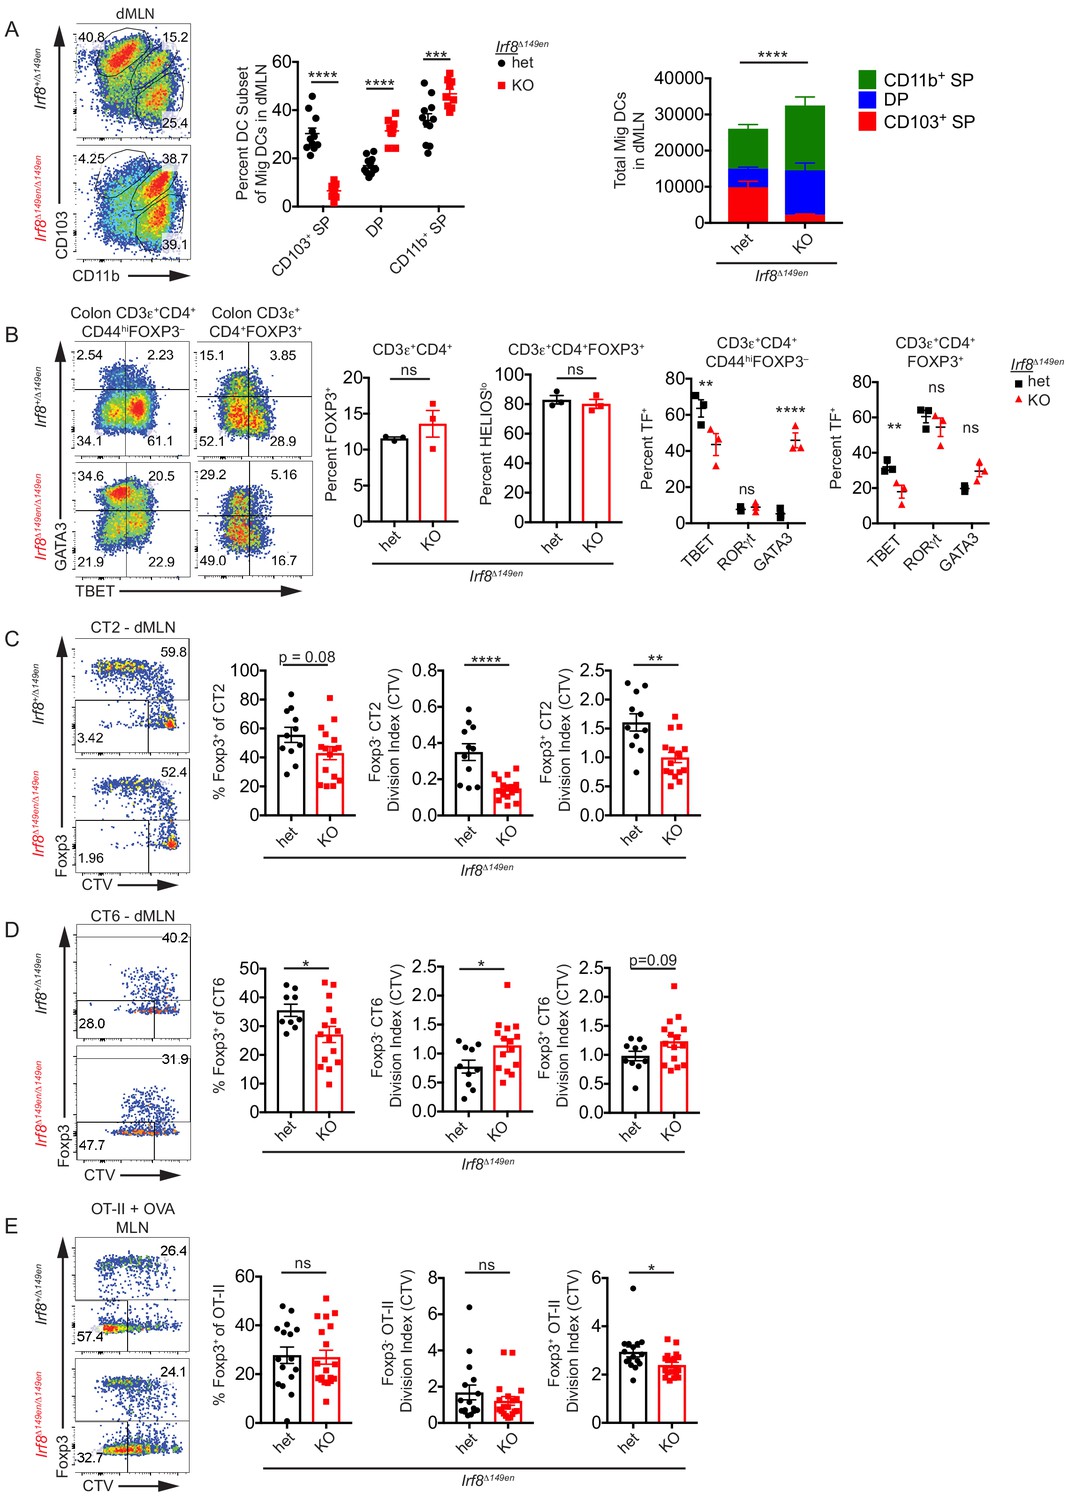
CD103+ CD11b– cDC1s are not required for Helicobacter-specific peripheral regulatory T (pTreg) differentiation in vivo.
(A) Deficiency of CD103+ CD11b– cDC1s in the distal mesenteric lymph node (dMLN) of Irf8Δ149en/Δ149en mice. Representative fluorescence-activated cell sorting (FACS) plot and quantification of migratory conventional dendritic cell (cDC) subsets in the dMLN of littermate Irf8+/Δ149en and Irf8Δ149en/Δ149en mice (expt. = 3, n = 9–11). (B) Decreased frequency of Th1 and TBET+ Treg cells in the colon lamina propria (cLP) of Irf8Δ149en/Δ149en mice. Representative FACS plots and intracellular staining quantification of FOXP3, HELIOS, TBET, RORγt, and GATA3 expression in cLP are shown (expt. = 2). (C and D) Helicobacter-specific T cell activation and Treg cell differentiation are not dramatically altered in cDC1-deficient mice. Congenically marked 5 × 10⁴ naïve CT2 (C) or 105 naïve CT6 (D) were transferred into littermate Irf8+/Δ149en and Irf8Δ149en/Δ149en mice and analyzed for Foxp3IRES-GFP or Thy1.1 expression and cell trace violet (CTV) dilution in the dMLN after 7 days (expt. = 3 each). (E) T cell activation and Treg cell differentiation in oral tolerance are not altered by loss of cDC1s. 5 × 10⁴ naïve OT-II cells were transferred into littermate Irf8+/Δ149en and Irf8Δ149en/Δ149en mice, which were gavaged with 50 mg OVA on consecutive days and analyzed as in (C and D) (expt. = 5). Each dot represents an individual mouse. Mean ± SEM (A–E) or + SEM (A, right) shown. p-values from Sidak’s multiple comparisons test (A, middle), two-way ANOVA subset/genotype interaction (A, right); Student’s t-test (B, middle), Sidak’s multiple comparisons test (B, right); Student’s t-test (C–E); *p<0.05, **p<0.01, ***p<0.001, ****p<0.0001. The following figure supplement is available for Figure 3—figure supplement 1. The following source data are available for (A–E): Figure 3—source data 1 (A, right).
-
Figure 3—source data 1
Deficiency of CD103+ CD11b– cDC1s in the distal mesenteric lymph node (dMLN) of Irf8Δ149en/Δ149en mice, Figure 3A raw data.
- https://cdn.elifesciences.org/articles/54792/elife-54792-fig3-data1-v2.xlsx
Figure 3—figure supplement 1
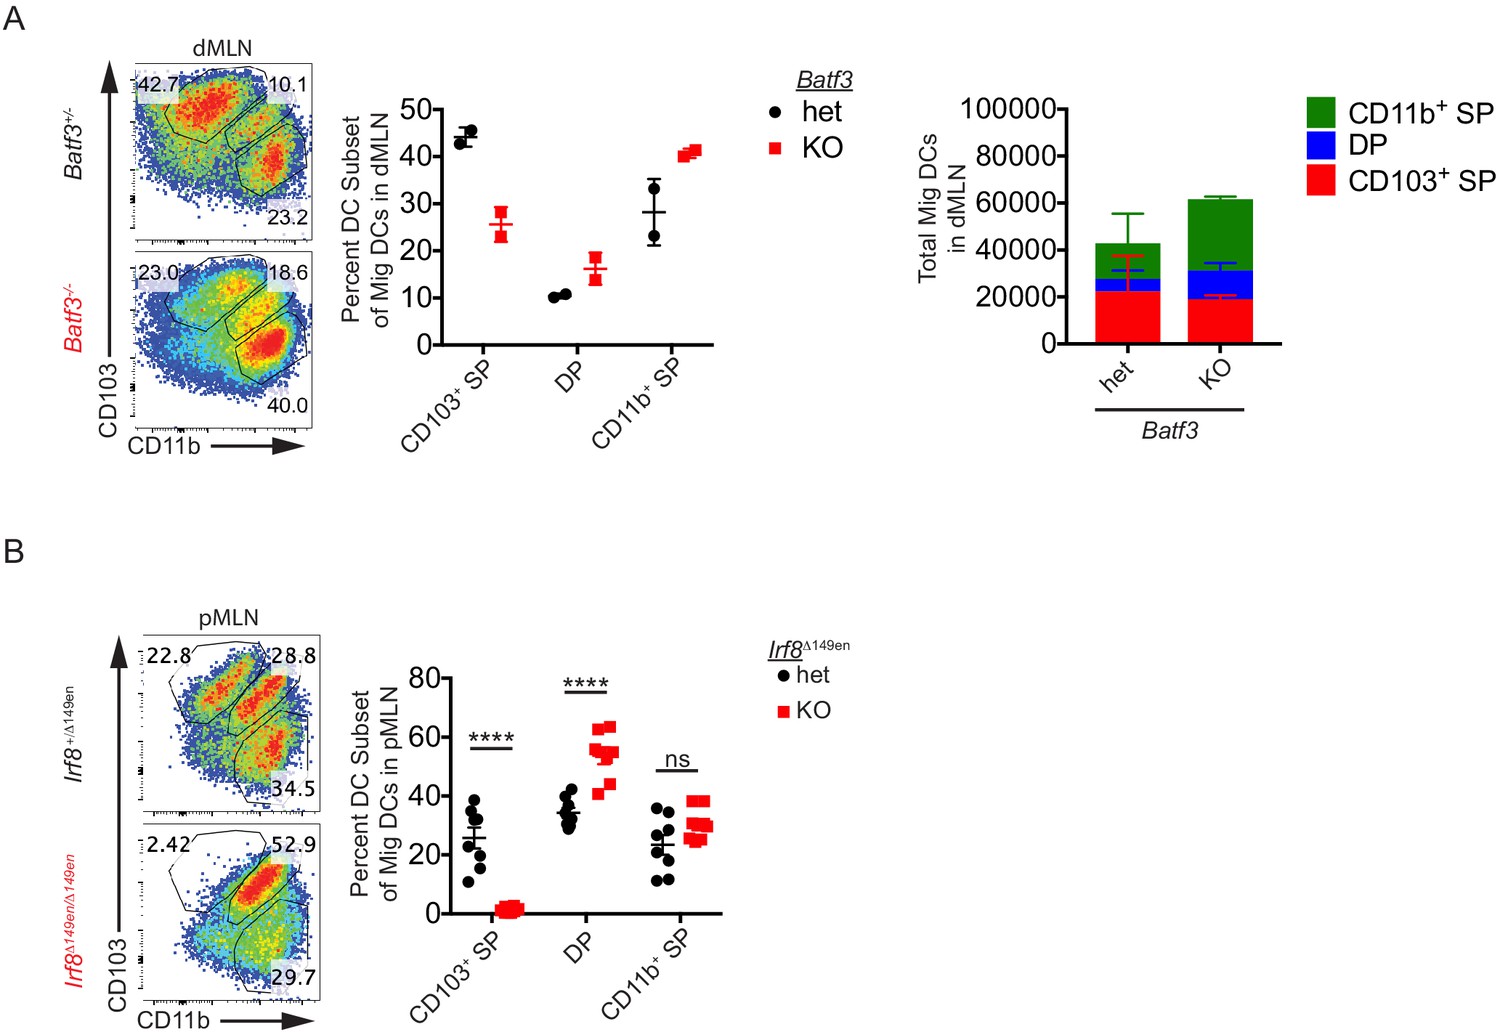
CD103+ CD11b– cDC1s are not required for Helicobacter-specific peripheral regulatory T (pTreg) differentiation in vivo.
(A) Frequency, but not number, of CD103+ cDC1s are reduced in the distal mesenteric lymph node (dMLN) of Batf3–/– mice. Representative fluorescence-activated cell sorting (FACS) plots and quantification of migratory conventional dendritic cell (cDC) subsets in the dMLN of littermate Batf3+/– and Batf3–/– mice (expt. = 2, n = 2). (B) Deficiency of CD103+ CD11b– cDC1s in the proximal MLN (pMLN) of Irf8Δ149en/Δ149en mice. Representative FACS plot and quantification of migratory cDC subsets in the pMLN of littermate Irf8+/Δ149en and Irf8Δ149en/Δ149en mice (expt. = 3). Each dot represents an individual mouse. Mean ± SEM (A and B) or + SEM (A, right) shown. p-values from Sidak’s multiple comparisons test (B); *p<0.05, **p<0.01, ***p<0.001, ****p<0.0001. The following source data are available for (A and B): Figure 3—figure supplement 1—source data 1 (A, right).
-
Figure 3—figure supplement 1—source data 1
Frequency, but not number, of CD103+ cDC1s are reduced in the distal mesenteric lymph node (dMLN) of Batf3–/– mice, Figure 3—figure supplement 1A raw data.
- https://cdn.elifesciences.org/articles/54792/elife-54792-fig3-figsupp1-data1-v2.xlsx
Figure 4 with 1 supplement

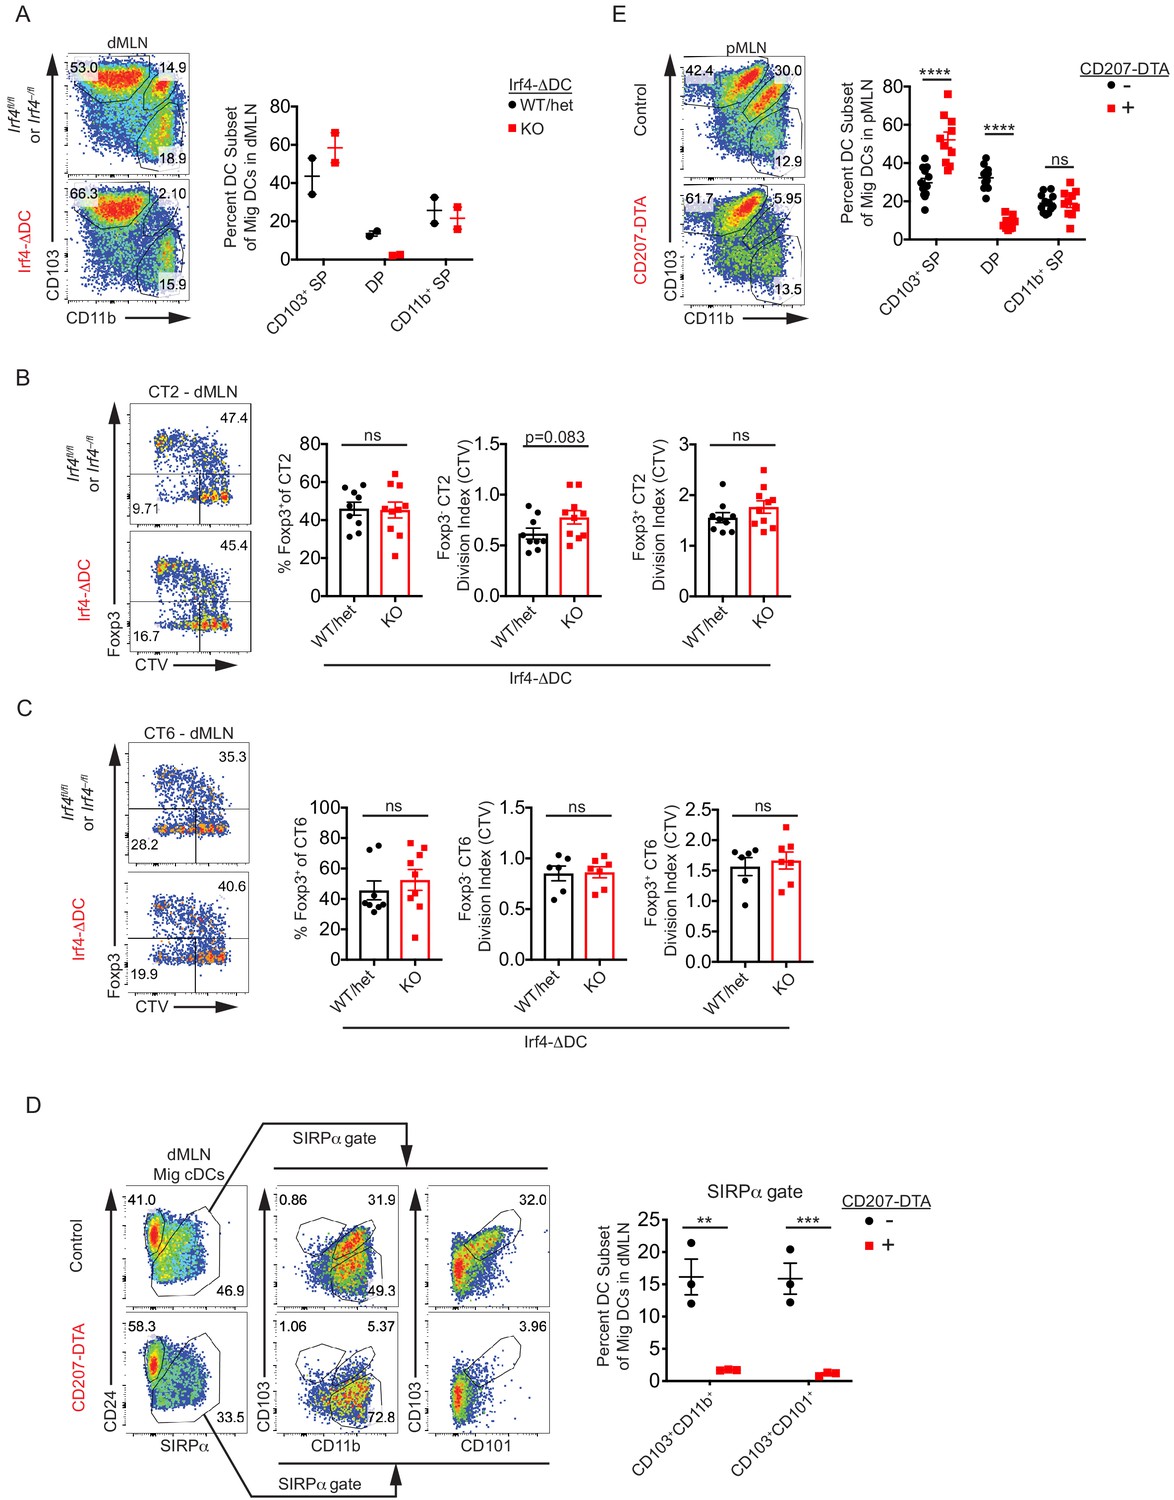
CD103+ CD11b+ cDC2s are not necessary for in vivo Helicobacter-specific peripheral regulatory T (pTreg) differentiation.
(A) Double positive CD103+ CD11b+ (DP) cDC2s are lost in the distal mesenteric lymph node (dMLN) of CD207-DTA mice. Representative fluorescence-activated cell sorting (FACS) plot and quantification of migratory conventional dendritic cell (cDC) subsets in the dMLN of littermate control (WT, Batf3+/–, or Irf8+/Δ149en mice) and CD207-DTA mice (expt. = 7, n = 10). (B) The frequencies of T cell subsets in the colon lamina propria (cLP) are unchanged in CD207-DTA mice. Representative FACS plots and intracellular staining quantification of FOXP3, HELIOS, TBET, RORγt, and GATA3 expression in cLP are shown (expt. = 3). (C and D) Helicobacter-specific T cell activation and Treg cell differentiation are not altered in DP cDC2-deficient mice. Congenically-marked 5 × 10⁴ naïve CT2 (C) or 105 naïve CT6 (D) were transferred into littermate control and CD207-DTA mice and analyzed for Foxp3IRES-GFP or Thy1.1 expression and cell trace violet (CTV) dilution in the dMLN after 7 days (expt. = 8, 7, respectively). (E) Treg cell differentiation in oral tolerance is increased with the loss of DP cDC2s. 5 × 10⁴ naïve OT-II cells were transferred into littermate WT and CD207-DTA mice, which were gavaged with 50 mg OVA on consecutive days and analyzed as in (C and D) (expt. = 5). Each dot represents an individual mouse. Mean ± SEM (A–E) or + SEM (A, right). p-values from Sidak’s multiple comparisons test (A, middle), two-way ANOVA subset/genotype interaction (A, right); Student’s t-test (B, middle), Sidak’s multiple comparisons test (B, right); Student’s t-test (C–E); *p<0.05, **p<0.01, ***p<0.001, ****p<0.0001. The following figure supplement is available for Figure 4—figure supplement 1. The following source data are available for (A–E): Figure 4—source data 1 (A, right).
-
Figure 4—source data 1
Double positive CD103+ CD11b+ (DP) cDC2s are lost in the distal mesenteric lymph node (dMLN) of CD207-DTA mice, Figure 4A raw data.
- https://cdn.elifesciences.org/articles/54792/elife-54792-fig4-data1-v2.xlsx
Figure 4—figure supplement 1
CD103+ CD11b+ cDC2s are not necessary for in vivo Helicobacter-specific peripheral regulatory T (pTreg) differentiation.
(A) Double positive CD103+ CD11b+ (DP) cDC2s are lost in the distal mesenteric lymph node (dMLN) of Irf4-ΔDC mice.
Representative fluorescence-activated cell sorting (FACS) plots and quantification of migratory conventional dendritic cell (cDC) subsets in the dMLN of littermate control (Irf4fl/fl or Irf4–/fl) and Irf4-ΔDC mice (expt. = 2). (B and C) CT2 and CT6 peripheral regulatory T (pTreg) cell differentiation is unaffected in Irf4-ΔDC mice. Congenically marked 5 × 10⁴ naïve CT2 (B) or 105 naïve CT6 (C) were transferred into littermate Irf4fl/fl, Irf4–/fl, and Irf4-ΔDC mice and analyzed for Foxp3IRES-GFP or Thy1.1 expression and cell trace violet (CTV) dilution in the dMLN after 7 days (expt. = 3, except for CT6 CTV where expt. = 2). (D) Analysis of additional cDC markers shows that DP cDC2s are lost in CD207-DTA mice. Representative FACS plots and quantification of CD103+ CD11b+ and CD103+ CD101+ SIRPα+ cDC2s in the dMLN of littermate control and CD207-DTA mice (expt. = 1). (E) Deficiency of CD103+ CD11b+ cDC2s in the proximal MLN (pMLN) of CD207-DTA mice. Representative FACS plot and quantification of migratory cDC subsets in the pMLN of littermate control and CD207-DTA mice (expt. = 3). Each dot represents an individual mouse. Mean ± SEM shown. p-values from Student’s t-test (B and C) or Sidak’s multiple comparisons test (D and E); *p<0.05, **p<0.01, ***p<0.001, ****p<0.0001.
Figure 5 with 2 supplements
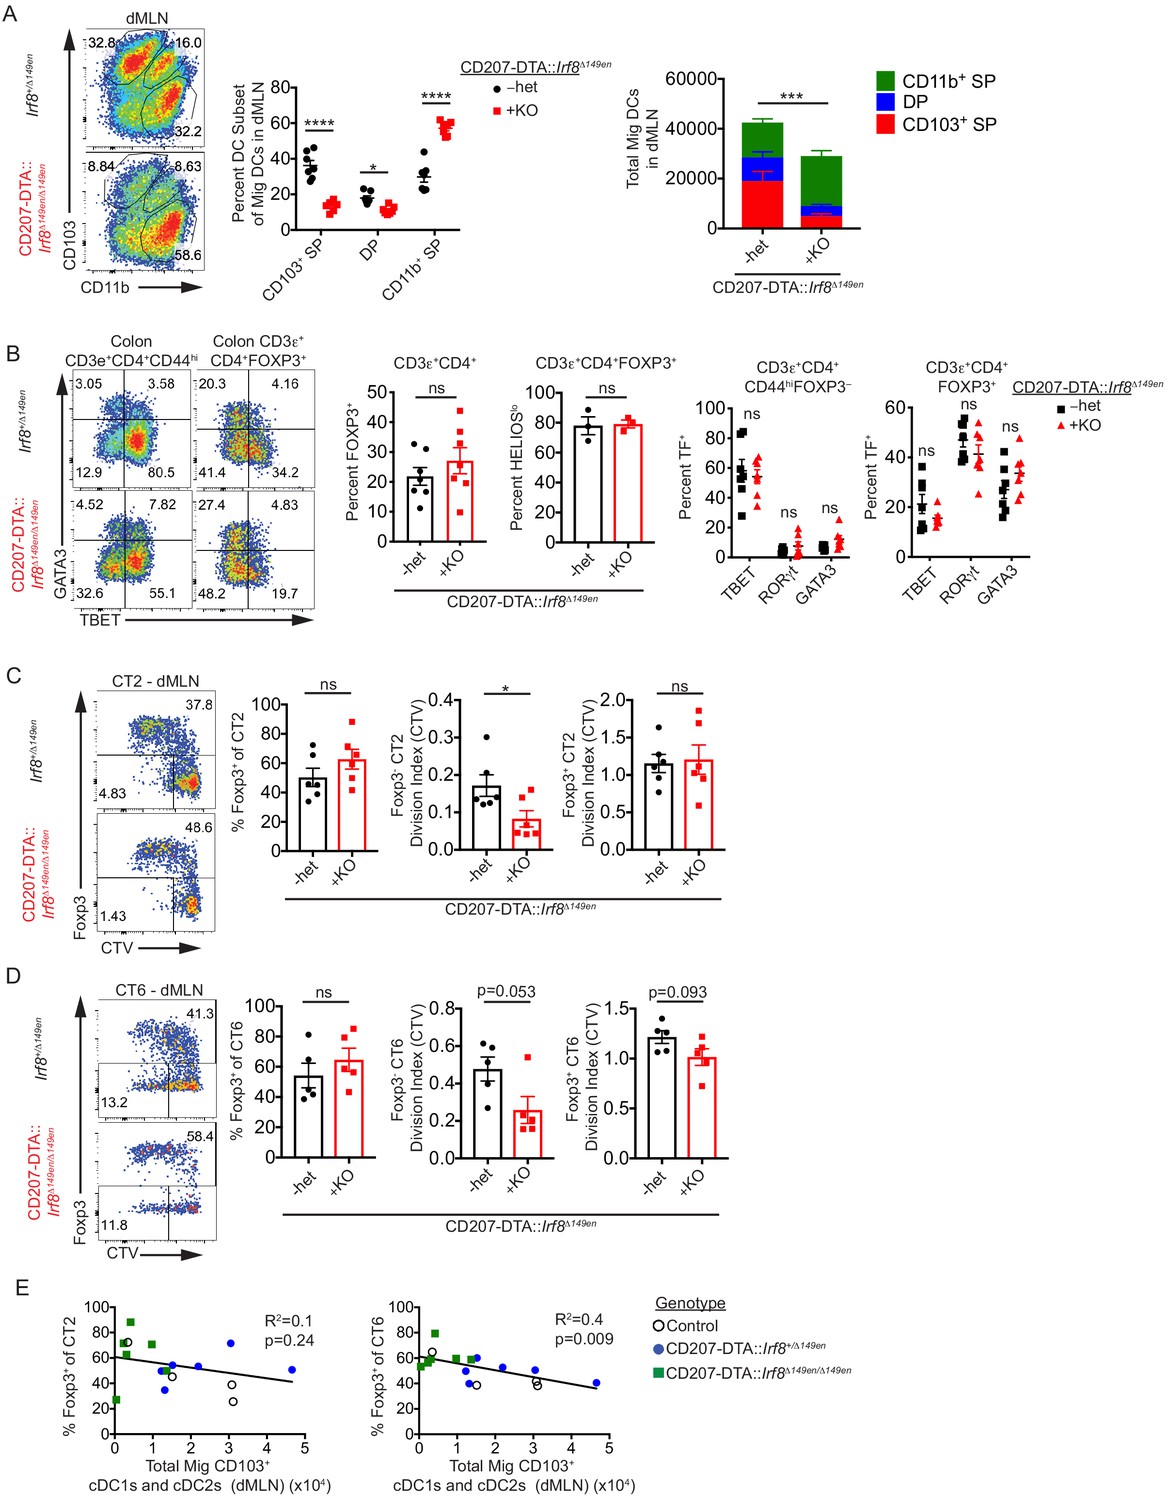
CD103– CD11b+ cDC2s are sufficient for in vivo Helicobacter-specific peripheral regulatory T (pTreg) differentiation.
(A) CD103+ cDC1s and cDC2s are greatly reduced in the distal mesenteric lymph node (dMLN) of CD207-DTA::Irf8Δ149en/Δ149en mice. Representative fluorescence-activated cell sorting (FACS) plot and quantification of migratory conventional dendritic cell (cDC) subsets in the dMLN of littermate Irf8+/Δ149en and CD207-DTA::Irf8Δ149en/Δ149en mice (expt. = 7, n = 7). (B) The frequency of polyclonal pTreg cells is unchanged in CD207-DTA::Irf8Δ149en/Δ149en mice, but Th1 and TBET+ Treg cells are decreased. Representative FACS plots and intracellular staining quantification of FOXP3, HELIOS, TBET, RORγt, and GATA3 expression in colon lamina propria (expt. = 3–4). (C and D) Helicobacter-specific T cell activation and Treg cell differentiation are not dramatically altered in CD103+ cDC1 and cDC2-deficient mice. Congenically marked 5 × 10⁴ naïve CT2 (C) or 105 naïve CT6 (D) were transferred into littermate Irf8+/Δ149en and CD207-DTA::Irf8Δ149en/Δ149en mice and analyzed for Foxp3IRES-GFP or Thy1.1 expression and cell trace violet (CTV) dilution in the dMLN after 7 days (expt. = 4 for both). (E) CT6 pTreg cell differentiation is inversely correlated with the number of CD103+ cDC1s and cDC2s in the dMLN. Congenically marked 5 × 10⁴ naïve CT2 (left) or 105 naïve CT6 (right) were transferred into littermate control, CD207-DTA, and CD207-DTA::Irf8Δ149en/Δ149en mice and analyzed after 7 days. CT2 and CT6 Foxp3IRES-GFP or Thy1.1 expression was compared to cDC subset numbers in the same dMLNs (expt. = 2). Each dot represents an individual mouse. Mean ± SEM (A–D) or + SEM (A, right). p-values from Sidak’s multiple comparisons test (A, middle), two-way ANOVA subset/genotype interaction (A, right); Student’s t-test (B, middle), Sidak’s multiple comparisons test (B, right); Student’s t-test (C and D); R2 and p-value for nonzero slope (E); *p<0.05, **p<0.01, ***p<0.001, ****p<0.0001. The following figure supplements are available for Figure 5—figure supplement 1 and Figure 5—figure supplement 2.
-
Figure 5—source data 1
CD103+ cDC1s and cDC2s are greatly reduced in the distal mesenteric lymph node (dMLN) of CD207-DTA::Irf8Δ149en/Δ149en mice, Figure 5A raw data.
- https://cdn.elifesciences.org/articles/54792/elife-54792-fig5-data1-v2.xlsx
Figure 5—figure supplement 1
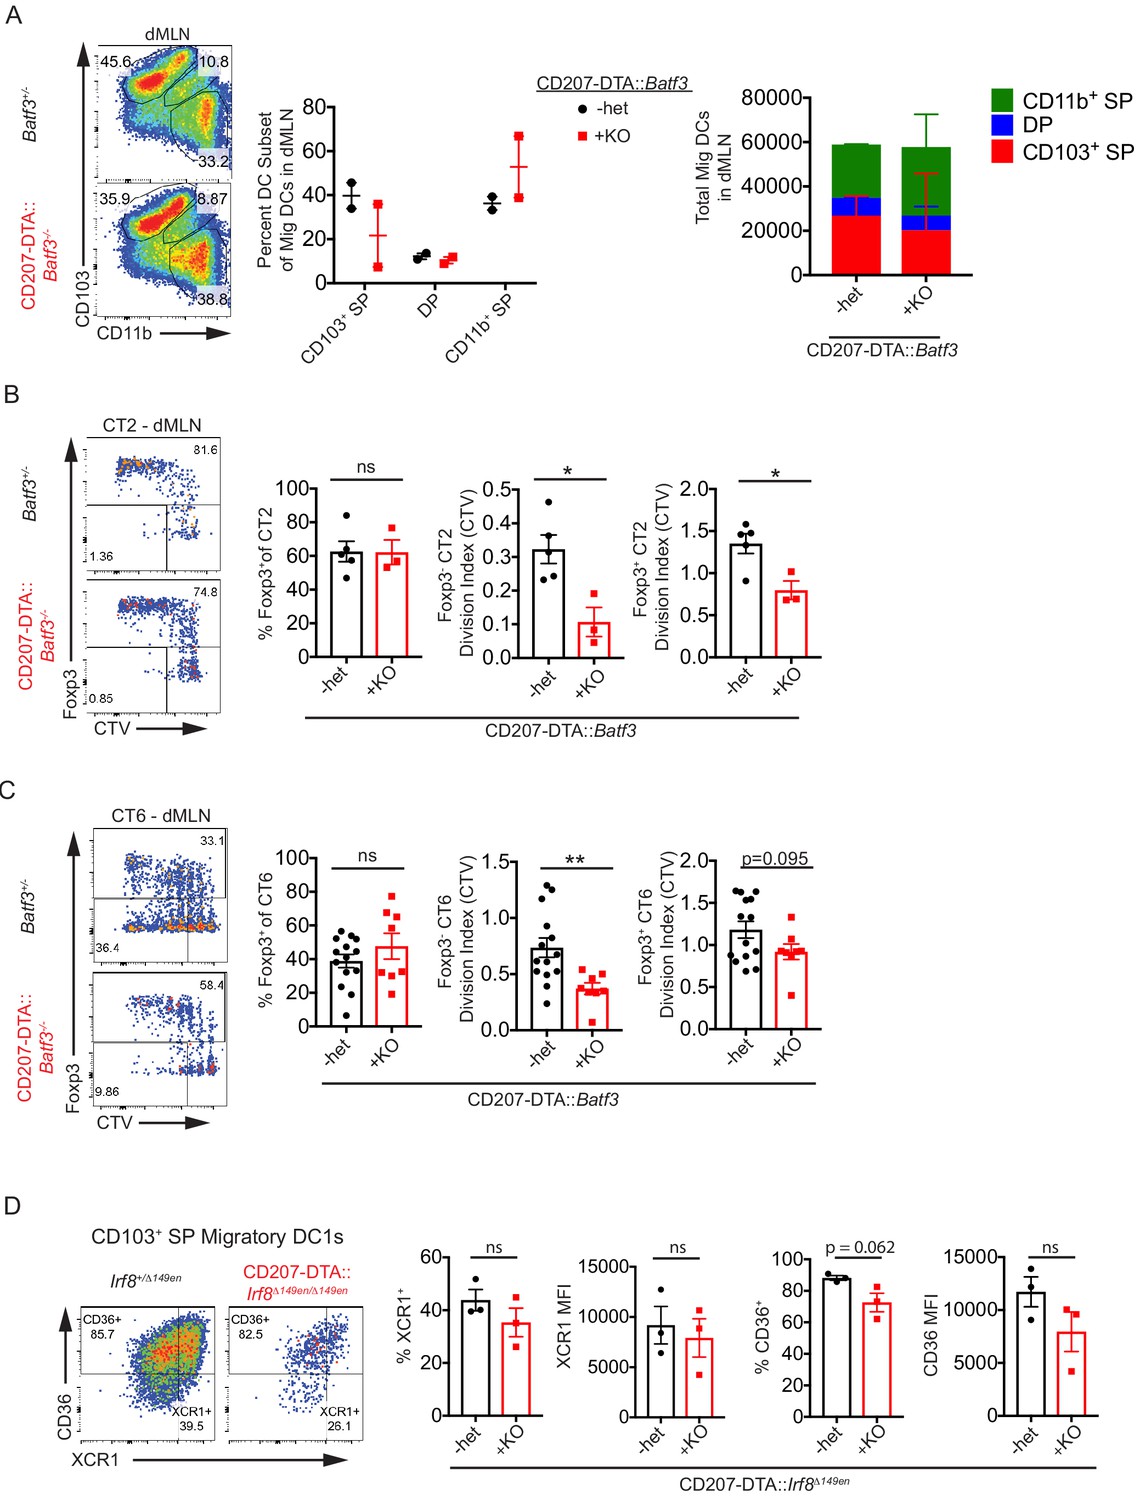
CD103– CD11b+ cDC2s are sufficient for in vivoHelicobacter-specific peripheral regulatory T (pTreg) differentiation.
(A) Variable frequencies of CD103+ conventional dendritic cells (cDCs) in the distal mesenteric lymph node (dMLN) of CD207-DTA::Batf3–/– mice. Fluorescence-activated cell sorting (FACS) plot and quantification of migratory cDC subsets in the dMLN of littermate Batf3+/– and CD207-DTA::Batf3–/– mice (expt. = 2, n = 2). (B and C) Helicobacter-specific Treg cell differentiation is not dramatically altered in CD207-DTA::Batf3–/– mice, although T cell activation is slightly reduced. Congenically marked 5 × 10⁴ naïve CT2 (B) or 105 naïve CT6 (C) were transferred into littermate Batf3+/– and CD207-DTA::Batf3–/– mice and analyzed for Foxp3IRES-GFP or Thy1.1 expression and cell trace violet (CTV) dilution in the dMLN after 7 days (expt. = 2 [B], expt. = 5 [C]). (D) Residual CD103+ CD11b– cells in CD207-DTA::Irf8Δ149en/Δ149en express markers of cDC1s. Representative FACS plots and quantification of the cDC1 markers CD36 and XCR1 in the CD103+ CD11b– population in Irf8+/Δ149en and CD207-DTA::Irf8Δ149en/Δ149en mice (expt. = 2). Each dot represents an individual mouse. Mean ± SEM (A–D) or + SEM (A, right). p-values from Student’s t-test (B–D); *p<0.05, **p<0.01, ***p<0.001, ****p<0.0001.
-
Figure 5—figure supplement 1—source data 1
Variable frequencies of CD103+ conventional dendritic cells (cDCs) in the distal mesenteric lymph node (dMLN) of CD207-DTA::Batf3–/–mice, Figure 5—figure supplement 1A raw data.
- https://cdn.elifesciences.org/articles/54792/elife-54792-fig5-figsupp1-data1-v2.xlsx
Figure 5—figure supplement 2
CD103– CD11b+ cDC2s are sufficient for in vivo Helicobacter-specific peripheral regulatory T (pTreg) differentiation.
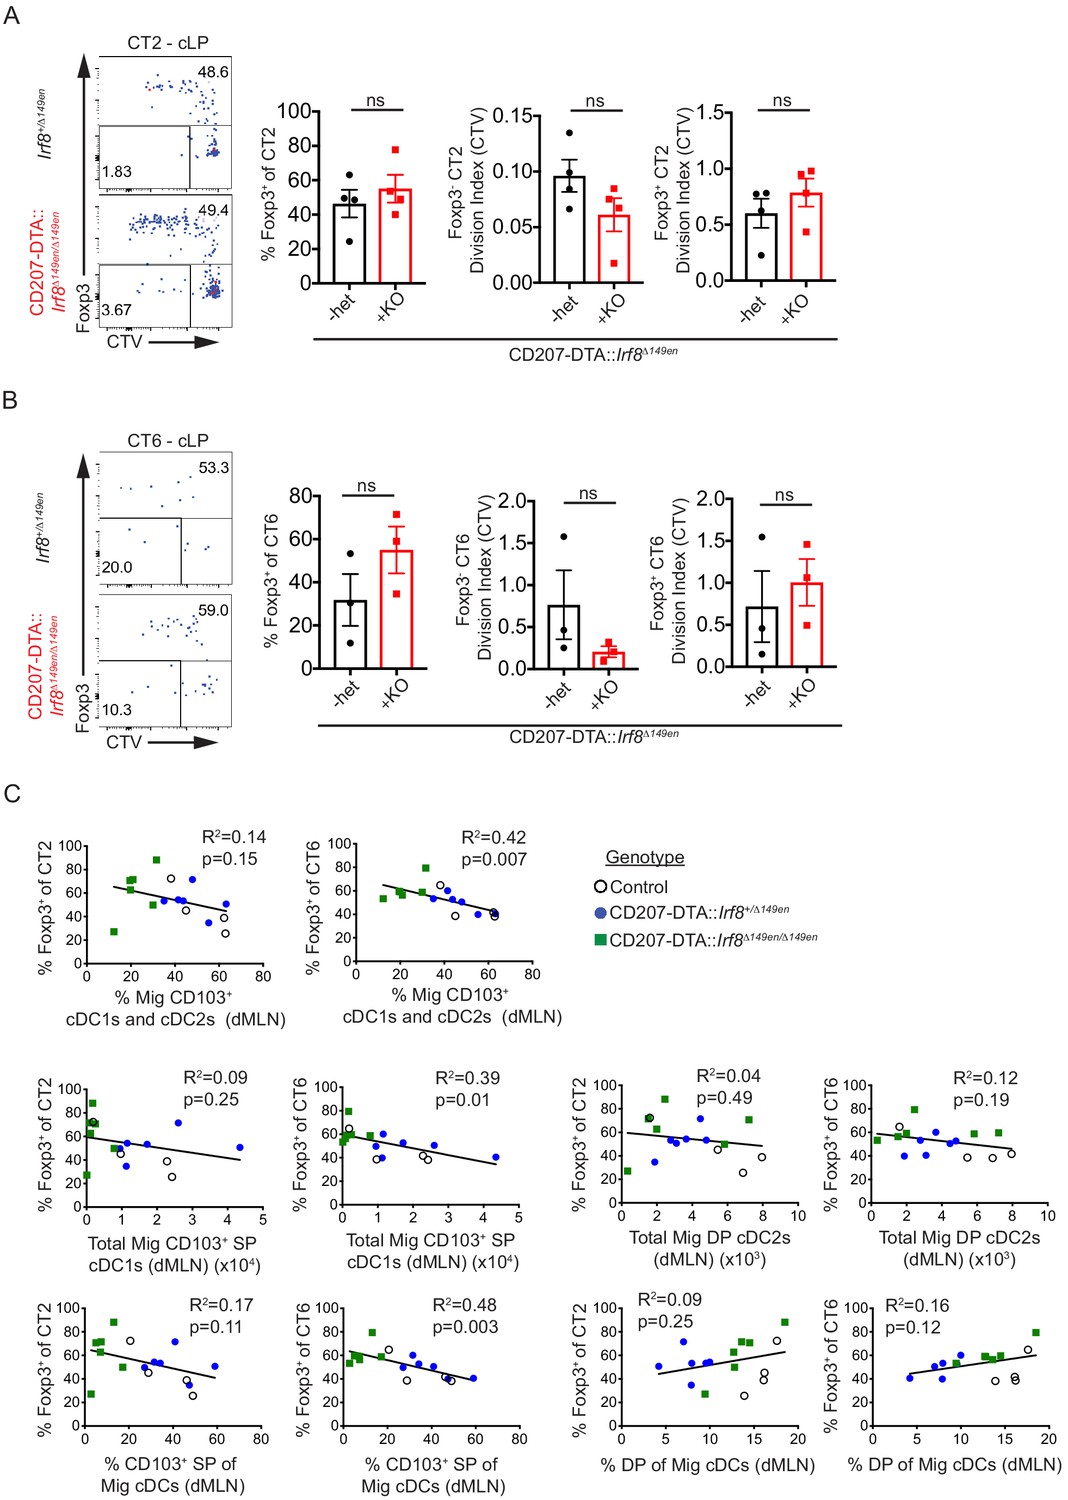
(A and B) Helicobacter-specific T cell activation and Treg cell differentiation are not dramatically altered in the cLP of CD103+ cDC1 and cDC2-deficient mice. Congenically marked 5 × 10⁴ naïve CT2 (A) or 105 naïve CT6 (B) were transferred into littermate Irf8+/Δ149en and CD207-DTA::Irf8Δ149en/Δ149en mice and analyzed for Foxp3IRES-GFP or Thy1.1 expression and cell trace violet (CTV) dilution in the cLP after 7 days (expt. = 4 [A]; expt. = 3 [B]). (C) CT6 peripheral regulatory T (pTreg) cell differentiation is inversely correlated with the frequency/number of CD103+ SP cDC1s in the distal mesenteric lymph node (dMLN). Congenically marked 5 × 10⁴ naïve CT2 or 105 naïve CT6 were transferred into littermate control, CD207-DTA, and CD207-DTA::Irf8Δ149en/Δ149en mice and analyzed after 7 days. CT2 and CT6 Foxp3IRES-GFP or Thy1.1 expression were compared to conventional dendritic cell (cDC) subset numbers and frequencies in the same dMLNs (expt. = 2). Each dot represents an individual mouse. Mean ± SEM shown (A and B). p-values from Student’s t-test (A and B); R2 and p-value for nonzero slope (C); *p<0.05, **p<0.01, ***p<0.001, ****p<0.0001.
Figure 6 with 2 supplements

CD11b+ SP cDC2s are tolerogenic by ‘nature’, not ‘nurture’.
(A) Retinal dehydrogenase (RALDH) activity as measured by Aldefluor is unchanged in CD11b+ SP cDC2s in CD207-DTA::Irf8Δ149en/Δ149en mice deficient in CD103+ cDC1s and cDC2s (expt. = 2). (B) LAP and CD51 protein expression is unchanged in CD11b+ SP cDC2s in CD207-DTA::Irf8Δ149en/Δ149en mice (expt. = 2). (C) Tgfb1, IL10, Itgb6, Itgb8, and Ido1 gene expression are unchanged in CD11b+ SP cDC2s in CD207-DTA::Irf8Δ149en/Δ149en mice, while Tgfb2 and Tgfb3 gene expression are decreased (expt. = 2). Each dot represents an individual mouse. Mean ± SEM shown (A–C). p-values from Tukey’s multiple comparisons test (A–C) using Δ-ΔCt values in (C); *p<0.05, **p<0.01, ***p<0.001, ****p<0.0001.
Figure 6—figure supplement 1
CD11b+ SP cDC2s are tolerogenic by ‘nature’, not ‘nurture’.
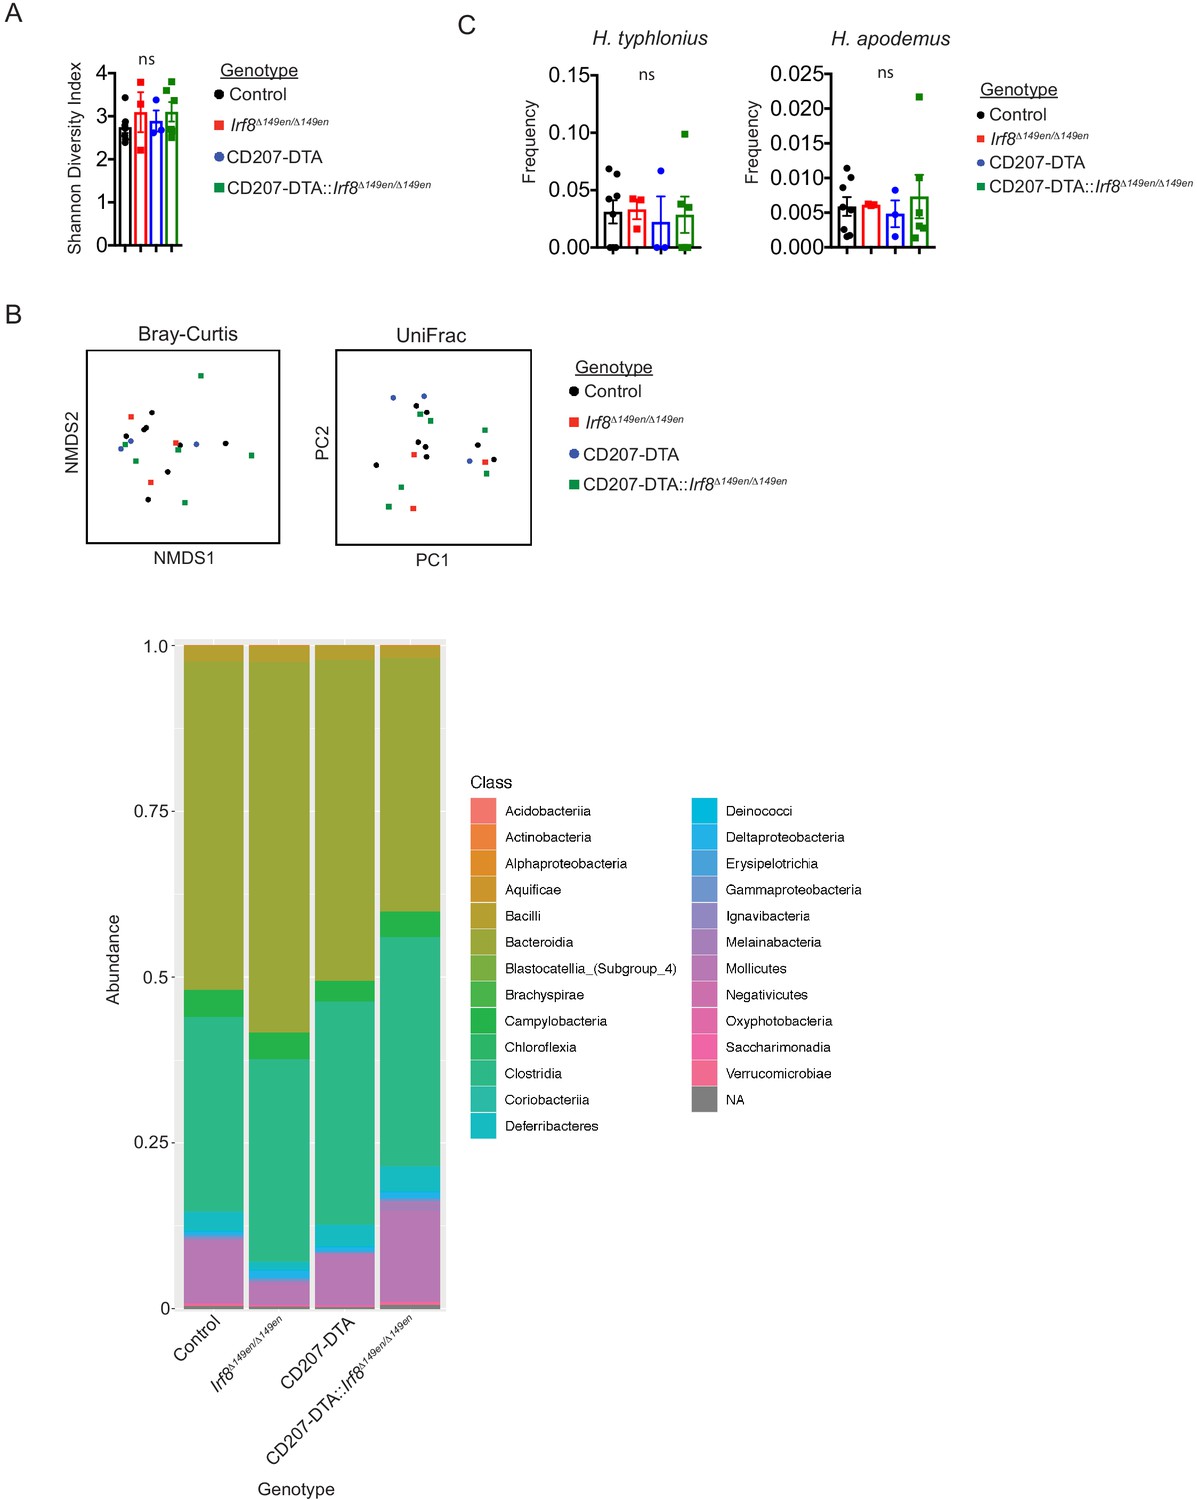
(A and B) The colonic bacterial microbiome is not significantly different among littermate control (Irf8+/Δ149en), Irf8Δ149en/Δ149en, CD207-DTA (Irf8+/+ and Irf8+/Δ149en), and CD207-DTA:: Irf8Δ149en/Δ149en mice. 16S rRNA sequencing was performed on whole colon lumen feces. Alpha diversity was analyzed by Shannon index (A) and beta diversity was analyzed by NMDS of Bray–Curtis and UniFrac distances using amplicon sequence variant (ASV) frequencies (B, top) (expt. = 4). Bacteria class abundance is plotted by stacked bar graph (B, bottom) (expt. = 4). (C) Frequencies of H. typhlonius and H. apodemus are not significantly different in littermate control, Irf8Δ149en/Δ149en, CD207-DTA, and CD207-DTA::Irf8Δ149en/Δ149en mice. 16S rRNA sequencing was performed as in (A) (expt. = 4). Each dot represents an individual mouse. Mean ± SEM shown (A and C). p-values from one-way ANOVA (A and C) with Dunnett’s multiple comparisons test (C); *p<0.05, **p<0.01, ***p<0.001, ****p<0.0001.
-
Figure 6—figure supplement 1—source data 1
16S rRNA sequencing of whole colon lumen feces of conventional dendritic cell (cDC)-deficient mice, Figure 6—figure supplement 1B raw data.
- https://cdn.elifesciences.org/articles/54792/elife-54792-fig6-figsupp1-data1-v2.xlsx
Figure 6—figure supplement 2
CD11b+ SP cDC2s are tolerogenic by ‘nature’, not ‘nurture’.
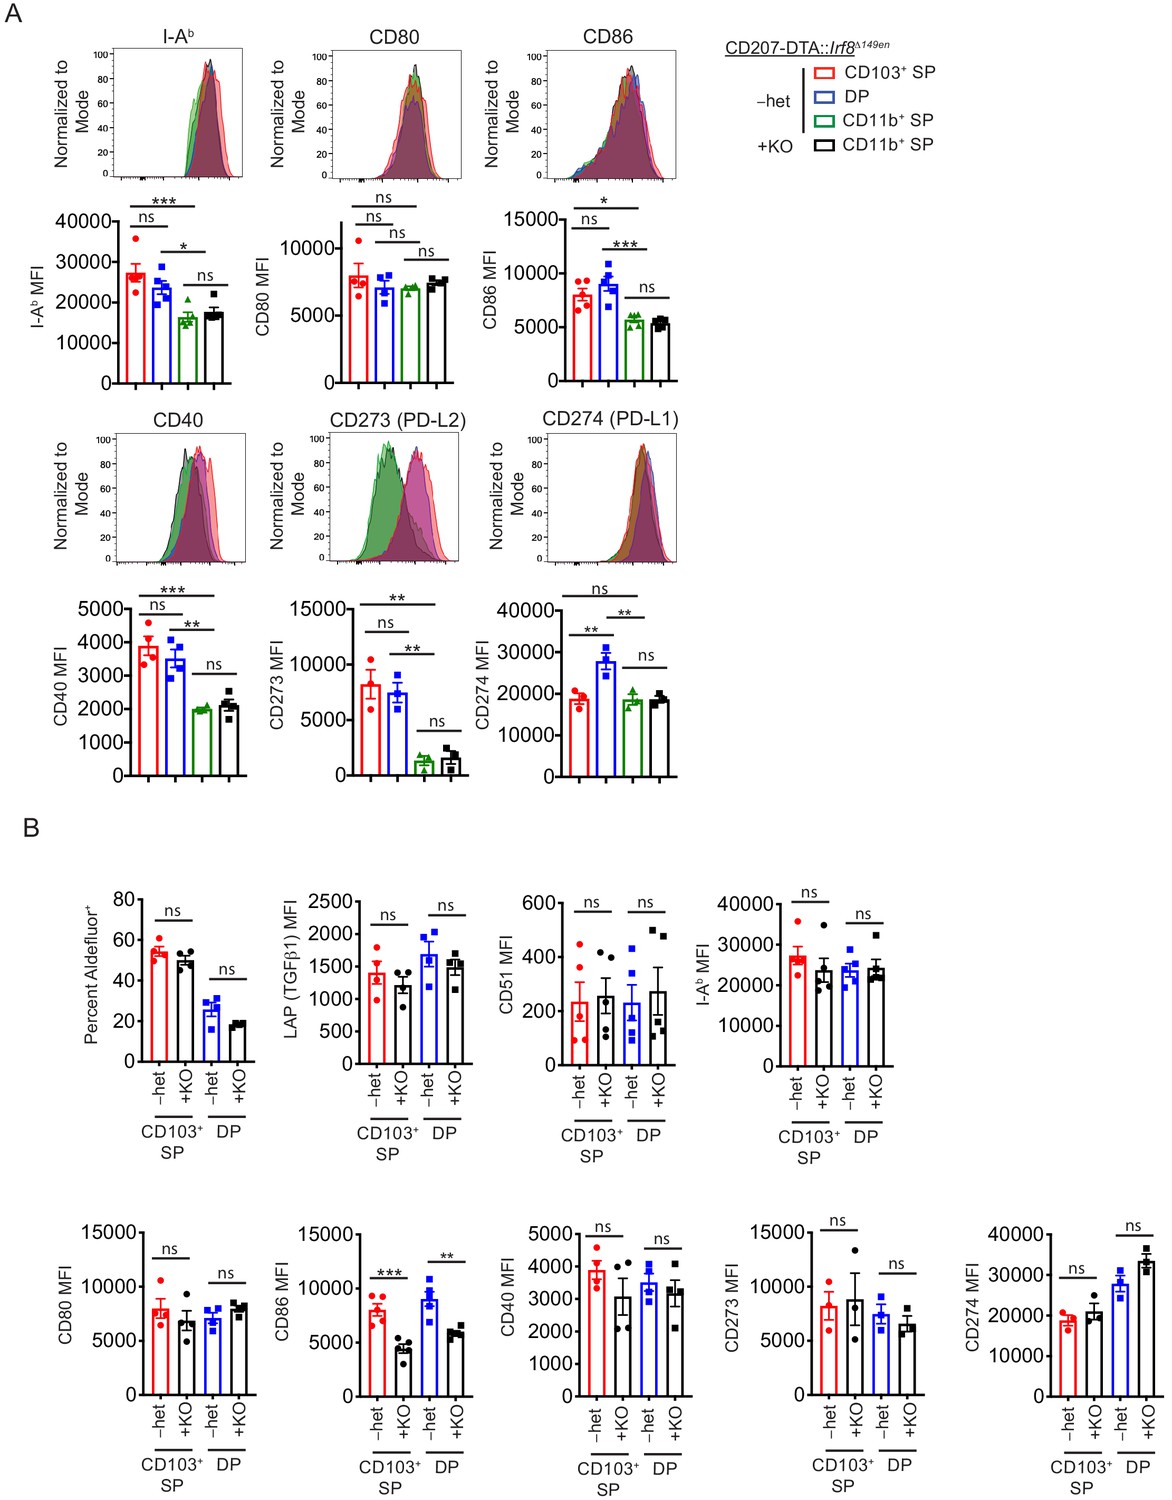
(A) Molecules involved in T cell activation are unchanged in CD11b+ SP cDC2s in CD207-DTA::Irf8Δ149en/Δ149en mice. Representative expression of I-Ab, CD80, CD86, CD40, CD273, and CD274 by flow cytometry is shown and quantified by median fluorescence intensity (MFI) (expt. = 2–3). (B) CD86 expression is decreased in remaining CD103+ cDC1s and cDC2s in CD207-DTA::Irf8Δ149en/Δ149en mice. Representative retinaldehyde dehydrogenase (RALDH) activity as measured by Aldefluor and expression of LAP, CD51, I-Ab, CD80, CD86, CD40, CD273, and CD274 by flow cytometry are shown and quantified by MFI (expt. = 2–3). Each dot represents an individual mouse. Mean ± SEM shown. p-values from Tukey’s multiple comparisons test; *p<0.05, **p<0.01, ***p<0.001, ****p<0.0001.
Figure 7 with 1 supplement
Conventional dendritic cell (cDC)-mediated peripheral regulatory T (pTreg) cell differentiation in vivo is recessive to effector T cell development.
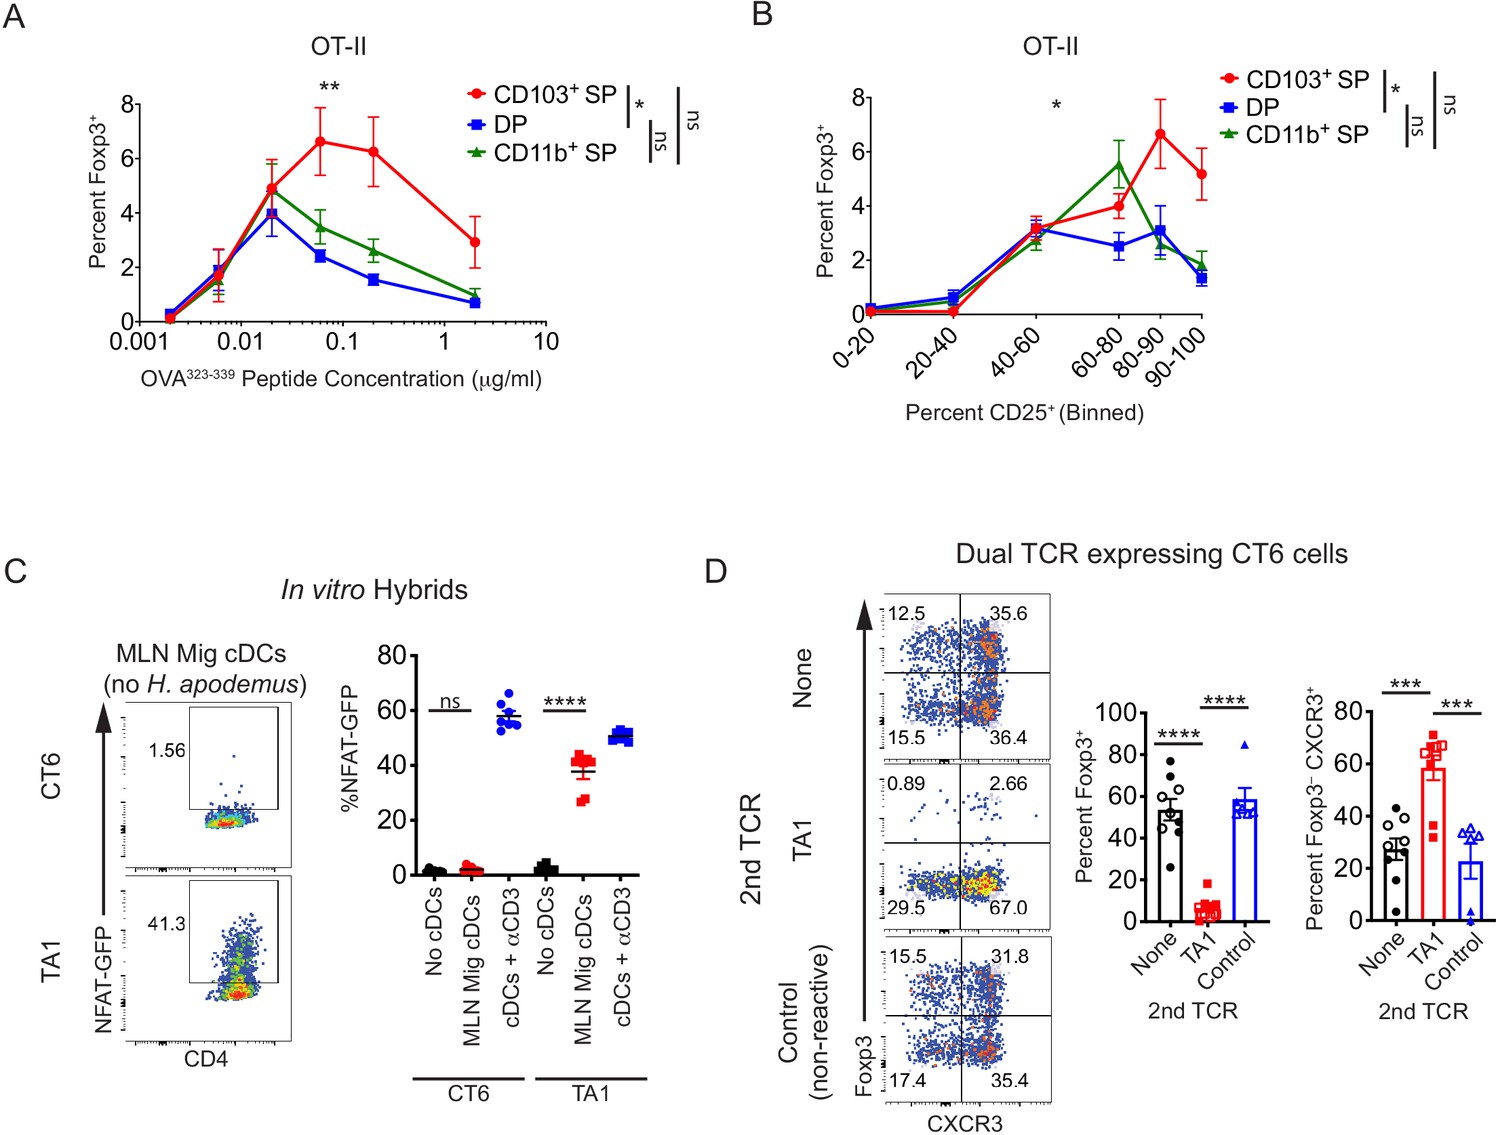
(A) Migratory cDC induction of OT-II pTreg cells in vitro is dependent on T cell receptor (TCR) stimulation. Treg cell induction of OT-II cells by migratory cDC subsets with varying concentrations of OVA323-339 peptide is shown (expt. = 5). (B) In vitro, CD103+ SP cDC1s have increased ability to induce OT-II pTreg cells at higher levels of TCR activation (based on CD25 upregulation). Migratory cDC subsets were cultured with naïve OT-II T cells as in (A) (expt. = 5). (C) TA1 cognate antigens are presented by mesenteric lymph node (MLN) migratory dendritic cells. 1.5 × 10³ TA1- or CT6-expressing T cell hybrids were co-cultured in vitro with 5 × 10⁴ ex vivo MLN migratory cDCs (MHCIIhi CD11cint). NFAT-GFP expression in hybrids was analyzed after 40 hr (expt. = 2). (D) Expression of a Th1-inducing TCR (TA1) in CT6 cells dominantly inhibits CT6 pTreg cell differentiation in vivo. Naïve CT6 T cells were retrovirally transduced with either TA1 or a non-reactive control TCR (T7-2 or T9). Untransduced CT6, CT6 co-expressing TA1, or CT6 co-expressing T7-2 or T9 were transferred into each mouse; mice received either 5 × 10⁴ of each TCR (closed shapes) or 2 × 10⁵ of each TCR (open shapes). Expression of Foxp3IRES-GFP or Thy1.1 and CXCR3 were quantified in the distal MLN (dMLN) after 7 days. Each dot represents the mean of indicated experiments (A and B), an individual co-culture well (C), or an individual mouse (D). Mean ± SEM shown (A–D). p-values from mixed effects analysis of repeated measures of DC subsets with Tukey’s multiple comparisons test (A and B); Tukey’s multiple comparisons test (C and D); *p<0.05, **p<0.01, ***p<0.001, ****p<0.0001.
-
Figure 7—source data 1
Migratory conventional dendritic cell (cDC) induction of OT-II peripheral regulatory T (pTreg) cells in vitro is dependent on T cell receptor (TCR) stimulation, Figure 7A raw data.
- https://cdn.elifesciences.org/articles/54792/elife-54792-fig7-data1-v2.xlsx
-
Figure 7—source data 2
In vitro, CD103+ SP cDC1s have increased ability to induce OT-II peripheral regulatory T (pTreg) cells at higher levels of TCR activation, Figure 7B raw data.
- https://cdn.elifesciences.org/articles/54792/elife-54792-fig7-data2-v2.xlsx
Figure 7—figure supplement 1
Conventional dendritic cell (cDC)-mediated peripheral regulatory T (pTreg) cell differentiation in vivo is recessive to effector T cell development.
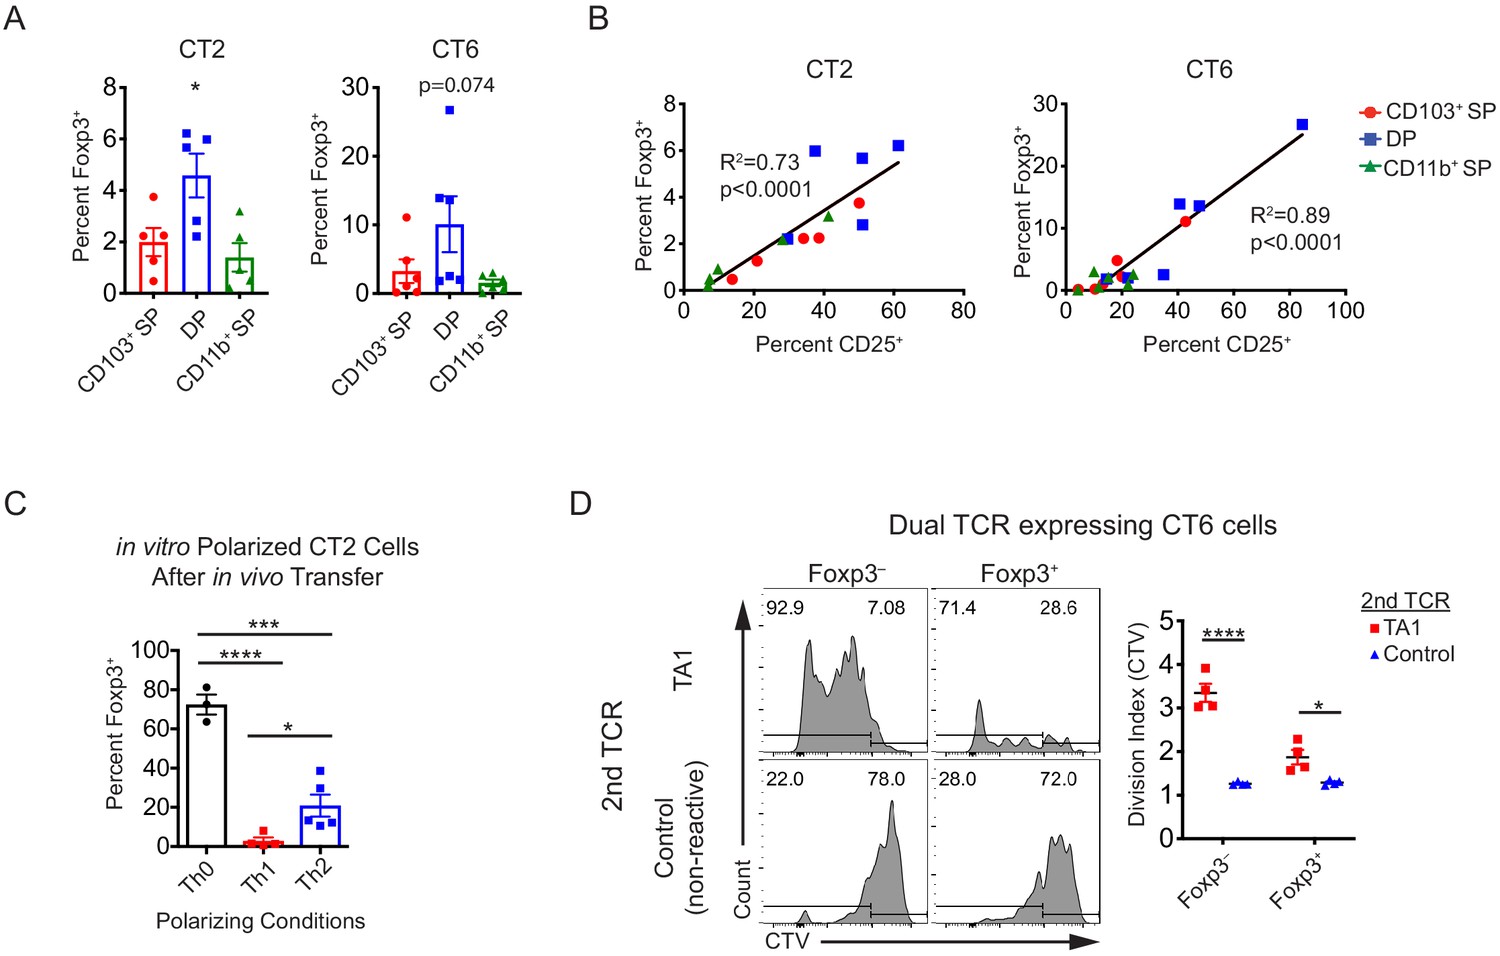
(A) Migratory conventional dendritic cell (cDC) subsets induce low levels of Foxp3IRES-GFP or Thy1.1 in CT2 and CT6 in vitro. (B) The induction of Foxp3IRES-GFP or Thy1.1 in CT2 and CT6 cultured with ex vivo migratory cDC subsets is correlated with the level of T cell receptor (TCR) stimulation by CD25 upregulation. For (A and B), each dot represents data from an individual experiment, in which sorted migratory cDC subsets from the pooled distal mesenteric lymph nodes (dMLNs) of 10–15 mice were cultured with naïve CT2 and CT6 T cells as in Figure 1A (expt. = 5–6). (C) In vitro Th1- or Th2-polarizing conditions inhibit in vivo pTreg cell differentiation of CT2 cells. 1.5 × 10⁵ naïve CT2 T cells were activated and cultured in Th0, Th1, or Th2 conditions for 48 hr, transferred in vivo, and analyzed for Foxp3IRES-GFP or Thy1.1 upregulation in the dMLN after 2 weeks (expt. = 2). (D) TA1 TCR-expressing CT6 cells proliferate more than control TCR-expressing CT6 cells in vivo. 2 × 10⁵ CT6 cells were transduced and transferred in vitro as in Figure 7D. Each dot represents an independent experiment. Mean ± SEM shown. p-value from one-way ANOVA (A); Linear regression with associated R2 and p-value for nonzero slope (B); Tukey’s multiple comparisons test (C); Sidak’s multiple comparisons test (D); *p<0.05, **p<0.01, ***p<0.001, ****p<0.0001.
Tables
Key resources table
| Reagent type (species) or resource | Designation | Source or reference | Identifiers | Additional information |
|---|---|---|---|---|
| Antibody | Anti-mouse CD3ε (clone# 145–2 C11) FITC, PE, and BV421 | Biolegend | 100305/07/35 | Dilution: 1:300 |
| Antibody | Anti-mouse/human B220 (clone# RA3-6B2) APC/Cy7 and A700 | Biolegend | 103223/31 | Dilution: 1:750 |
| Antibody | Anti-mouse CD19 (clone# 6D5) APC/Cy7 | Biolegend | 115529 | Dilution: 1:750 |
| Antibody | Anti-mouse I-Ab (clone# AF6-120.1) APC and PerCP/Cy5.5 | Biolegend | 116417/15 | Dilution: 1:750 |
| Antibody | Anti-mouse CD11c (clone# N418) PE/Cy7 and BV605 | Biolegend | 117317/33 | Dilution: 1:750 |
| Antibody | Anti-mouse/human CD11b (clone# M1/70) BV711 | Biolegend | 101241 | Dilution: 1:750 |
| Antibody | Anti-mouse CD103 (clone# 2E7) BV421 | Biolegend | 121421 | Dilution: 1:300 |
| Antibody | Anti-mouse CD4 (clone# RM4-5) BV711, PE, and PB | Biolegend | 100549/11/34 | Dilution: 1:750 |
| Antibody | Anti-mouse CD25 (clone# PC61) APC, BV605, PerCP/Cy5.5, and PE-Cy7 | Biolegend | 102011/35/29/15 | Dilution: 1:750 |
| Antibody | Anti-mouse/human CD44 (clone# IM7) APC/Cy7 and BV605 | Biolegend | 103027/47 | Dilution: 1:750 |
| Antibody | Anti-mouse CD62L (clone# MEL-14) APC/Cy7 and BV605 | Biolegend | 104427/37 | Dilution: 1:750 |
| Antibody | Anti-mouse FOXP3 (clone# FJK-16s) FITC | Thermo Fisher | 11-5773-82 | Dilution: 1:200 |
| Antibody | Anti-mouse GATA3 (clone# 16E10A23) PE | Biolegend | 653803 | Dilution: 1:30 |
| Antibody | Anti-mouse RORγt (clone# B2D) APC | Thermo Fisher | 17-6981-80 | Dilution: 1:200 |
| Antibody | Anti-mouse TBET (clone# 4B10) PE/Cy7 | Biolegend | 644823 | Dilution: 1:200 |
| Antibody | Anti-mouse HELIOS (clone# 22F6) A647 | Biolegend | 137208 | Dilution: 1:200 |
| Antibody | Anti-mouse CXCR3 (clone# CXCR3-173) BV421 | Biolegend | 126521 | Dilution: 1:300 |
| Antibody | Anti-mouse Thy1.1 (clone# 30-H12) PE/Cy7 | Biolegend | 105325 | Dilution: 1:750 |
| Antibody | Anti-mouse LAP (clone# TW7-16B4) BV421 | Biolegend | 141407 | Dilution: 1:100 |
| Antibody | Anti-mouse CD51 (clone# RMV-7) PE | Biolegend | 104105 | Dilution: 1:200 |
| Antibody | Anti-mouse CD80 (clone# 16-10A1) APC | Biolegend | 104713 | Dilution: 1:750 |
| Antibody | Anti-mouse CD86 (clone# GL-1) BV605 | Biolegend | 105037 | Dilution: 1:300 |
| Antibody | Anti-mouse CD40 (clone# 3/23) APC | Biolegend | 124611 | Dilution: 1:750 |
| Antibody | Anti-mouse CD273 (clone# TY25) APC | Biolegend | 107210 | Dilution: 1:300 |
| Antibody | Anti-mouse CD274 (clone# 10F.9G2) BV421 | Biolegend | 124315 | Dilution: 1:300 |
| Antibody | Anti-mouse XCR1 (clone# ZET) APC | Biolegend | 148205 | Dilution: 1:300 |
| Antibody | Anti-mouse CD36 (clone# CRF D-2712) PE | Becton Dickinson | 562702 | Dilution: 1:200 |
| Antibody | Anti-mouse CD45.1 (clone# A20) PE, APC, and PE/Cy7 | Biolegend | 110707/14/29 | Dilution: 1:750 |
| Antibody | Anti-mouse CD45.2 (clone# 104) PE, APC, PE/Cy7, and A700 | Biolegend | 109807/14/29/21 | Dilution: 1:750 |
| Antibody | Anti-mouse VB6 (clone# RR4-7) PE and APC | Biolegend | 140003/5 | Dilution: 1:750 |
| Antibody | Anti-mouse Va2 (clone# B20.1) APC/Cy7 and PerCP/Cy5.5 | Biolegend | 127818/13 | Dilution: 1:750 |
| Antibody | Anti-mouse VB5 (clone# MR9-4) PE | Biolegend | 139503 | Dilution: 1:750 |
| Antibody | Anti-mouse F4/80 (clone# BM8) PE/Cy7 | Biolegend | 123113 | Dilution: 1:750 |
| Antibody | Anti-mouse SIRPα (clone# P84) A700 | Biolegend | 144021 | Dilution: 1:750 |
| Antibody | Anti-mouse CD24 (clone# M1/69) PE | Biolegend | 101807 | Dilution: 1:750 |
| Antibody | Anti-mouse CD101 (clone# Moushi101) PE/Cy7 | Thermo Fisher | 50-112-3316 | Dilution: 1:300 |
| Strain, strain background (Mus musculus) | OT-II TCR transgenic mice | The Jackson Laboratory (JAX) | #004194 | |
| Strain, strain background (Mus musculus) | Ccr7GFP knockin/knockout mice | The Jackson Laboratory (JAX) | #027913 | |
| Strain, strain background (Mus musculus) | Itgax-Cre mice | The Jackson Laboratory (JAX) | #008068 | |
| Strain, strain background (Mus musculus) | Irf4fl/fl mice | The Jackson Laboratory (JAX) | #009380 | |
| Strain, strain background (Mus musculus) | CT2 TCR transgenic mice | Nutsch et al., 2016 | ||
| Strain, strain background (Mus musculus) | CT6 TCR transgenic mice | Nutsch et al., 2016 | ||
| Strain, strain background (Mus musculus) | Rag1–/– mice | The Jackson Laboratory (JAX) | #002216 | |
| Strain, strain background (Mus musculus) | Foxp3IRES-GFPmice | The Jackson Laboratory (JAX) | #006772 | |
| Strain, strain background (Mus musculus) | Foxp3IRES-Thy1.1mice | Liston et al., 2008 | ||
| Strain, strain background (Mus musculus) | Irf8Δ149en/Δ149en mice; formerly Irf8 +32 5’–/– | Durai et al., 2019 | ||
| Strain, strain background (Mus musculus) | Batf3–/– mice | Hildner et al., 2008 | ||
| Strain, strain background (Mus musculus) | Zbtb46GFP mice | Satpathy et al., 2012 | ||
| Strain, strain background (Mus musculus) | CD207-DTA mice; formerly huLangerin-DTA | Kaplan et al., 2005 |
Additional files
Download links
A two-part list of links to download the article, or parts of the article, in various formats.
Downloads (link to download the article as PDF)
Open citations (links to open the citations from this article in various online reference manager services)
Cite this article (links to download the citations from this article in formats compatible with various reference manager tools)
Gut Helicobacter presentation by multiple dendritic cell subsets enables context-specific regulatory T cell generation
eLife 10:e54792.
https://doi.org/10.7554/eLife.54792


