CB1-receptor-mediated inhibitory LTD triggers presynaptic remodeling via protein synthesis and ubiquitination
- Dominick P. Purpura Department of Neuroscience, Albert Einstein College of Medicine, United States
- Department of Developmental and Molecular Biology, Albert Einstein College of Medicine, United States
- Institute for Aging Studies, Albert Einstein College of Medicine, United States
- Department of Psychiatry and Behavioral Sciences, Albert Einstein College of Medicine, United States
Figures
Figure 1 with 2 supplements

Induction of CB1-iLTD is associated with a reduction in CB1+ bouton size.
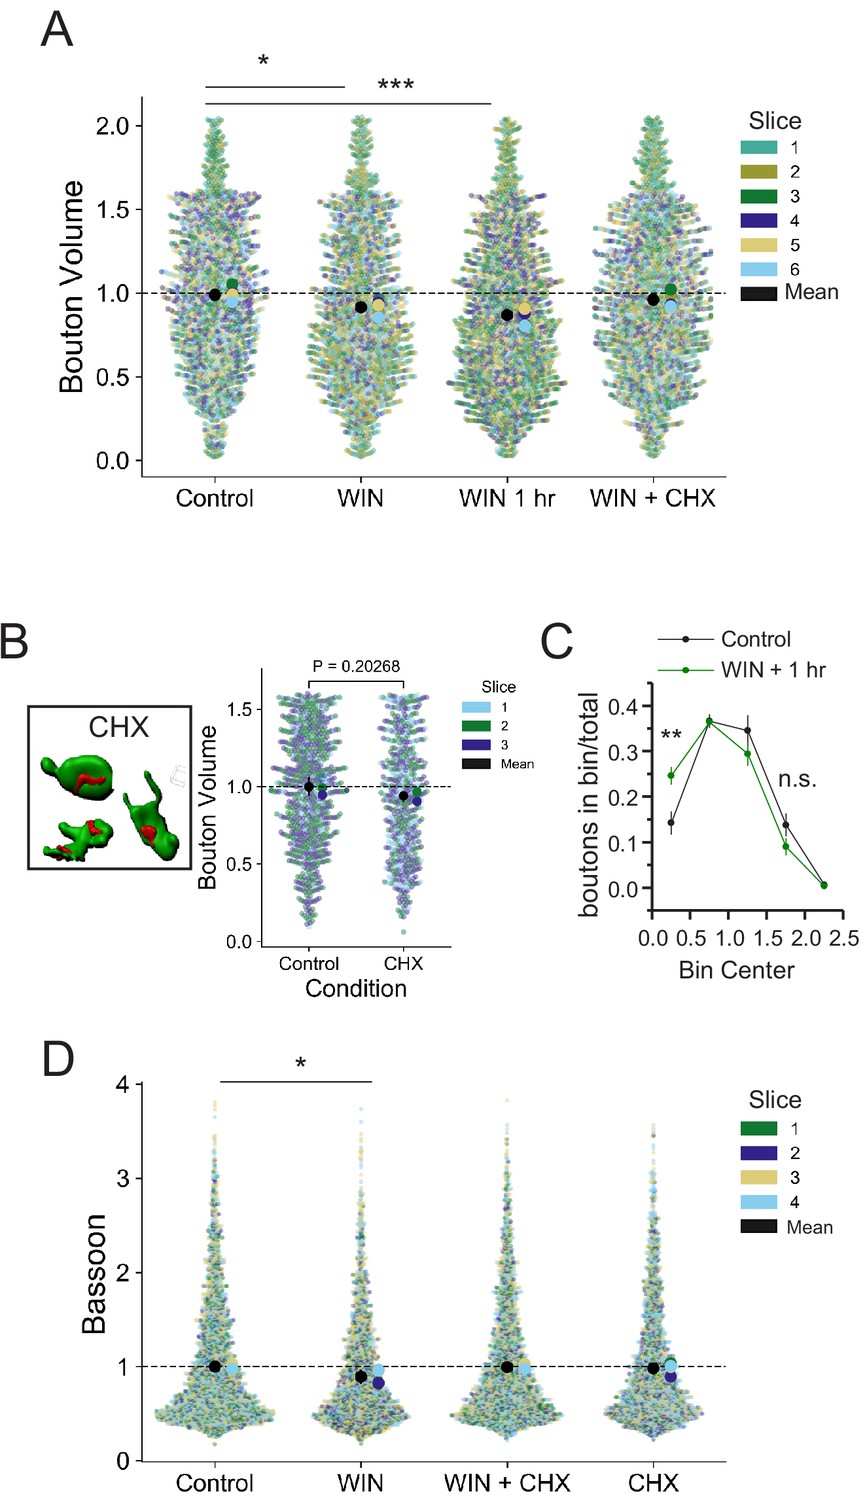
(A) Left, representative stitched widefield confocal of hippocampal CB1 immunolabeling. White boxes indicate where high-magnification images were acquired (as seen in center panel). Center, High-resolution Airyscan confocal maximum projection used for 3D reconstruction of individual boutons in CA1 stratum pyramidale. Right, 3D reconstruction of Airyscan confocal image shown in center panel. (B) Top, representative extracellular field inhibitory postsynaptic potentials (fIPSPs) recorded in the CA1 pyramidal cell body layer in acute hippocampal slices before and after WIN treatment (5 µM, 25 min). Bottom, summary time-course plot showing WIN-induced depression; n = 3 slices, three animals. For all electrophysiology figures, representative traces correspond to the gray-shaded areas and in the summary time-course plots (averaged summary data expressed as normalized change from baseline ± S.E.M.). Shaded boxes in all electrophysiology figures correspond to when plasticity was analyzed with respect to baseline and when representative traces were collected and averaged. (C) Quantification of mean bouton volume per slice normalized to Control. Activation of CB1 receptors with 5 µM WIN for 25 min led to decreased bouton volume that remained 1 hr after WIN treatment and was blocked by treatment with cycloheximide (CHX, 80 µM, applied throughout the experiment). Control: 1.0 ± 0.02 vs. WIN: 0.92 ± 0.02 vs. WIN + 1 hr: 0.89 ± 0.02 vs. CHX + WIN: 0.97 ± 0.02 (Mean ± S.E.M.); F[3,22]=8.682; p=0.0005, one-way ANOVA with post-hoc Tukey test for multiple comparisons. Control vs. WIN: CI[0.005,0.14], p=0.03. Control vs. WIN 1 hr: CI[0.05,0.18], p=0.0005. WIN 1 hr vs. WIN + CHX: CI[−0.11,0.03], p=0.012. n = number of slices (three images/slice, 1–2 slices/rat, six rats/condition). For all structural plasticity figures, data are presented as points representing mean bouton volume per slice with a horizontal black line representing the mean per condition and the vertical line indicating 95% confidence interval (CI). 95% CIs are given as CI[lower CI, upper CI]. p-Values are exact. Refer to Figure 1—figure supplement 1A for distribution of individual bouton values. (D) Representative 3D reconstruction widefield images of Bassoon labeling inside CB1+ boutons. (E) Representative single CB1 boutons with Bassoon reconstructed in 3D. (F) Quantification of mean Bassoon volume per slice normalized to Control after 25 min WIN treatment revealed a reduction in active zone volume as measured using Bassoon immunolabeling that was blocked by treatment with cycloheximide (CHX, 80 µM, applied throughout the experiment). Control: 1.0 ± 0.01 vs. WIN: 0.89 ± 0.04 vs. CHX + WIN: 1.0 ± 0.01 vs. CHX: 0.98 ± 0.03 (Mean ± S.E.M.); F[3,12]=4.11, p=0.032, one-way ANOVA with post-hoc Tukey test for multiple comparisons. Control vs. WIN: CI[0.004,0.22], p=0.042. n = number of slices (three images/slice, 1–2 slices/rat, three rats/condition). Refer to Figure 1—figure supplement 1D for distribution of individual Bassoon values.
Figure 1—figure supplement 1
Individual bouton and Bassoon sizes are altered by CB1-iLTD induction in a protein synthesis-dependent manner.
(A) Quantification of bouton volume normalized to control by slice. Activation of CB1 receptors with 5 µM WIN for 25 min led to decreased bouton volume that remained 1 hr after WIN treatment and was diminished by treatment with cycloheximide (CHX, 80 µM, applied throughout the experiment). Superplot shows individual bouton volume values color-coded by slice in swarmplot with solid larger dots overlaid representing mean bouton volume per slice. Overall mean of slices is indicated with the black circle, 95% CI is indicated with the vertical black line. Control: 1.0 ± 0.02 vs. WIN: 0.92 ± 0.02 vs. WIN + 1 hr: 0.87 ± 0.02 vs. WIN + CHX: 0.98 ± 0.02 (Mean ± S.E.M.); F[3,20]=8.40, p=0.00082, one-way ANOVA with post-hoc Tukey test for multiple comparisons. WIN vs. Control: CI [−0.15,–0.0015], p=0.044, WIN 1 hr vs. Control: CI [−0.19,–0.048], p=0.00077, WIN + CHX vs. WIN 1 hr: CI[0.02,0.16], p=0.0095. n = slices (three images/slice, one slice/rat, six rats/condition). 95% Confidence intervals (CI) are given as CI[lower CI, upper CI]. P-values are exact. (B) Left, Representative single CB1 boutons with Bassoon reconstructed in 3D. Right, Quantification of bouton volume normalized to control. CHX had no significant effect on basal CB1 bouton volume. Control 1.0 ± 0.03 v. CHX: 0.94 ± 0.02, Two sample t-test, p=0.20267. n = number of slices (three images/slice, one slices/rat, three rats/condition). Superplot shows individual bouton volume values color-coded by slice in swarmplot with solid larger dots overlaid representing mean bouton volume per slice. Overall mean of slices is indicated with the black circle, 95% CI is indicated with the vertical black line. Control: 1.0 ± 0.06 v. WIN: 1.07 ± 0.09 (Mean ± S.E.M.); Two sample t-test, p=0.49581, n = number of slices (five slices, five rats per condition). (C) CB1 activation shifts distribution to smaller sizes. Plot shows boutons in each bin divided by total boutons measured in a slice. Bin [0–0.5]: Control: 0.143 ± 0.025 vs. WIN + 1 hr: 0.246 ± 0.02, Two-sample t-test, p=0.009. Bin [1.5–2.0]: Control: 0.138 ± 0.025 vs. WIN + 1 hr: 0.09 ± 0.019, Two-sample t-test, p=0.16, n.s. = non significant, n = 6 slices, six animals per group. (D) Quantification of Bassoon after 25 min WIN treatment revealed a reduction in active zone volume as measured using Bassoon immunolabeling that was impaired by treatment with cycloheximide (CHX, 80 µM, applied throughout the experiment). Superplot shows individual Bassoon volume values color-coded by slice in swarmplot with solid larger dots overlaid representing mean volume per slice. Overall mean of slices is indicated with the black circle, 95% CI is indicated with the vertical black line. Control: 1.0 ± 0.01 vs. WIN: 0.89 ± 0.04 vs. CHX + WIN: 1.0 ± 0.01 vs. CHX: 0.98 ± 0.03 (Mean ± S.E.M.); F[3,12]=4.11, p=0.032, one-way ANOVA with post-hoc Tukey test for multiple comparisons. WIN vs. Control: CI[−0.22,–0.004], p=0.042. n = number of slices (three images/slice, one slice/rat, four rats/condition). 95% Confidence intervals (CI) are given as CI[lower CI, upper CI]. p-Values are exact.
Figure 1—figure supplement 2

WIN treatment affects CB1+ boutons specifically and results in reduction in VGAT volume.
(A) Left, representative widefield confocal z-stack of CA1 pyramidal layer and 3D Imaris reconstruction of CB1+ boutons. Dotted lines indicate location of putative pyramidal cell somas. Center, volume of individual boutons was quantified using dense PV immunolabeling of inhibitory interneuron terminals. Right, representative single boutons reconstructed in 3D. (B) Quantification of bouton volume normalized to control. Activation of CB1 receptors with WIN (5 µM, 25 min) resulted in no change in PV bouton volume. Superplot indicates distribution of all PV boutons color-coded by slice. Overall mean of slices is indicated with the black circle, 95% CI is indicated with the vertical black line. Control: 1.0 ± 0.06 v. WIN: 1.07 ± 0.09 (Mean ± S.E.M.); Two sample t-test, p=0.49581, n = number of slices (five slices, five rats per condition). (C) Representative widefield confocal maximum projection of CA1 pyramidal layer showing PV and CB1+ boutons. (D) Left, Representative Airyscan confocal image of VGAT/CB1 labeling. Center, Representative single CB1 boutons with VGAT reconstructed in 3D. Right, VGAT volume in CB1+ boutons was significantly reduced by 25 min WIN treatment. Superplot indicates distribution of all VGAT puncta color-coded by slice. Overall mean of slices is indicated with the black circle, 95% CI is indicated with the vertical black line. Control: 1.0 ± 0.12 v. WIN: 0.57153 ± 0.10 (Mean ± S.E.M.); Two-sample t-test, p=0.0242, n = number of slices (six slices, six rats per condition).
Figure 2 with 2 supplements
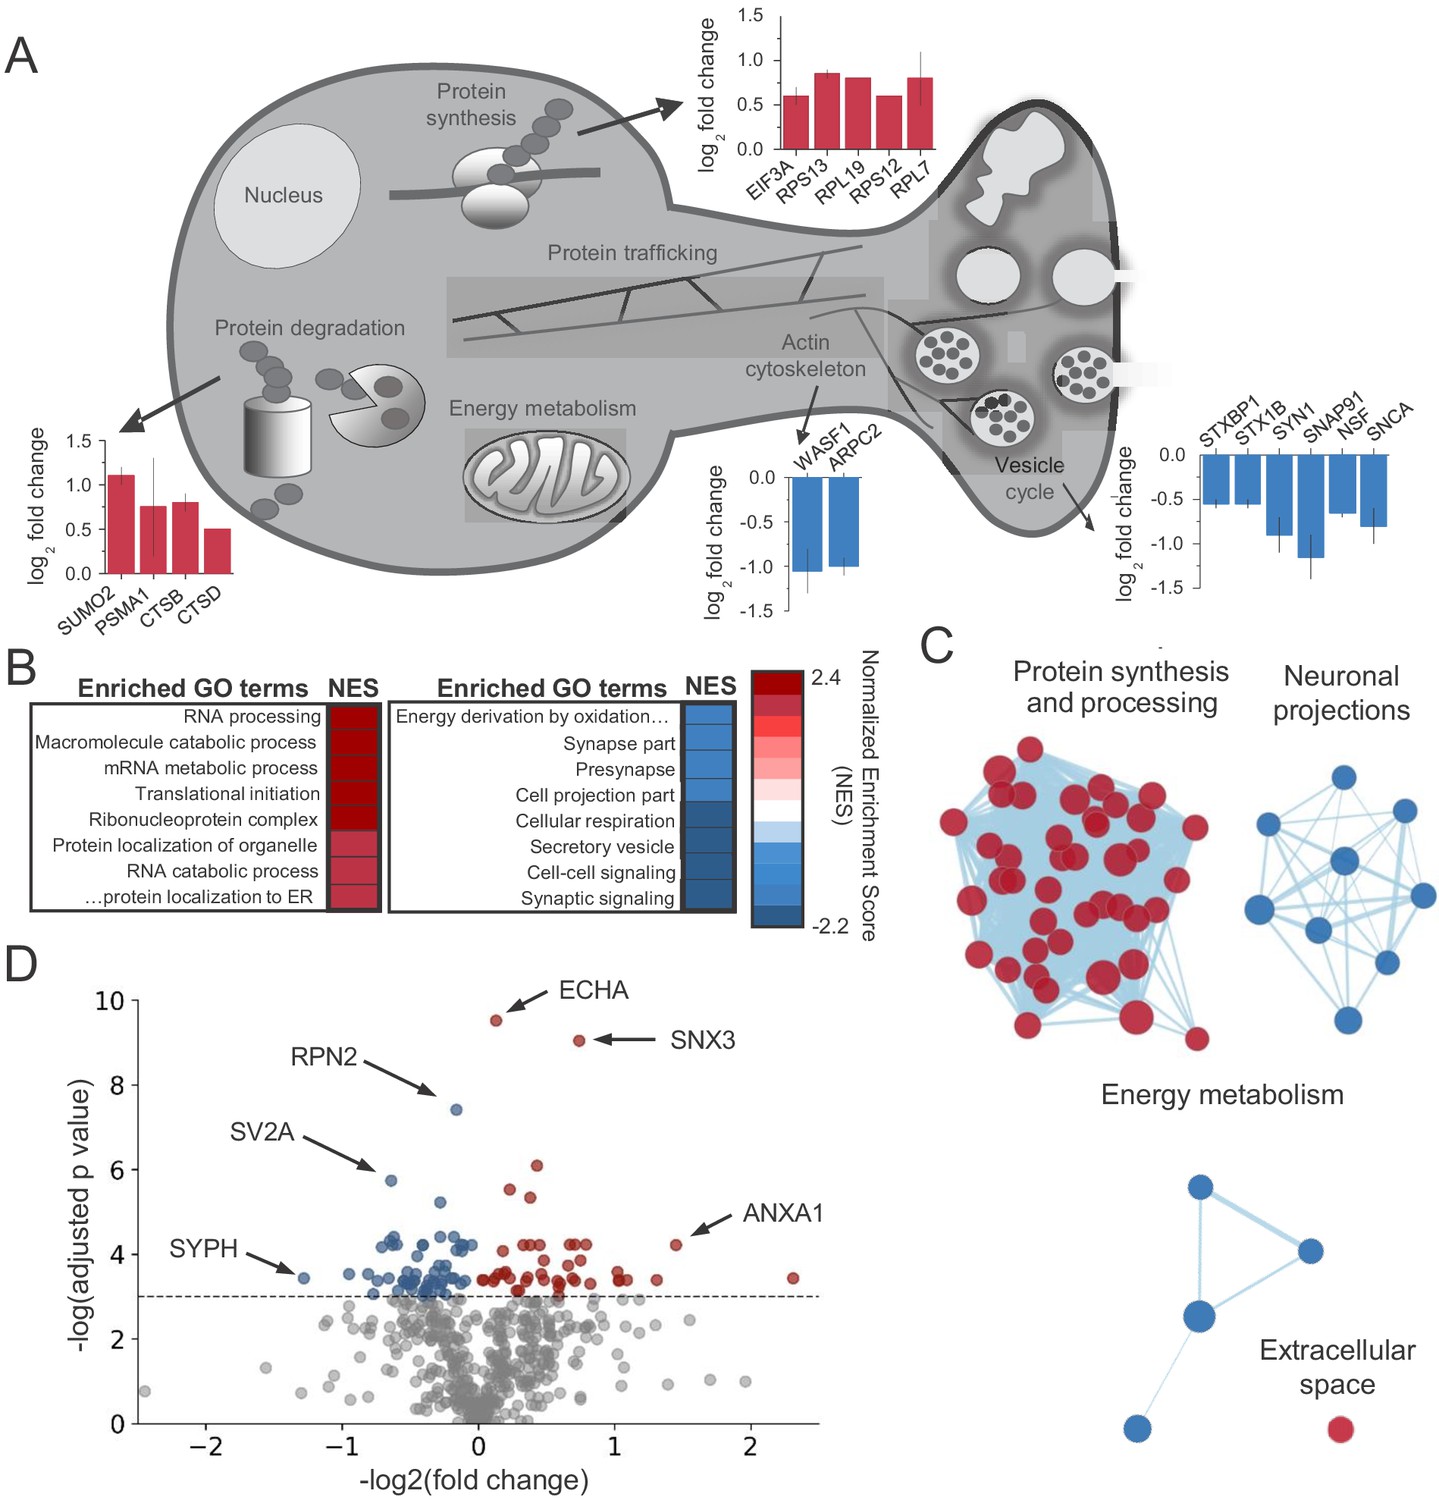
CB1activation alters the abundance of proteins linked to protein synthesis, synaptic structure/function and energy metabolism.
(A) Examples of proteins that were identified in enriched GO terms and were significantly altered by CB1 activation (p<0.05). Proteins are grouped by proposed biological function and average log2 fold change is plotted. (B) List of enriched GO terms and normalized enrichment scores (NES) as identified by GSEA. Positive NES reflects overall upregulation of proteins associated with the GO term whereas negative values indicate the opposite. (C) Cluster analysis of enriched/depleted GO terms from GSEA revealed four distinct biological processes that were consistently up- or downregulated by CB1 activation. Each node represents a single GO term. Node size represents magnitude of enrichment and edge length gives degree of overlap between 2 GO terms. Color represents up (red) or downregulation (blue) of proteins associated with that GO term. See Figure 2—figure supplement 2 for examples. (D) Volcano plot of differentially expressed proteins between vehicle and CB1 activation. Red dots: differentially expressed proteins showing upregulation (adj. p<0.05 and log2 fold change >0). Blue dots: differentially expressed proteins showing downregulation (adj. p<0.05 and log2 fold change <0). six select top hits are highlighted: ECHA: trifunctional enzyme subunit alpha (mitochondrial); SNX3: Sorting nexin-3; RPN2: Subunit of the oligosaccharyl transferase; SV2A: Synaptic vesicle glycoprotein 2A; ANXA1: Annexin A1; SYPH: Synaptophysin.
Figure 2—figure supplement 1
SILAC experiment design and additional analysis.
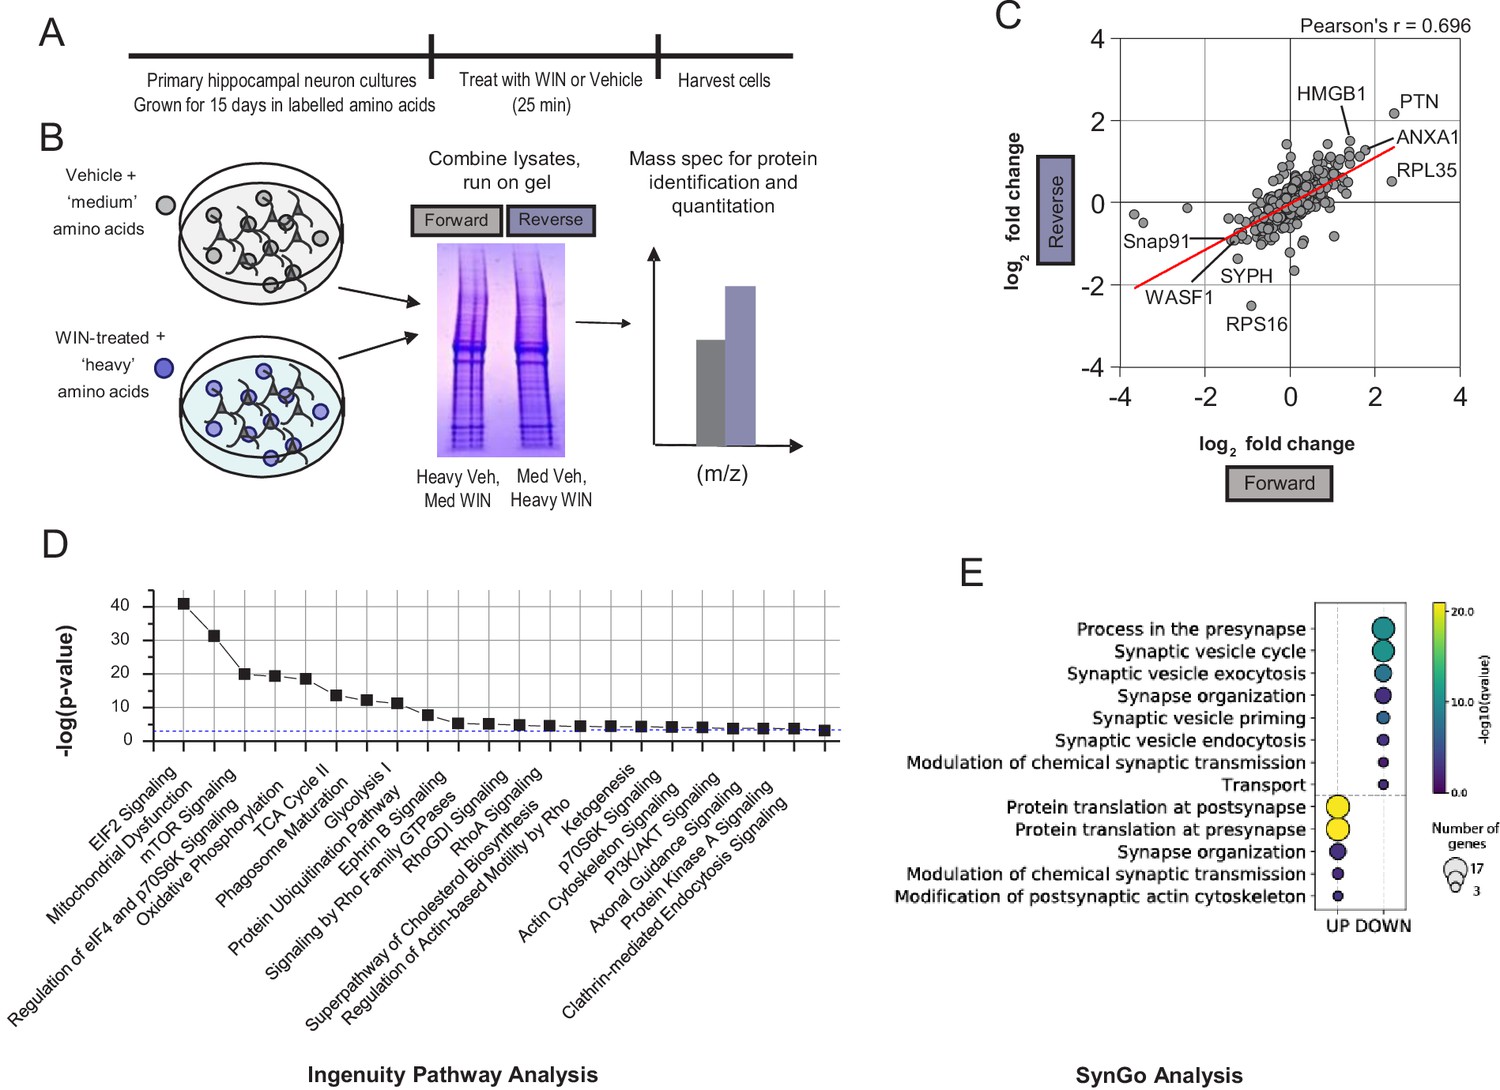
(A) Experimental timeline for SILAC. Neurons were grown for 15 days in isotope-labeled amino acids, before being treated for 25 min with WIN and harvested. (B) Schematic of workflow to identify proteins. Cultures were lysed and combined to give ‘forward’ and ‘reverse’ replicates. Mass spectrometry was performed for identification and quantification of proteins altered by WIN treatment. (C) Scatterplot of all proteins identified in forward and reverse experiments by log2 fold change. Forward and reverse experiments are significantly correlated indicating good reproducibility (Pearson’s correlation coefficient = 0.696, p<0.05). Top regulated proteins are identified. HMGB1 = high mobility group box 1, PTN = pleiotropin, ANXA1 = annexin A1, RPL35 = ribosomal protein 35, SNAP91 = synaptosome associated protein 91. WASF1/WAVE1 = Wiskott Aldrich Syndrome Family 1,SYPH = synaptophysin, RPS36 = ribosomal protein 36. (D) Top 22 selected pathways identified by Ingenuity Pathway Analysis (IPA) ranked by -log10(p-value). Blue dashed line indicates p-value=0.001, all pathways have p<0.001. (E) SynGO term analysis identified significant upregulation of local synaptic translation pathways and downregulation of GO terms involved in presynaptic function, as indicated by log q-value. Size of circle represents number of genes identified per SynGO term.
Figure 2—figure supplement 2

Examples of GO terms in each cluster are provided.
Enrichment score (green line) is computed by individual protein rank (black vertical lines) in the ranked list for each GO term and direction of change (up vs. down vs. no change).
Figure 3 with 1 supplement
CB1-iLTD involves actin remodeling via Rac1 and Arp2/3.
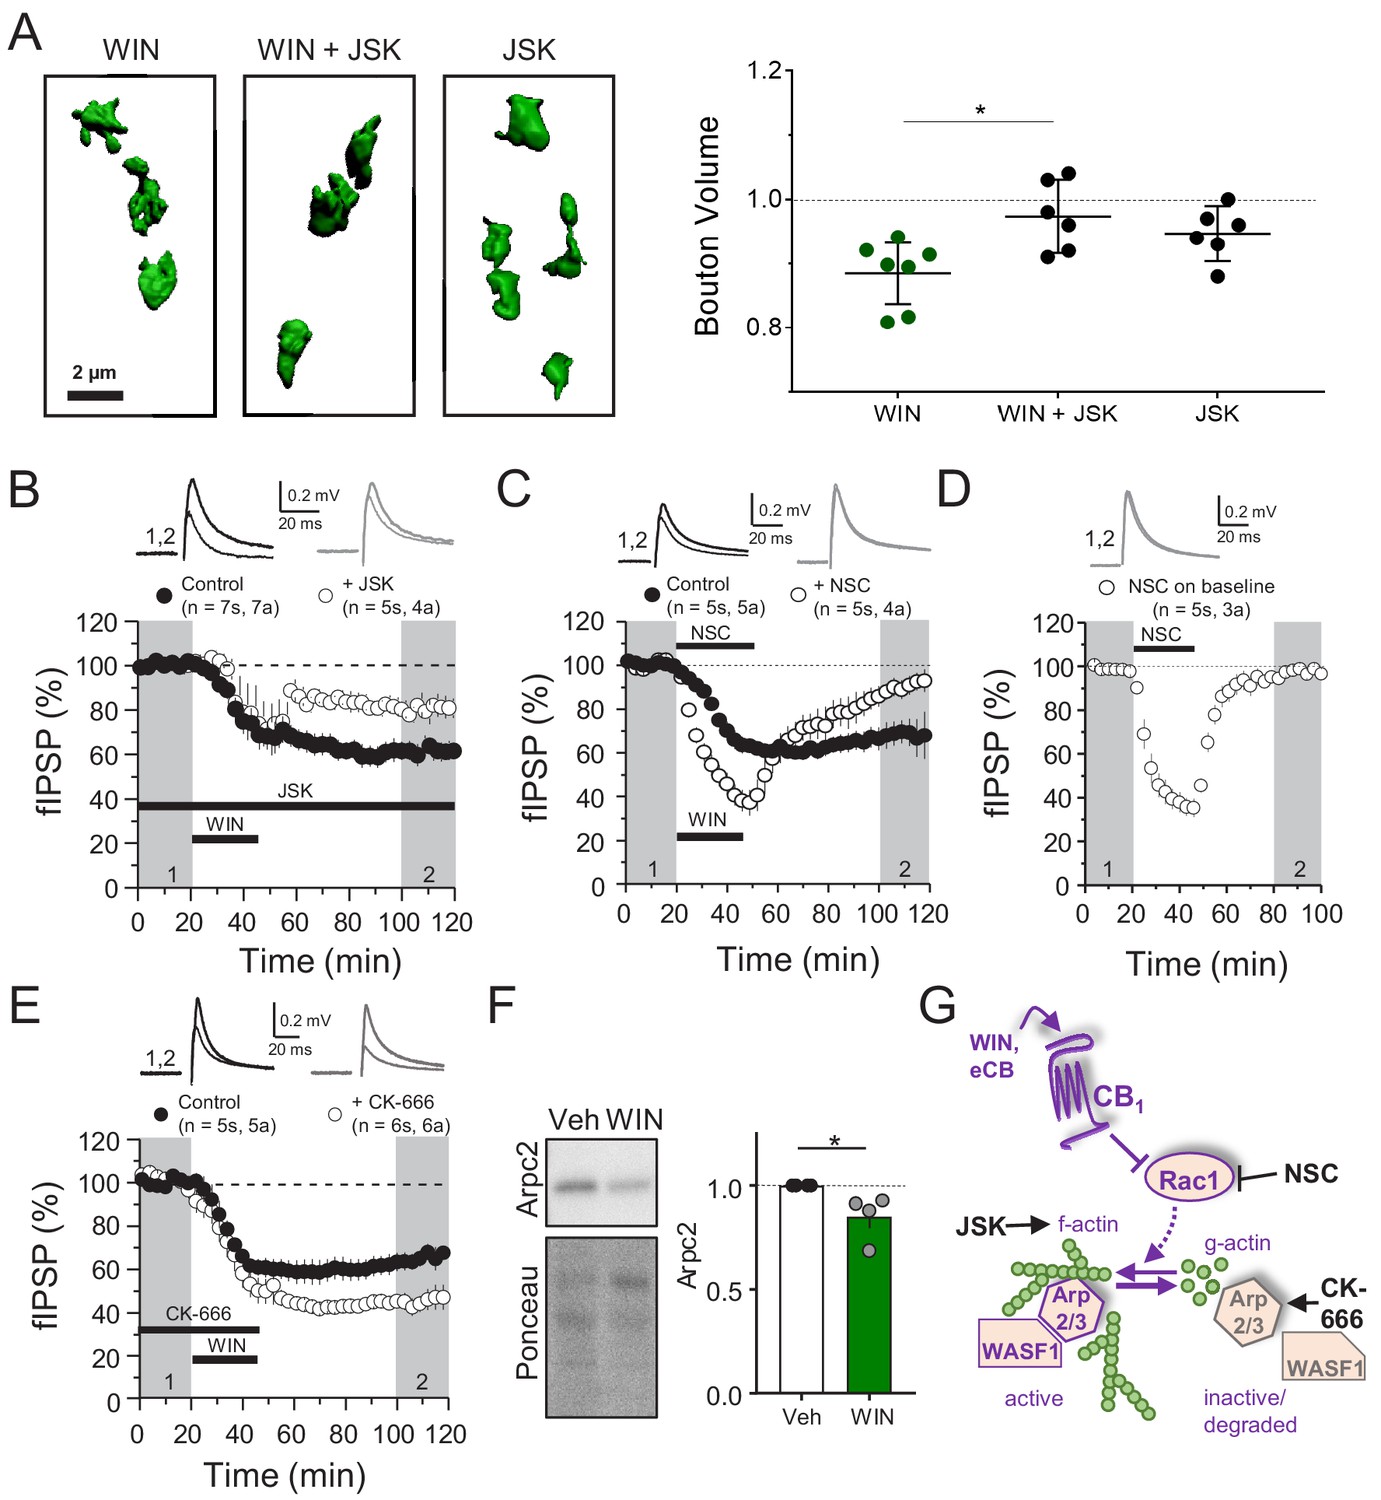
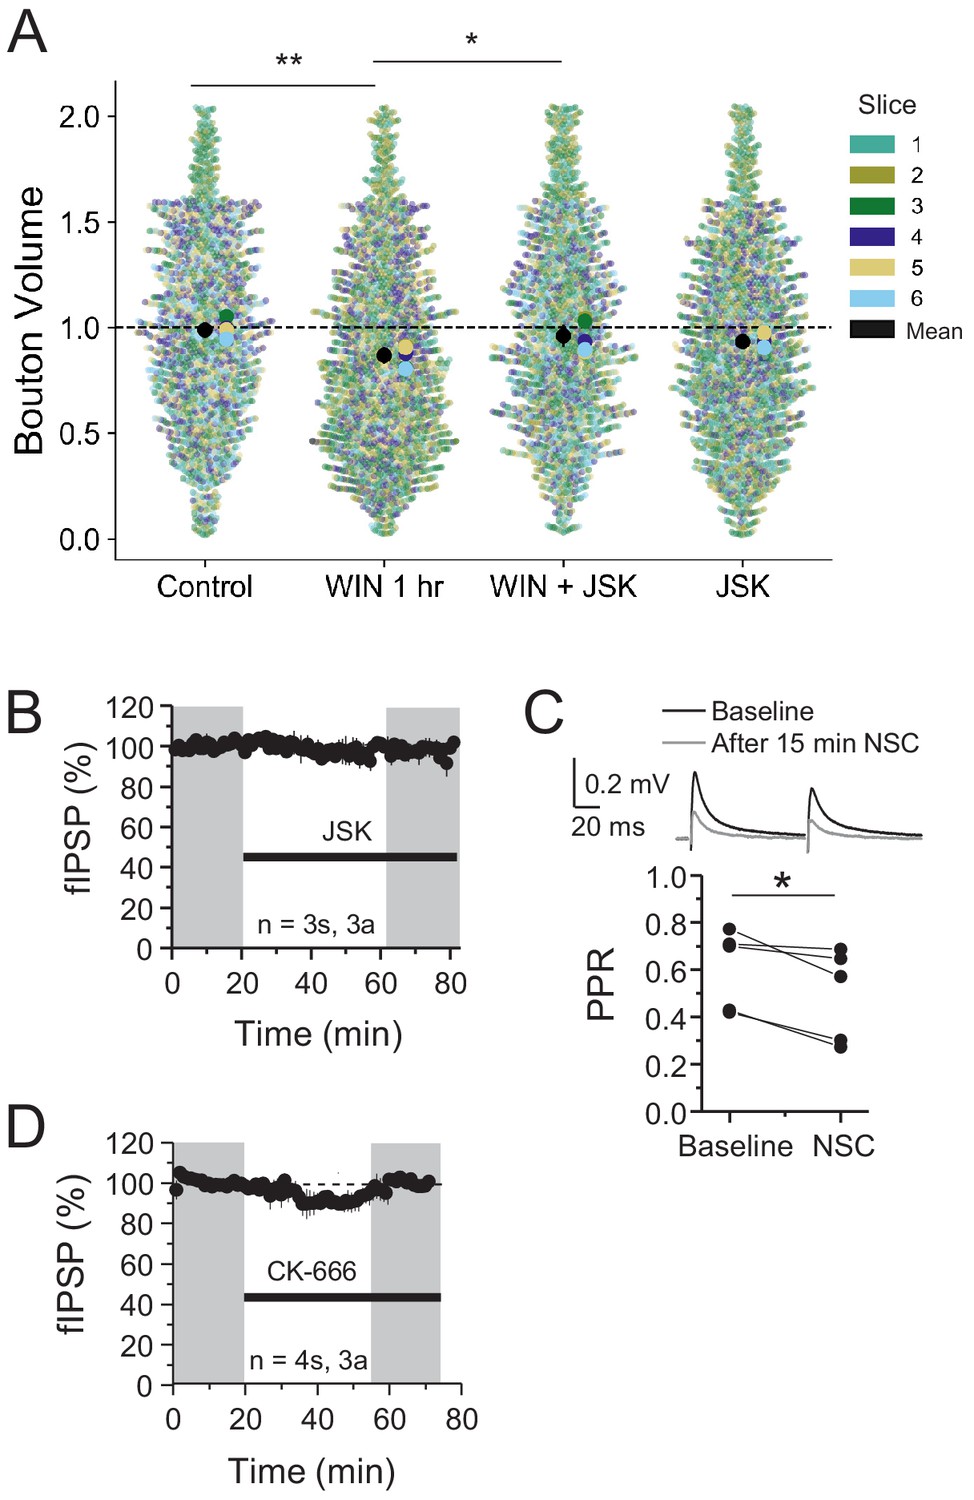
(A) Left, representative single boutons reconstructed in 3D. Right, quantification of mean bouton volume per slice normalized to control. Activation of CB1 receptors with WIN for 25 min led to decreased bouton volume that was blocked by treatment with jasplakinolide (JSK, 250 nM). Summary data expressed as normalized change from Control. WIN + 1 hr: 0.89 ± 0.02 vs. WIN + JSK: 0.97 ± 0.02 vs. JSK: 0.95 ± 0.02 (Mean ± S.E.M.); F[2,16]=5.56, p=0.015, one-way ANOVA with post-hoc Tukey test for multiple comparisons. WIN vs. WIN + JSK: CI[−0.16,–0.018], p=0.014. n = number of slices (three images/slice, 1–2 slices/rat, six rats/condition). For all structural plasticity figures, data are presented as points representing mean bouton volume per slice with a horizontal black line representing the mean per condition and the vertical line indicating 95% confidence interval (CI). 95% CIs are given as CI[lower CI, upper CI]. p-Values are exact. Refer to Figure 3—figure supplement 1A for distribution of individual bouton values. (B) CB1-iLTD is impaired by bath application of actin-stabilizing drug, jasplakinolide (JSK, 250 nM). Extracellular field inhibitory postsynaptic potential (fIPSP) were recorded in the CA1 pyramidal cell body layer in acute hippocampal slices. Control: 61.4 ± 4% vs. JSK: 80.5 ± 4%; p<0.05, unpaired t-test. Unless otherwise specified, n = number of slices (s), number of animals (a). (C) CB1-iLTD was blocked by acute bath application of the Rac1 inhibitor NSC (30 µM). Control: 68.8 ± 6% vs. NSC23766: 89.7 ± 4%; p<0.05, unpaired t-test. (D) NSC (30 µM) bath application reversibly depressed basal transmission. NSC: 98 ± 2%, one sample t-test, p>0.05. (E) CB1-iLTD is enhanced by acute bath application of the Arp2/3 inhibitor CK-666 (100 µM). Control: 63.8 ± 4% vs. CK-666: 45.2 ± 4%, p>0.05, unpaired t-test. (F) Left, representative Western blots of staining for Arpc2 and Ponceau loading control in vehicle or WIN-treated hippocampal cultures. Right, Arpc2 was downregulated in hippocampal neuron cultures after CB1 activation with WIN (5 µM, 25 min). Arpc2 (Fold of Veh): 0.851 ± 0.06, U = 16, Z = 2.31, * indicates p<0.05, Mann-Whitney. Dots represent individual values for four independent experiments. Data in the bar plot represent mean ± S.E.M. (G) Proposed model of CB1-iLTD pathway and mechanism of action of pharmacological reagents. CB1 activation triggers protein synthesis (not shown) and leads to inhibition of Rac1 which causes disassembly of the Arp2/3-WASF1 complex. Arp2/3 is degraded leading to actin remodeling. Actin dynamics are required for CB1-iLTD. NSC inhibits Rac1-GEF interaction. CK-666 stabilizes the inactive conformation of Arp2/3, preventing it from binding actin filaments. JSK stabilizes actin filaments and promotes polymerization.
Figure 3—figure supplement 1
Individual bouton sizes are altered by CB1-iLTD and dependent on actin dynamics but actin inhibitors have no effect on basal transmission.
(A) Quantification of bouton volume normalized to control by slice. Activation of CB1 receptors with WIN for 25 min led to decreased bouton volume that was blocked by treatment with jasplakinolide (JSK, 250 nM). Superplot shows individual bouton volume values color-coded by slice in swarmplot with solid larger dots overlaid representing mean bouton volume per slice. Overall mean of each slice is given by solid black circle with 95% CI represented by the vertical black line. Control: 1.0 ± 0.02 vs. WIN 1 hr: 0.88 ± 0.02 vs. WIN + JSK: 0.97 ± 0.02 vs. JSK: 0.95 ± 0.02 (Mean ± S.E.M.); F[3,20]=7.33, p=0.0017, one-way ANOVA with post-hoc Tukey test for multiple comparisons. WIN 1 hr vs. Control: CI [−0.20,–0.04], p=0.0016, WIN 1 hr vs. WIN + JSK: CI [−0.17,–0.017], p=0.012. n = number of slices (three images/slice, one slice/rat, six rats). 95% Confidence intervals (CI) are given as CI[lower CI, upper CI]. p-Values are exact. (B) JSK (250 nM) had no effect on baseline. JSK: 97.76 ± 2.8, one-sample t-test, p>0.05. For all electrophysiology figures, averaged summary data expressed as normalized change from baseline ± S.E.M. and n = number of slices (s), number of animals (a). (C) NSC application on baseline caused decreased PPR (measured at 35–45 min) suggesting a presynaptic target. Pre: 0.65 ± 0.06 vs. NSC: 0.57 ± 0.08, paired-sample t-test, p<0.05, n = 5 slices (same as Figure 4B). (D) CK-666 (100 µM) had no effect on baseline. CK-666: 95.44 ± 5.0, one sample t-test, p>0.05.
Figure 4

Presynaptic proteins are rapidly reduced following CB1 activation.
(A) Combined score plot of differentially expressed proteins between vehicle vs. CB1 activation with WIN. Blue dots are manually selected presynaptic cytomatrix and release machinery proteins. SYPH: Synaptophysin; SV2A: Synaptic vesicle glycoprotein 2A; Synaptosome associated protein 91: SNAP91; WASF1: Wiskott-Aldrich syndrome protein family member 1; NSF: Vesicle-fusing ATPase; SNG1: synaptogyrin; MUNC18: mammalian homologue of UNC-18; SYUA: alpha-synuclein; SYN1: Synapsin-1; ARPC2: Arp complex subunit 2; STX1A-B: Syntaxin1A-1B; SYUB: beta-synuclein; NCKP1: Nck-associated protein 1. (B) Combined score plot of differentially expressed proteins between vehicle vs. CB1 activation with WIN. Yellow dots are manually selected ubibquitin-proteasome system-related proteins. Note that the only downregulated protein is a de-ubiquitinase. UCHL1: Ubiquitin carboxyl-terminal hydrolase isozyme L1; PSB 2,3,4,5,6: Proteasome subunit beta type-2,4,5,6; PSA 1,6: Proteasome subunit alpha type 1,6; SUMO2: Small ubiquitin-related modifier 2; PSME1: Proteasome activator complex subunit 1. (C) Left, representative Western blot images of staining for presynaptic proteins Munc18-1, Synapsin-1, and α-Synuclein and Ponceau loading control in vehicle vs. WIN-treated hippocampal cultures (5 µM, 25 min). Right, quantification of three experimental replicates normalized to Vehicle revealed a decrease in all three proteins consistent with SILAC. Munc18-1: 0.78 ± 0.09, p<0.05; Synapsin-1: 0.60 ± 0.11, p<0.01; α-Synuclein: 0.86 ± 0.01, p<0.0001, unpaired t-test, n = number of cultures. (D) Top, Airyscan confocal representative images of CB1+ boutons in acute hippocampal slices in CA1 pyramidal layer showing colocalization of CB1+ boutons (green) and Synapsin-1 (magenta). Bottom, Gardner-Altman estimation plot showing the mean difference between Control and WIN of intensity of Synapsin-1 puncta within CB1+ boutons per slice was significantly diminished by WIN application (5 µM, 25 min). Both groups are plotted on the left axes; the mean difference is plotted on a floating axes on the right as a bootstrap sampling distribution. The mean difference is depicted as a dot; the 95% confidence interval is indicated by the ends of the vertical error bar. Control: 1.0 ± 0.09, WIN: 0.73 ± 0.06 (Mean ± S.E.M.), n = number of slices (10 slices, four rats/condition). The unpaired mean difference between Control and WIN is −0.267 [95.0%CI −0.494, −0.0819]. Two-sided permutation t-test, p=0.0234.
Figure 5 with 1 supplement
CB1-iLTD requires ubiquitination, but not degradation by the proteasome.
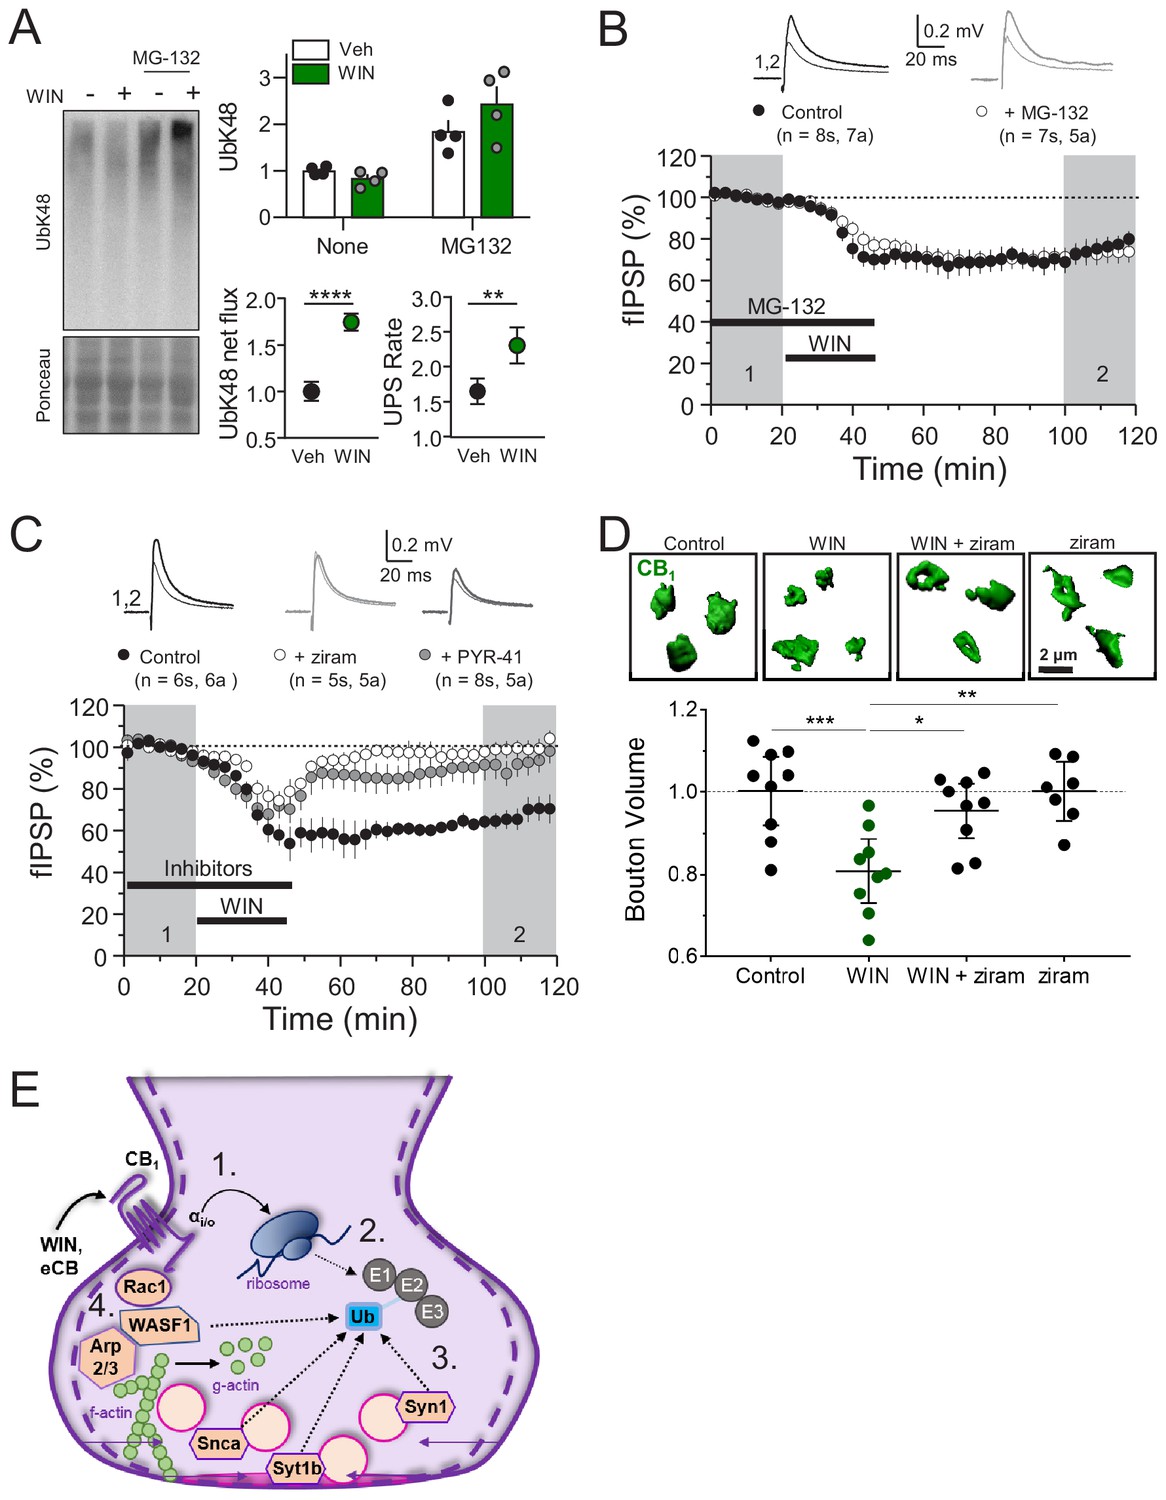
(A) Left, representative Western blot images of K48 polyubiquitin in hippocampal slices treated with Veh v. WIN or Veh v. WIN and MG-132. Right, top: Levels of K48 polyubiquitin following CB1 activation with WIN (5 µM, 25 min). Bottom left: UPS net flux [difference between basal (none) and proteasome blockade (MG-132) condition] is significantly increased upon CB1 activation. Control: 1.0 ± 0.04 vs. WIN: 1.74 ± 0.04, unpaired t-test, ****=p < 0.0001, n = 5 animals. Bottom right: UPS rate [ratio between MG-132 and basal condition] of K48 polyubiquitinated protein degradation is significantly increased after WIN. Control: 1.65 ± 0.08 vs. WIN: 2.31 ± 0.12, unpaired t-test, **=p < 0.01, n = 5 animals. (B) Blockade of the proteasome by bath application of MG-132 (5 µM) had no effect on iLTD. Control: 77.6 ± 4% vs. MG-132: 73.3 ± 5%; p>0.05, unpaired t-test. For all electrophysiology figures, averaged summary data expressed as normalized change from baseline ± S.E.M. and n = number of slices (s), number of animals (a). (C) Inhibiting ubiquitination with ziram (25 µM) or PYR-41 (50 µM) fully blocked iLTD. Control: 66 ± 5 vs. ziram: 99 ± 4 vs. PYR-41: 93 ± 6; F[2,19]=10.22; p<0.05, one-way ANOVA. (D) Blockade of E1 ubiquitin ligase function with ziram (25 µM, 25 min) rescued the volumetric decrease associated with CB1 activation by WIN (5 µM, 25 min). Top, representative inhibitory boutons immunolabeled with CB1 and reconstructed in 3D. Bottom, quantification of normalized mean CB1 bouton volume per slice. Control: 1.0 ± 0.04 vs. WIN: 0.81 ± 0.03 vs. WIN + ziram: 0.95 ± 0.03 vs. ziram: 1.0 ± 0.03 (mean ± S.E.M.); F[3,30]=8.11, p=0.0004, one-way ANOVA with post-hoc Tukey test for multiple comparisons. Control vs. WIN: CI[0.07,0.32], p=0.0008; WIN vs. WIN + ziram: CI[−0.27,–0.025], p=0.014; WIN vs. ziram: CI[−0.32,–0.063], p=0.0018. n = number of slices (three images/slice, one slices/rat, nine rats/condition for Control, WIN, WIN + ziram, seven rats/condition for ziram). For all structural plasticity figures, data are presented as points representing mean bouton volume per slice with a horizontal black line representing the mean per condition and the vertical line indicating 95% confidence interval (CI). 95% CIs are given as CI[lower CI, upper CI]. p-Values are exact. Refer to Figure 5—figure supplement 1E for distribution of individual bouton values. (E) Schematic summary of proposed mechanism of CB1–iLTD 1. CB1 activation rapidly engages presynaptic protein synthesis (Younts et al., 2016). 2. CB1–iLTD increases components of the ubiquitin/proteasome system and leads to enhanced proteasomal activity (Figure 4A,B and (A)) 3. Ubiquitination is required for concomitant decrease in the volume of the bouton (D) and reduction in neurotransmitter release (C). 4. CB1–iLTD involves signaling via Rac1 and Arp2/3 and actin dynamics.
Figure 5—figure supplement 1
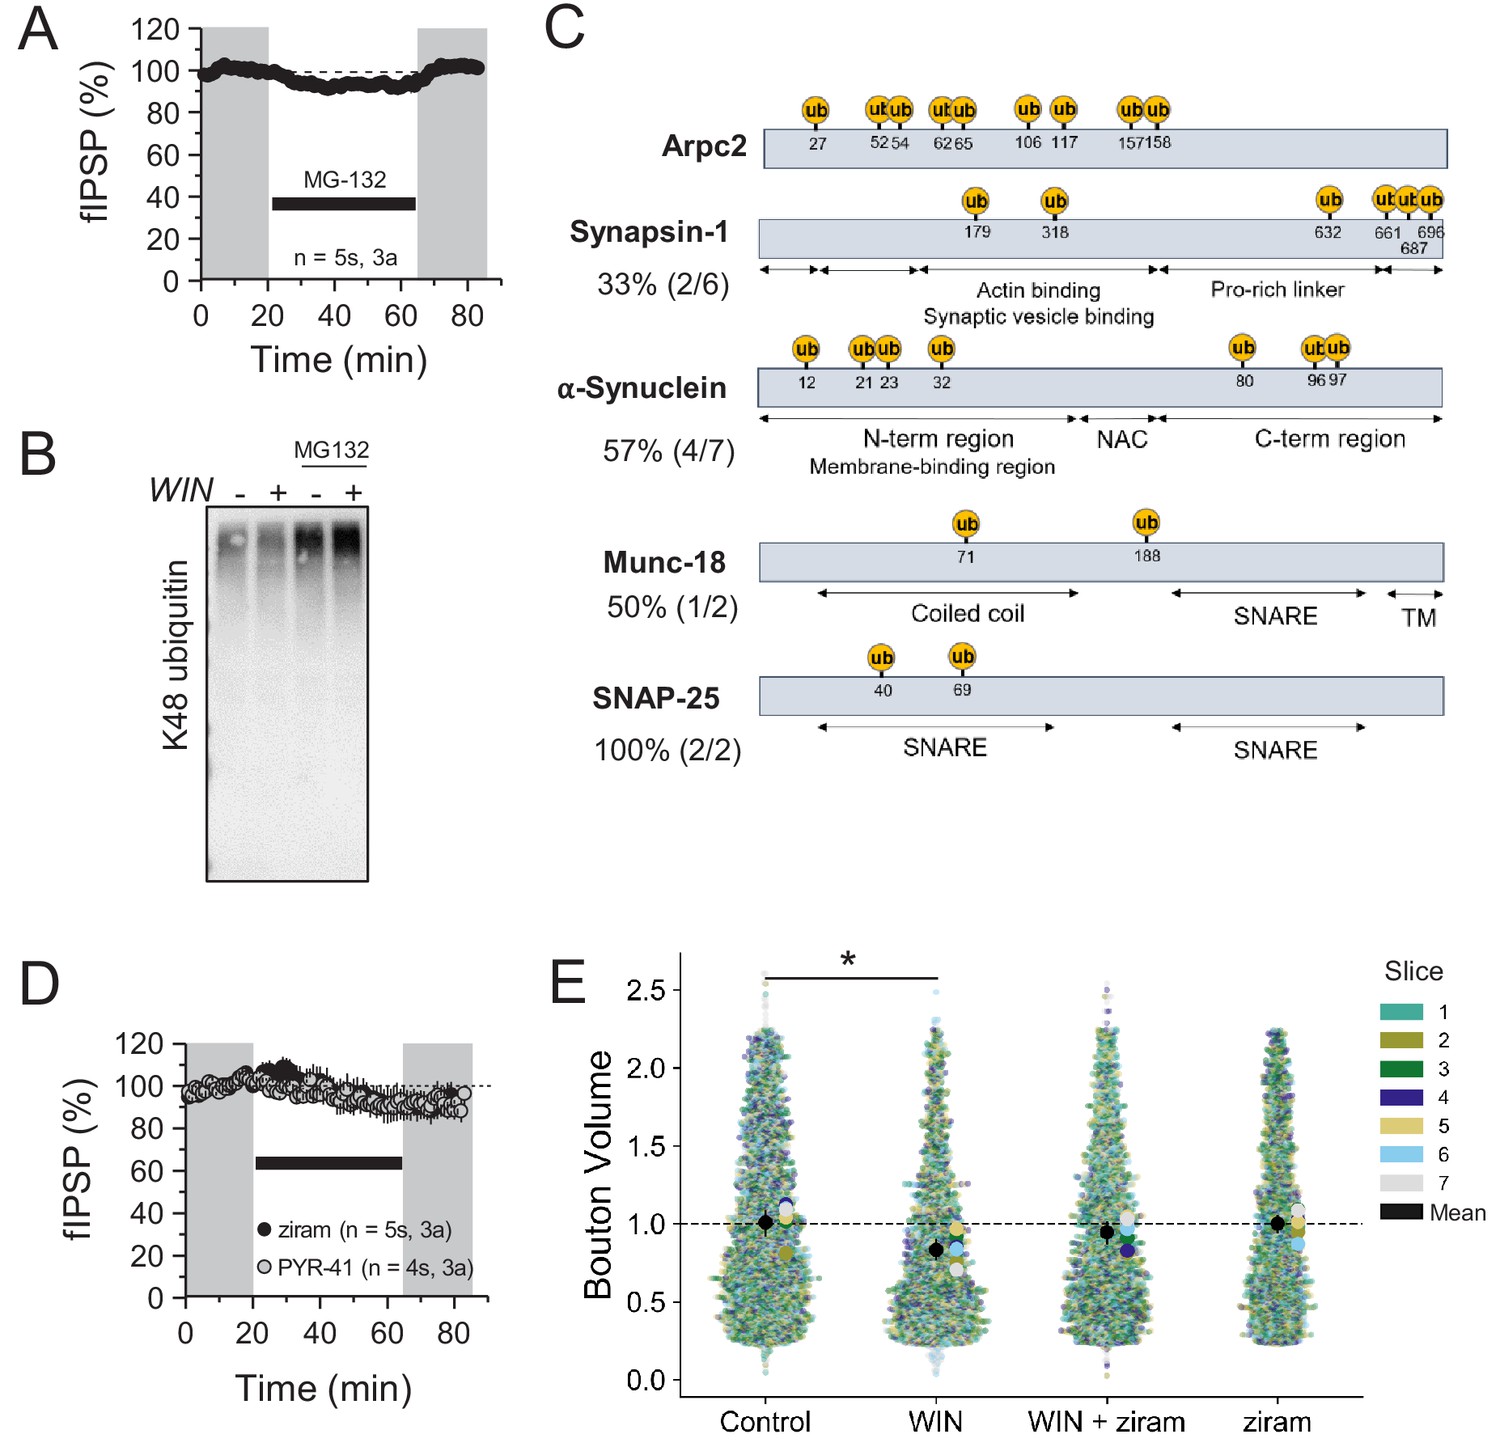
CB1-iLTD results in changes in proteins with ubiquitination sites in functional domains.
(A) MG-132 (5 µM) did not cause a change in baseline transmission upon washout. MG-132: 99.66 ± 2.43%; p>0.05, one sample t-test. For all electrophysiology figures, averaged summary data expressed as normalized change from baseline ± S.E.M. and n = number of slices (s), number of animals (a). (B) Western blot of accumulated K48 ubiquitinated proteins when proteasome is blocked with 5 µM MG-132 demonstrated the efficacy of the drug. (C) Predicted ubiquitination sites based on protein sequence plotted with UbiSite. Percentage represents # of predicted Ub sites in functional domains of protein divided by total predicted sites. Note: no protein structure data was available for Arpc2. NAC: non-amyloid component region of α-synuclein. SNARE: SNARE protein interaction site. TM: transmembrane domain. (D) Ziram (25 µM) or PYR-41 (50 µM) did not cause a significant change in baseline transmission. ziram: 91.56 ± 6.49%; p>0.05, one sample t-test. PYR-41: 91.49 ± 4.0; p>0.05, one sample t-test. (E) Quantification of normalized CB1 bouton volume by slice. Superplot shows individual bouton volume values color-coded by slice in swarmplot with solid larger dots overlaid representing mean bouton volume per slice. Overall mean of each slice is given by solid black circle with 95% CI represented by the vertical black line. Control: 1.00 ± 0.05 vs. WIN: 0.83 ± 0.03 vs. WIN + ziram: 0.95 ± 0.04 vs. ziram: 1.00 ± 0.03 (Mean ± S.E.M.); F[3,24]=4.87, p=0.009, one-way ANOVA with post-hoc Tukey test for multiple comparisons. WIN vs. Control: CI [−0.32,–0.032], p=0.013, WIN vs. Control: CI[−0.32,–0.032], p=0.013, ziram vs. WIN: CI[0.03, 0.31], p=0.02. n = number of slices (three images/slice, one slice/rat, seven rats/condition). 95% Confidence intervals (CI) are given as CI[lower CI, upper CI]. p-Values are exact.
Author response image 1
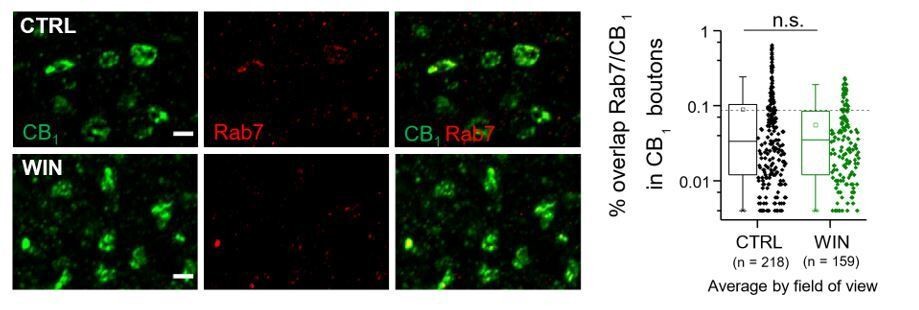
Left, Airyscan confocal images of Rab7/CB1 labeling.
Right, % overlap of CB1 and Rab7 within CB1+ boutons was not significantly altered by 25 min WIN treatment when quantified as average per field of view nor by animal. CTRL: 0.09 ± 0.01 v. WIN : 0.06 ± 0.004, U = 18111; Z = 0.746, n.s. indicates p > 0.05; Mann-Whitney. n = number of fields of view (3 images/ slice, 1 slices/rat, 5 rats/CTRL, 4 rats/WIN). Data are presented as box plots (left) and data points (right) where box represents the 25th and 75th percentile of data range, mean is represented with a square, and median with a line inside the box.
Author response image 2

Author response image 3
Author response image 4

Tables
Key resources table
| Reagent type (species) or resource | Designation | Source or reference | Identifiers | Additional information |
|---|---|---|---|---|
| Biological sample wildtype, Sprague Dawley, Rattus norvegicus, male and female | Primary hippocampal neuron cultures | Charles River | Isolated from DIV 20–21 pups | |
| Biological sample wildtype, Sprague Dawley, Rattus norvegicus, male and female | Acute hippocampal slices | Charles River | Isolated DOB 18–25 rats | |
| Antibody | CB1 (rabbit polyclonal) | ImmunoGenes | Cat# CB1, RRID:AB_2813823 | 1:1000 |
| Antibody | Synapsin 1 (mouse monoclonal) | Synaptic Systems | Cat# 106 011C2, RRID:AB_10805139 | 1:1000 |
| Antibody | vGAT (mouse monoclonal) | Synaptic Systems | Cat# 131 011C3, RRID:AB_887868 | 1:500 |
| Antibody | Bassoon (mouse monoclonal) | Enzo Life Sciences | Cat# ADI-VAM-PS003, RRID:AB_10618753 | 1:1000 |
| Antibody | Paravalbumin | Sigma-Aldrich | Cat# P3171, RRID:AB_2313804 | 1:1000 |
| Antibody | α-Synuclein | BD Biosciences | Cat# 610787, RRID:AB_398108 | 1:1000 |
| Antibody | Munc-18–1 | Synaptic Systems | Cat# 116 002, RRID:AB_887736 | 1:1000 |
| Antibody | Arp2/3 | Novus | Cat# NBP1-88852, RRID:AB_11040464 | 1:1000 |
| Antibody | Ubiquitin K48 | Millipore | Cat# 05–1307, RRID:AB_1587578 | 1:1000 |
| Software | Igor Pro | IGOR Pro | RRID:SCR_000325 |
Additional files
-
Supplementary file 1
Full protein list and Ingenuity Pathway Analysis.
- https://cdn.elifesciences.org/articles/54812/elife-54812-supp1-v2.xlsx
-
Supplementary file 2
Raw data for GSEA and enrichment map analysis.
- https://cdn.elifesciences.org/articles/54812/elife-54812-supp2-v2.xlsx
-
Transparent reporting form
- https://cdn.elifesciences.org/articles/54812/elife-54812-transrepform-v2.pdf
Download links
A two-part list of links to download the article, or parts of the article, in various formats.
Downloads (link to download the article as PDF)
Open citations (links to open the citations from this article in various online reference manager services)
Cite this article (links to download the citations from this article in formats compatible with various reference manager tools)
CB1-receptor-mediated inhibitory LTD triggers presynaptic remodeling via protein synthesis and ubiquitination
eLife 9:e54812.
https://doi.org/10.7554/eLife.54812


