Disruption of Nrxn1α within excitatory forebrain circuits drives value-based dysfunction
- Department of Neuroscience, United States
- Neuroscience Graduate Group, Perelman School of Medicine, United States
- Department of Psychology, University of Pennsylvania, United States
Figures
Figure 1 with 1 supplement
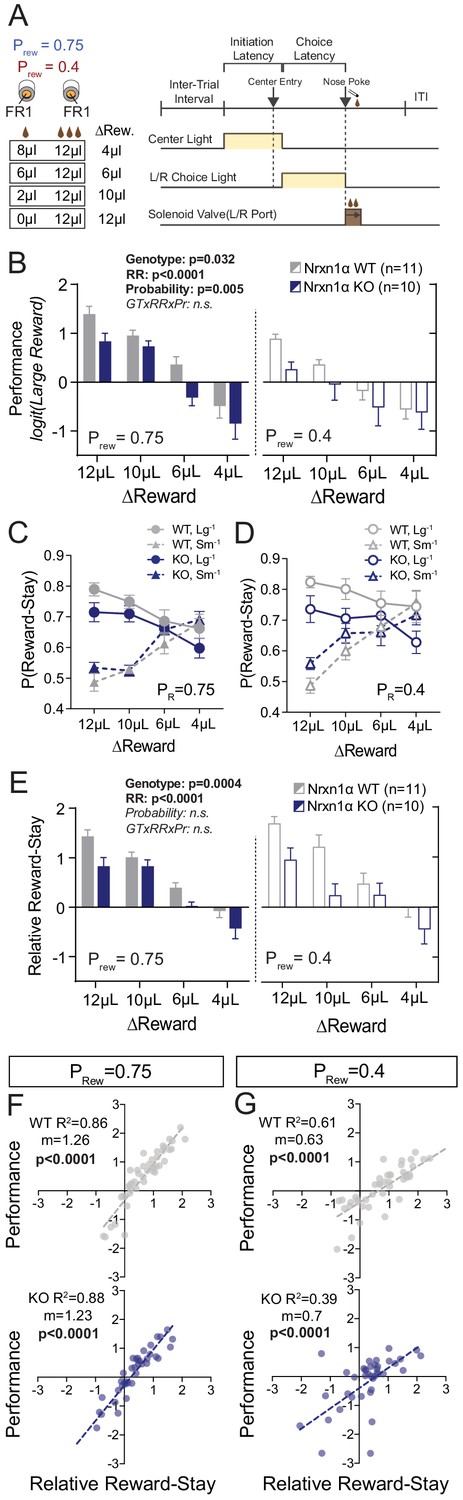
Neurexin1α disruption leads to deficits in value-based selection of actions.
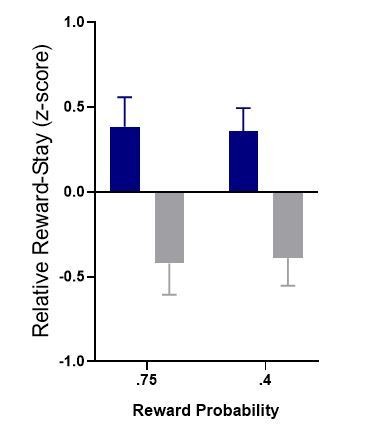
(A) Schematic of trial structure wherein mice perform repeated self-initiated trials with contrasting reward volumes associated with each port. Animals were tested at four relative reward ratios across high (Prew = 0.75) and low (Prew = 0.4) reinforcement rates. See Materials and methods for details. (B) Both probability of reinforcement and volume contrast modulate the probability at which mice select the large reward option. Nrxn1α KOs (blue, n = 10) select the high benefit alternative at a lower rate than their WT littermates (gray, n = 11) across reward environments (three-way RM ANOVA). (C and D) For both WT and KO animals, the relative magnitude of rewarded outcome has a significant effect on the stay-probability for that alternative. (E) The relative reward-stay (RRS), which quantifies the relative tendency of animals to repeat choices after specific outcomes, was sensitive to relative magnitude of rewards but not reward probability. In comparison to WT littermates, Nrxn1α KOs less dynamically alter their choice behavior after large reward outcomes than small reward outcomes (three-way RM ANOVA). (F and G) The RRS is a significant predictor of session performance for both WT and KO mice at both rates of reinforcement. Note RRS is a better predictor of task performance at high reinforcement rates, reflecting the preponderance of unrewarded outcomes in low reinforcement conditions. All data represented as mean ± SEM.
-
Figure 1—source data 1
Source Data for Figure 1.
- https://cdn.elifesciences.org/articles/54838/elife-54838-fig1-data1-v2.xlsx
Figure 1—figure supplement 1
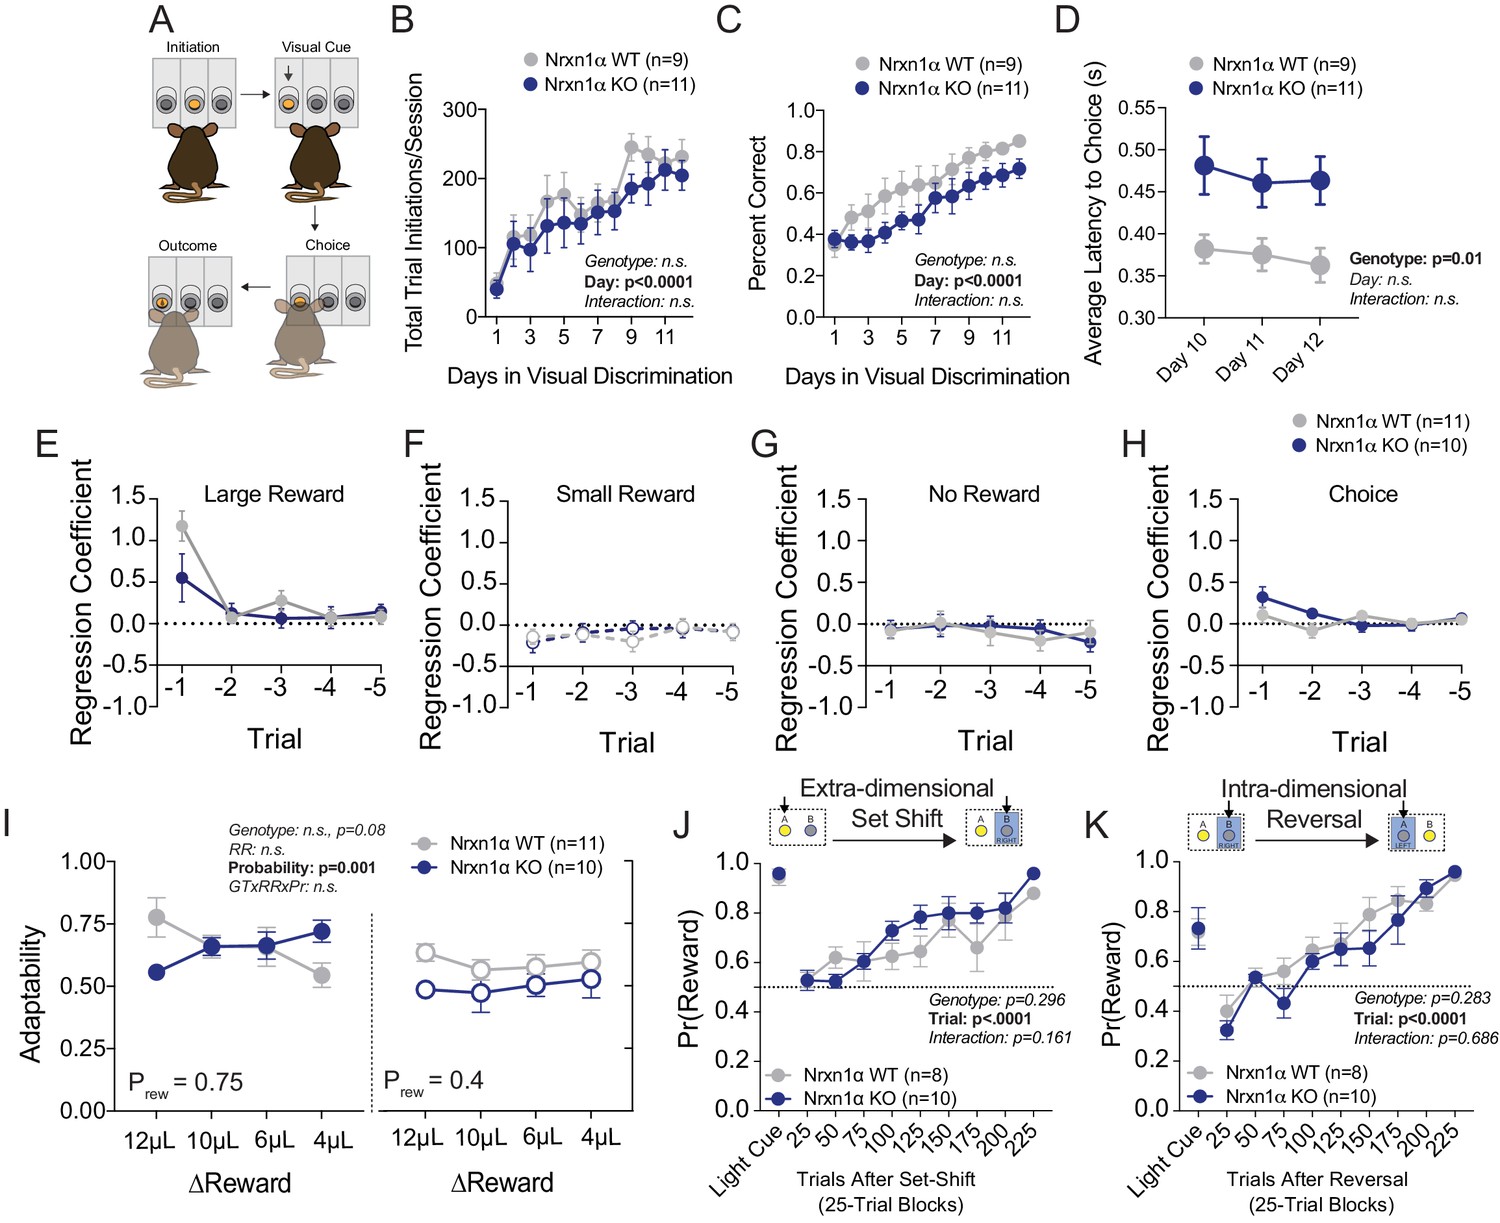
Additional Behavioral Analyses in Nrxn1a KO mice.
(A) Schematic of visual discrimination task. Mice acquired a simple goal-direction contingency over repeated sessions. (B) Task engagement was measured as the total number of registered trial initiations. Nrxn1α KO mice exhibit no difference in task engagement from wild-type littermates during acquisition of visual discrimination. (C) Performance was measured as the proportion of trial initiations that resulted in the selection of the lit port. Nrxn1α mice exhibit no deficit in visual discrimination as compared to wild-type littermates. (D) Nrxn1α KO animals exhibit extended choice latencies throughout the last 3 days of task acquisition. (E–H) Logistic regression coefficients for Nrxn1α wild-type and knockout mice (ΔReward = 12 μL). The influence of past choice and reward outcome is heavily discounted after the t−1 trial. (I) There is a trend toward lower adaptability measures in Nrxn1α knockout mice in the relative reward reversal paradigm (see Figure 1A). (J) Nrxn1α KO animals exhibit similar performance to wild-type controls in extra-dimensional set shift where reward target switches from visual cue to ego-centric spatial cue. (K) Nrxn1α KO animals exhibit similar performance to wild-type controls in egocentric spatial reversal task. (B–D and I–K analyzed by two-way RM ANOVA). All data represented as mean ± SEM.
Figure 2 with 1 supplement

Neurexin1α mutants display altered outcome-dependent task engagement.
(A) A proxy of task engagement was measured as the average latency from trial onset (center-light ON) to initiation. Nrxn1α KOs (blue, n = 10) do not exhibit global deficits in task engagement in comparison to WT animals (gray, n = 11) (three-way RM ANOVA). (B) Relative latency to initiate is a standardized comparison of initiation latencies following large rewarded outcomes and small rewarded outcomes within individual animals. (C) Nrxn1α WT mice modulate their trial-by-trial engagement in response to different rewarded outcomes, initiating trials more quickly after large reward outcomes than small reward outcomes. Nrxn1α KOs do not exhibit this outcome-sensitive modulation of task engagement (three-way RM ANOVA). (D and E, top) There is a significant relationship between the ability of WT mice to select actions in response to reward discrepancy (RRS) and their ability to upregulate task engagement (relative initiation latency) which is lost in KOs (D and E, bottom). All data represented as mean ± SEM.
-
Figure 2—source data 1
Source data for Figure 2.
- https://cdn.elifesciences.org/articles/54838/elife-54838-fig2-data1-v2.xlsx
Figure 2—figure supplement 1
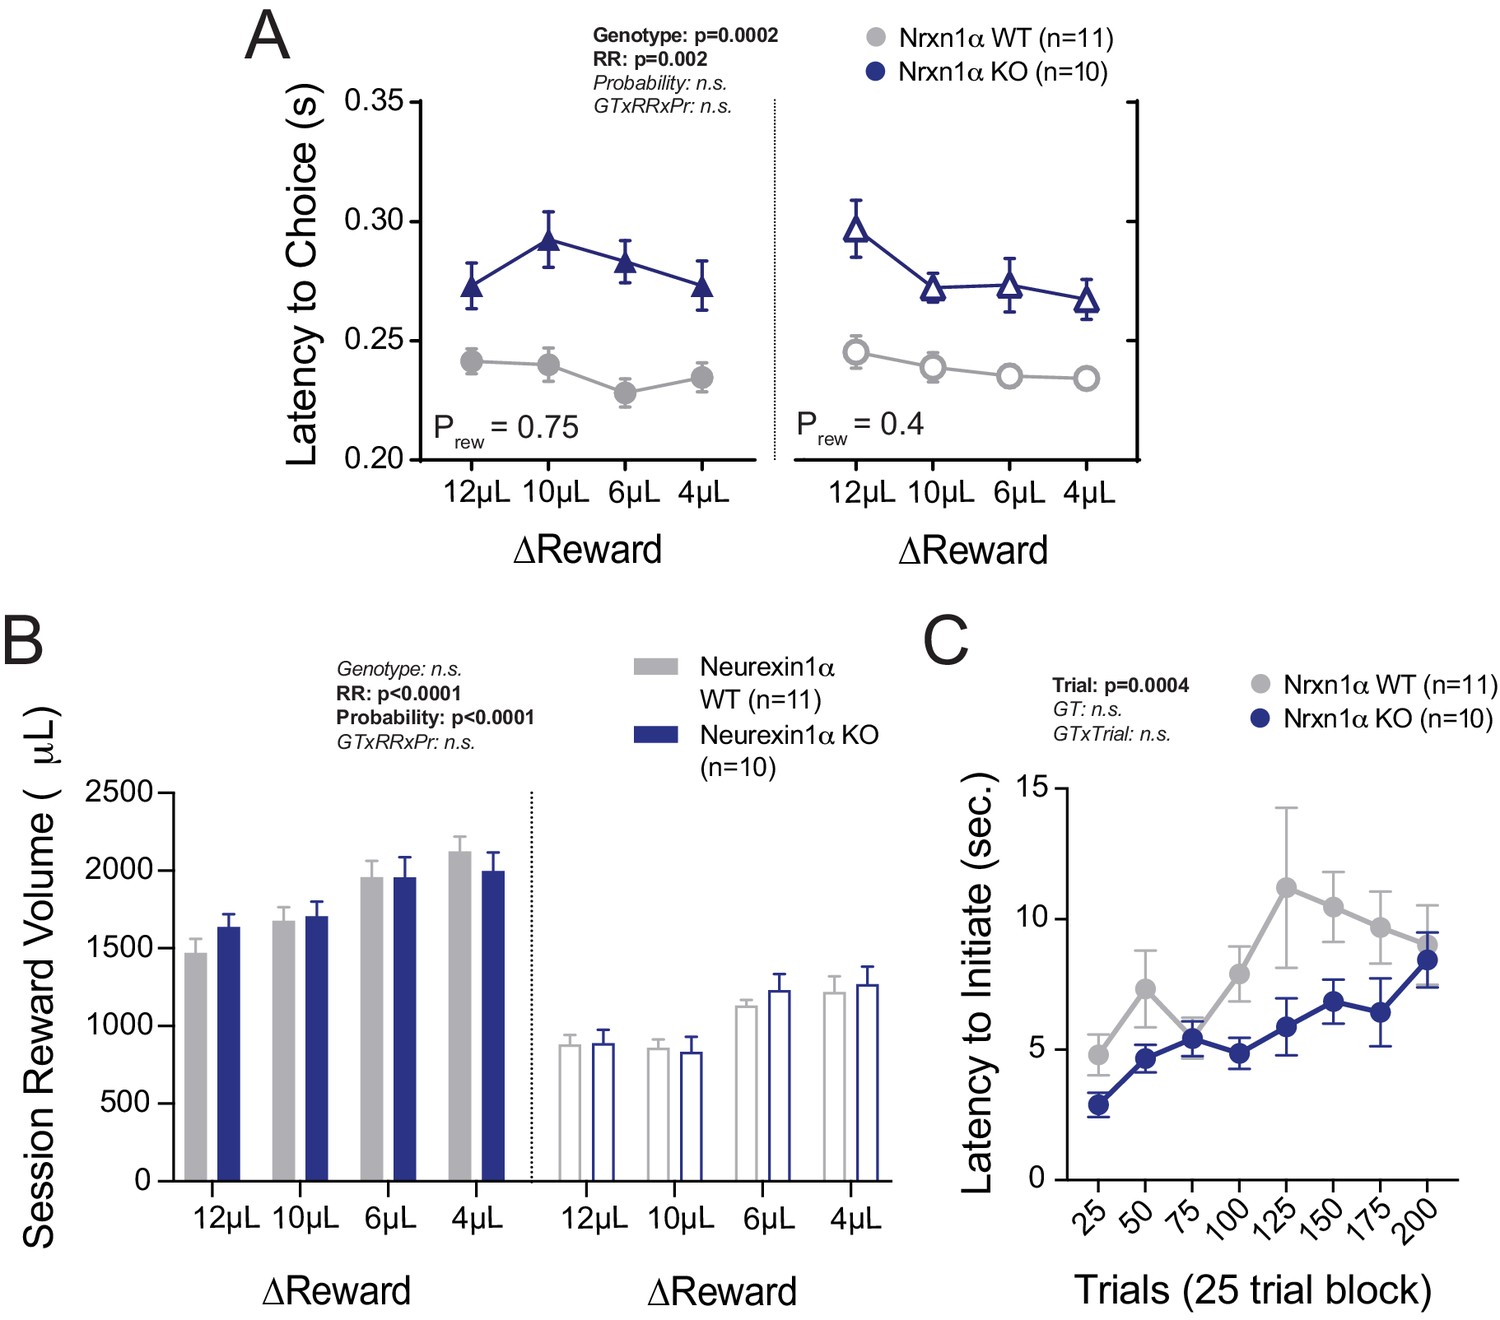
Additional Task Latency and Reward Volume Data.
(A) Nrxn1α KO mice exhibit extended choice latencies across reward environments. (B) There are no genotypic differences in the total session reward consumption, regardless of reward contrast (left) or probability of feedback (right). (C) There is no significant difference between genotypes in the latency to initiate trials over the course of the 12 µL versus 0 µL sessions (Prew = 0.75). All data analyzed by two-way RM ANOVA. All data represented as mean ± SEM.
Figure 3
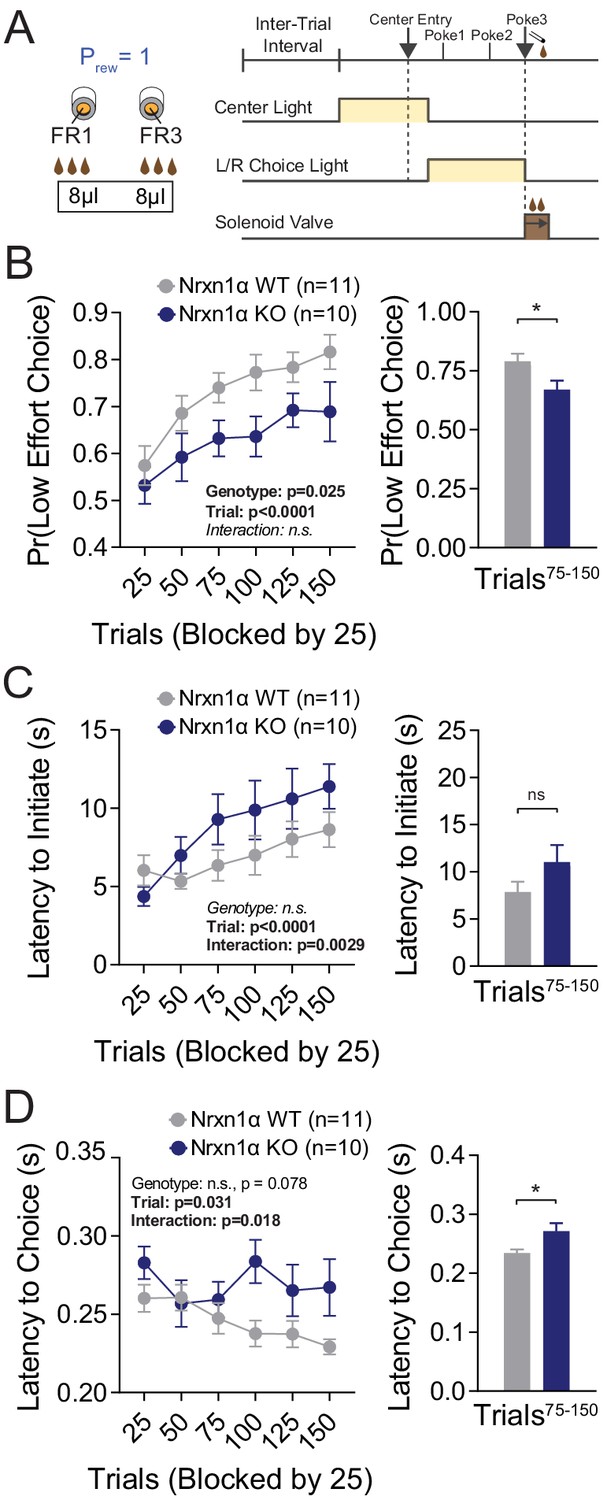
Neurexin1α mutants display a deficit in the selection of actions based on costs.
(A) Effort paradigm schematic. Mice distribute choices in a session with fixed contingency lasting 150 trials. Animals were given choices with equal reward outcomes, but different effort requirements (FR3 vs. FR1). (B) Nrxn1α KOs (blue, n = 10) choose less costly alternatives at a lower rate than their WT littermates (gray, n = 11) (two-way RM ANOVA). The distribution of choice in both WT and KO mice is altered over the course of the block as mice acquire information about the reward contingency, with a stable difference observed over the final 75 trials (two-sample t-test *p=0.023). (C) Nrxn1α KOs exhibited a clear interaction between trial and latency to initiate, slowing as they performed more high effort trials (two-way RM ANOVA). Nevertheless, there was no statistically significant difference in engagement at steady state (two-sample t-test p=0.14). (D) The longer choice latencies previously described in Nrxn1α KOs was observed in steady-state responding (two-way RM ANOVA; two-sample t-test *p=0.017). All data represented as mean ± SEM.
-
Figure 3—source data 1
Source Data for Figure 3.
- https://cdn.elifesciences.org/articles/54838/elife-54838-fig3-data1-v2.xlsx
Figure 4 with 1 supplement
A deficit in value updating underlies abnormal allocation of choices in Neurexin1α mutants.
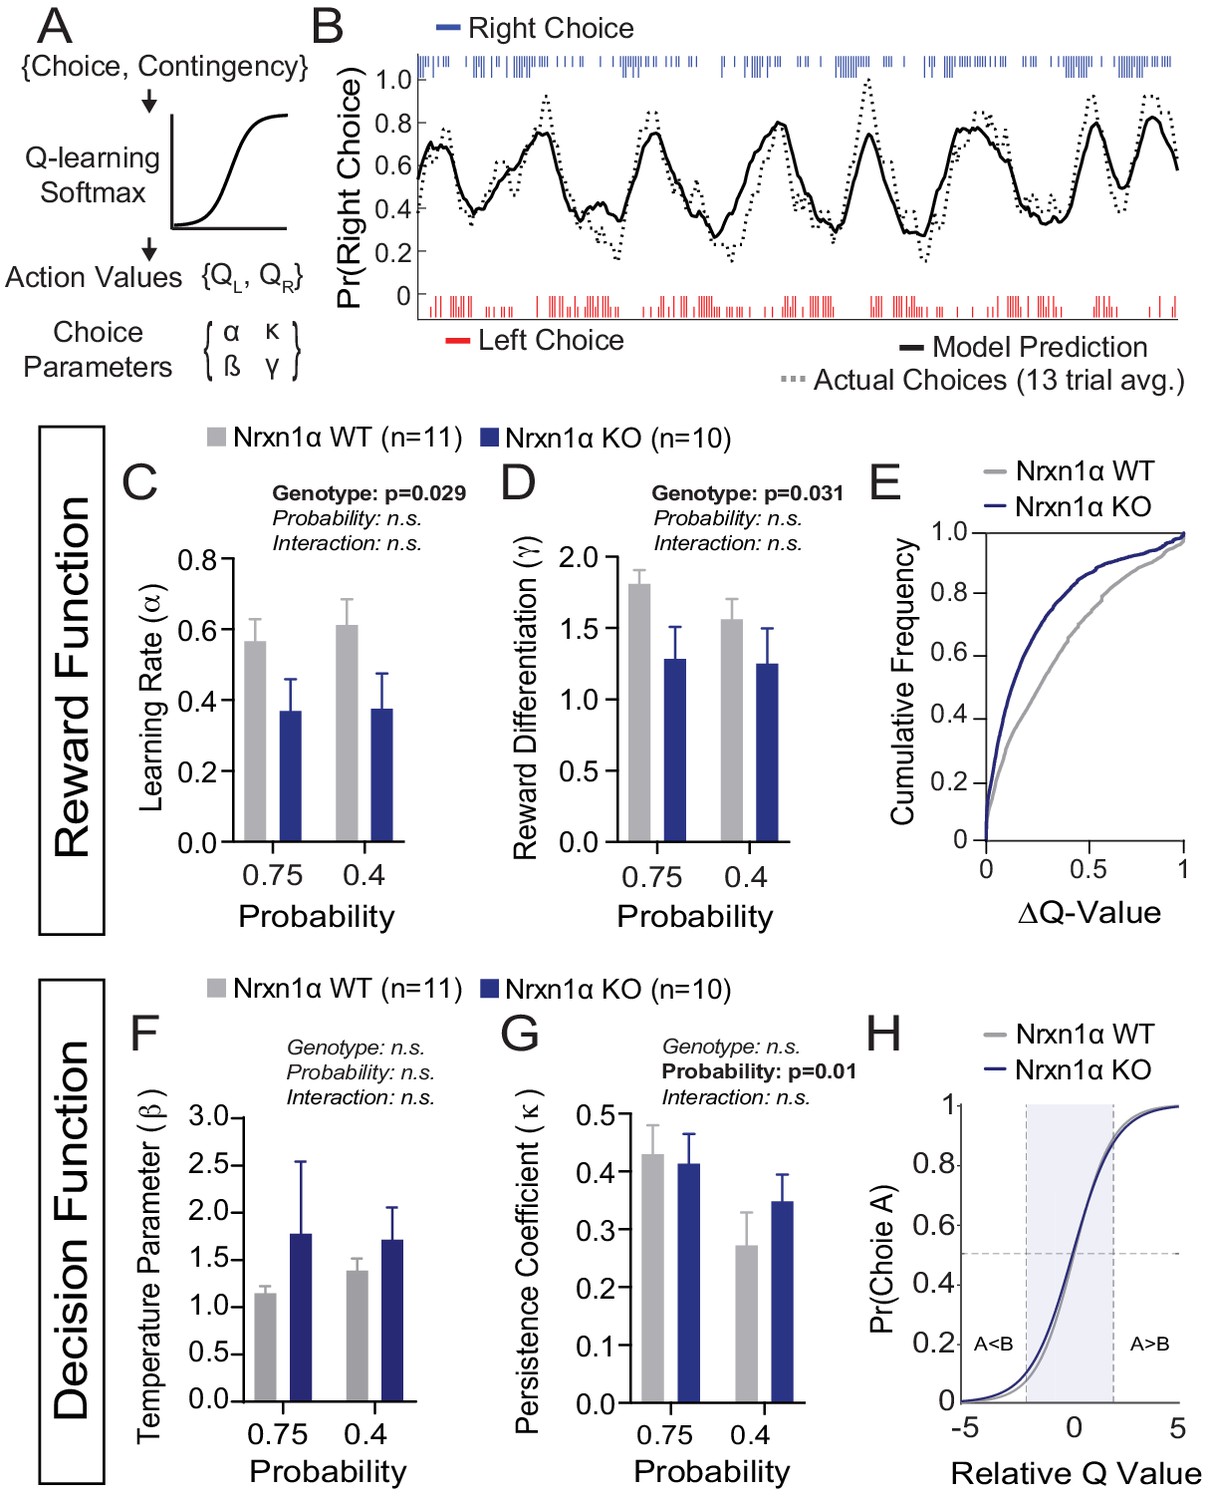
(A) Q-learning reinforcement model. Mouse choice was modeled as a probabilistic choice between two options of different value (QL,QR) using a softmax decision function. Data from each reinforcement rate were grouped before model fitting. (B) Example of model prediction versus actual animal choice. Choice probability calculated in moving window of 13 trials. Long and short markers indicate large and small reward outcomes. (C and D) As compared to littermate controls (gray, n = 11), Nrxn1α mutants (blue, n = 10) exhibit a deficit in the learning rate, α, which describes the weight given to new reward information and γ, a utility function that relates how sensitively mice integrate rewards of different magnitudes (two-way RM ANOVA). (E) Nrxn1α KOs exhibit an enrichment of low ΔQ-value trials. (F and G) Nrxn1α mutants do not exhibit significant differences in explore–exploit behavior (F, captured by β) or in their persistence toward previously selected actions (G, captured by κ). (K) There is no significant difference in the decision function of Nrxn1α wild-type and mutant animals. All data represented as mean ± SEM. Bias figures can be found in Figure 4—figure supplement 1.
-
Figure 4—source data 1
Source Data for Figure 4.
- https://cdn.elifesciences.org/articles/54838/elife-54838-fig4-data1-v2.xlsx
Figure 4—figure supplement 1
Additional Reinforcement Learning Model Parameters.
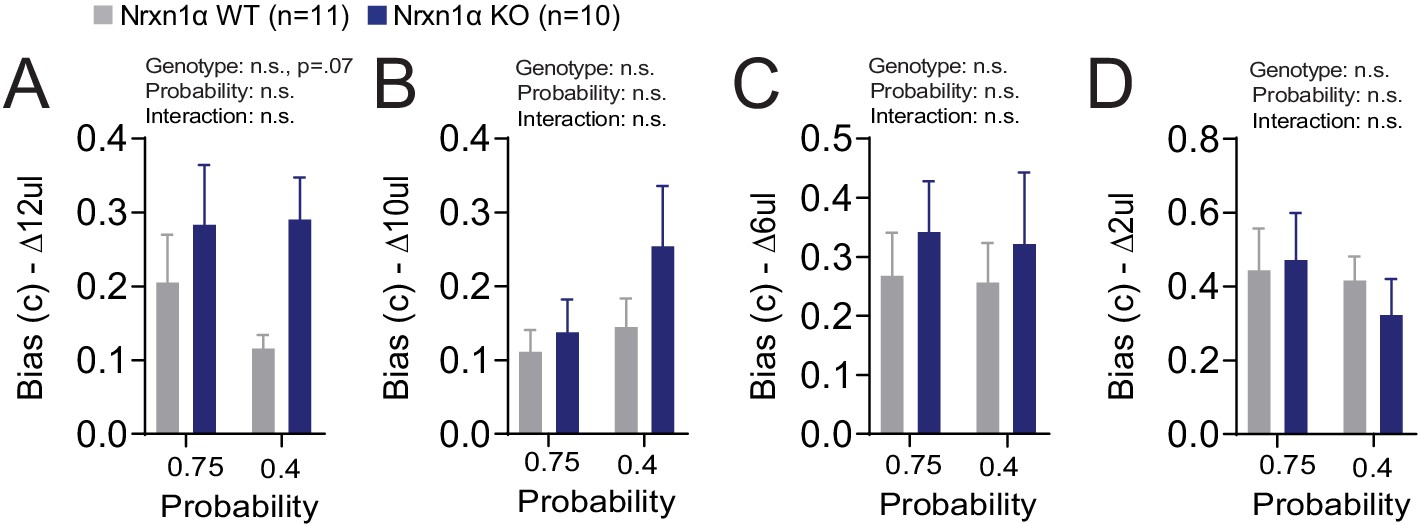
(A–D) Model biases. A bias term was generated for each relative reward ratio to capture potential difference in how animals develop biases in different reward environments. There is no statistically significant effect for genotype or probability on the degree of bias generated (ΔReward = 12, 10, 6, 4 μL for A–D, respectively). All data analyzed by two-way RM ANOVA. All data represented as mean ± SEM.
Figure 5 with 1 supplement
Restricted telencephalic excitatory neuron deletion of Neurexin1α recapitulates choice abnormalities of constitutive KO.
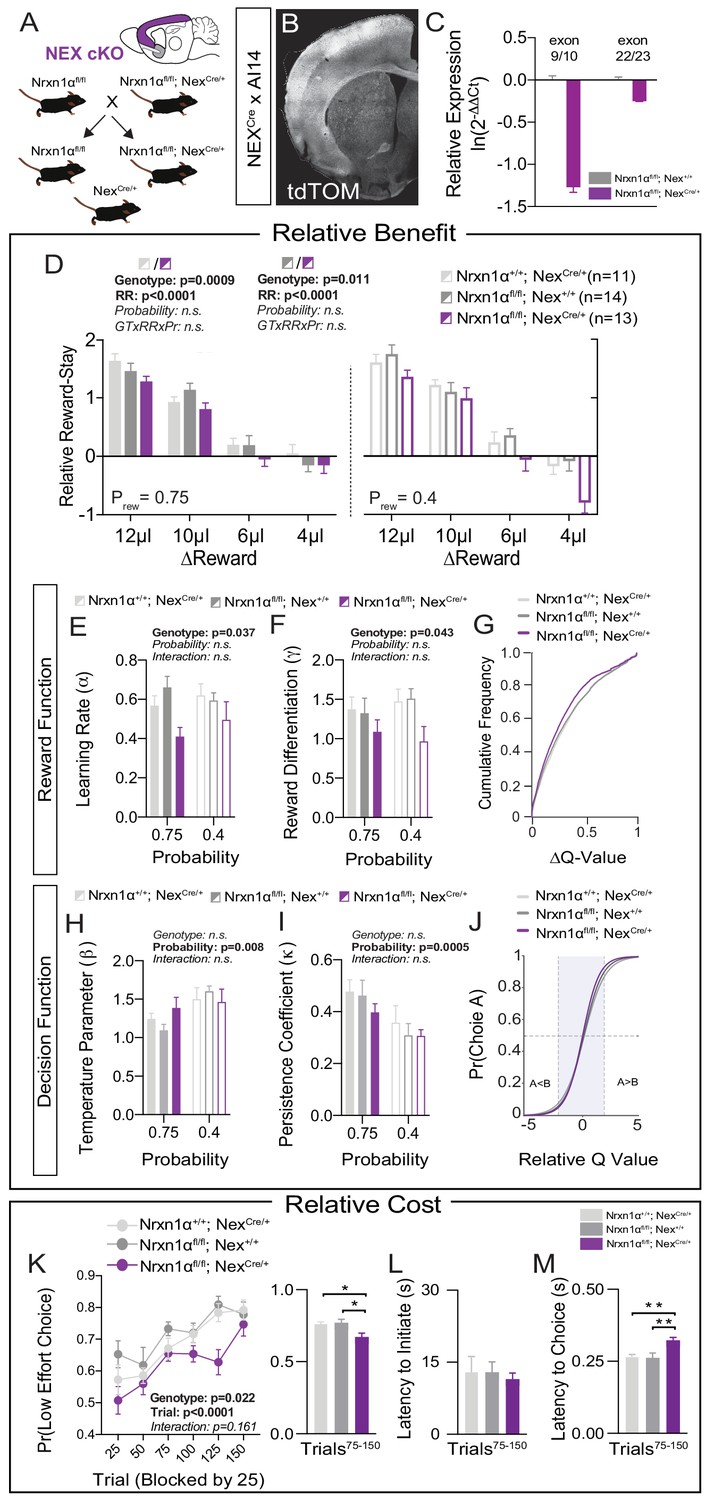
(A) Nrxn1α was conditionally inactivated in telencephalic excitatory neurons by crossing a Nrxn1α-conditional knockout allele onto NexCre line. Controls for both the Nex (light gray) and Neurexin1α-conditional (dark gray) allele were analyzed. (B) Coronal section of brain from NEXCre/+;Ai14 (LSL-tdTOM) reporter cross showing restriction of tdTOM fluorescence to cortex, hippocampus, and a subdomain of the amygdala. (C) RT-qPCR of RNA from adult mouse cortex (n = 3 for Nrxn1αfl/fl; Nex+/+[dark gray] and Nrxn1αfl/fl; NexCre/+[purple]). Cre-mediated recombination results in reduced expression of Nrxn1α mRNA detected by exon 9 probe (two-sample t-test: p<0.0001) and moderate nonsense-mediated decay (two-sample t-test: p<0.01). (D) Nrxn1αfl/fl; NexCre/+ mutant animals (purple; n = 13) exhibit a reduction in relative reward-stay as compared with Nrxn1αfl/fl; Nex+/+(dark gray; n = 14) and Nrxn1α+/+; NexCre/+ (light gray; n = 11) controls. No difference in choice allocation was observed between control animals (genotype: p=0.88, relative reward: ***p<0.0001, probability: p=0.26, three-way interaction: p=0.25; three-way RM ANOVA). (E and F) Similar to Nrxn1α constitutive knockouts, Nrxn1αfl/fl; NexCre/+ mutant mice have a deficit in utilizing new reward information to update and represent choice values. The mutants exhibit a deficit in the learning rate (α) and in the reward volume sensitivity parameter (γ) (both analyzed by two-way RM ANOVA). (G) This leads to an enrichment of low ΔQ-value trials in mutant mice. (H–J) Nrxn1αfl/fl; NexCre/+ mutants do not differ from littermate controls for the relationship between choice value and decision behavior (H) and biases toward previous choice behavior (I). As a result, there is no significant difference in the decision function of control and mutant animals. (K–M) Nrxn1αfl/fl; NexCre/+ mutants exhibit a deficit in the allocation of choices guided by relative choice costs (K, two-way RM ANOVA, left; one-way ANOVA w/Tukey’s multiple comparison, right, *p<0.05). Mutants exhibit no difference in task engagement (L, one-way ANOVA w/Tukey’s multiple comparison, p>0.05) but recapitulate deficit in choice latencies (M, one-way ANOVA w/Tukey’s multiple comparison, **p<0.01). All data represented as mean ± SEM.
-
Figure 5—source data 1
Source Data for Figure 5.
- https://cdn.elifesciences.org/articles/54838/elife-54838-fig5-data1-v2.xlsx
Figure 5—figure supplement 1
Additional Behavioral Analysis of Telencephalic Excitatory Neuron Nrx1a Deletion.
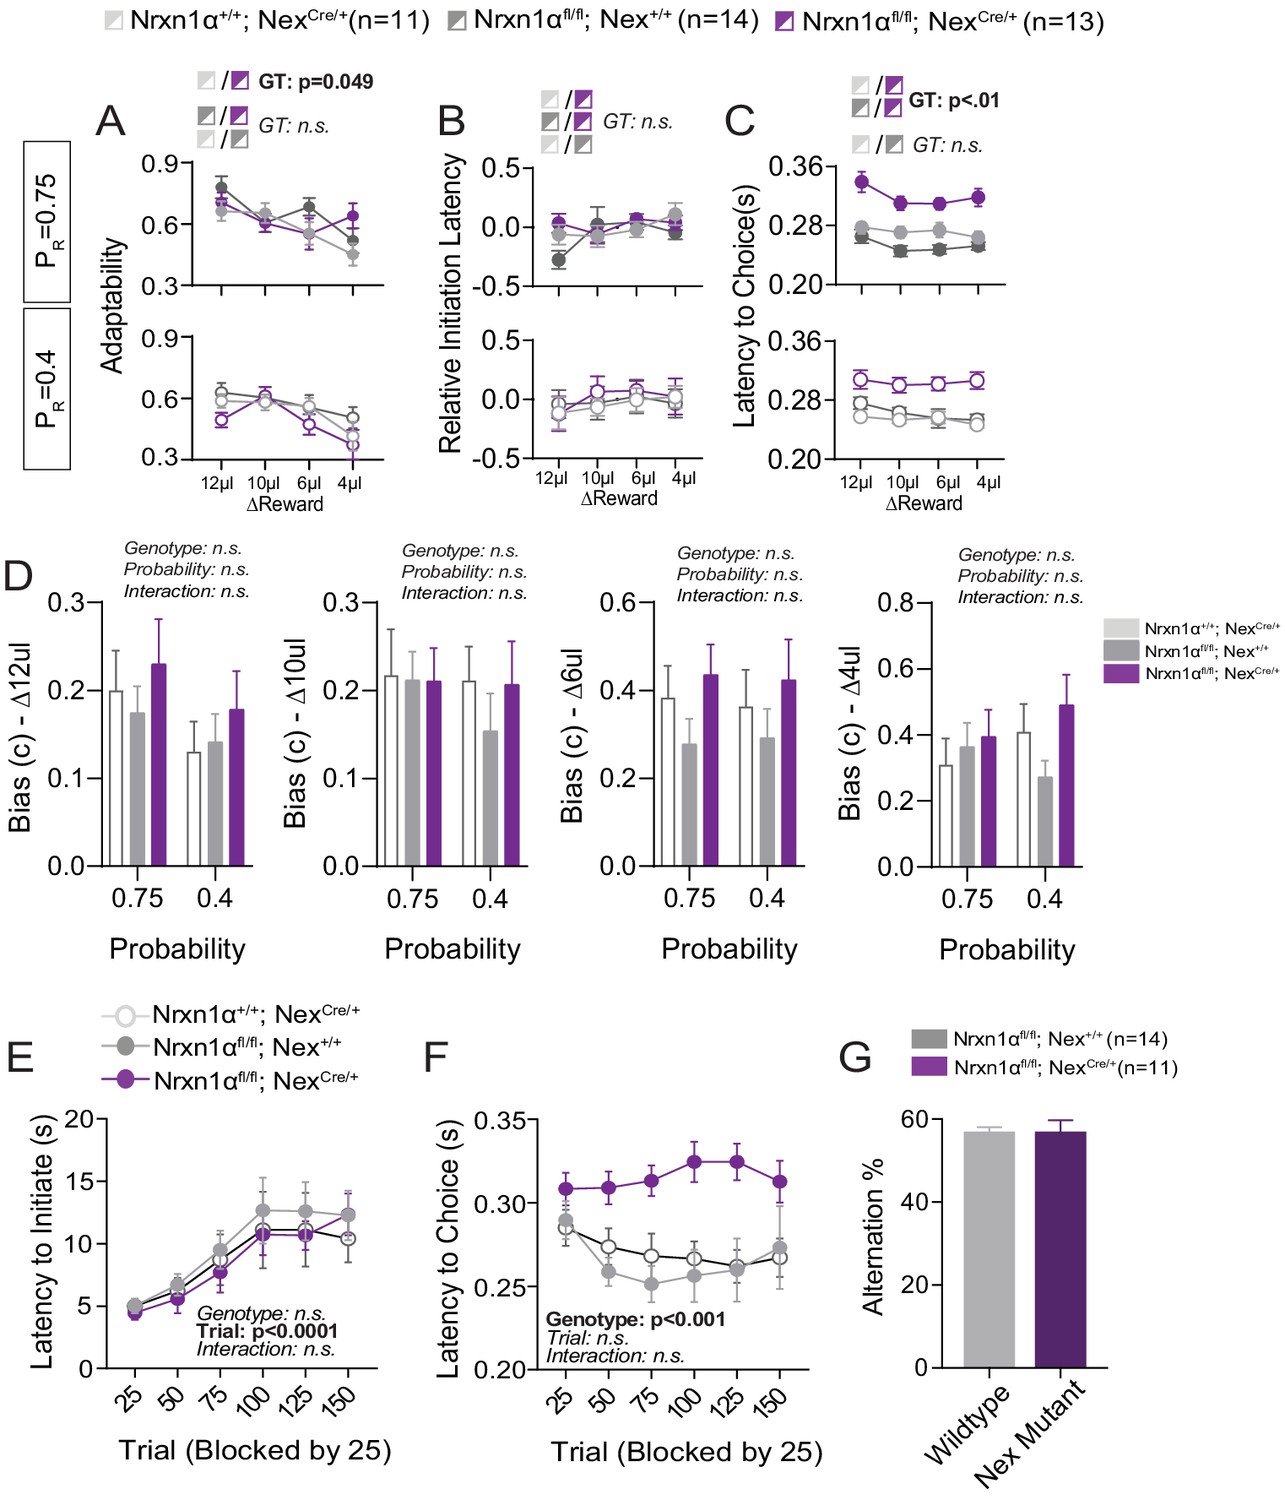
(A) In-task adaptability. There is a main effect for genotype on the adaptability measures between Nrxn1αfl/fl; NexCre controls and mutant mice. Otherwise there are no differences in adaptability noted for remaining genotypic comparisons. (B) Relative initiation latency. We noted no significant differences in the relative latency to initiate trials after distinct reward outcomes. We did not view the same robust modulation of task vigor by previous reward outcome in the Nrxn1αfl/fl colony, precluding this line of analysis. (C) Choice Latency. NexCre; Nrxn1αfl/fl mutant mice (n = 13) exhibit longer choice latencies in comparison with NexCre (n = 11) and Nrxn1αfl/fl (n = 14) controls across reward environments. (D) Model biases. There were no statistically significant effects of genotype or probability on the degree of bias generated (ΔReward = 12, 10, 6, 4 μL from left to right). (E) Initiation latency during choice paradigm. There is no statistically significant difference in the initiation latencies of mutants as sessions progress. (F) NexCre; Nrxn1αfl/fl mutant animals exhibit extended choice latencies in comparison with their wild-type counterparts. (G) There was no genotypic difference in the percentage of spontaneous alternations. (A–C analyzed by three-way RM ANOVA, D–F analyzed by two-way RM ANOVA). All data represented as mean ± SEM.
Figure 6 with 1 supplement
Specific deletion of Neurexin1α in thalamic nuclei does not reproduce choice abnormalities observed in constitutive KO.
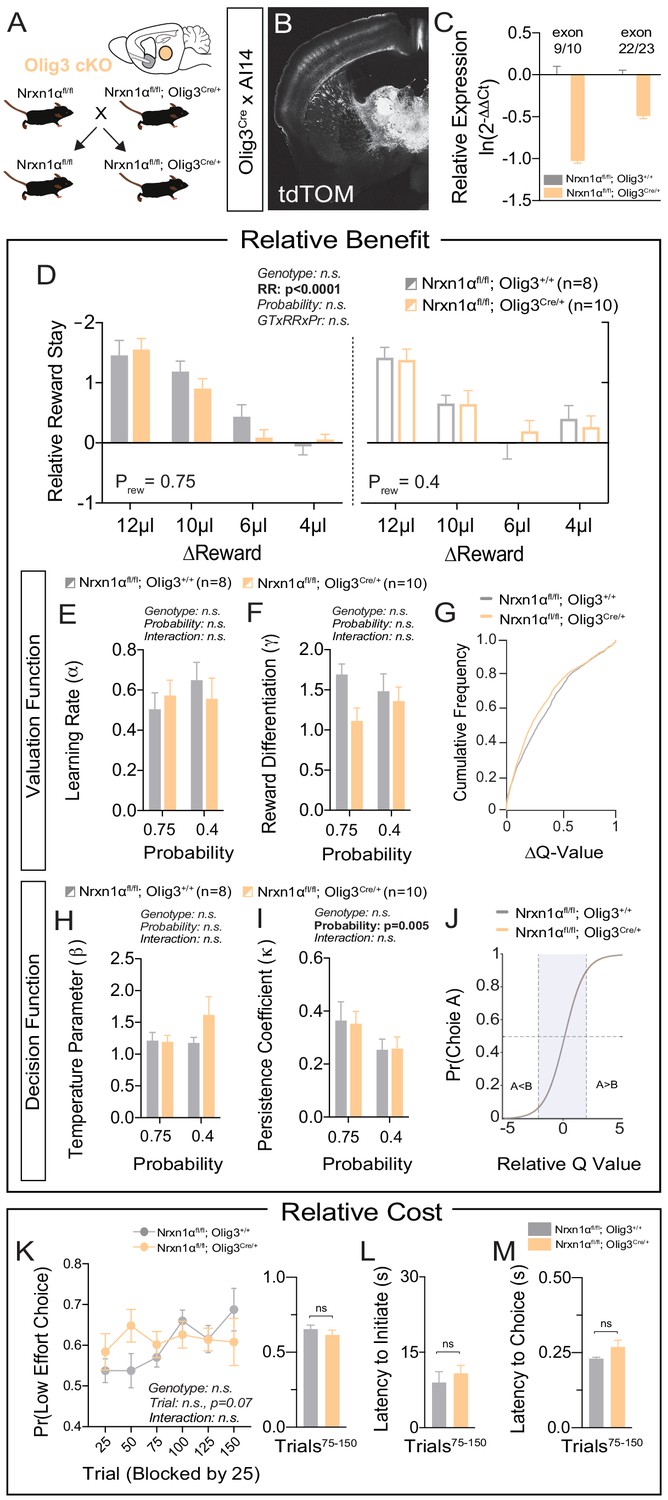
(A) Neurexin1α was conditionally inactivated in thalamic progenitor cells by crossing the Neurexin1α-conditional knockout line onto the Olig3-Cre line. (B) Coronal section of Olig3Cre; Ai14 reporter cross showing expression of tdTOM broadly throughout thalamic nuclei. (C) RT-qPCR of RNA from adult mouse thalamus (n = 2 for Nrxn1αfl/fl;Olig3+/+ (gray); n = 3 for Nrxn1αfl/fl;Olig3Cre/+(orange)). Cre-mediated recombination results in reduced expression of Nrxn1α mRNA detected by exon 9 probe (two-sample t-test: p<0.0001) and moderate nonsense-mediated decay (two-sample t-test: p<0.001) (D) Nrxn1αfl/fl;Olig3Cre/+ mutant animals (orange; n = 10) do not exhibit changes in relative reward-stay in comparison with Nrxn1αfl/fl;Olig3+/+(gray; n = 8) control animals. (E–G) Nrxn1αfl/fl;Olig3Cre/+ mutant mice do not have a deficit in updating or representing choice values (two-way RM ANOVA). (H–J) Nrxn1αfl/fl;Olig3Cre/+ mutants exhibit a normal relationship between choice values and decision behavior. (K–M) Nrxn1αfl/fl;Olig3Cre/+ mutants do not exhibit a deficit in the allocation of choices guided by relative choice costs (K, two-way RM ANOVA, left; two-sample t-test, right, p>0.05). Mutants exhibit no difference in task engagement (L, p>0.05) or in choice latencies (M, p>0.05). All data represented as mean ± SEM.
-
Figure 6—source data 1
Source Data for Figure 6.
- https://cdn.elifesciences.org/articles/54838/elife-54838-fig6-data1-v2.xlsx
Figure 6—figure supplement 1
Additional behavioral analysis of thalamic neuron Nrx1a deletion.
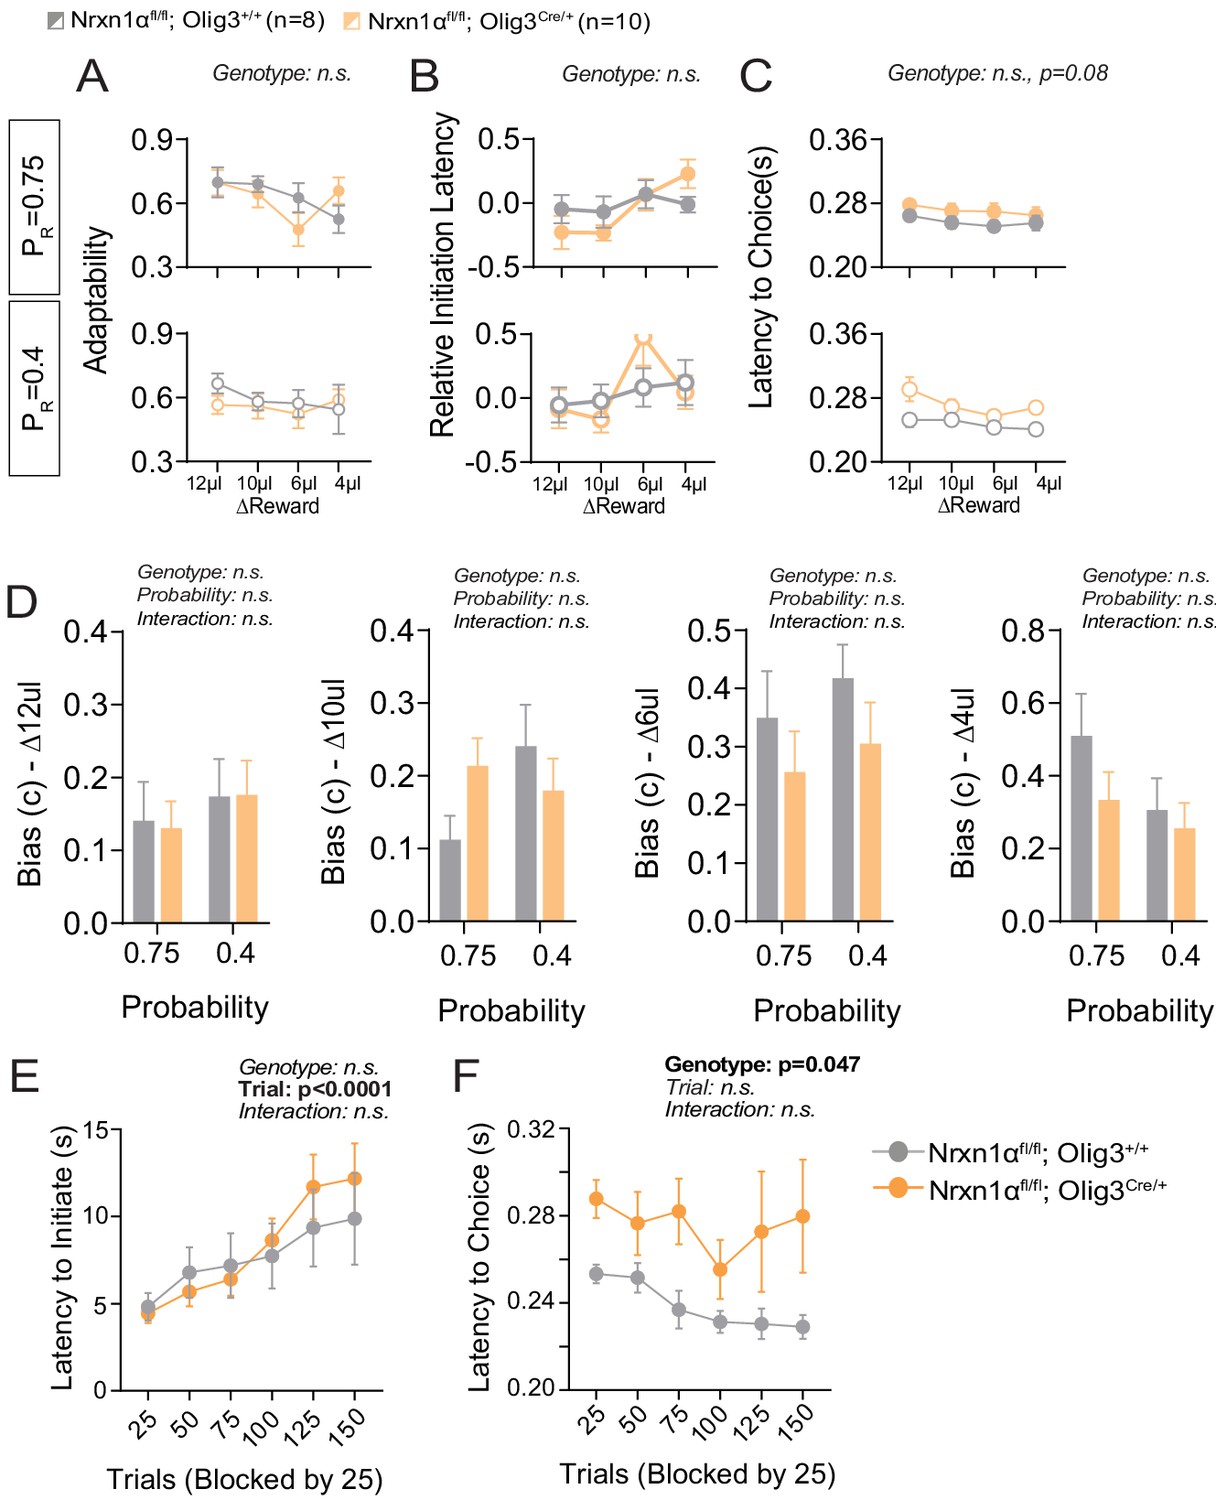
(A) In-task adaptability. There is no effect for genotype on the adaptability measures of OligCre control and OligCre; Nrxn1αfl/fl mutant mice. (B) Relative initiation latency. We noted no significant differences in the relative latency to initiate trials after distinct reward outcomes. (C) Choice Latency. OligCre; Nrxn1αfl/fl mutant mice (n = 10) exhibit a trend toward extended choice latencies in comparison with Nrxn1αC/C (n = 8) controls across reward environments. (D) Model biases. There is no statistically significant effect for genotype or probability on the degree of bias generated (ΔReward = 12, 10, 6, 4 μL from left to right). (E) Initiation latency during choice paradigm. There is no statistically significant difference in the initiation latencies between genotypes as sessions progress. (F) OligCre; Nrxn1αfl/fl mutant animals exhibit extended choice latencies in comparison with their two wild-type counterparts. (A–C analyzed by three-way RM ANOVA, and D–F analyzed by two-way RM ANOVA).
Figure 7 with 1 supplement
Quantifying value correlates in putative direct pathway SPNs of the dorsomedial striatum.
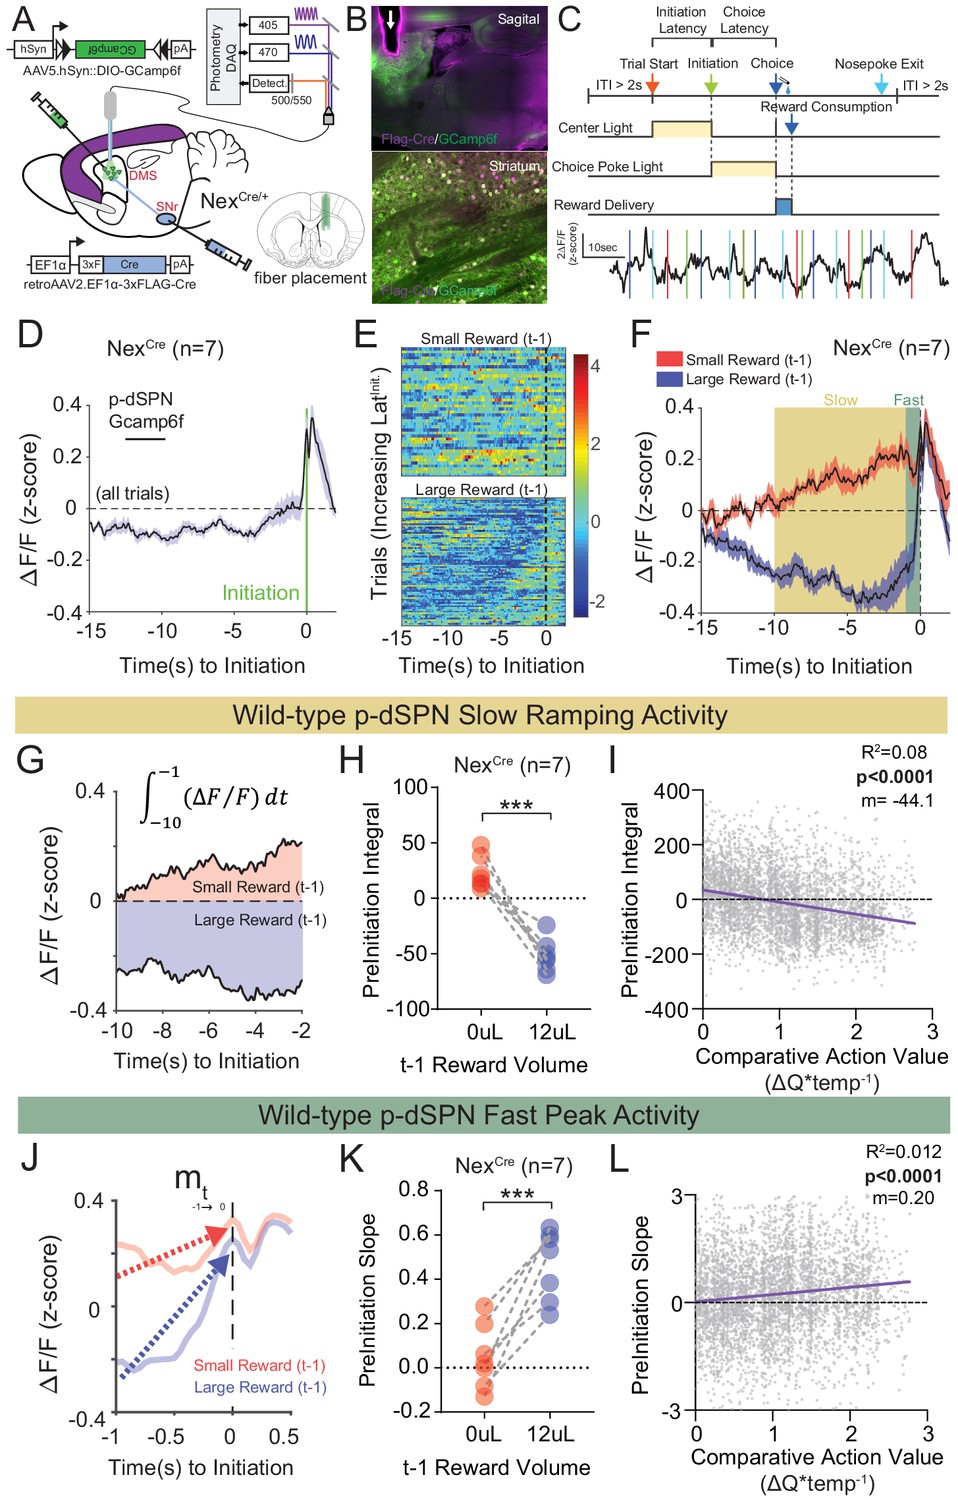
(A) Schematic of experimental scheme. Control (Nrxn1α+/+; NexCre/+, n = 7) mice were injected with a retro-AAV2-EF1α−3xFLAG-Cre virus in the substantia nigra, pars reticulata (SNr). Ipsilateral injection of Cre-dependent GCamp6f allowed for enrichment of putative direct pathway SPNs (p-dSPNs). (B, top) Sagittal section of NexCre brain showing GCamp6f expression in dorsal striatal SPNs and placement of 400 µm optic fiber (white arrow). (B, bottom) Magnified view of striatum showing colocalization of nuclear FLAG-Cre and cytoplasmic GCamp6f. (B, bottom left) Location of fiber placements in NexCre/+. (C, top) Trial schematic and relationship of specific task epochs with p-dSPN Ca2+ signal (bottom). (D) Peristimulus time histogram (PSTH) of ΔF/F for NexCre/+ aligned to initiation event (all trials). The initiation of the action sequence (green bar) is associated with a rise in p-dSPNs activity. (E) Representative heat map of individual animal trials segregated by reward outcome on (t−1) trial (sorted by the latency to initiate). Trials following a large reward have greater signal suppression than those following small reward. (F) PSTH of ΔF/F for NexCre/+ aligned to initiation event (segregated by outcome on (t−1)). Preinitiation of p-dSPN dynamics exhibits two components – a slow ramping phase (yellow, time-10→-1) followed by a fast spike phase (green, time-1→init), both of which are modulated by (t−1) reward outcome. (G) The slow ramping phase is quantified by the integral of GCamp signal −10 s to −1 s before initiation. (H) There is a significant effect of (t−1) reward volume on the preinitiation integral during slow ramping with large rewards showing greater silencing of p-dSPN activity (paired t-test, ***p=0.0002). (I) Preinitiation integral inversely correlates with the comparative action value of the upcoming trial, which is calculated using probability estimates from fitted reinforcement learning models and reflects the disparity in choice value on a trial to trial basis. (J) The dynamics of the fast peak phase are represented by the average slope of GCamp signal from −1 s till initiation. (K) There is a significant effect of (t−1) reward volume on preinitiation slope during the fast peak phase (paired t-test,***p=0.0006) with large rewards showing steeper subsequent preinitiation slopes. (L) Preinitiation slope positively correlates with the comparative action value of the upcoming trial.
-
Figure 7—source data 1
Source Data for Figure 7.
- https://cdn.elifesciences.org/articles/54838/elife-54838-fig7-data1-v2.xlsx
Figure 7—figure supplement 1
Additional Photometry Analyses in Wildtype and Mutant Mice.
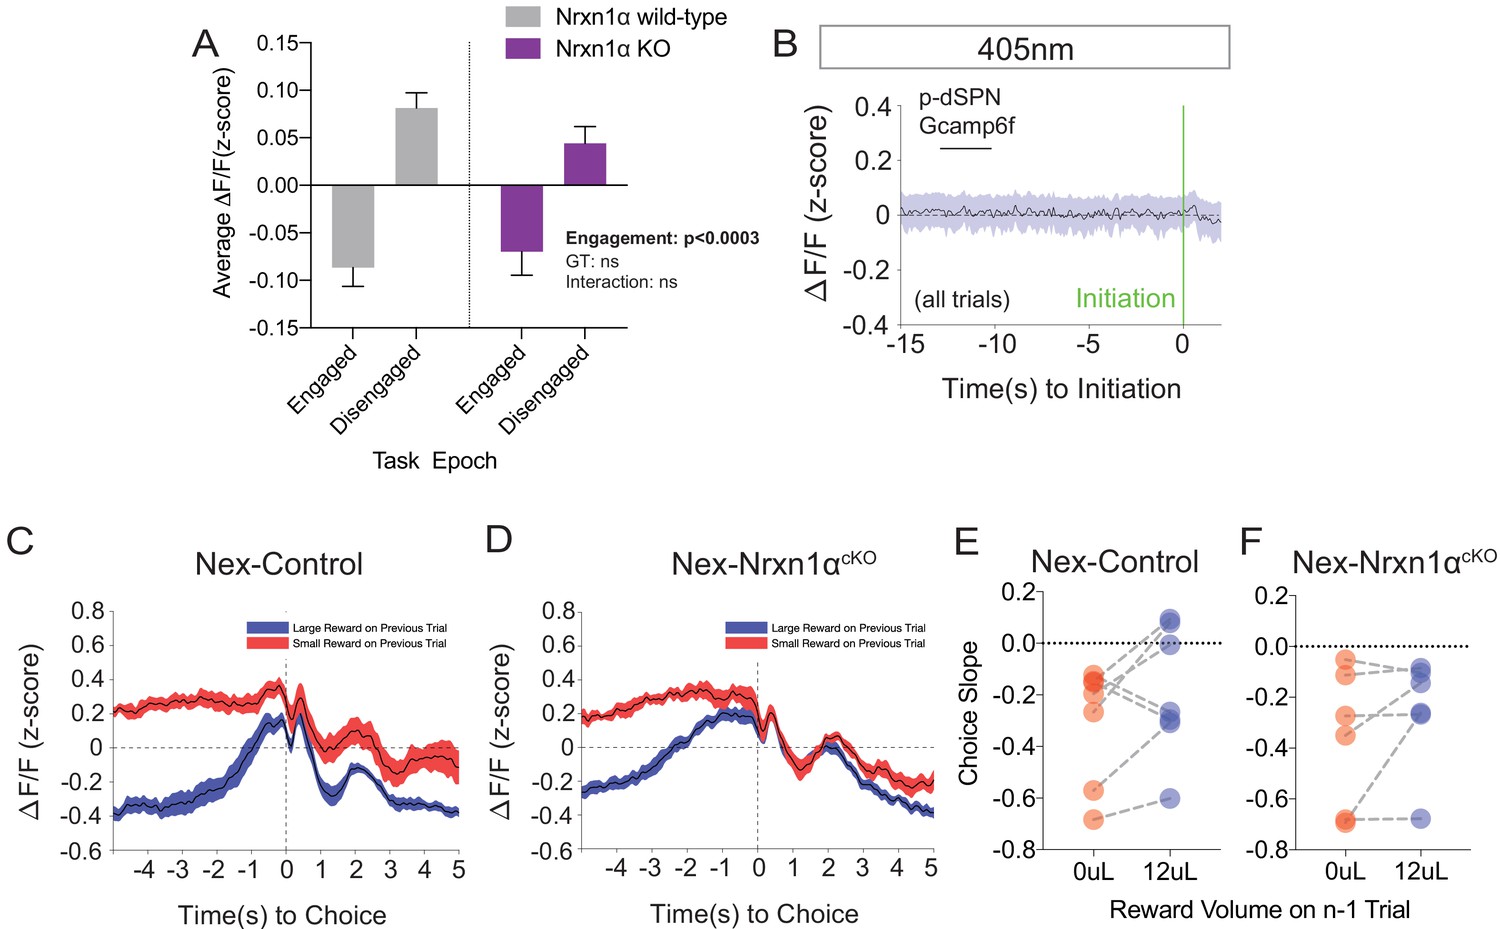
(A) Mean photometry signals for animals in engaged and disengaged epochs of the task revealed statistically smaller signals during periods of task engagement, without phenotypic differences. Engaged periods were defined as any time point within a window of 5 s before an initiation event (to start a trial) and after a nosepoke exit (to end a trial). (B) Grand average of the putative-dSPN fiber photometry signal in the NexCre control mice from the 405 nm channel aligned to trial initiation, demonstrating no significant waveform deflections (compared to Figure 7D). (C and D) Averaged fiber photometry waveforms aligned by the choice timestamp and selected according to prior trial outcome (red-small prior reward and blue-large prior reward) for control (C) and Nex-deleted Nrxn1α (D). (E and F) Summary data of slopes from linear fits of the Ca2+ waveform (t = −0.5 s → 0.2 s) did not reveal statistically significant differences based on prior trial outcome in either control (E, paired t-test, p=0.16) or Nex-deleted Nrxn1α mice (F, paired t-test, p=0.23). A analyzed by two-way RM ANOVA; E and F analyzed by paired t-test. All data represented as mean ± SEM.
Figure 8 with 1 supplement
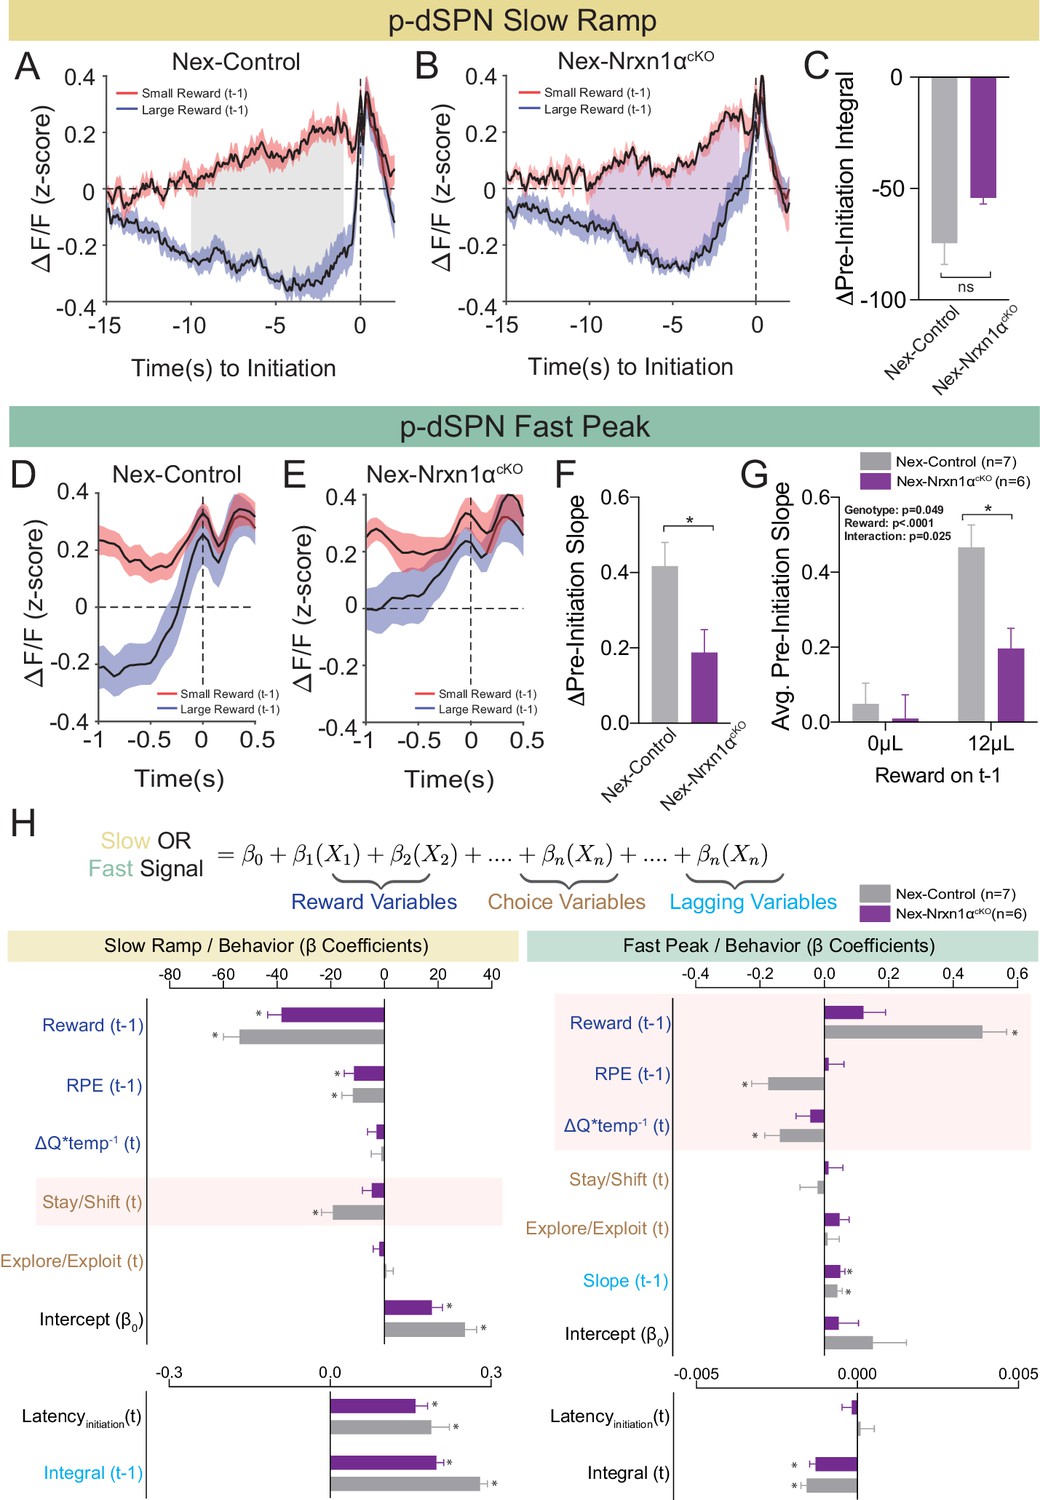
Restricted telencephalic excitatory neuron deletion of Neurexin1α produces a deficit in fast peak activity in p-dSPNs of the DMS.
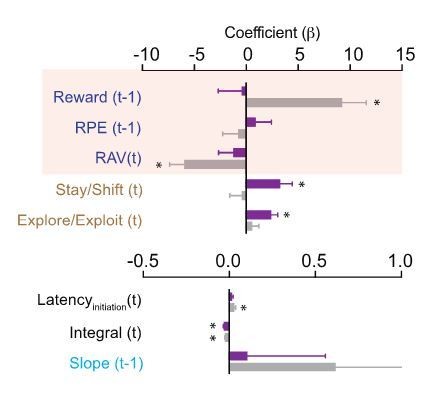
(A and B) PSTH of ΔF/F for Nex-control (Nrxn1α+/+; NexCre/+, n = 7, gray) and Nex-Nrxn1αcKO (Nrxn1αfl/fl; NexCre/+, n = 6, purple) mice, respectively, aligned to initiation event (segregated by outcome on t−1). Shaded region corresponds to the difference in the preinitiation integral following large and small reward outcomes. (C) There is no statistically significant difference between Nex-control and Nex-Nrxn1αcKO in the Δpre-initiation integral of large versus small rewards (two-sample t-test, n.s., p=0.084). (D and E) PSTH of ΔF/F for control and mutant animals, respectively, in the fast peak phase of preinitiation activity. (F) Nex-Nrxn1αcKO exhibit smaller disparity in fast peak signals after unique reward outcomes, as evidenced by significant effect of genotype on Δpre-initiation slope of the fast peak (two-sample t-test, *p=0.025). (G) This difference in Δpre-initiation slope arises from a blunted GCamp response in mutants to large reward outcomes (two-way RM ANOVA). (H) Modeling Ca2+ signal dynamics as function of reward variables (blue), prior/future choice (gold), and lagging regressors (light blue) to capture prior circuit states. Value modulation of fast peak activity is blunted in Nex-Nrxn1αcKO mice (highlighted red box), while other components of the signal remain intact. Slow ramping is largely intact in mutant animals. All data represented as mean ± SEM.
-
Figure 8—source data 1
Source Data for Figure 8.
- https://cdn.elifesciences.org/articles/54838/elife-54838-fig8-data1-v2.xlsx
Figure 8—figure supplement 1
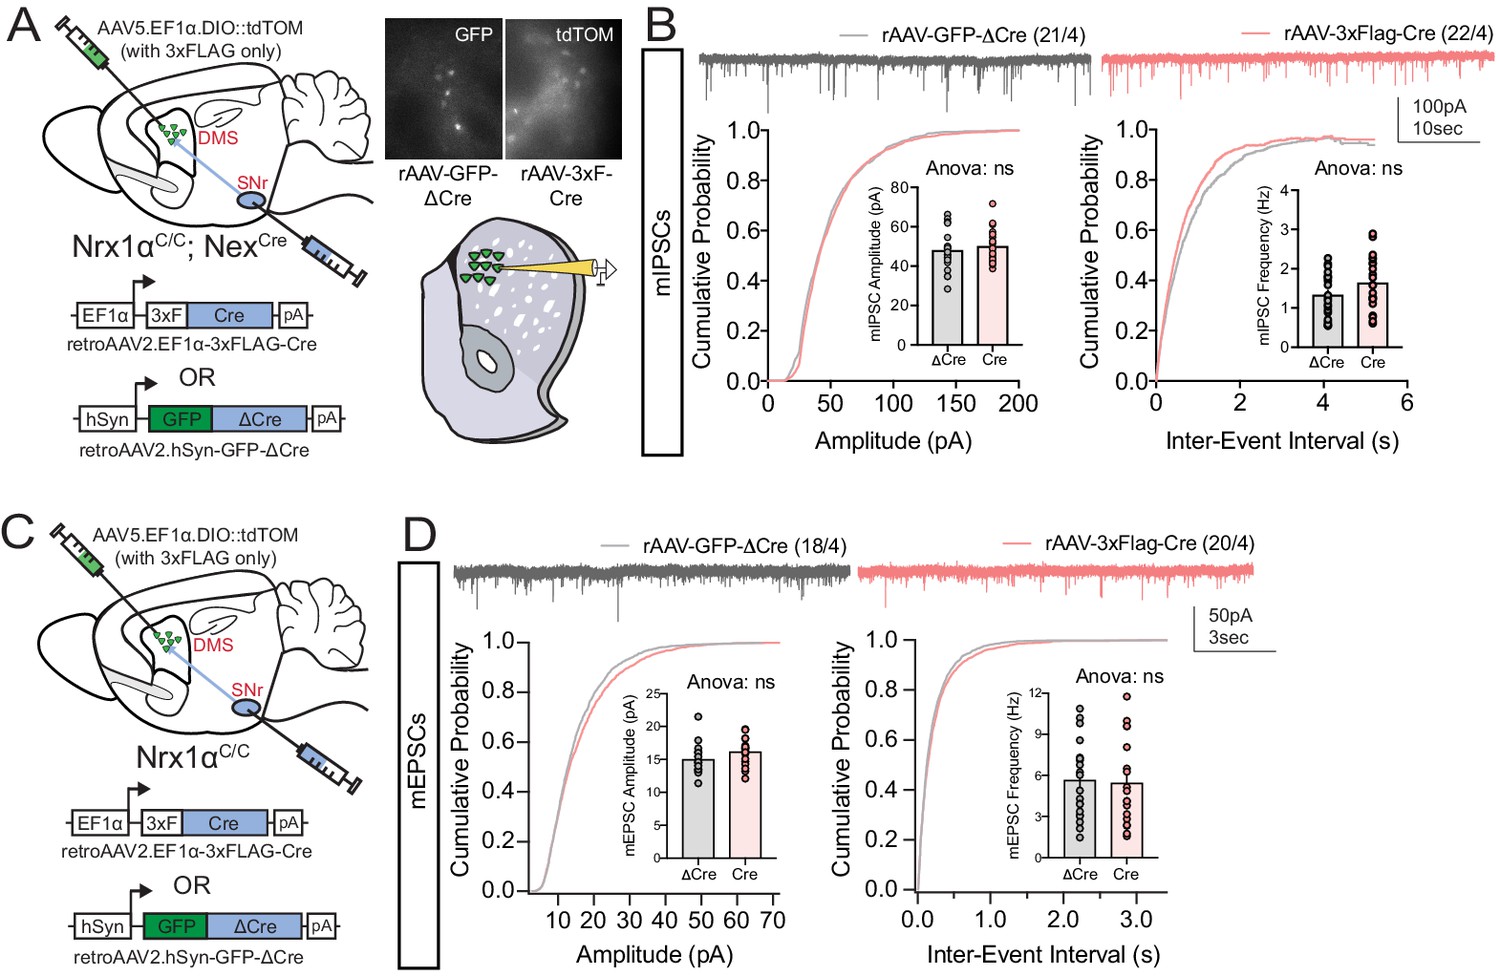
Retrograde labeling strategy does not alter excitatory or inhibitory basal synaptic transmission.
(A, Left) Experimental schematic where putative dSPNs are labeled with either retroAAV2.
EF1α−3xFLAG-Cre (together with AAV5.EF1α.DIO::tdTOM in striatum for visualization of retrogradely labeled neurons) or retroAAV2.hSyn-GFP-ΔCre (an enzymatically inactive truncated version of Cre) in the SNr. (A, right) Visualization of infected p-dSPNs for acute slice whole cell recordings. (B) No difference in mIPSC amplitude or frequency was noted between Cre and ΔCre viral constructs. (C) Schematic to test the effect of adult retrograde Cre expression on excitatory synaptic connectivity to p-dSPNs. (D) No difference in mEPSC amplitude or frequency was noted between Cre and ΔCre viral constructs. B and D analyzed by t-test. Data represented as mean ± SEM.
Author response image 1

Author response image 2
Author response image 3
Author response image 4
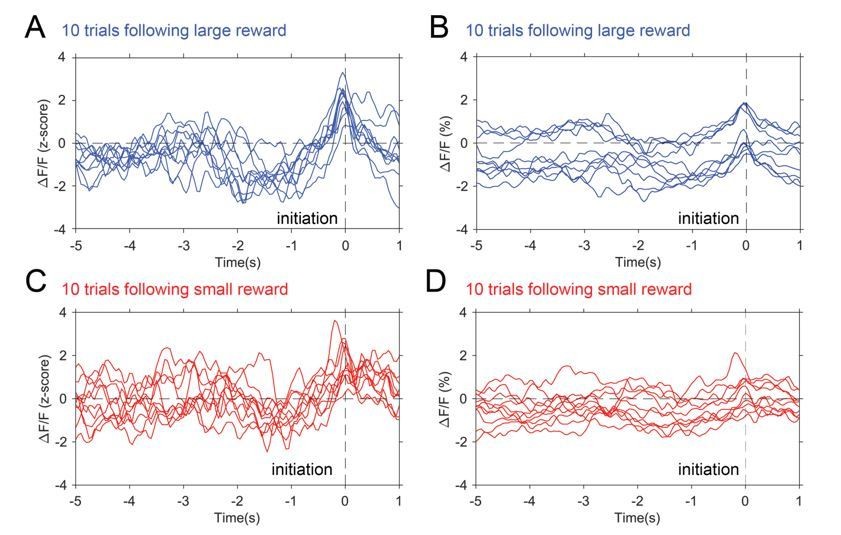
Photometry traces by trial.
10 individual traces selected from trials following large reward (blue) and trials following small reward (red). Panel A and C show z-scored data while B and C show raw ΔF/F(%).
Author response image 5
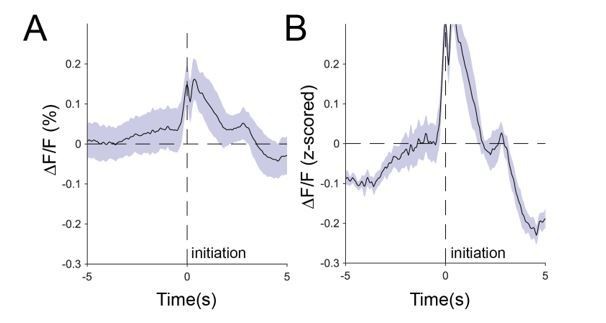
Comparison of raw averaged signals (A) and z-scored signals (B).
Additional files
-
Source data 1
Table of Summary Statistics.
- https://cdn.elifesciences.org/articles/54838/elife-54838-data1-v2.xlsx
-
Transparent reporting form
- https://cdn.elifesciences.org/articles/54838/elife-54838-transrepform-v2.docx
Download links
A two-part list of links to download the article, or parts of the article, in various formats.
Downloads (link to download the article as PDF)
Open citations (links to open the citations from this article in various online reference manager services)
Cite this article (links to download the citations from this article in formats compatible with various reference manager tools)
Disruption of Nrxn1α within excitatory forebrain circuits drives value-based dysfunction
eLife 9:e54838.
https://doi.org/10.7554/eLife.54838


