Quantification of the pace of biological aging in humans through a blood test, the DunedinPoAm DNA methylation algorithm
- Department of Epidemiology, Columbia University Mailman School of Public Health, United States
- Butler Columbia Aging Center, Columbia University Mailman School of Public Health, United States
- Social, Genetic, and Developmental Psychiatry Centre, Institute of Psychiatry, King’s College London, United Kingdom
- Department of Psychology and Neuroscience, Duke University, United States
- Department of Psychiatry and Behavioral Sciences, Duke University School of Medicine, United States
- Center for Genomic and Computational Biology, Duke University, United States
- Laboratory of Precision Environmental Health, Mailman School of Public Health, Columbia University, United States
- University of Exeter Medical School, College of Medicine and Health, United Kingdom
- Clinical Research Centre, Copenhagen University Hospital Amager and Hvidovre, Denmark
- Duke Molecular Physiology Institute, Duke University, United States
- Duke University Center for the Study of Aging, Duke University, United States
- Department of Biostatistics, Duke University School of Medicine, United States
- Department of Psychology and Dunedin Multidisciplinary Health and Development Research Unit, University of Otago, New Zealand
- Department of Environmental Health Sciences, Harvard TH Chan School of Public Health, United States
- Veterans Affairs Normative Aging Study, Veterans Affairs Boston Healthcare System, Department of Medicine, Boston University School of Medicine, United States
Figures
Figure 1 with 3 supplements
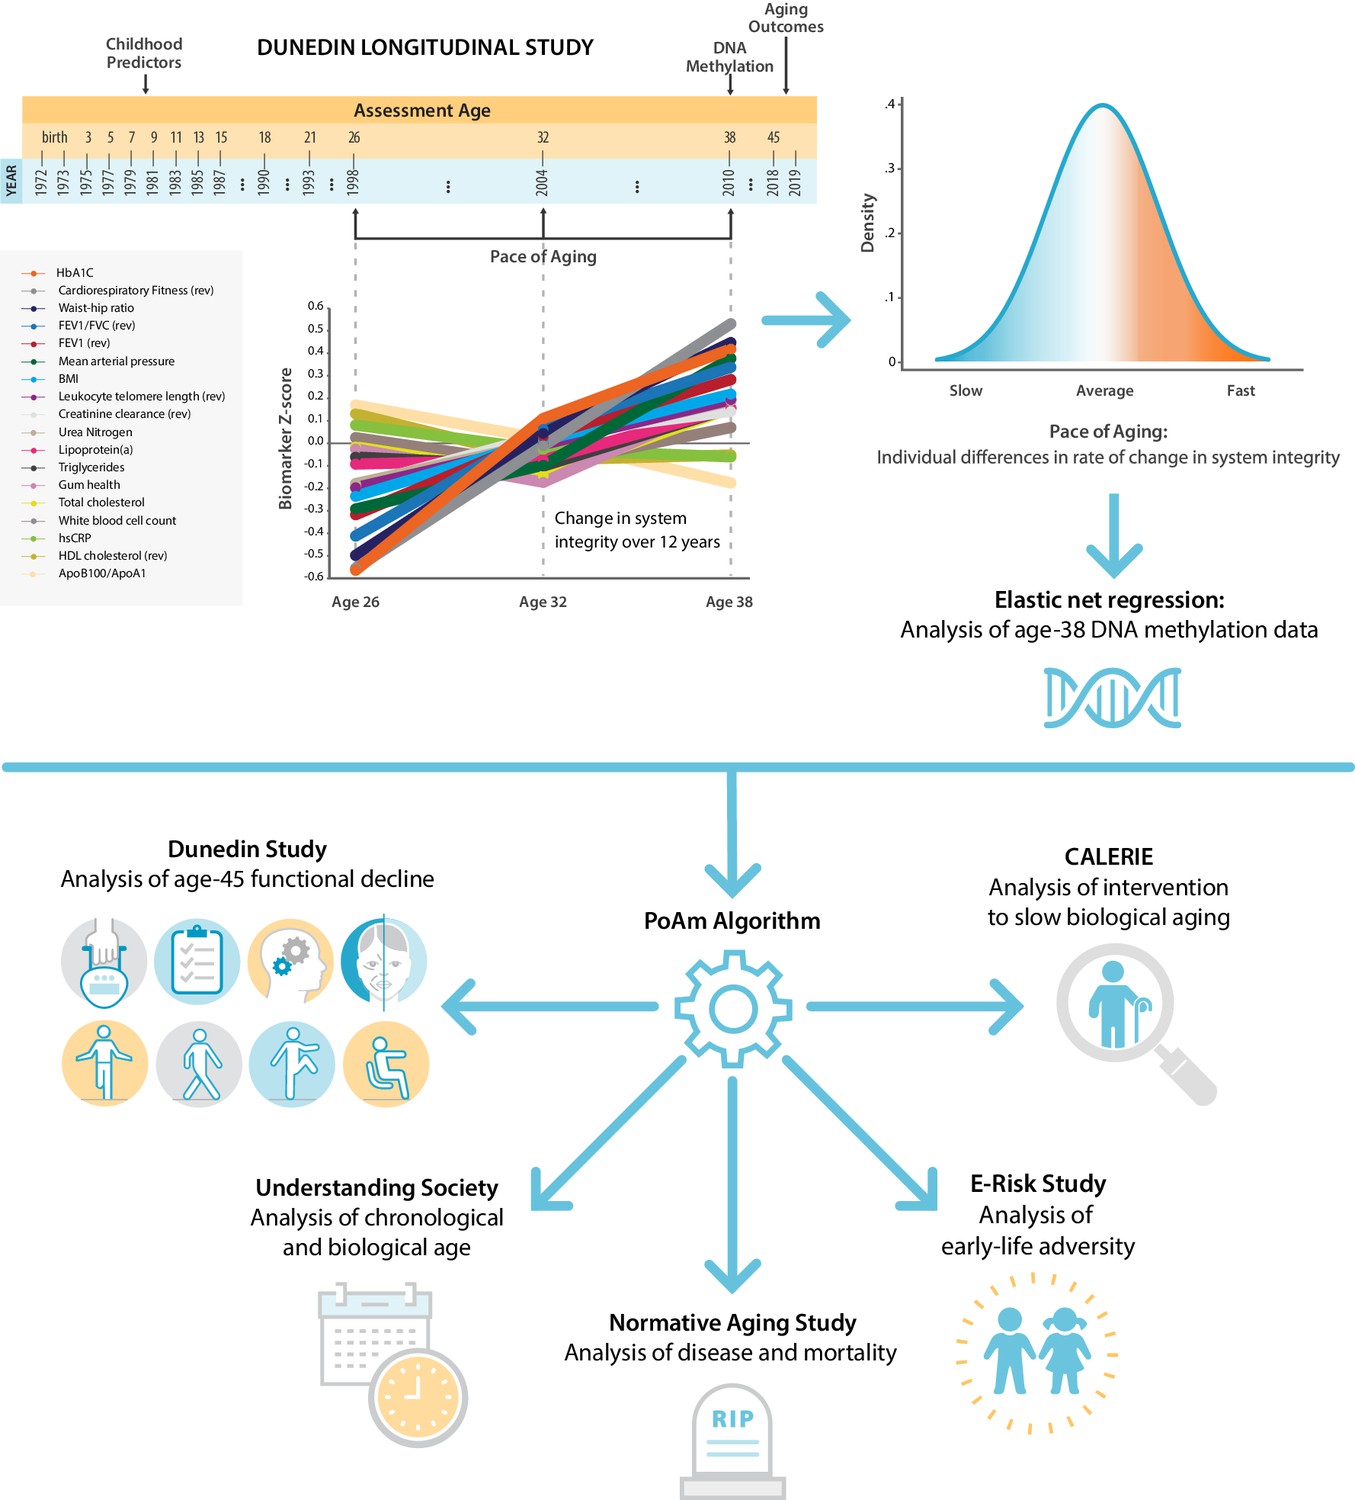
Schematic of design and follow-up of DunedinPoAm.
DunedinPoAm is designed to quantify the rate of decline in system integrity experienced by an individual over the recent past; it functions like speedometer for the rate of aging. We developed DunedinPoAm from analysis of longitudinal change in 18 biomarkers of organ system integrity in the Dunedin Longitudinal Study birth cohort. Biomarkers were measured in 1998, 2004, and 2010, when all cohort members were aged 26, 32, and 38 years. We composited rates of change across the 18 biomarkers to produce a single measure of aging-related decline in system integrity, termed Pace of Aging. We then used elastic-net regression to develop a DNA-methylation predictor of Pace of Aging, called DunedinPoAm for Dunedin (P)ace (o)f (A)ging (m)ethylation. DNA methylation data for this analysis came from the age-38 assessment in 2010. We further evaluated the performance of DunedinPoAm using data from (a) the age-45 assessments of Dunedin Study members in 2018, (b) the Understanding Society Study, (c) the Normative Aging Study, (d) the E-risk Study, and (e) the CALERIE trial.
Figure 1—figure supplement 1
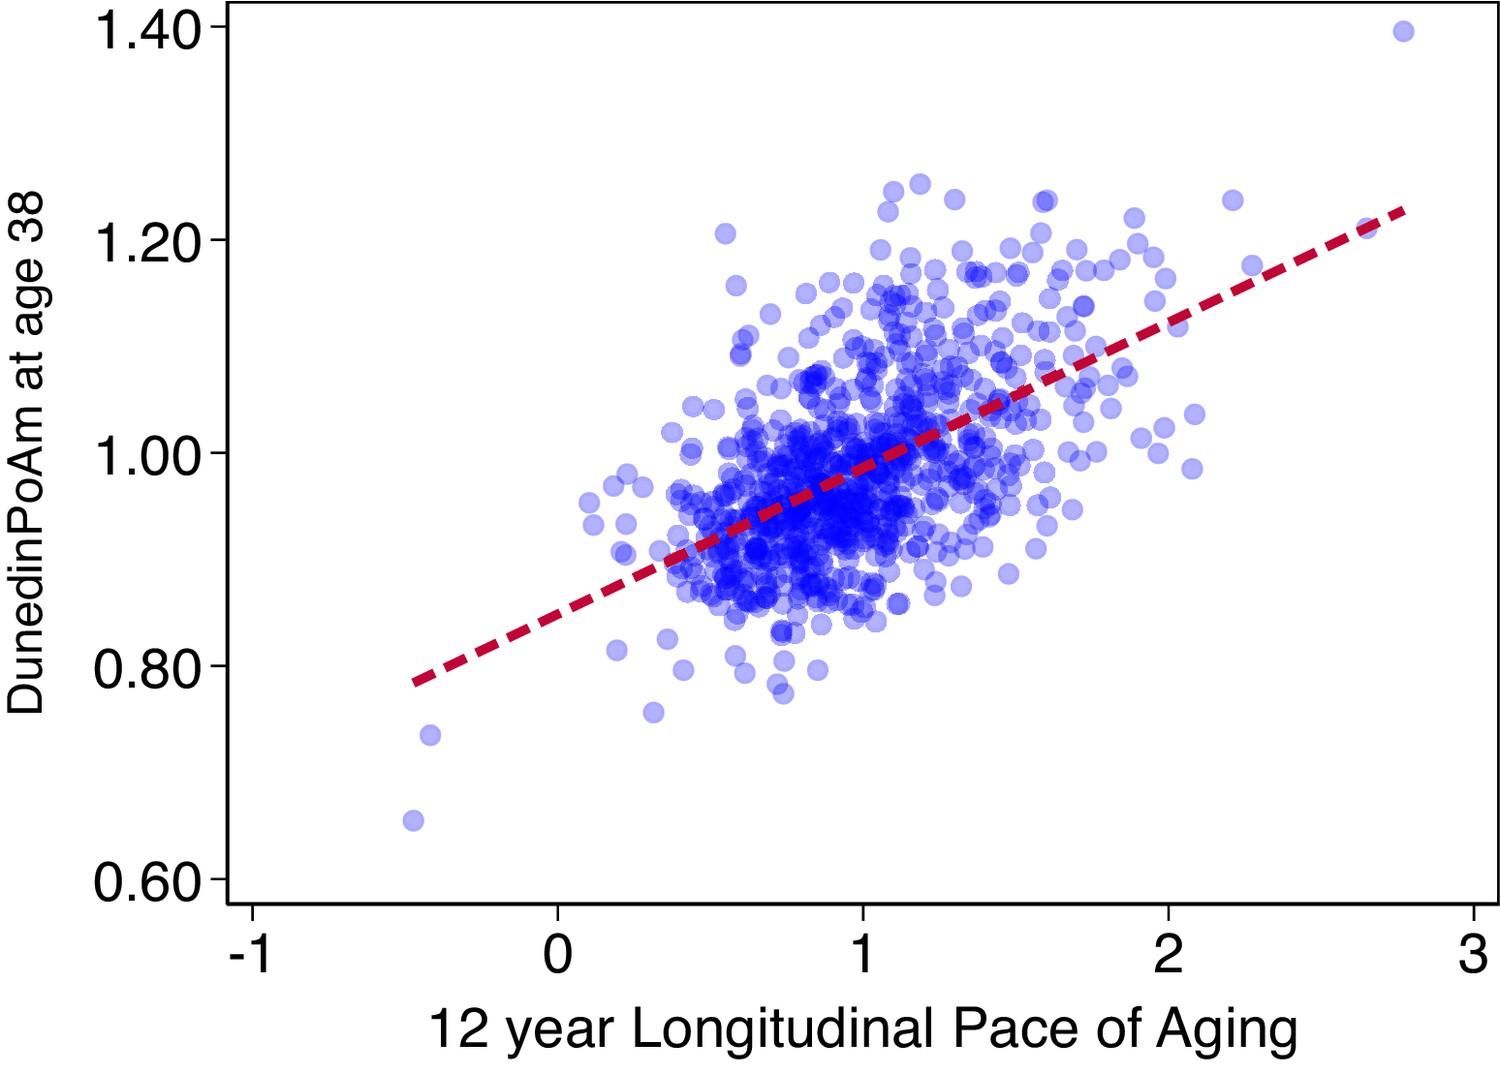
Association of DunedinPoAm with 12 year longitudinal Pace of Aging in the Dunedin Study.
The figure shows a scatterplot and fitted regression slope for the association between DunedinPoAm trained in the full Dunedin sample and the Pace of Aging measure that was used as the criterion in the training analysis. The correlation of r = 0.56 is a within-training-sample estimate of association and therefore reflects the upper-bound of possible true association between DunedinPoAm and Pace of Aging. The figure shows data for the N = 810 Dunedin Study members included in the training analysis.
Figure 1—figure supplement 2
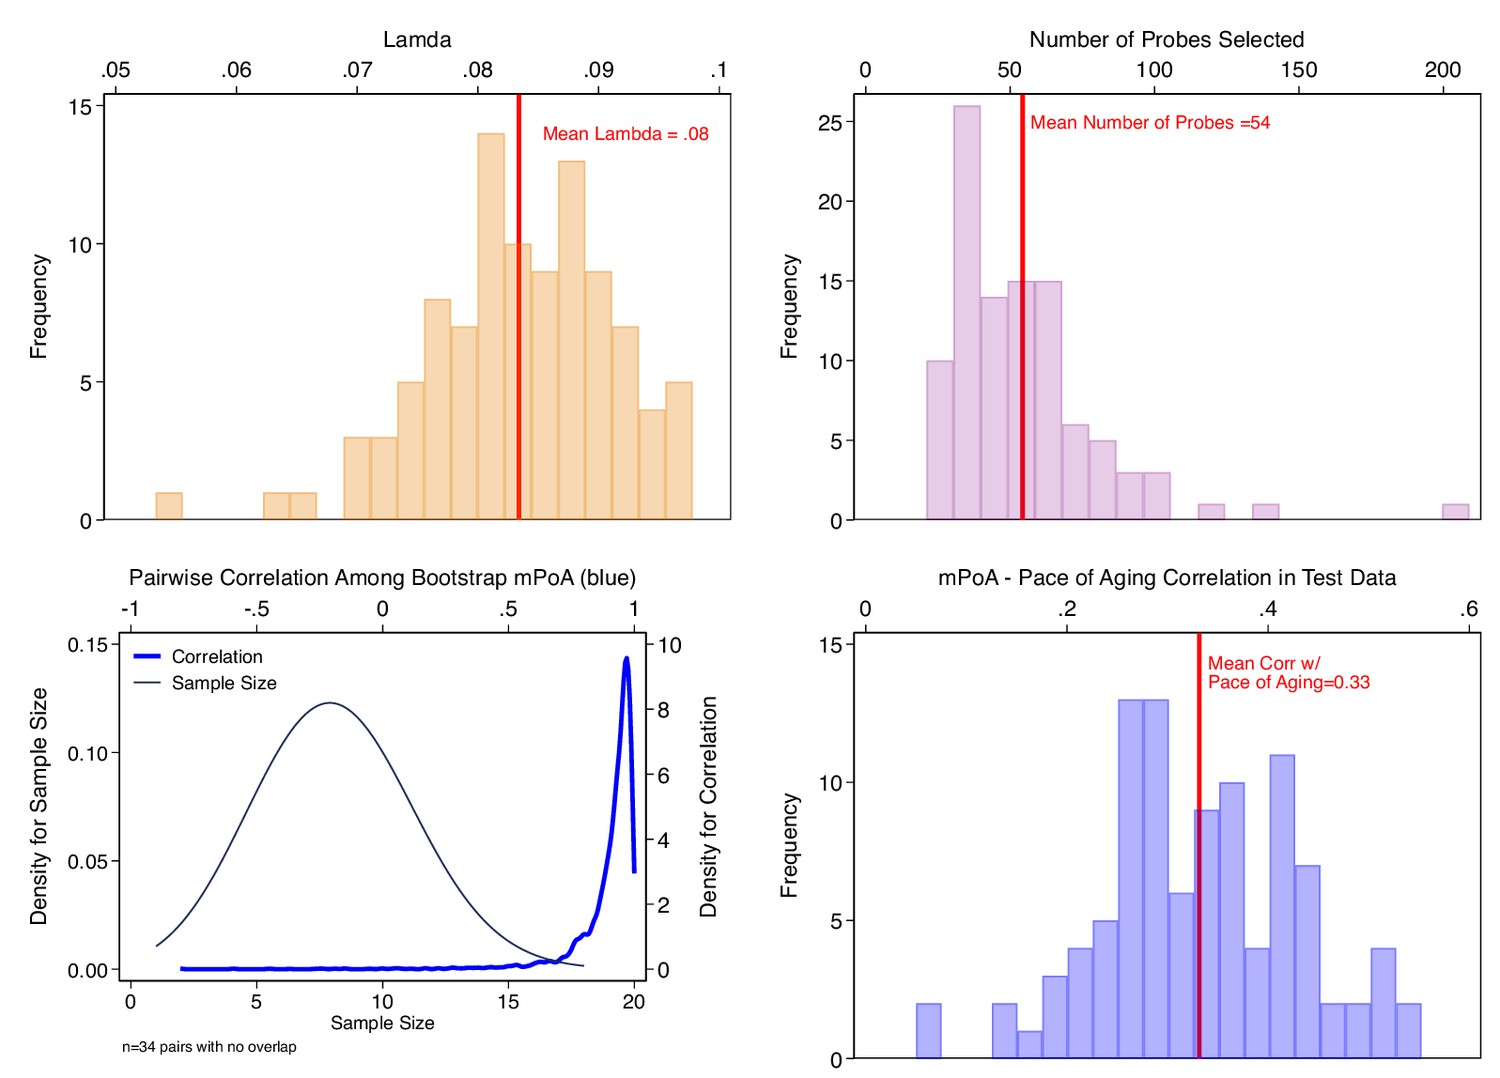
Bootstrap repetition analysis to estimate out-of-sample correlation between methylation Pace of Aging (mPoA) measures and longitudinal Pace of Aging in the Dunedin Study.
The figure shows results from our Bootstrap crossfold validation analysis to evaluate mPoA within the Dunedin Study. Panel A (top left) shows the distribution of elastic-net regression Lambda values estimated across the 100 bootstrap training samples. Panel B (top right) shows the distribution of the number of probes selected by the elastic net regression to compose mPoA across the 100 bootstrap training samples. Panel C (bottom left) graphs two densities illustrating analysis of intercorrelations among the different mPoA algorithms estimated across the bootstrap repetitions. The first density (thin gray line, left side Y axis) shows the distribution of sample sizes for calculation of correlations between pairs of mPoA algorithms. There were 34 pairs of mPoA algorithms for which there were no overlapping samples (i.e. sample size = 0). The second density (thick blue line, right side Y axis) shows the distribution of pairwise correlations. Nearly all of the correlations were r > 0.95. Panel D (bottom right) shows the distribution of correlations between the mPoA values and Pace of Aging in 100 bootstrap test samples.
Figure 1—figure supplement 3
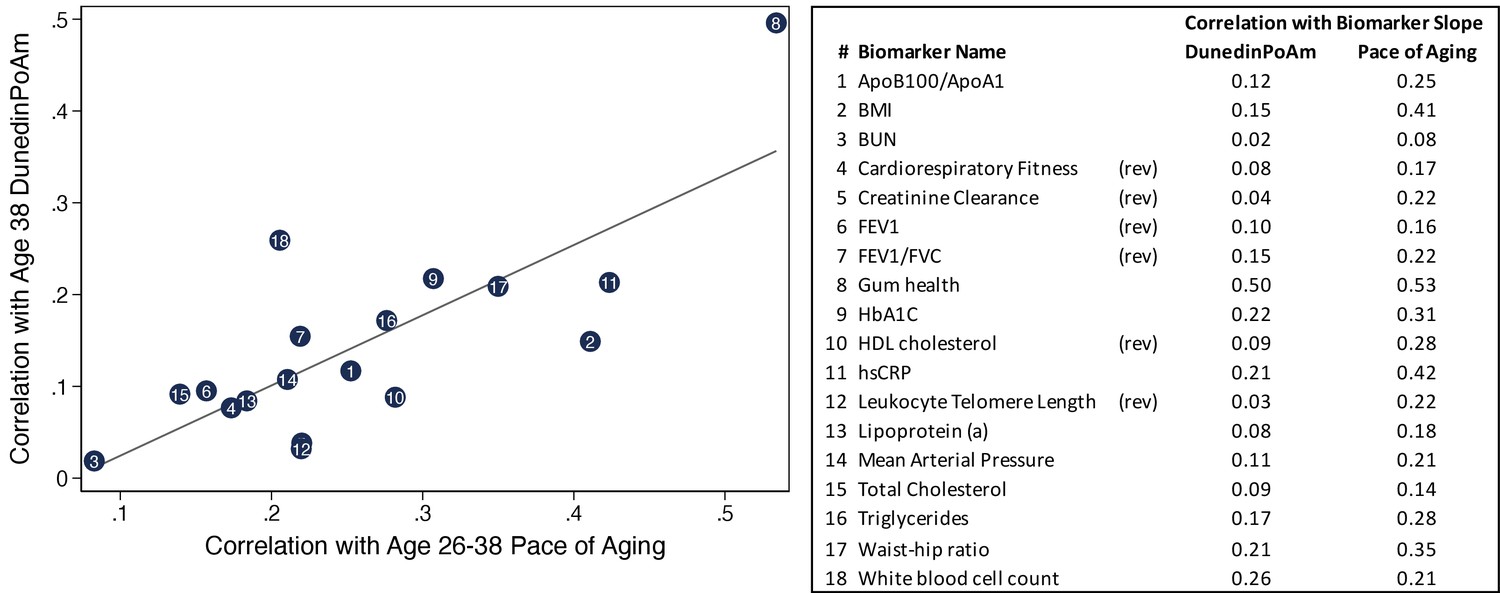
Correlations of individual biomarker slopes with DunedinPoAm plotted against their correlations with 12 year longitudinal Pace of Aging.
The figure shows a scatter plot of correlations of biomarker slopes with the original Pace of Aging measure (x-axis) and DunedinPoAm (y-axis). Plotted points are biomarker slopes. The table at left shows a key linking the numbers in the center of the points with biomarker names. The table also reports correlations with DunedinPoAm and Pace of Aging. Pace of Aging is calculated as the sum of slopes across the 18 biomarkers. Thus, the correlations plotted on the X-axis of the figure represent ‘item-total’ correlations, that is the correlations of individual components of the Pace of Aging measure with the summary measure itself.
Figure 2 with 3 supplements
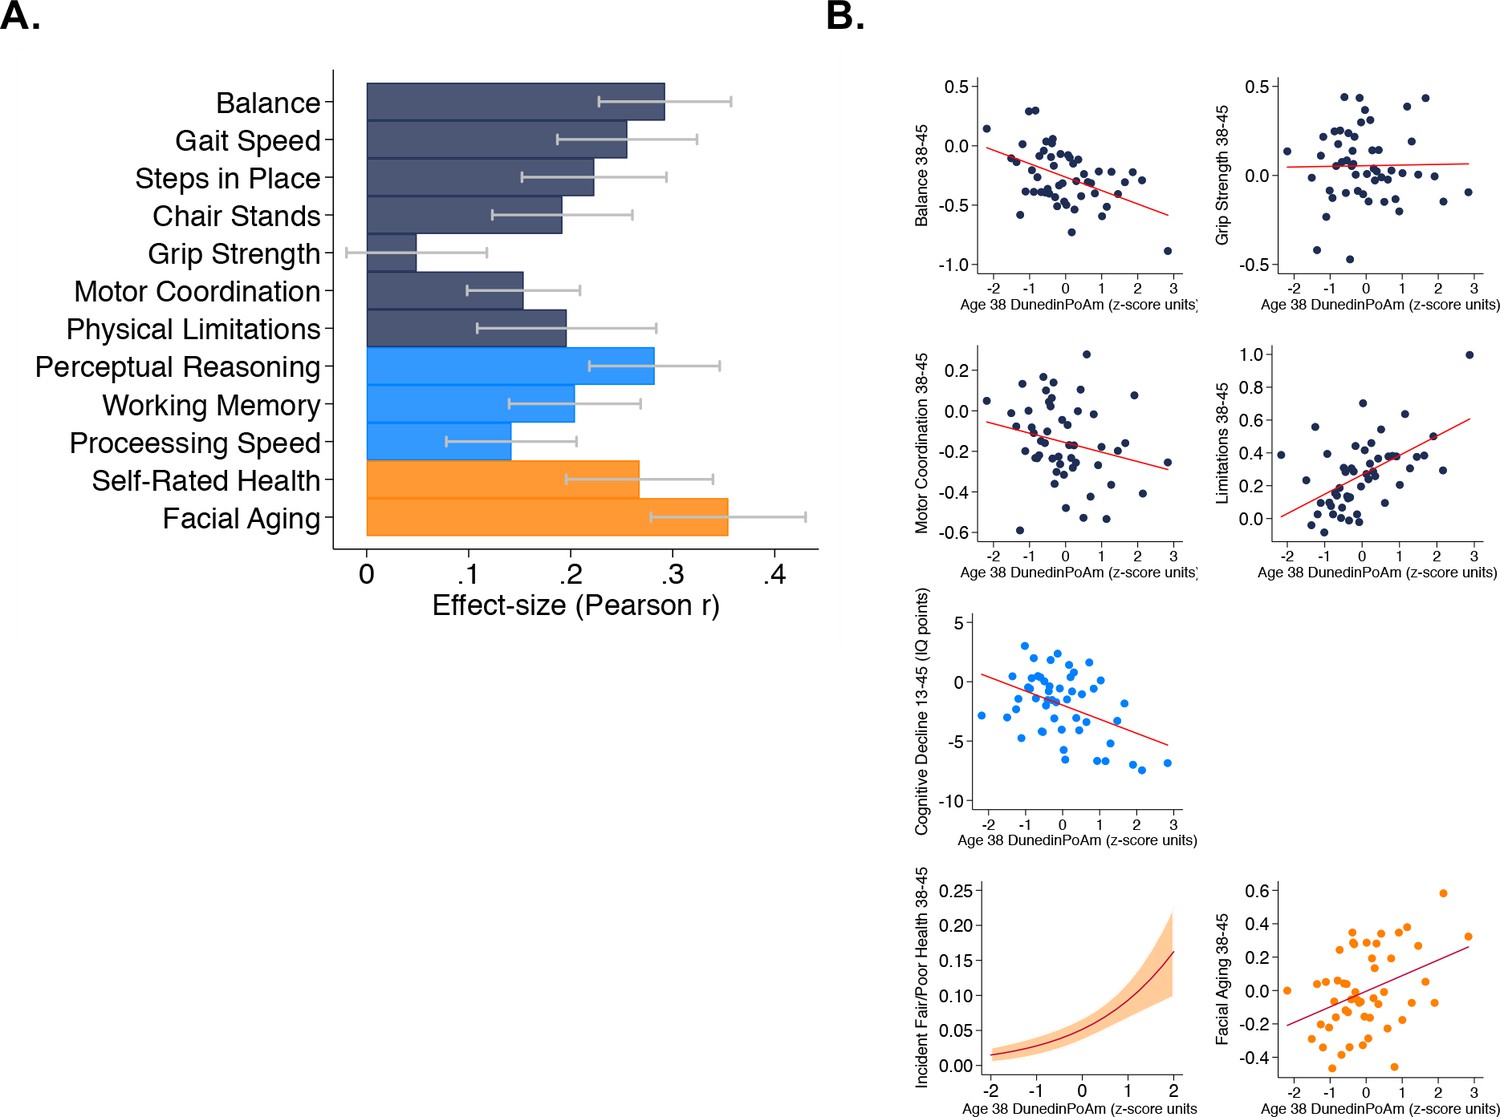
Faster age-38 DunedinPoAm is associated with poorer physical and cognitive functioning and subjective signs of aging at age 45 years, and with physical, cognitive, and subjective decline in the Dunedin Study.
Panel A graphs effect-sizes for age-38 DunedinPoAm associations with age-45 measures of physical and cognitive functioning and subjective signs of aging in the Dunedin Study. Effect-sizes are standardized regression coefficients interpretable as Pearson r. Models included covariate adjustment for sex. Panel B graphs associations between DunedinPoAm and change in physical functioning between age 38 and age 45 (top two rows), change in cognitive functioning between age 13 and age 45 (third row), and incident fair/poor health and accelerated facial aging between ages 38 and 45 (bottom row). Graphs for changes in balance, grip-strength, physical limitations, cognition, and facial aging are binned scatterplots. Plotted points reflect average x- and y-coordinates for ‘bins’ of approximately ten Study members. Fitted slopes show the association estimated from the raw, un-binned data. The y-axis scale on graphs of balance, grip-strength, and physical limitations shows change scores (age 45 – age 38) scaled in terms of age-38 standard deviation units. The y-axis scale on the graph of cognitive change shows the difference in IQ score (age 45 – baseline). The graph of change in facial aging shows the change in z-score between measurement intervals (age 45 – age 38). Models included covariate adjustment for sex. The graph for self-rated health plots the predicted probability (fitted slope) and 95% confidence interval (shaded area) of incident fair/poor health at age 45. The effect-size reported on the graph is the incidence-rate ratio (IRR) associated with a 1-SD increase in DunedinPoAm estimated from Poisson regression. The model included covariate adjustment for sex.
Figure 2—figure supplement 1
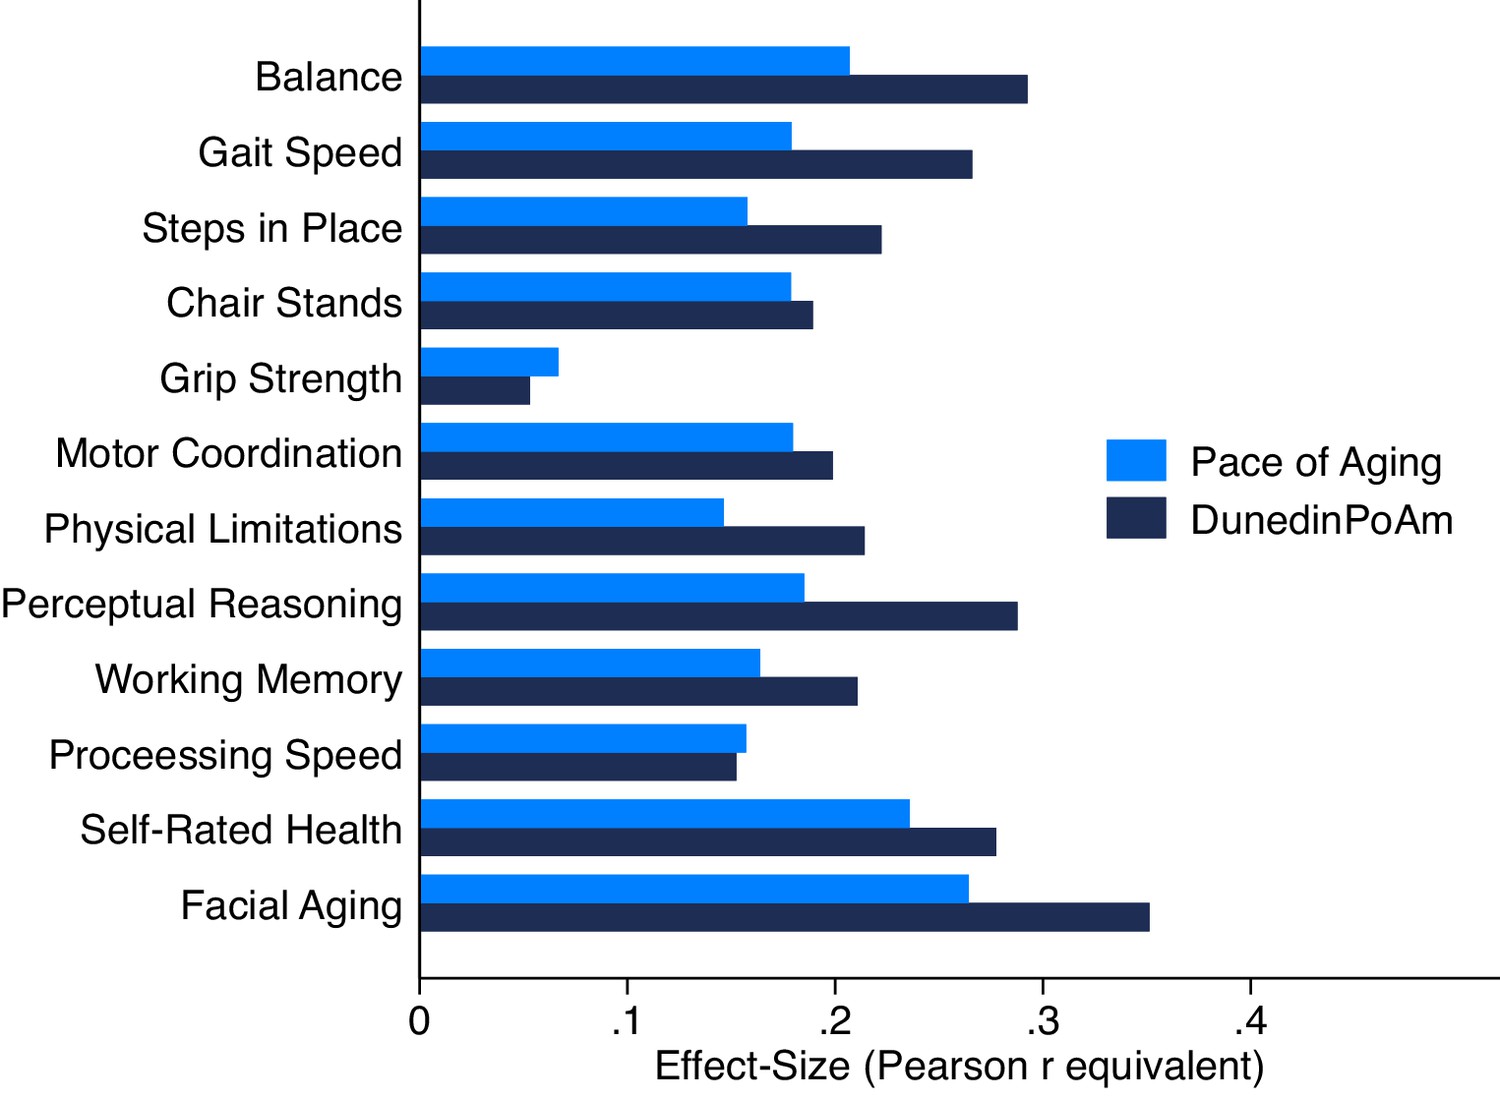
Association of DunedinPoAm and 12 year longitudinal Pace of Aging with age-45 healthspan characteristics in the Dunedin Study.
Figure graphs effect-sizes for associations of age-38 DunedinPoAm and 12 year longitudinal Pace of Aging with measures of physical and cognitive functioning and subjective signs of aging measured at the Dunedin Study age-45 assessment.
Figure 2—figure supplement 2
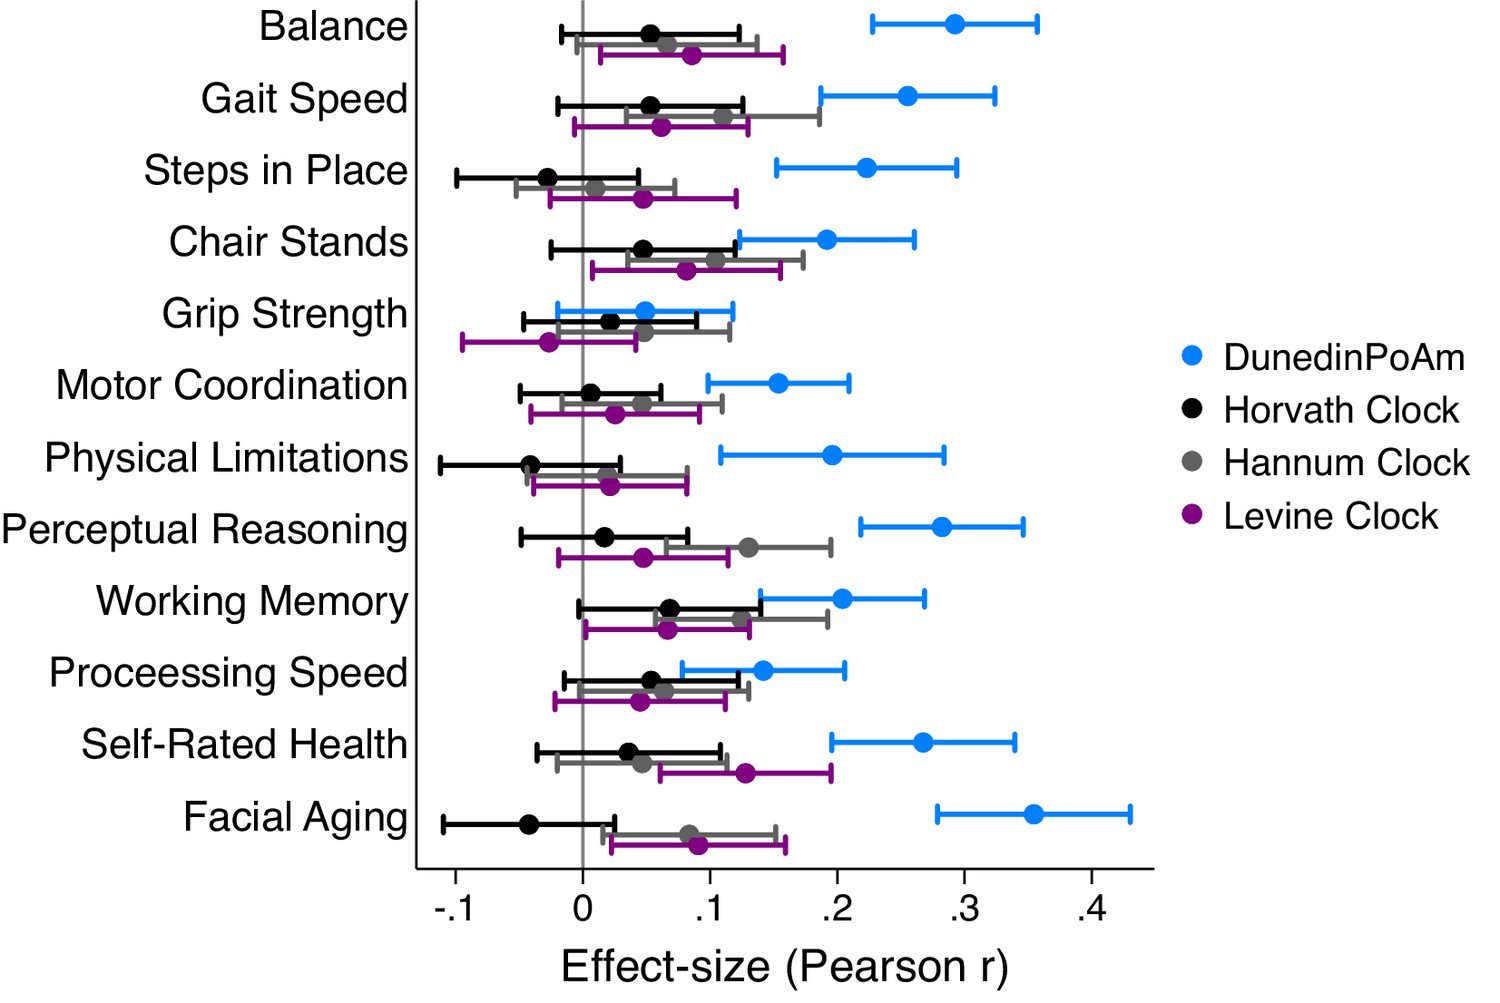
Effect-sizes for association of DunedinPoAm and epigenetic clocks with age-45 healthspan characteristics in the Dunedin Study.
The figure plots effect-sizes for DunedinPoAm and the epigenetic clocks proposed by Horvath, Hannum, and Levine for analysis of age-45 outcomes. Effect-sizes are standardized regression coefficients (interpretable as Pearson r). Effect-sizes are computed for ‘epigenetic-age acceleration’ values of the clocks (i.e. epigenetic ages residualized for chronological age). Error bars show 95% CIs. For all outcomes, effect-sizes are largest for DunedinPoAm.
Figure 2—figure supplement 3
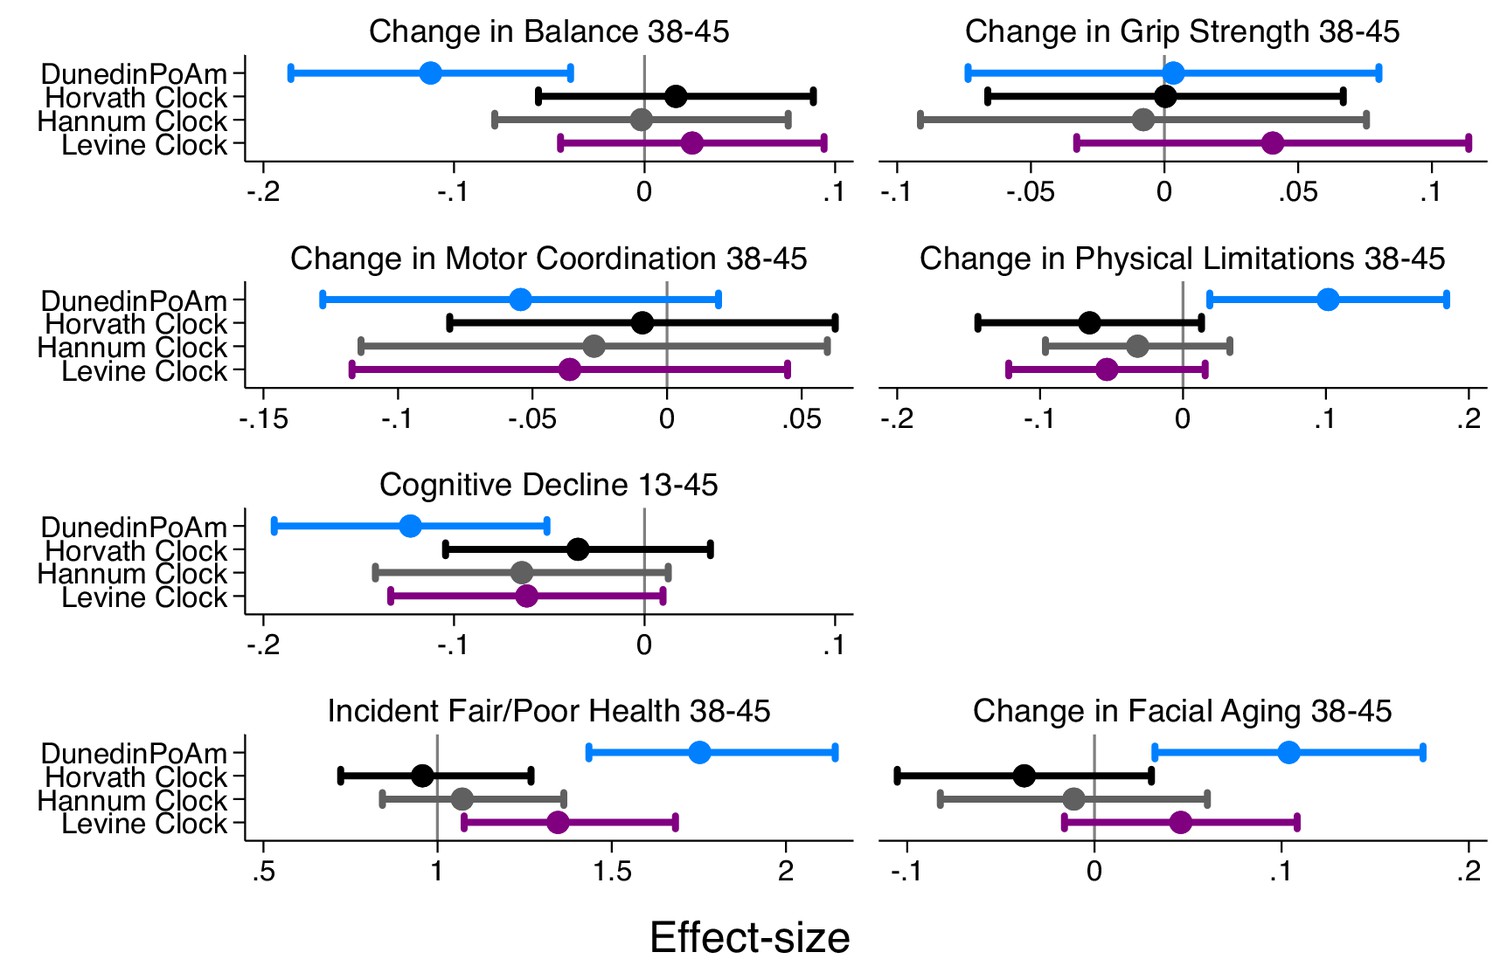
Effect-sizes for association of DunedinPoAm and epigenetic clocks with change over time in healthspan characteristics in the Dunedin Study.
The figure plots effect-sizes for DunedinPoAm and the epigenetic clocks proposed by Horvath, Hannum, and Levine for analysis of change scores computed for healthspan characteristics measured in parallel at the age-38 and −45 assessments and for change in cognitive functioning from adolescent baseline to age 45. Change scores were computed by differencing the values at the two time points (i.e. age-45 value – age-38 value). Effect-sizes are standardized regression coefficients (interpretable as Pearson r). Effect-sizes are computed for ‘epigenetic-age acceleration’ values of the clocks (i.e. epigenetic ages residualized for chronological age). Error bars show 95% CIs. For all outcomes except grip strength, effect-sizes are largest for DunedinPoAm.
Figure 3 with 1 supplement
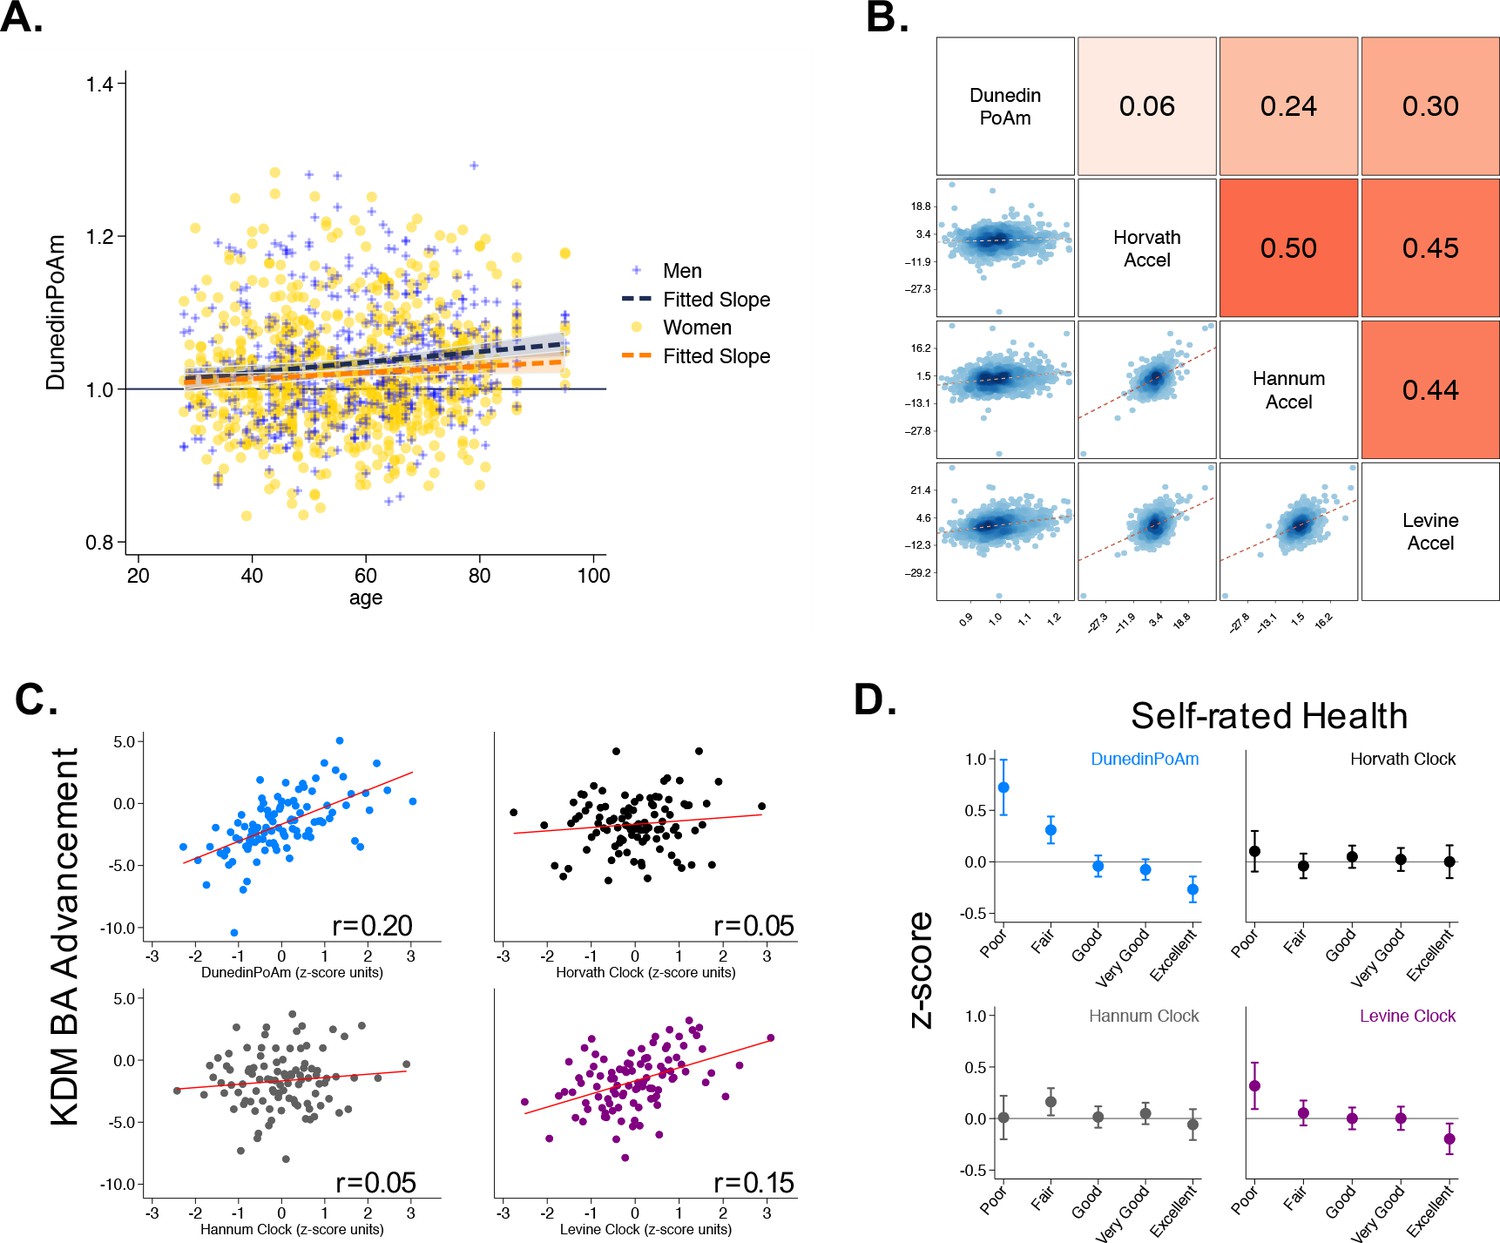
Associations of DunedinPoAm with chronological age, epigenetic clocks, KDM Biological Age, and self-rated health in Understanding Society.
Panel A shows a scatterplot and fitted slopes illustrating the association between chronological age (x-axis) and DunedinPoAm (y-axis) in women and men in the Understanding Society sample. Data for women are plotted with yellow dots (orange slope) and for men with blue crosses (navy slope). The figure illustrates a positive association between chronological age and DunedinPoAm (Pearson r = 0.11 95% CI [0.06–0.17]). Panel B shows a matrix of correlations and association plots among DunedinPoAm and age-acceleration residuals of the Horvath, Hannum, and Levine epigenetic clocks. The diagonal cells of the matrix list the DNA methylation measures. The half of the matrix below the diagonal shows scatter plots of associations. For each scatter-plot cell, the y-axis corresponds to the variable named along the matrix diagonal to the right of the plot and the x-axis corresponds to the variable named along the matrix diagonal above the plot. The half of the matrix above the diagonal lists Pearson correlations between the DNA methylation measures. For each correlation cell, the value reflects the correlation of the variables named along the matrix diagonal to the left of the cell and below the cell. Panel C graphs binned scatterplots of associations of DunedinPoAm and epigenetic clocks with KDM Biological Age advancement (the difference between KDM Biological Age and chronological age). Each plotted point shows average x- and y- coordinates for ‘bins’ of approximately 50 participants. Regression slopes are graphed from the raw, un-binned data. Panel D plots average values of the DNA methylation variables by Understanding Society participants’ self-rated health status. Error bars show 95% confidence intervals.
Figure 3—figure supplement 1
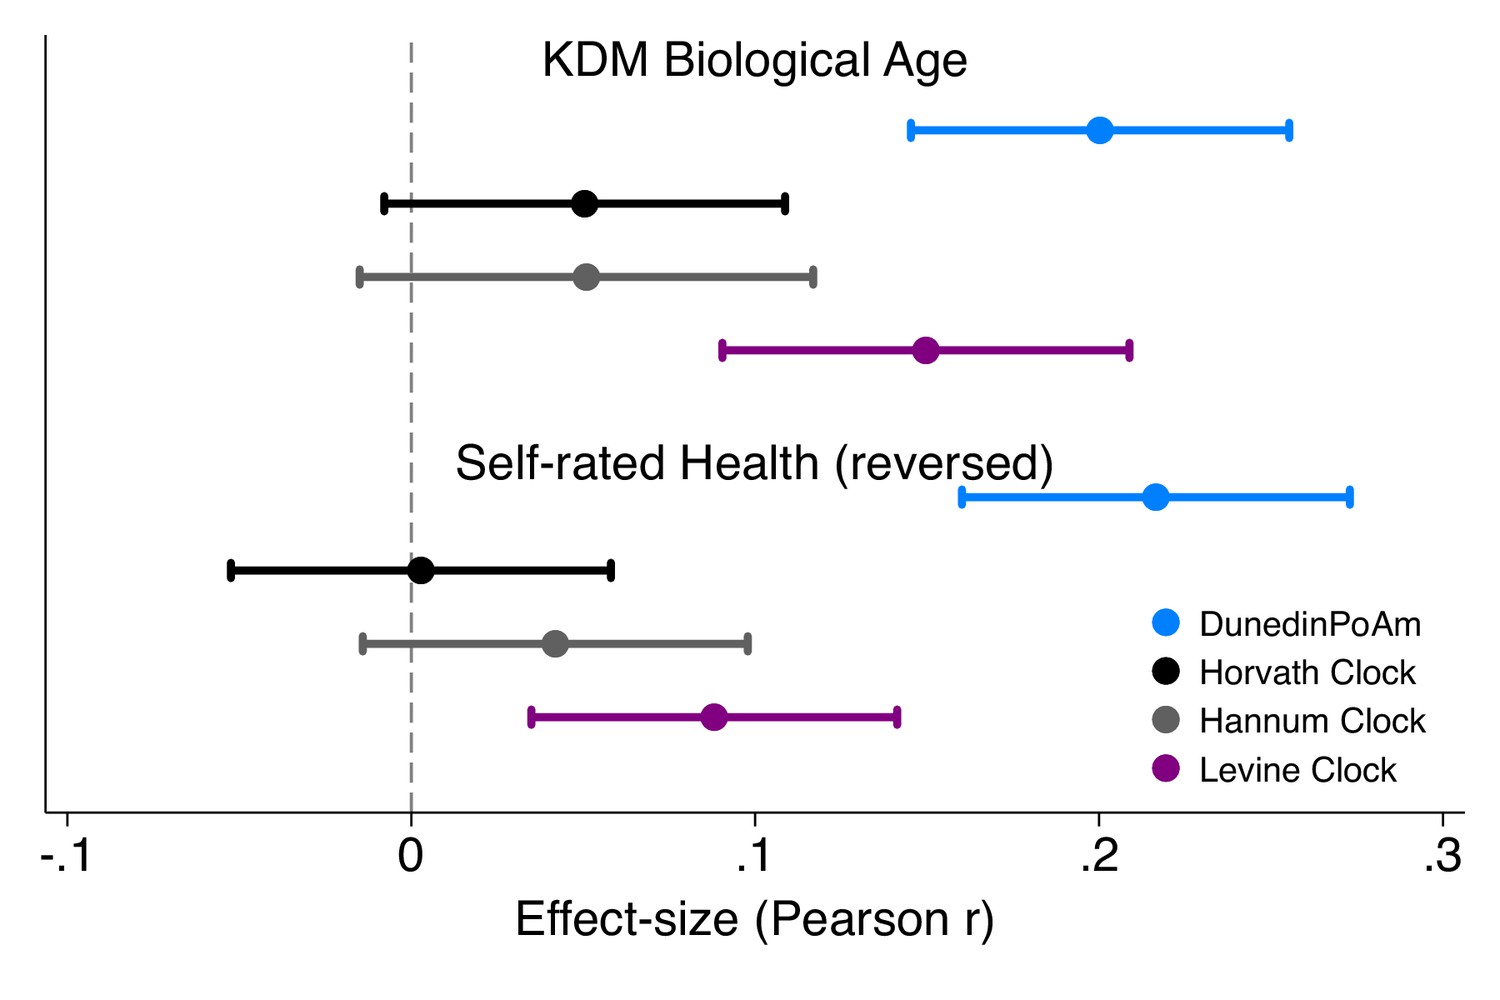
Effect-sizes for associations of DunedinPoAm and epigenetic clocks with KDM Biological Age and self-rated health in Understanding Society.
Effect-sizes are standardized regression coefficients (interpretable as Pearson r). Effect-sizes are computed for ‘epigenetic-age acceleration’ values of the clocks (i.e. epigenetic ages residualized for chronological age). The dependent variable in analysis of KDM Biological Age was the difference between KDM Biological Age and chronological age. Self-rated health scores were reversed for analysis so that higher values correspond to ratings of poorer health. All models were adjusted for chronological age and sex.
Figure 4 with 1 supplement
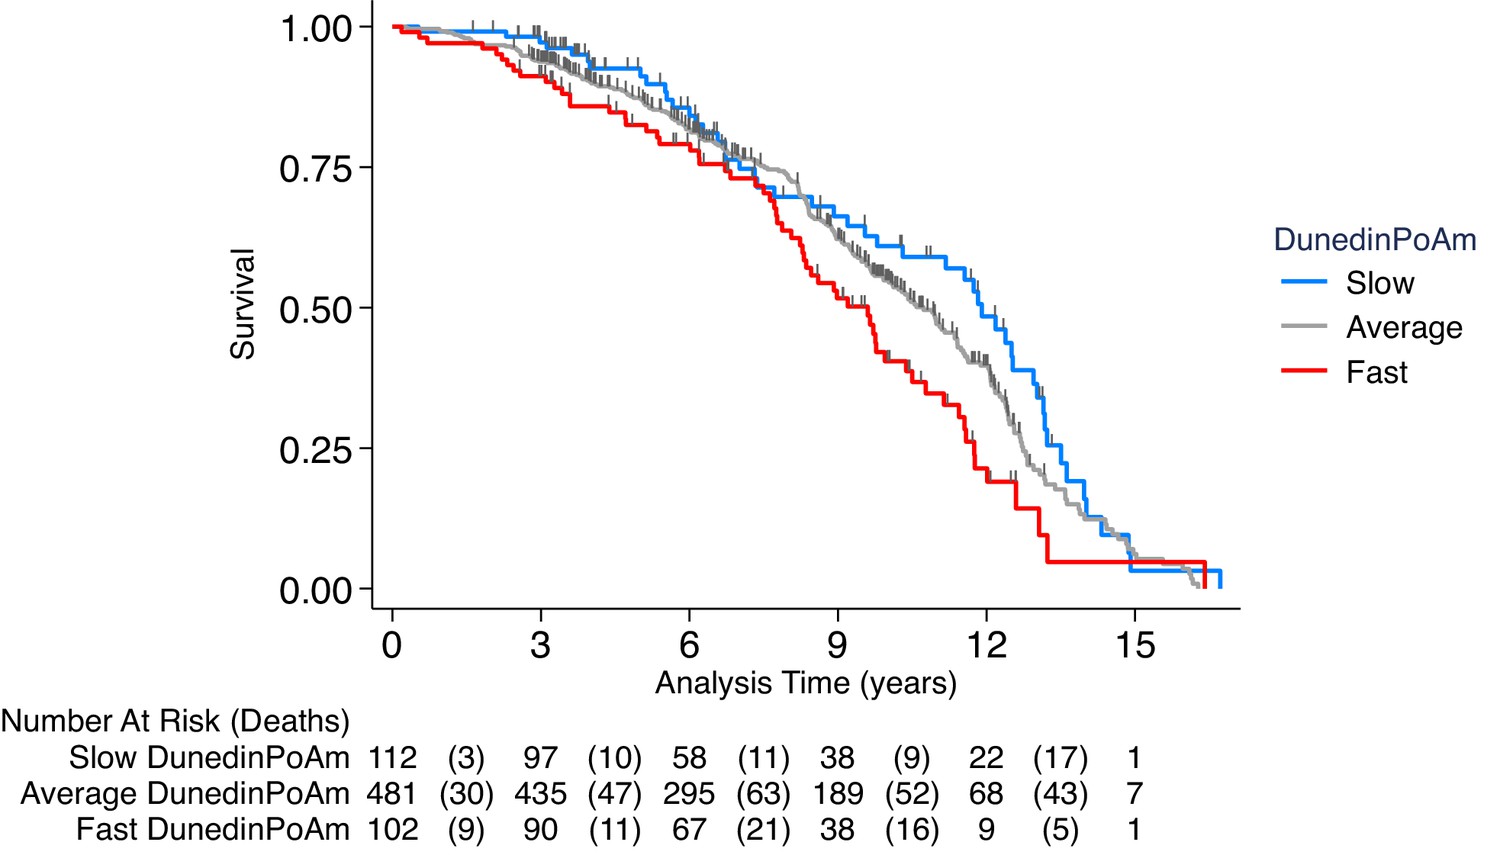
Association of DunedinPoAm with mortality in the Normative Aging Study (NAS).
The figure plots Kaplan-Meier curves for three groups of NAS participants: those with DunedinPoAm 1 SD or more below the mean (‘slow’ DunedinPoAm, blue line); those with DunedinPoAm within 1 SD of the mean (‘average’ DunedinPoAm, gray line); and those with DunedinPoAm 1 SD or more above the mean (‘fast’ DunedinPoAm, red line). Censoring of participants prior to death is indicated with a vertical gray hash mark. The table below the figure details the number of participants at risk per 3 year interval and, in parentheses, the number who died during the interval. The number censored can be calculated by subtracting the number of deaths in an interval from the difference between the number at risk in that interval and the number at risk in the following interval.
Figure 4—figure supplement 1
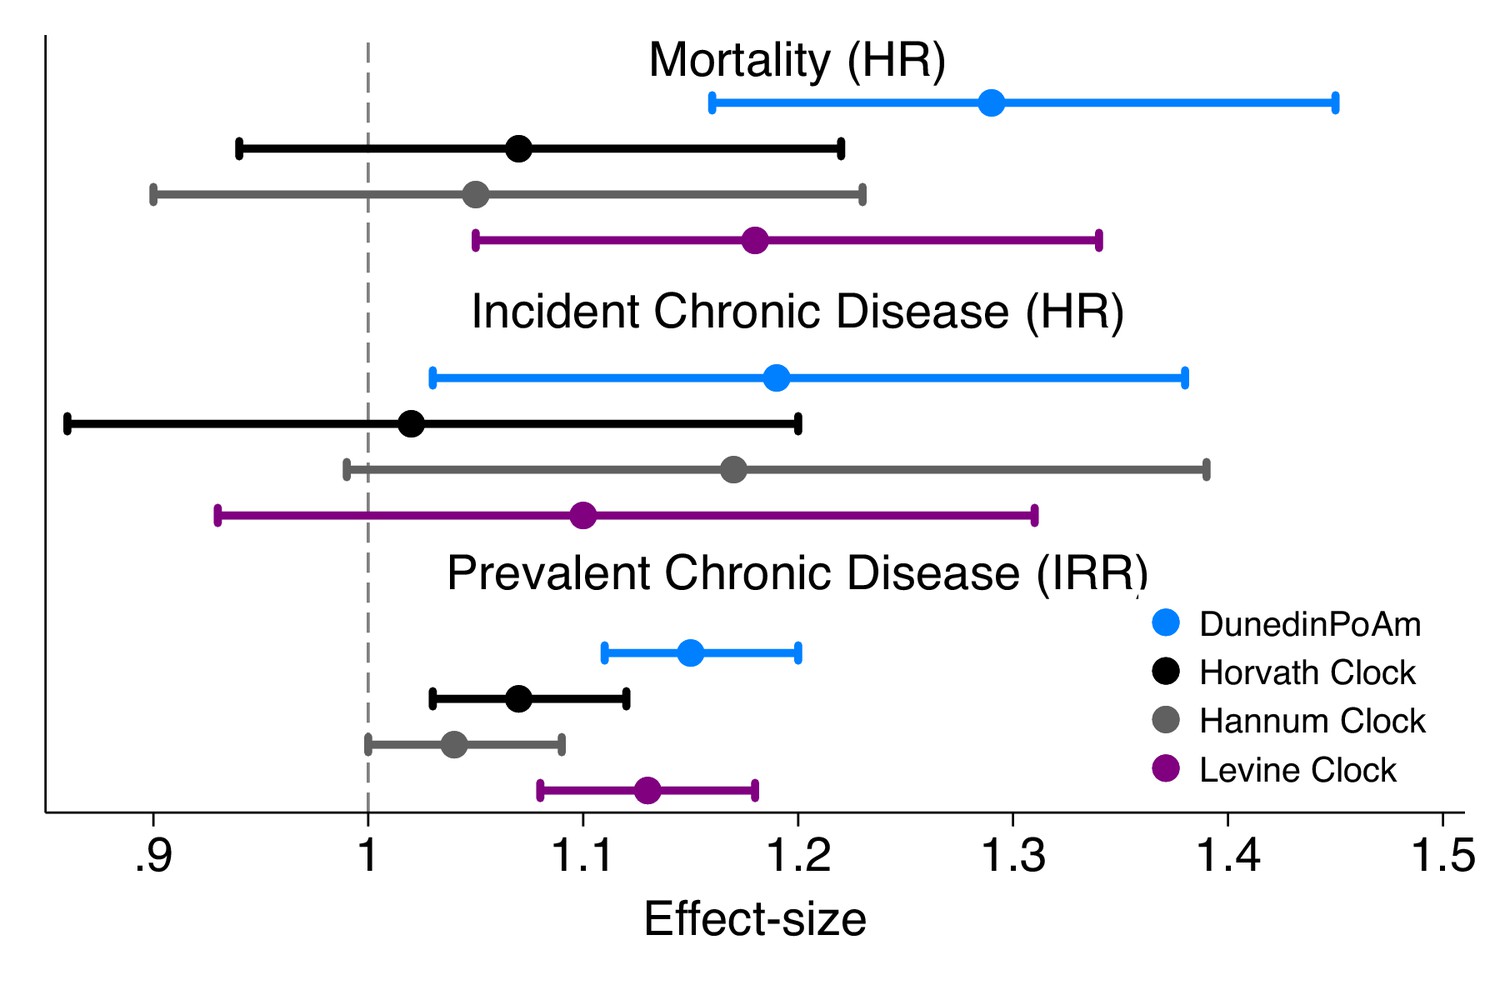
Effect-sizes for association of DunedinPoAm and epigenetic clocks with mortality and morbidity in the Normative Aging Study.
Time-to-event analysis of mortality and chronic disease incidence was conducted using Cox proportional hazard models to estimate hazard ratios (HRs) in N = 771 participants. Repeated-measures analysis of chronic disease prevalence was conducted using Poisson regression to estimate incidence rate ratios (IRRs) within a generalized estimating equations framework to account for the nonindependence of repeated observations of individuals (N = 1488 observations of 771 individuals). All models included covariate adjustment for chronological age. Age acceleration residuals for epigenetic clocks were calculated by regressing epigenetic age on chronological age and predicting residual values. All methylation measures were standardized to M = 0 SD = 1 for analysis. Effect-sizes thus reflect risk associated with a 1-SD increase in the methylation measure.
Figure 5 with 1 supplement
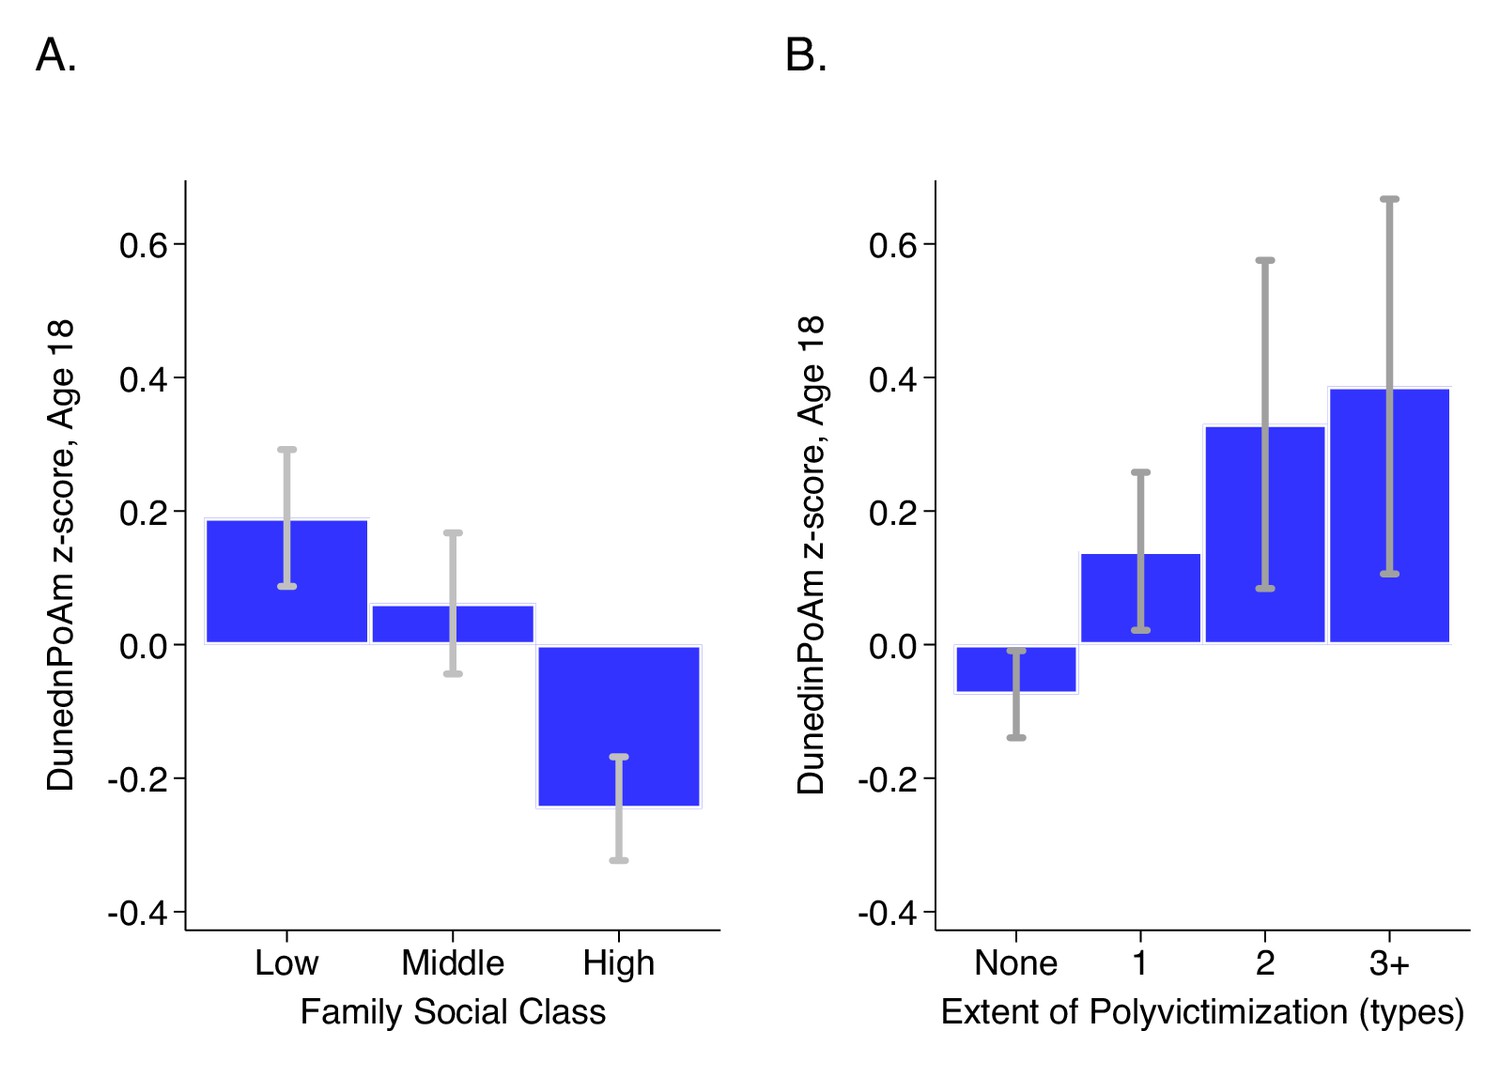
DunedinPoAm levels by strata of childhood socioeconomic status (SES) and victimization in the E-Risk Study.
Panel A (left side) plots means and 95% CIs for DunedinPoAm measured at age 18 among E-Risk participants who grew up low, middle, and high socioeconomic status households. Panel B (right side) plots means and 95% CIs for DunedinPoAm measured at age 18 among E-Risk participants who experienced 0, 1, 2, or three or more types of victimization through age 12 years.
Figure 5—figure supplement 1
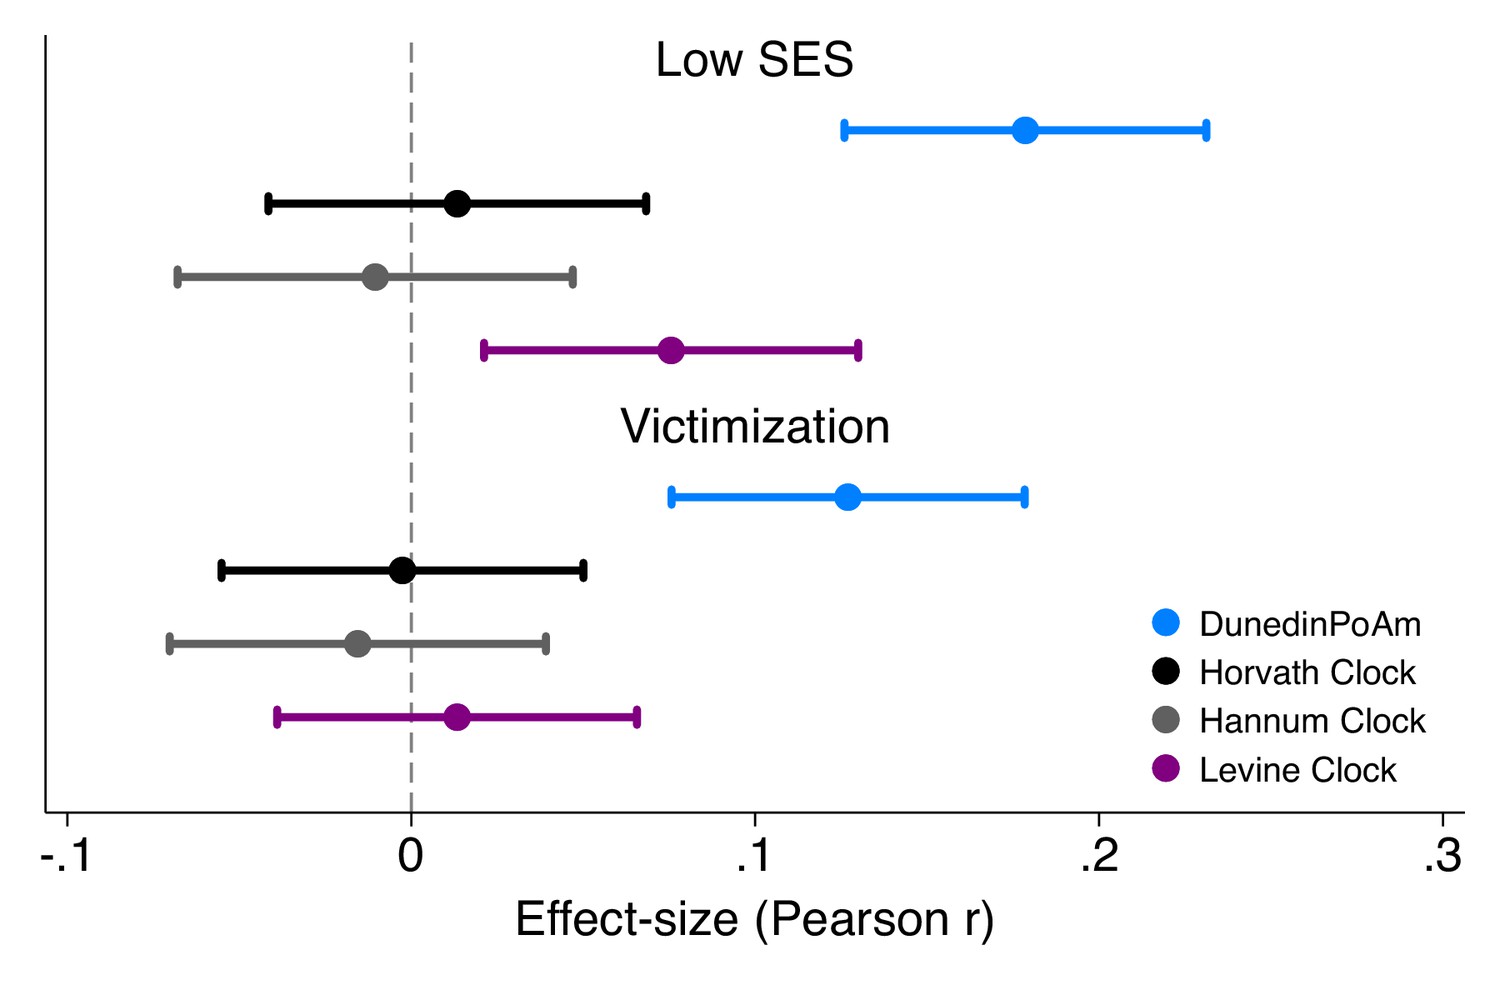
Effect-sizes for associations of childhood socioeconomic status and victimization exposure with DunedinPoAm and epigenetic clocks.
Effect-sizes are standardized regression coefficients and 95% confidence intervals from models in which childhood family socioeconomic status (SES) and victimization were predictor variables and the dependent variables were the methylation measures. All E-Risk participants were the same chronological age (18 years) at the time of blood collection. Epigenetic clock measures were differenced from this chronological age prior to analysis. Effect-sizes are reported in terms of standard deviation differences in the methylation measures associated with a one standard deviation increase in the predictor measure. All models were adjusted for sex. Standard errors were clustered at the family level to account for non-independence of twin data.
Figure 6 with 1 supplement

Change in KDM Biological Age over 24 month follow-up by treatment condition and baseline DunedinPoAm in the CALERIE Trial.
Fast DunedinPoAm is defined as 1 SD above the sample mean. Slow DunedinPoAm is defined as 1 SD below the sample mean. Slopes are predicted values from mixed effects regression including a 3-way interaction between trial condition, time, and continuous DunedinPoAm at baseline. The figure shows that in the Ad Libitum (AL) arm of the trial, participants with fast DunedinPoAm at baseline experience substantially more change in KDM Biological Age from baseline to follow-up as compared to AL participants with slow DunedinPoAm. In contrast, there was little difference between participants with fast as compared to slow DunedinPoAm in the Caloric Restriction (CR) arm of the trial.
Figure 6—figure supplement 1
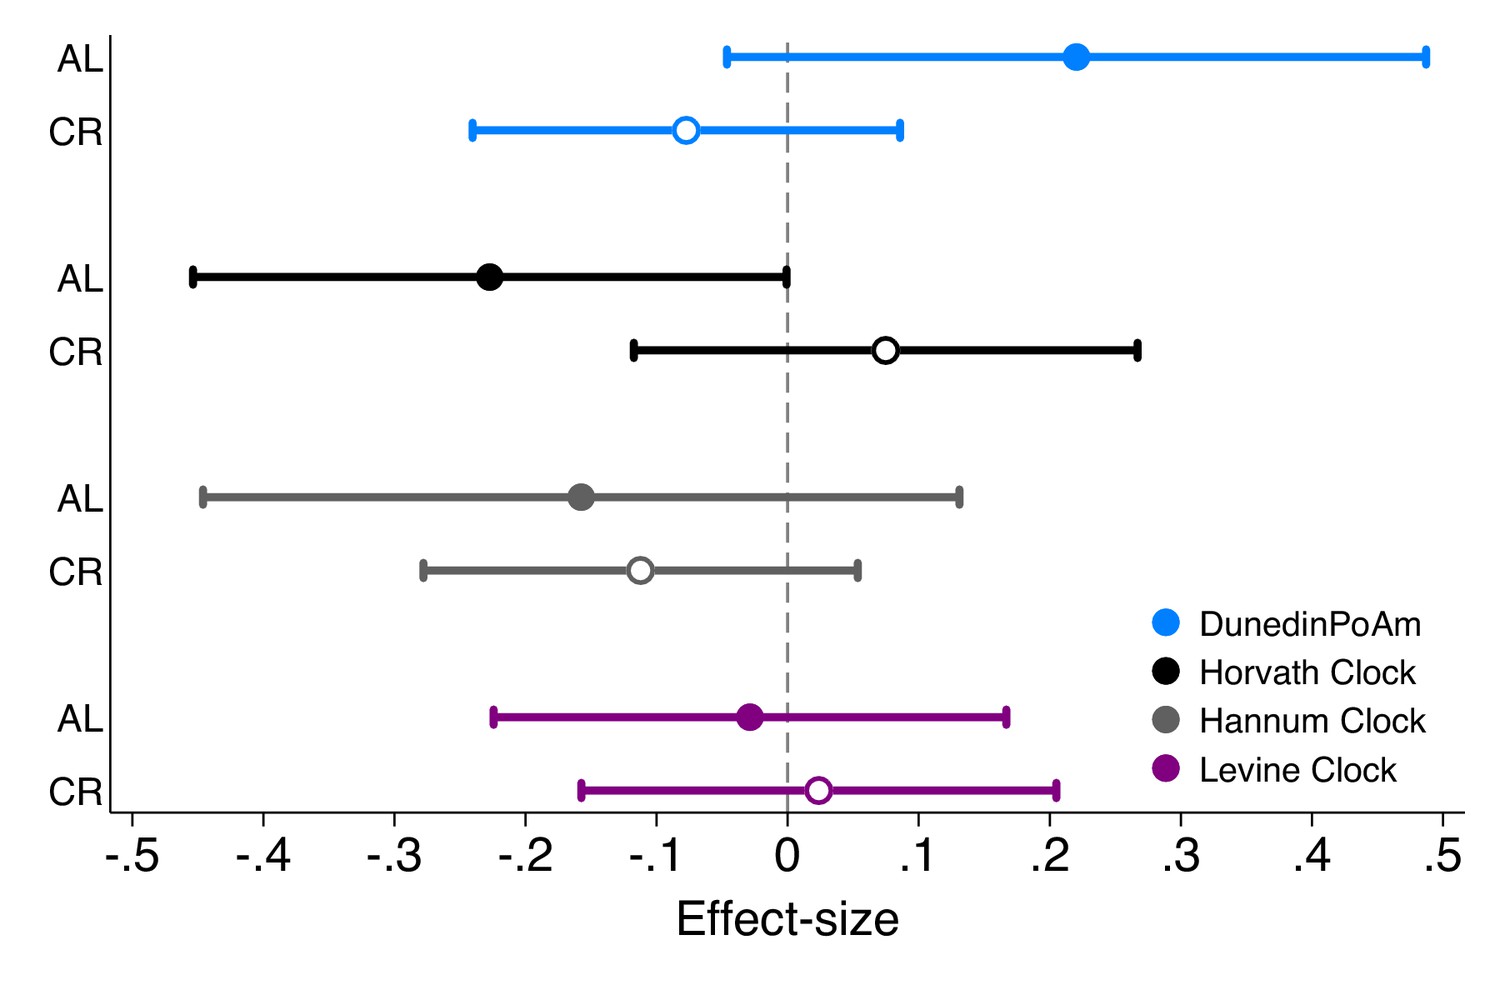
Effect-sizes for associations of DunedinPoAm and epigenetic clocks with future rate of change in KDM Biological Age in Ad Libitum (AL) control group and Caloric Restriction (CR) intervention group participants in the CALERIE Trial.
Effect-sizes are stratified marginal effects computed from regressions of predicted slopes of change in KDM Biological Age on treatment condition, baseline values of the methylation measures, and the interaction of treatment condition and the methylation measures. Effect-sizes for association of baseline DunedinPoAm with rate of change in KDM Biological Age over follow-up are plotted separately by treatment condition (AL for Ad Libitum control, plotted as solid-colored circles, CR for caloric restriction, plotted as hollow circles). Effect-sizes reflect the predicted increase in the rate of annual change in KDM Biological Age over the 2 years of follow-up associated with a 1 SD increase in the methylation measure. For example, for DunedinPoaM, a value of 0.2 for participants in the AL control condition indicates that having DunedinPoAm 1 SD higher at baseline is associated with an increase in the aging rate of 0.2 years of physiological change per 12 months of follow-up. Models included covariate adjustment for sex and chronological age at baseline.
Author response image 1
Additional files
-
Supplementary file 1
The supplementary file contains supplemental tables and figures.
Tables include (1) a list of the CpGs included in the DunedinPoAm algorithm and their associated weights, (2-7) results from regression models reported in the main text, and (8) a description of the functional test measures from the Dunedin Study. Supplementary figures show (1) analysis of the Dunedin Study to develop Dunedin PoAm and (1-6) effect-sizes for associations of DunedinPoAm and the epigenetic clocks porposed by Horvath, Hannum et al., and Levine et al. with outcome measures.
- https://cdn.elifesciences.org/articles/54870/elife-54870-supp1-v2.docx
-
Transparent reporting form
- https://cdn.elifesciences.org/articles/54870/elife-54870-transrepform-v2.docx
Download links
A two-part list of links to download the article, or parts of the article, in various formats.
Downloads (link to download the article as PDF)
Open citations (links to open the citations from this article in various online reference manager services)
Cite this article (links to download the citations from this article in formats compatible with various reference manager tools)
Quantification of the pace of biological aging in humans through a blood test, the DunedinPoAm DNA methylation algorithm
eLife 9:e54870.
https://doi.org/10.7554/eLife.54870


