A discrete subtype of neural progenitor crucial for cortical folding in the gyrencephalic mammalian brain
- Department of Medical Neuroscience, Graduate School of Medical Sciences, Kanazawa University, Japan
- Medical Research Training Program, School of Medicine, Kanazawa University, Japan
Figures
Figure 1 with 1 supplement
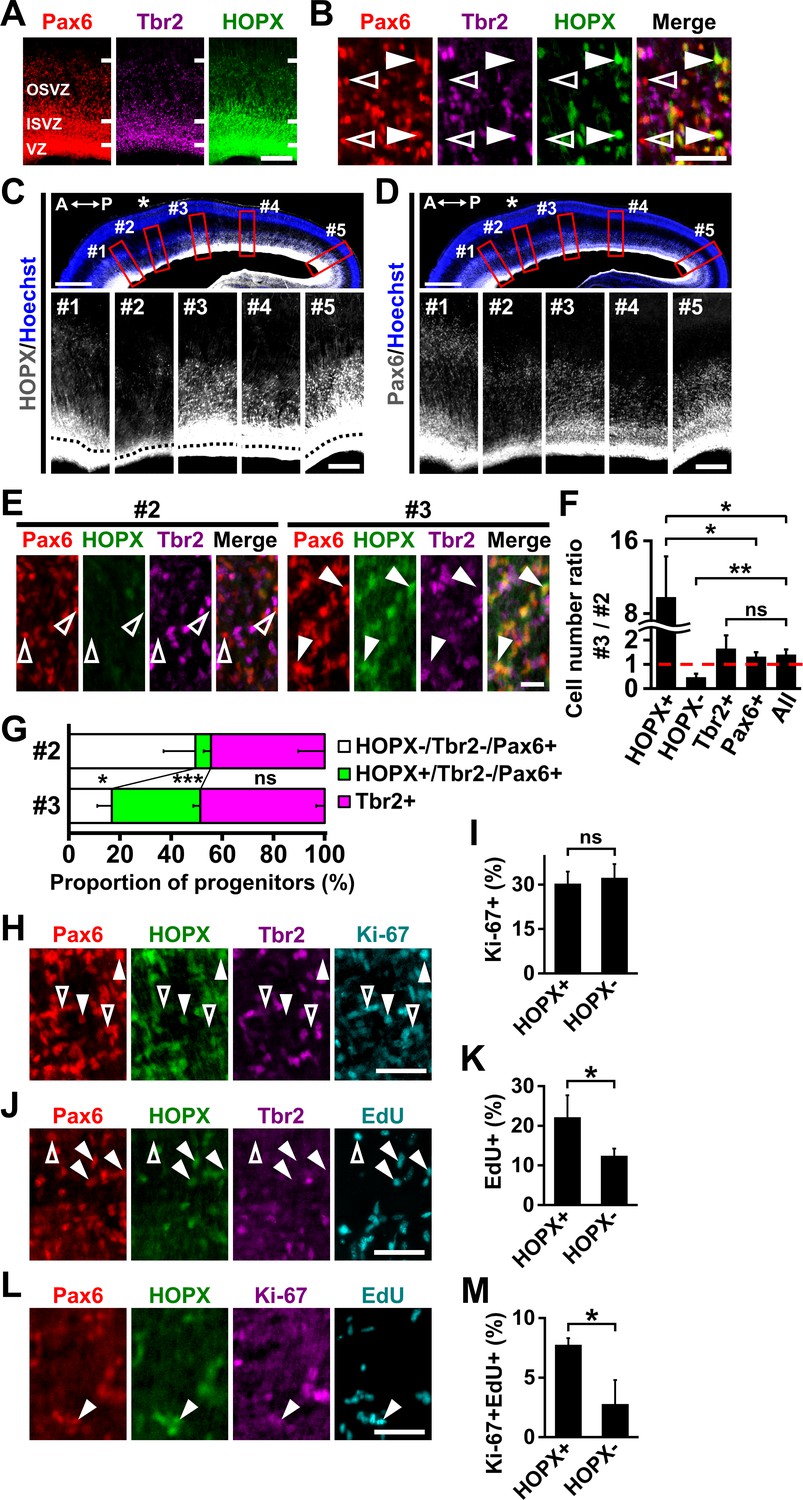
HOPX-positive oRG cells are preferentially distributed in prospective gyral regions in the developing ferret cerebral cortex.
(A, B) Sections of the ferret cerebral cortex at P1 were subjected to immunohistochemistry for Pax6, Tbr2 and HOPX. (B) Higher magnification images of the OSVZ are shown. HOPX was expressed in a subset of oRG cells (Pax6-positive and Tbr2-negative). Arrowheads and open arrowheads indicate HOPX-positive and HOPX-negative oRG cells, respectively. Scale bars = 200 µm (A), 50 μm (B). (C, D) Sagittal sections of the ferret brain at P1 were subjected to Hoechst 33342 staining plus immunohistochemistry for HOPX (C) and Pax6 (D). Asterisks indicate prospective sulcal regions. Five regions (red boxes, #1–#5) based on the positions of prospective gyri and sulci in the upper panels are magnified in the lower panels. Black broken lines indicate the border between the VZ and the ISVZ. A, anterior; P, posterior.Scale bars = 1 mm (upper), 200 µm (lower). (E) Sections of the ferret cerebral cortex at P1 were subjected to immunohistochemistry for Pax6, HOPX and Tbr2. Magnified images of the OSVZ corresponding to regions #2 and #3 are shown. Arrowheads and open arrowheads indicate HOPX-positive and HOPX-negative oRG cells, respectively. Scale bar = 20 μm. (F) Ratios of cell numbers between prospective gyral and sulcal regions. Numbers of HOPX-positive oRG cells (HOPX+), HOPX-negative oRG cells (HOPX-), IP cells (Tbr2+), Pax6-positive cells and Tbr2-positive and/or Pax6-positive cells (All) in region #3 were divided by the corresponding numbers in region #2. The ratio would be one if the number of cells was the same between regions #3 and #2 (broken red line). n = 3 animals. Bars present mean ± SD. ns, not significant. *p<0.05, **p<0.01, Student's t-test. (G) Proportions of HOPX-positive oRG cells (green), HOPX-negative oRG cells (white) and IP cells (magenta) in regions #2 and #3. n = 3 animals. Bars present mean ± SD. *p<0.05, ***p<0.001, Student's t-test. (H) Sections of the ferret cerebral cortex at P1 were quadruple-stained with anti-HOPX, anti-Tbr2, anti-Pax6 and anti-Ki-67 antibodies. Arrowheads and open arrowheads indicate HOPX-positive oRG cells co-expressing Ki-67 and HOPX-negative oRG cells co-expressing Ki-67, respectively. Scale bar = 50 μm. (I) Percentages of HOPX-positive (HOPX+) and HOPX-negative (HOPX-) oRG cells co-expressing Ki-67 in the OSVZ. n = 3 animals. Bars present mean ± SD. ns, not significant. Student's t-test. (J) Newborn ferrets were intraperitoneally injected with EdU at P0 and analyzed 28 hr later. Sections were triple-stained with anti-HOPX, anti-Tbr2 and anti-Pax6 antibodies, and EdU was visualized.Arrowheads and open arrowheads indicate HOPX-positive and HOPX-negative oRG cells co-labeled with EdU, respectively. Scale bar = 50 μm. (K) Percentages of HOPX-positive (HOPX+) and HOPX-negative (HOPX-) oRG cells co-labeled with EdU in the OSVZ. n = 3 animals for each condition. Bars present mean ± SD. *p<0.05, Student's t-test. (L) Newborn ferrets were intraperitoneally injected with EdU at P0 and analyzed 28 hr later. Sections were triple-stained with anti-HOPX, anti-Pax6 and anti-Ki-67 antibodies, and EdU was visualized.Arrowhead indicates HOPX-positive oRG cells co-labeled with Ki-67 and EdU. Scale bar = 50 μm. (M) Percentages of HOPX-positive (HOPX+) and HOPX-negative (HOPX-) oRG cells co-labeled with Ki-67 and EdU in the OSVZ. n = 3 animals for each condition. Bars present mean ± SD. *p<0.05, Student's t-test.
Figure 1—figure supplement 1
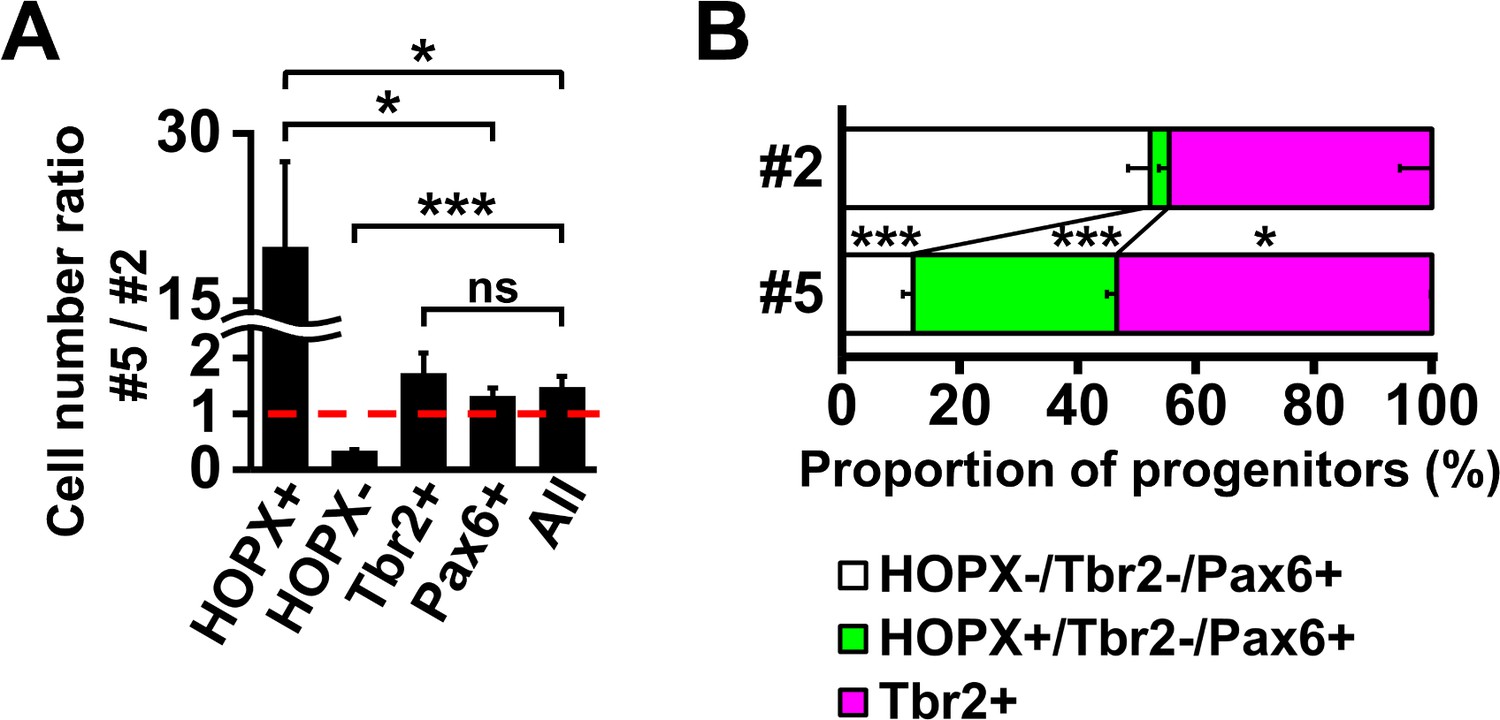
HOPX-positive oRG cells are preferentially distributed in prospective gyral regions in the developing ferret cerebral cortex.
(A) Ratios of cell numbers between prospective gyral and sulcal regions. Numbers of HOPX-positive oRG cells (HOPX+), HOPX-negative oRG cells (HOPX-), IP cells (Tbr2+), Pax6-positive cells and Tbr2-positive and/or Pax6-positive cells (All) in region #5 were divided by the corresponding numbers in region #2. The ratio would be one if the number of cells was the same between regions #5 and #2 (broken red line). n = 3 animals. Bars present mean ± SD. ns, not significant. *p<0.05, ***p<0.001, Student's t-test. (B) Proportions of HOPX-positive oRG cells (green), HOPX-negative oRG cells (white) and IP cells (magenta) in regions #5 and #2. n = 3 animals. Bars present mean ± SD. *p<0.05, ***p<0.001, Student's t-test.
Figure 2 with 2 supplements
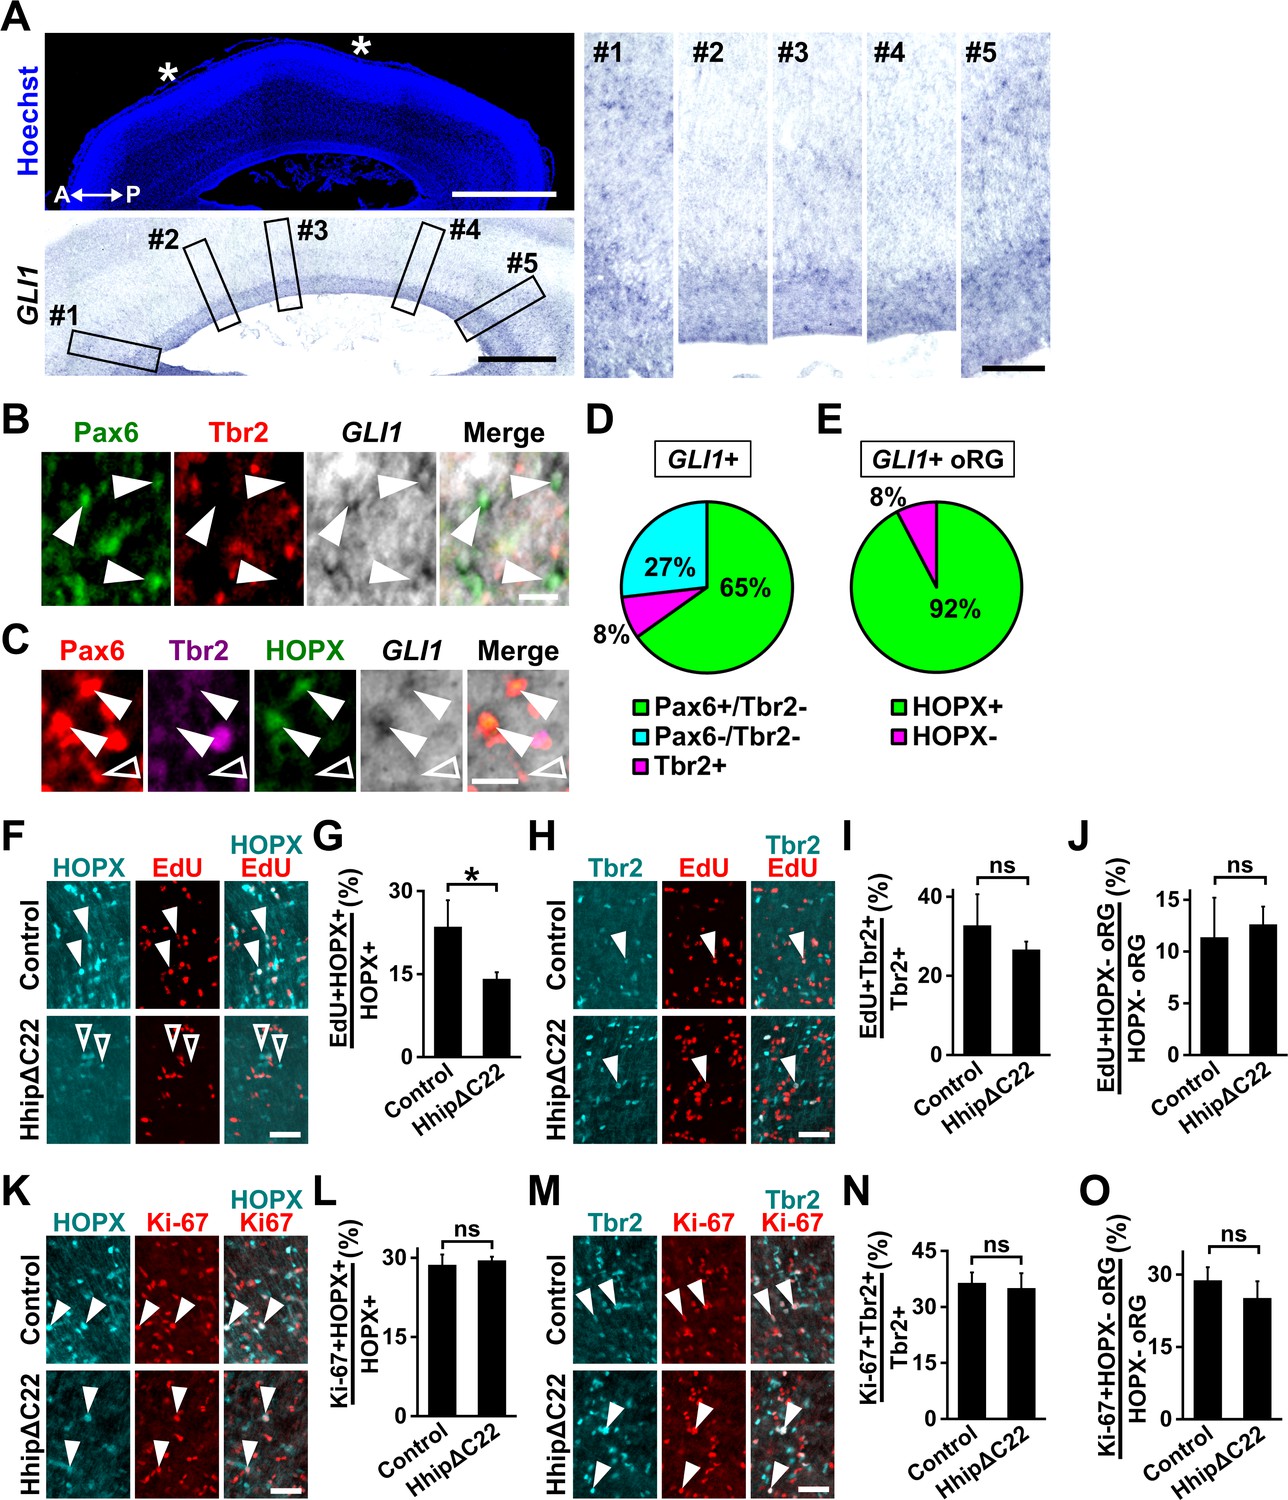
Shh signaling is highly activated in HOPX-positive oRG cells and prevents HOPX-positive oRG cells from differentiating.
(A) Sagittal sections of the ferret brain at P6 were subjected to in situ hybridization for GLI1 and Hoechst 33342 staining. Asterisks indicate areas of prospective sulci. A higher-magnification image of the germinal zone is shown in the lower panel. Five regions (boxes, #1–#5) based on the positions of prospective gyri and sulci in the left panels were magnified and are shown in the right panels. GLI1 was more abundantly expressed in the OSVZ of prospective gyri (#1, 3, 5) than in that of prospective sulci (#2, 4). A, anterior; P, posterior.Scale bars = 2 mm (left, upper), 1 mm (left, lower), 200 μm (right). (B) Sections of the ferret cerebral cortex at P1 were subjected to in situ hybridization for GLI1 and immunohistochemistry for Pax6 and Tbr2. High-magnification images of the OSVZ are shown. GLI1 was mainly expressed in oRG cells (Pax6-positive and Tbr2-negative, arrowheads). Scale bar = 20 μm. (C) Sections of the ferret cerebral cortex at P1 were subjected to in situ hybridization for GLI1 and immunohistochemistry for Pax6, Tbr2 and HOPX. High-magnification images of the OSVZ are shown. GLI1-positive oRG cells were mainly HOPX-positive (arrowheads), rather than HOPX-negative (open arrowhead). Scale bar = 20 μm. (D) Percentage of GLI1-positive cells co-expressing Pax6 and/or Tbr2. n = 3 animals. (E) Percentage of GLI1-positive oRG cells that were also positive for HOPX. n = 3 animals. (F–J) pCAG-EGFP plus either pCAG-HhipΔC22 or pCAG control vector was electroporated into the ferret cerebral cortex at E33. The newborn ferrets were then intraperitoneally injected with EdU at P0 and analyzed 28 hr later. (F) Sections were stained with anti-HOPX antibody, and EdU was visualized. Magnified images of the OSVZ are shown. Arrowheads and open arrowheads indicate HOPX-positive cells co-labeled with and without EdU, respectively. (G) Percentage of HOPX-positive cells co-labeled with EdU in the OSVZ. (H) Sections were stained with anti-Tbr2 antibody, and EdU was visualized. Magnified images of the OSVZ are shown. Arrowheads indicate Tbr2-positive cells co-labeled with EdU. (I) Percentage of Tbr2-positive cells co-labeled with EdU. n = 3 animals for each condition. (J) Percentage of HOPX-negative oRG cells co-labeled with EdU in the OSVZ. Bars present mean ± SD. *p<0.05; ns, not significant; Student's t-test. Scale bars = 50 μm. (K–O) pCAG-EGFP plus either pCAG-HhipΔC22 or pCAG control vector was electroporated at E33, and the brains were dissected at P1. (K) Sections were double-stained with anti-HOPX and anti-Ki-67 antibodies, and magnified images of the OSVZ are shown. Arrowheads indicate HOPX-positive cells co-expressing Ki-67. (L) Percentages of HOPX-positive cells co-expressing Ki-67 in the OSVZ. (M) Sections were double-stained with anti-Tbr2 and anti-Ki-67 antibodies, and magnified images of the OSVZ are shown. Arrowheads indicate Tbr2-positive cells co-expressing Ki-67. (N) Percentages of Tbr2-positive cells co-expressing Ki-67 in the OSVZ. (O) Percentages of HOPX-negative oRG cells co-expressing Ki-67 in the OSVZ. n = 3 animals for each condition. Bars present mean ± SD. ns, not significant; Student's t-test. Scale bars = 50 μm.
Figure 2—figure supplement 1
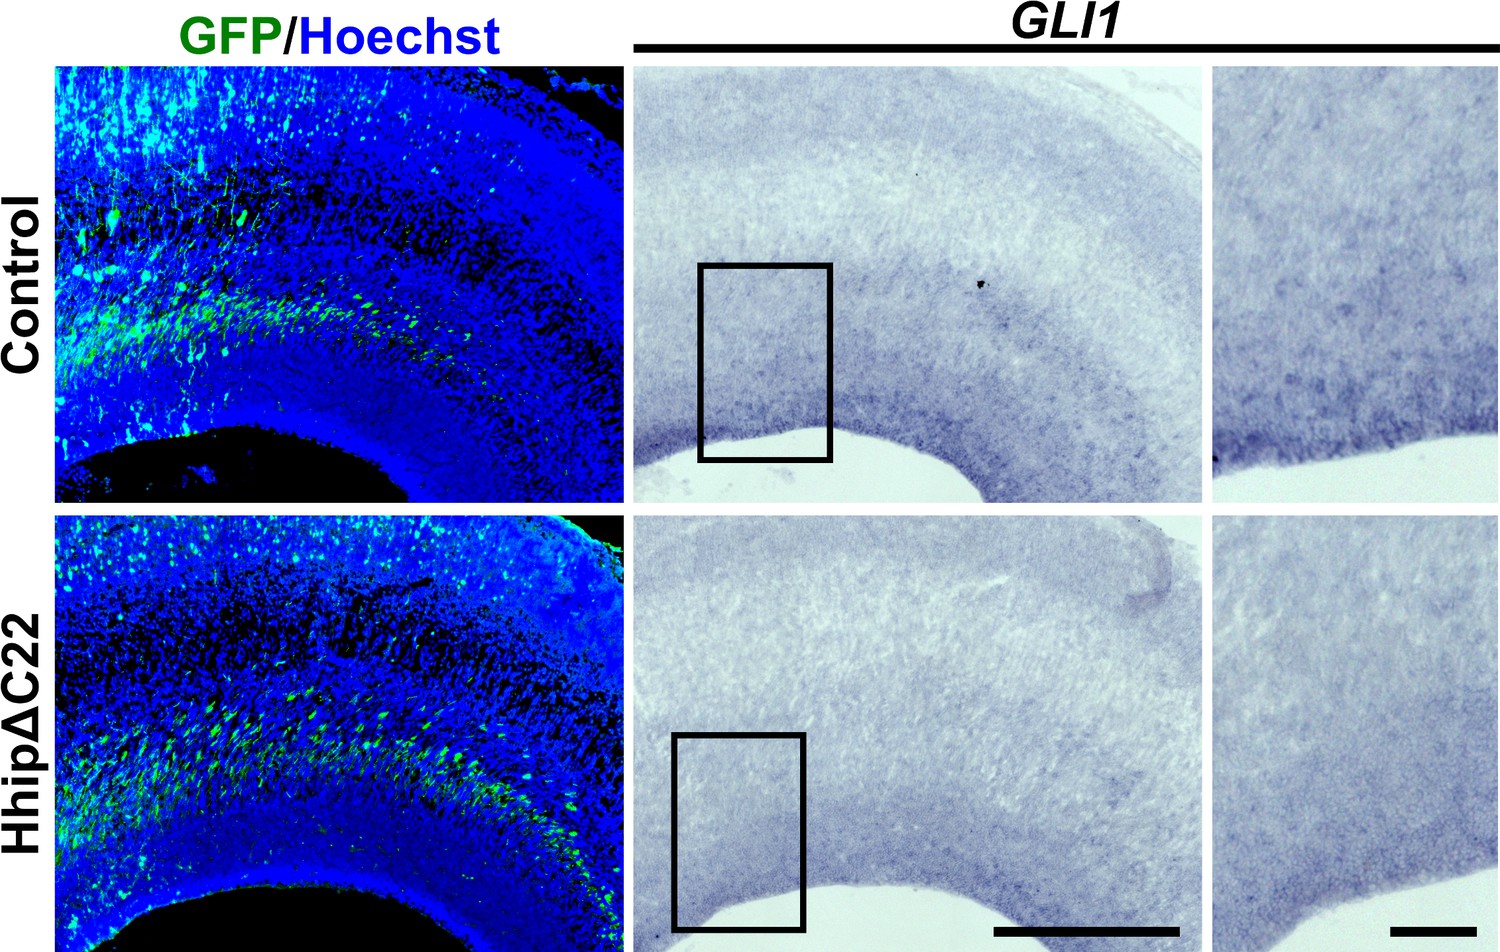
HhipΔC22 electroporation inhibits Shh signaling in the developing ferret cerebral cortex.
pCAG-EGFP plus either pCAG-HhipΔC22 or pCAG control vector was electroporated at E33, and the ferret brains were dissected at P1. Sections were subjected to in situ hybridization for GLI1, immunohistochemistry with anti-GFP antibody and Hoechst 33342 staining. Boxed areas are magnified in the right panels. Note that GLI1 signals were markedly suppressed by HhipΔC22. Scale bars = 500 μm (left) and 100 μm (right).
Figure 2—figure supplement 2
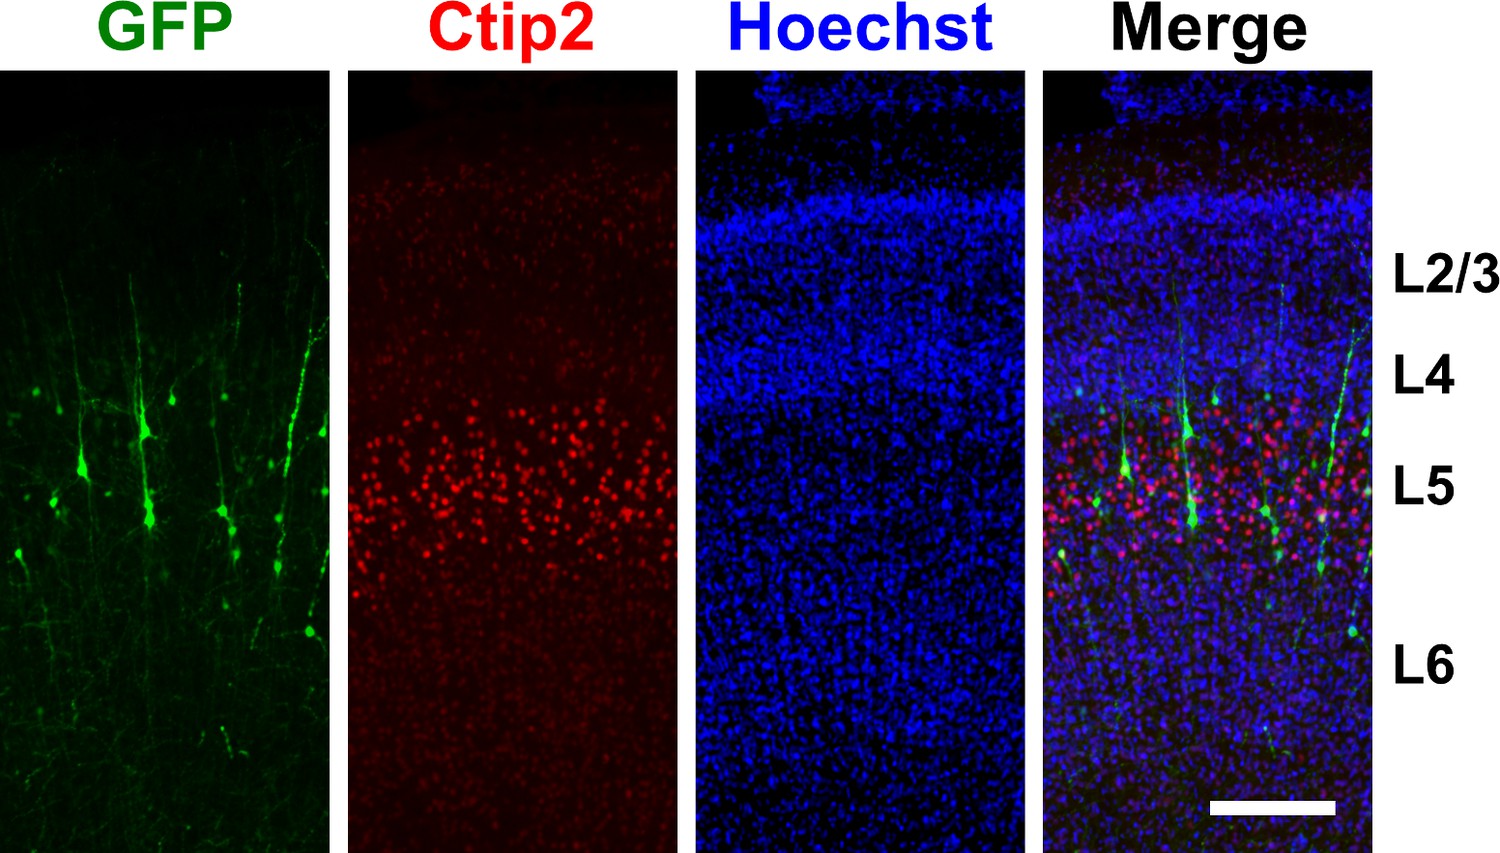
Distribution of GFP-positive cells in the ferret cerebral cortex.
pCAG-EGFP was electroporated at E33, and the brains were dissected at P16. Coronal sections of the cerebral cortex were stained with Hoechst 33342, anti-GFP antibody and anti-Ctip2 antibody. GFP-positive cells were mainly distributed in layer five in the GFP-transfected cerebral cortex. Scale bar = 200 μm.
Figure 3 with 1 supplement
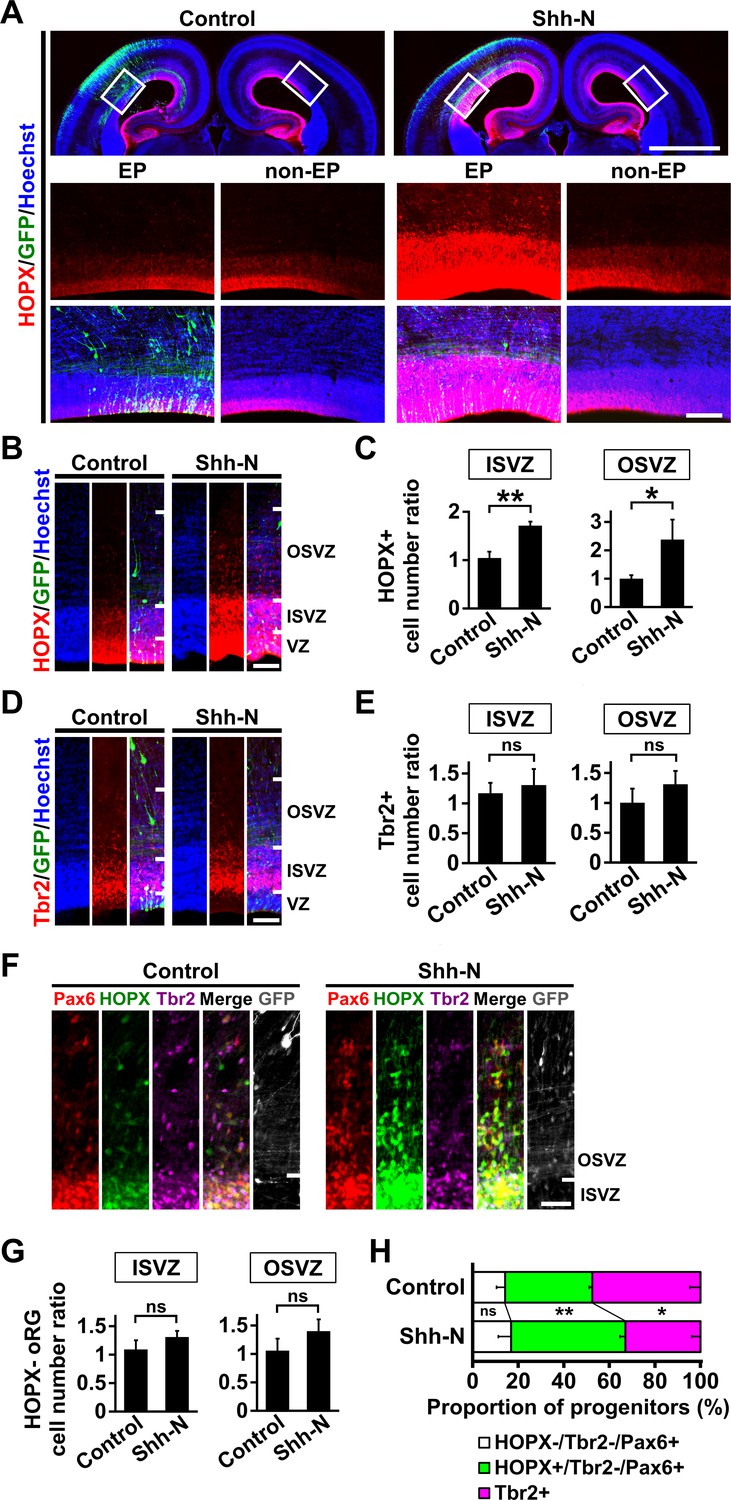
Activation of Shh signaling is sufficient to increase HOPX-positive oRG cells in the developing ferret cerebral cortex.
pCAG-EGFP plus either pCAG-Shh-N or pCAG control vector was electroporated at E33, and the brains were dissected at P1. (A) Coronal sections were stained with anti-HOPX antibody and Hoechst 33342. Boxed areas in the upper panels are magnified in the lower panels. HOPX-positive cells were markedly increased by Shh-N (Shh-N, EP). EP, electroporated side; non-EP, non-electroporated side. Scale bars = 2 mm (upper) and 200 μm (lower). (B) Magnified images of the germinal zone. Scale bar = 100 μm. (C) Quantification of HOPX-positive cells. The ratios of the numbers of HOPX-positive cells on the electroporated side relative to those on the non-electroporated side are shown. HOPX-positive cells were significantly increased by Shh-N. n = 3 animals for each condition. Bars present mean ± SD. *p<0.05, **p<0.01, Student's t-test. (D) The germinal zone stained with anti-Tbr2 antibody and Hoechst 33342. Scale bar = 100 μm. (E) Quantification of Tbr2-positive cells. The ratios of the numbers of Tbr2-positive cells on the electroporated side relative to those on the non-electroporated side are shown. n = 3 animals for each condition. Bars present mean ± SD. ns, not significant. Student's t-test. (F) Sections were triple-stained with anti-HOPX, anti-Tbr2 and anti-Pax6 antibodies. Scale bar = 50 μm. (G) Quantification of HOPX-negative oRG cells (Pax6-positive, Tbr2-negative and HOPX-negative). The ratios of the numbers of HOPX-negative oRG cells on the electroporated side relative to those on the non-electroporated side are shown. n = 3 animals for each condition. Bars present mean ± SD. ns, not significant. Student's t-test. (H) Proportions of HOPX-positive oRG cells (green), HOPX-negative oRG cells (white) and IP cells (magenta). HOPX-positive oRG cells were selectively increased by Shh-N. n = 3 animals for each condition. Bars present mean ± SD. ns, not significant. *p<0.05, **p<0.01, Student's t-test.
Figure 3—figure supplement 1
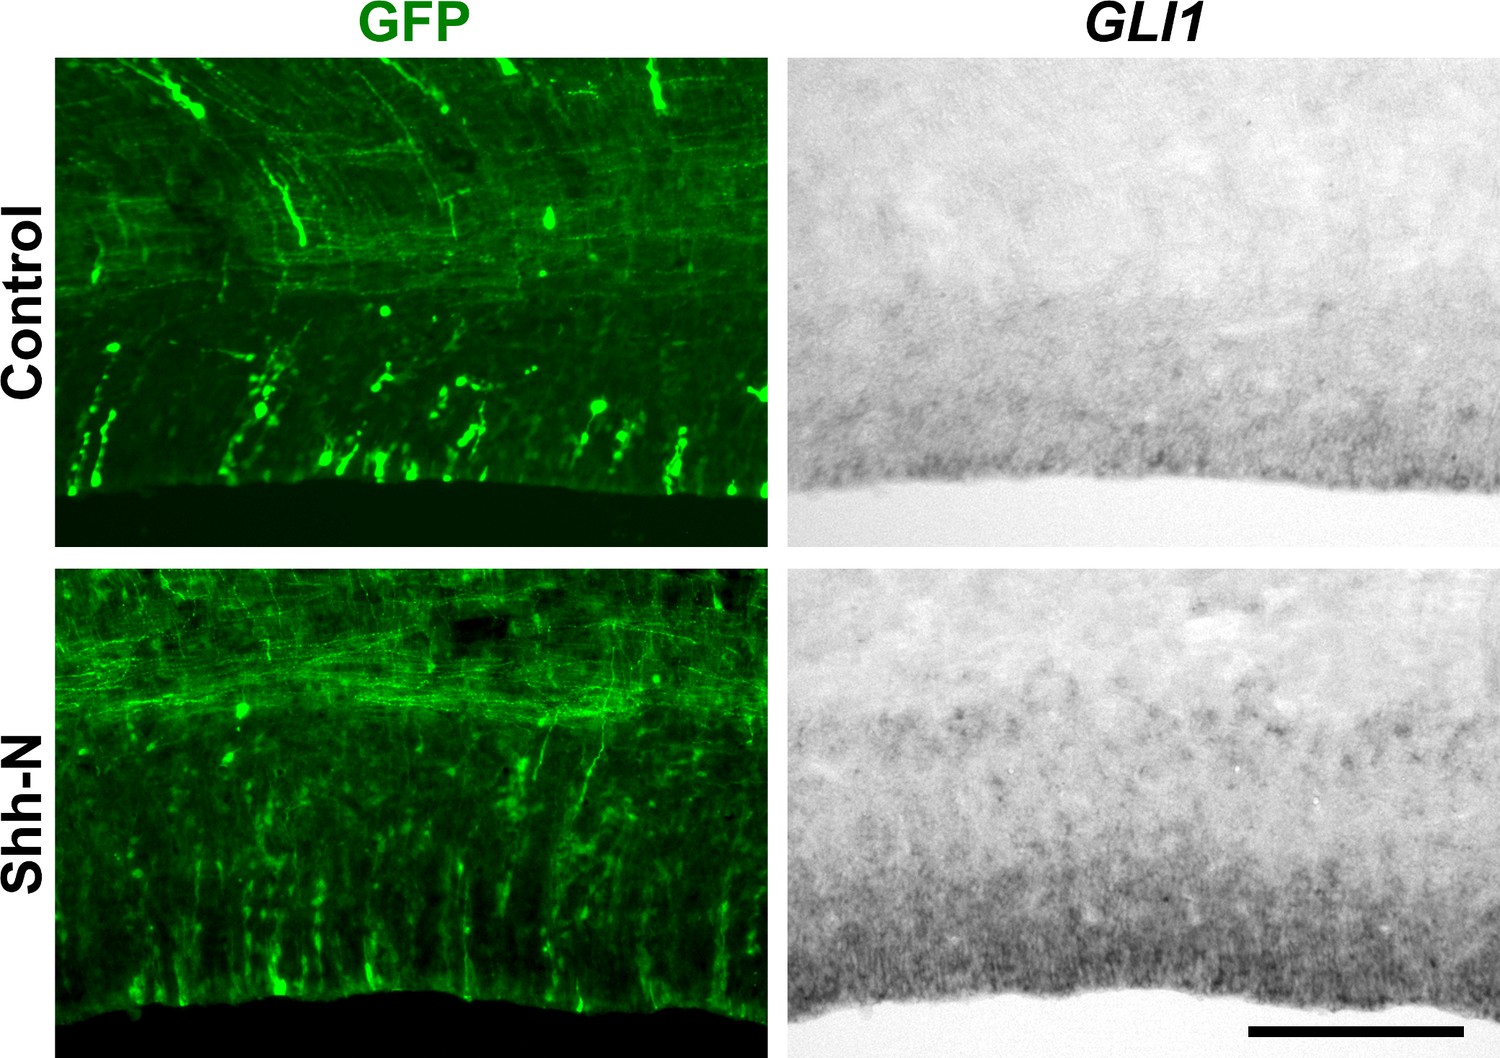
Shh-N electroporation activates Shh signaling in the ferret cerebral cortex.
pCAG-EGFP plus either pCAG-Shh-N or pCAG control vector was electroporated at E33, and the brains were dissected at P1. Sections were subjected to in situ hybridization for GLI1 and immunohistochemistry with anti-GFP antibody. Shh-N-electroporated brains showed striking increases in GLI1 signals. Scale bar = 200 μm.
Figure 4 with 2 supplements
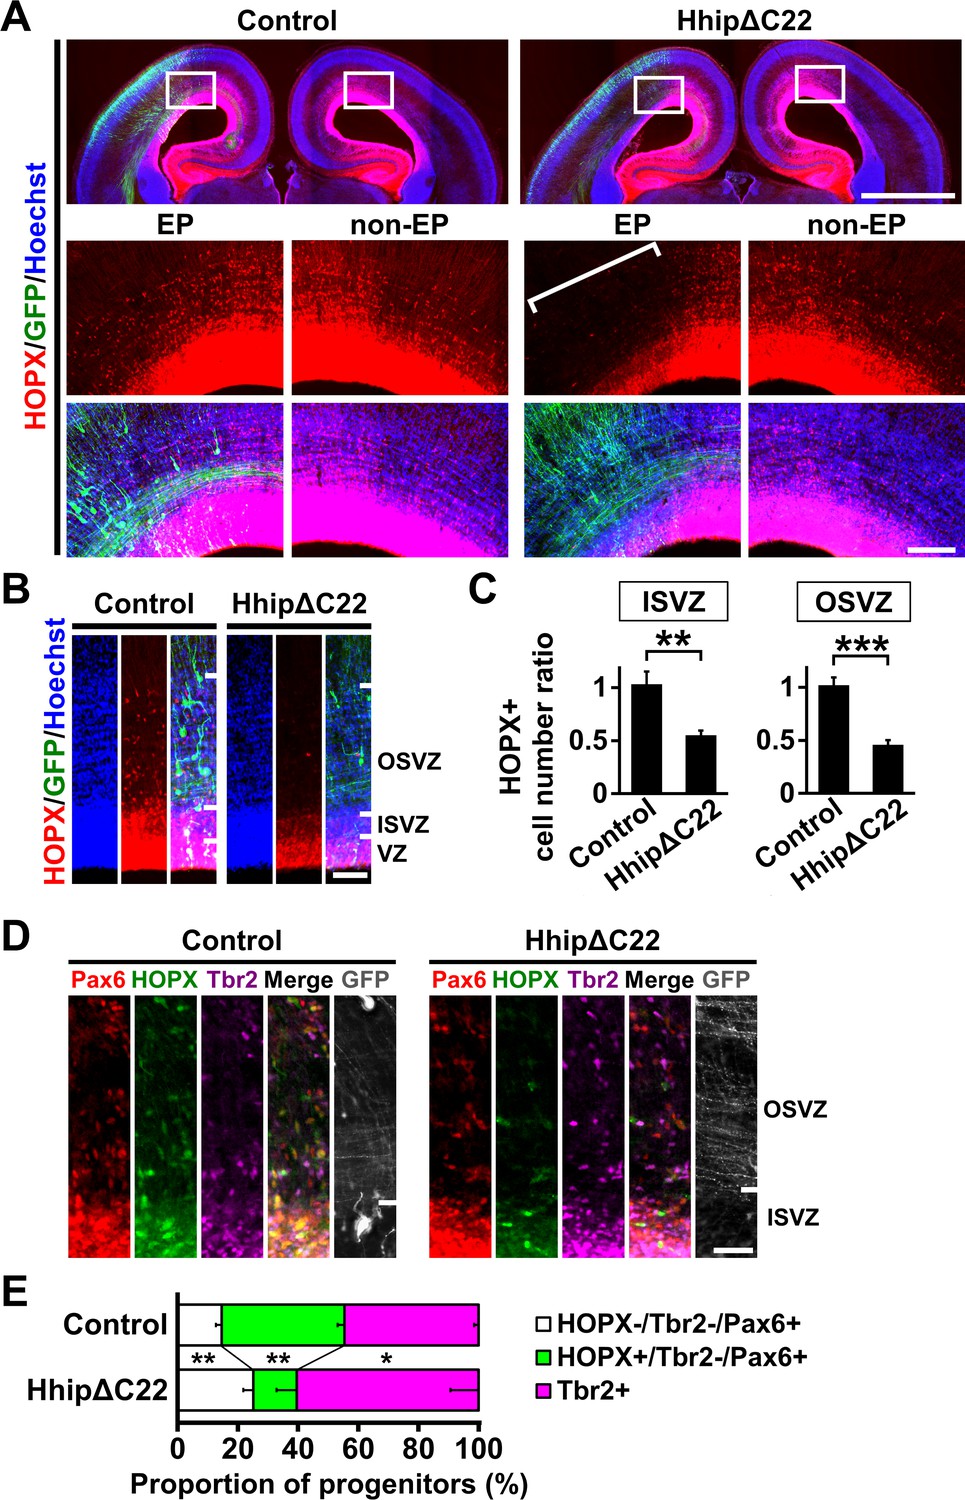
Shh signaling is required for producing HOPX-positive oRG cells in the developing ferret cerebral cortex.
pCAG-EGFP plus either pCAG-HhipΔC22 or pCAG control vector was electroporated at E33, and the brains were dissected at P1. (A) Coronal sections were stained with anti-HOPX antibody and Hoechst 33342. Boxed areas of the upper panels are magnified in the lower panels. HOPX-positive cells were markedly reduced by HhipΔC22 (HhipΔC22, EP, square bracket). EP, electroporated side; non-EP, non-electroporated side. Scale bars = 2 mm (upper panel) and 200 μm (lower panel). (B) Magnified images of the germinal zone. Scale bar = 100 μm. (C) Quantification of HOPX-positive cells. The ratios of the numbers of HOPX-positive cells on the electroporated side relative to those on the non-electroporated side are shown. HOPX-positive cells were significantly reduced by HhipΔC22. n = 3 animals for each condition. Bars present mean ± SD. **p<0.01, ***p<0.001, Student's t-test. (D) Sections were triple-stained with anti-HOPX, anti-Tbr2 and anti-Pax6 antibodies. Scale bar = 50 μm. (E) Proportions of HOPX-positive oRG cells (green), HOPX-negative oRG cells (white) and IP cells (magenta). HOPX-positive oRG cells were selectively reduced by HhipΔC22. n = 3 animals for each condition. Bars present mean ± SD. *p<0.05, **p<0.01, Student's t-test.
Figure 4—figure supplement 1
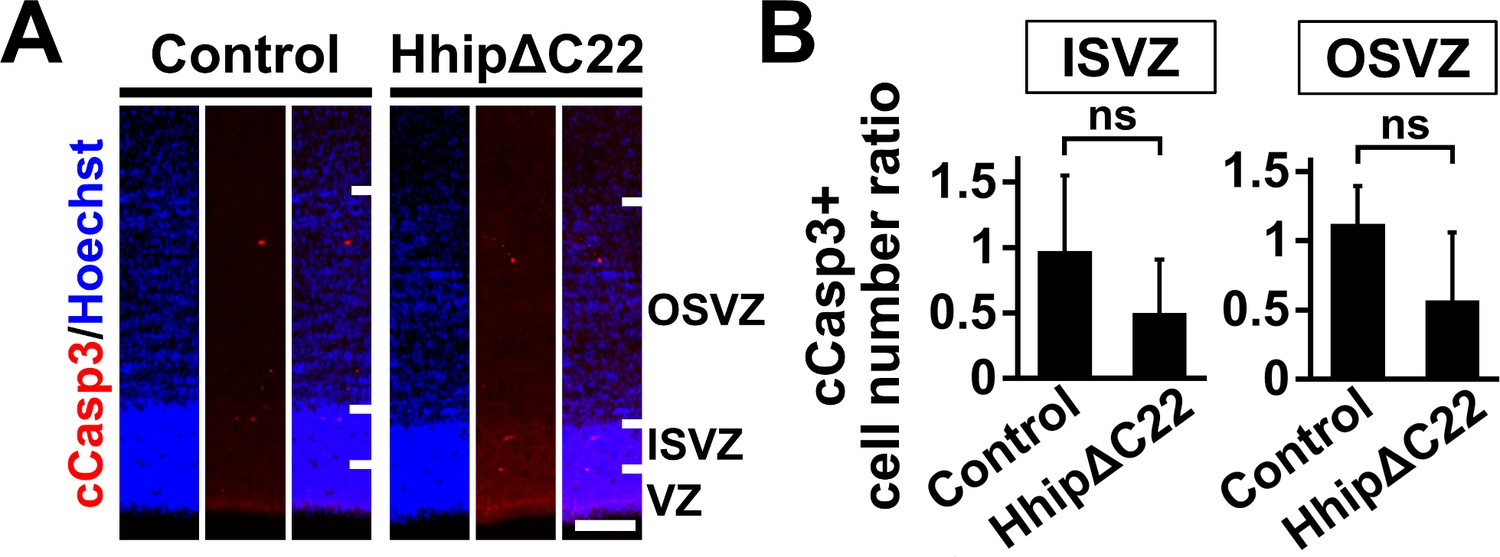
Inhibition of Shh signaling does not affect apoptosis in the germinal zone of the developing ferret cerebral cortex.
pCAG-EGFP plus either pCAG-HhipΔC22 or pCAG control vector was electroporated at E33, and the brains were dissected at P1. (A) Sections were stained with anti-cleaved caspase 3 (cCasp3) antibody and Hoechst 33342. Scale bars = 100 μm. (B) Quantification of cCasp3-positive cells in the ISVZ and the OSVZ. The numbers of immunopositive cells on the electroporated side were divided by those on the non-electroporated side. The numbers of cCasp3-positive cells were not affected by HhipΔC22. n = 3 animals for each condition. Bars present mean ± SD. ns, not significant. Student's t-test.
Figure 4—figure supplement 2
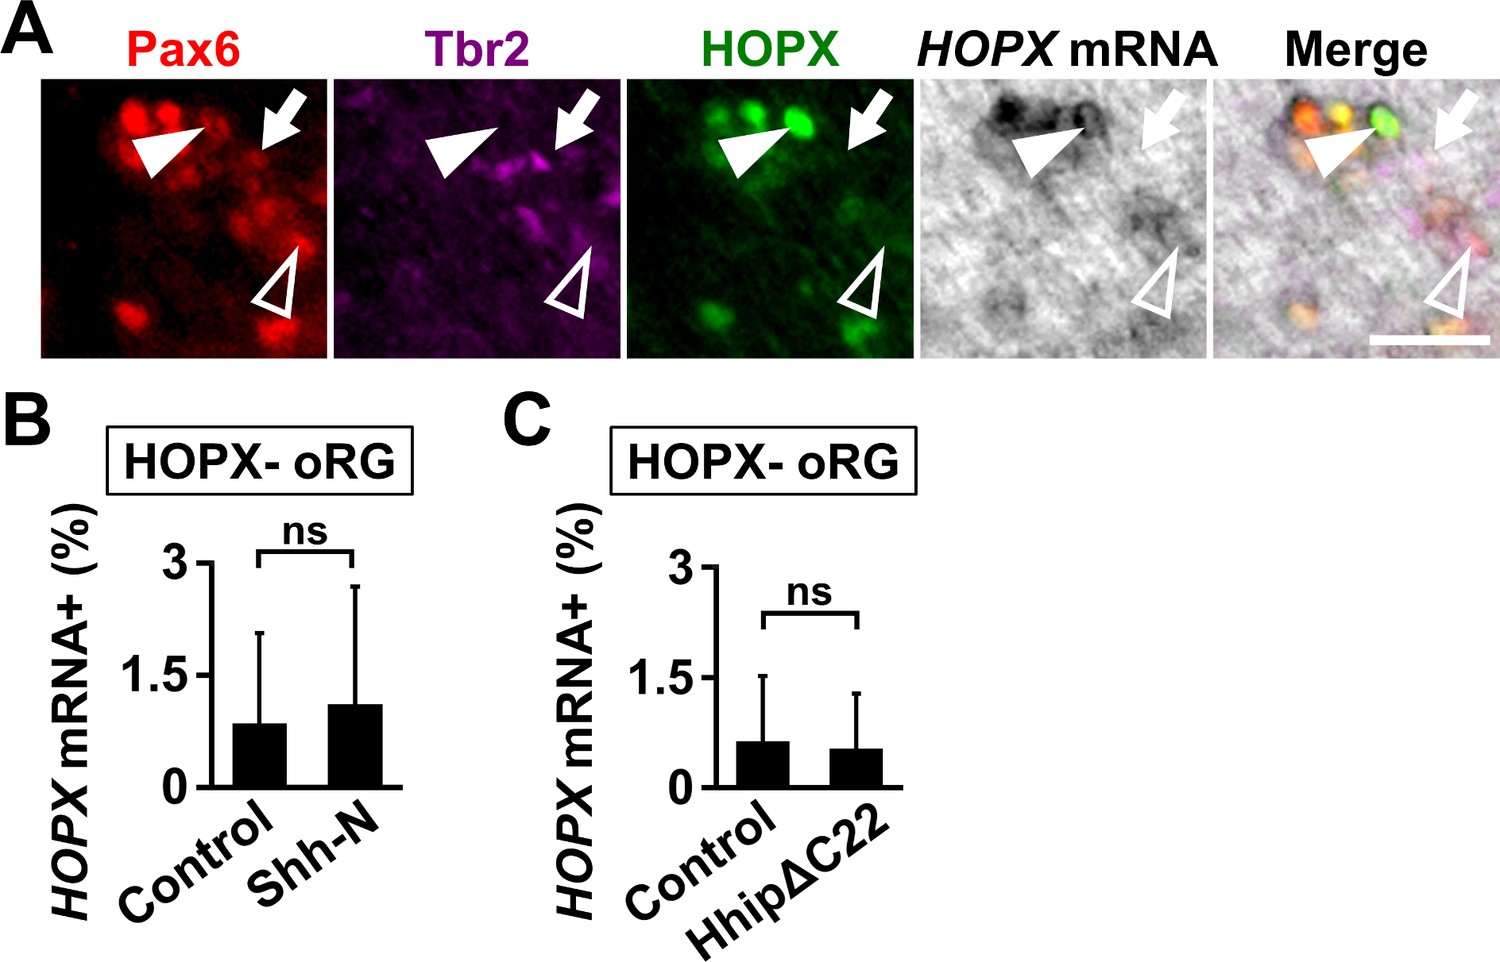
The effects of Shh signaling on the expression of HOPX mRNA in the HOPX-negative oRG cells.
(A) Coronal sections at P1 were subjected to in situ hybridization for HOPX mRNA and immunohistochemistry for Pax6, Tbr2 and HOPX. Arrows indicate HOPX-negative oRG cells which do not express HOPX mRNA. Open arrowheads and arrowheads indicate HOPX-negative oRG cells expressing HOPX mRNA and HOPX-positive oRG cells expressing HOPX mRNA, respectively. Scale bar = 20 μm. (B) The percentages of HOPX-negative oRG cells expressing HOPX mRNA in the OSVZ were not affected by Shh-N. pCAG-EGFP plus either pCAG control vector or pCAG-Shh-N was electroporated at E33, and the brains were dissected at P1. Sections were subjected to in situ hybridization for HOPX mRNA and immunohistochemistry for Pax6, Tbr2 and HOPX. n = 3 animals for each condition. Bars present mean ± SD. ns, not significant; Student's t-test. (C) The percentages of HOPX-negative oRG cells expressing HOPX mRNA in the OSVZ were not affected by HhipΔC22. pCAG-EGFP plus pCAG-HhipΔC22 was electroporated at E33, and the brains were dissected at P1. Sections were subjected to in situ hybridization for HOPX mRNA and immunohistochemistry for Pax6, Tbr2 and HOPX. n = 3 animals for each condition. Bars present mean ± SD. ns, not significant; Student's t-test.
Figure 5 with 3 supplements
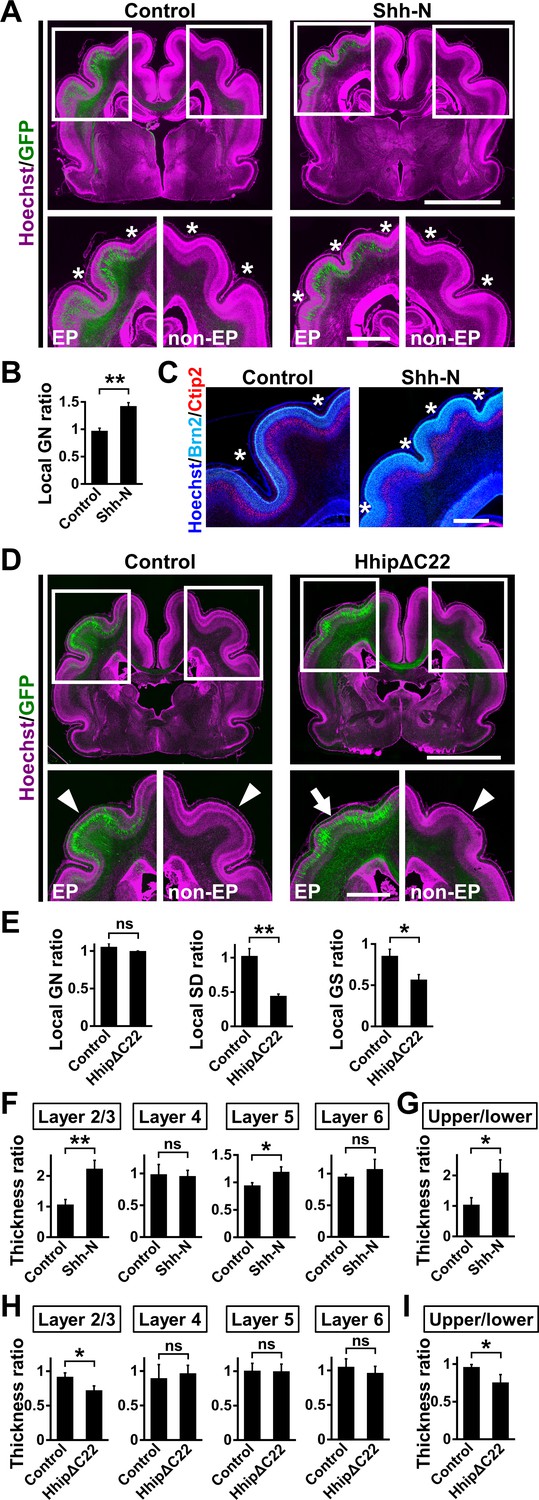
Shh signaling is necessary and sufficient for cortical folding in the ferret cerebral cortex.
(A–C) pCAG-EGFP plus either pCAG-Shh-N or pCAG control vector was electroporated at E33, and the brains were dissected at P16. (A) Coronal sections of the electroporated brains were stained with anti-GFP antibody and Hoechst 33342 (magenta). Boxed areas in the upper panels are magnified in the lower panels. Asterisks indicate the positions of sulci. The number of sulci was increased in the Shh-N-transfected GFP-positive area (Shh, EP). EP, electroporated side; non-EP, non-electroporated side. Scale bars = 5 mm (upper) and 2 mm (lower). (B) Quantification of the number of cortical folds. The local GN ratio was significantly increased by Shh-N. n = 3 animals for control, n = 4 animals for Shh. Bars present mean ± SEM. **p<0.01, Student's t-test. (C) Coronal sections of the electroporated brains were stained with anti-Brn2 (cyan) and anti-Ctip2 (red) antibodies and Hoechst 33342 (blue). Cortical layer structures were preserved in the Shh-N-electroporated area of the cerebral cortex. Asterisks indicate the positions of sulci. Scale bar = 1 mm. (D, E) pCAG-EGFP plus either pCAG-HhipΔC22 or pCAG control vector was electroporated at E33, and the brains were dissected at P16. (D) Coronal sections of the electroporated brains were stained with anti-GFP antibody and Hoechst 33342 (magenta). Cortical folding was markedly suppressed in the HhipΔC22-transfected GFP-positive area (HhipΔC22, EP, arrow). Arrowheads indicate cortical folds in the control cortex and in the non-electroporated side of the cortex. EP, electroporated side; non-EP, non-electroporated side. Scale bars = 5 mm (upper) and 2 mm (lower). (E) Quantification of cortical folding. The local SD ratio and the local GS ratio were significantly smaller in HhipΔC22-transfected samples. n = 3 animals for each condition. Bars present mean ± SEM. ns, not significant. *p<0.05,**p<0.01, Student's t-test. (F, G) pCAG-EGFP plus either pCAG-Shh-N or pCAG control vector was electroporated at E33, and the brains were dissected at P16. Coronal sections were subjected to Hoechst 33342 staining plus immunohistochemistry for Ctip2 and Brn2. (F) Quantification of the thicknesses of layer 2/3, layer 4, layer 5 and layer 6. The ratios of the thicknesses of the electroporated side relative to those of the non-electroporated side are shown. Note that the thickness of layer 2/3 was markedly increased by Shh-N. (G) Ratio of upper layer thickness (layer 2/3) to lower layer thickness (layer 4–6). n = 3 animals for each condition. Bars present mean ± SD. *p<0.05, **p<0.01; ns, not significant; Student's t-test. (H, I) pCAG-EGFP plus either pCAG-HhipΔC22 or pCAG control vector was electroporated at E33, and the brains were dissected at P16. Coronal sections were subjected to Hoechst 33342 staining plus immunohistochemistry for Ctip2 and Brn2. (H) Quantification of the thicknesses of layer 2/3, layer 4, layer 5 and layer 6. The ratios of the thicknesses of the electroporated side relative to those of the non-electroporated side are shown. Note that the thickness of layer 2/3 was selectively reduced by HhipΔC22. (I) The ratio of upper layer thickness (layer 2/3) to lower layer thickness (layer 4–6). n = 3 animals for each condition. Bars present mean ± SD. *p<0.05; ns, not significant; Student's t-test.
Figure 5—figure supplement 1
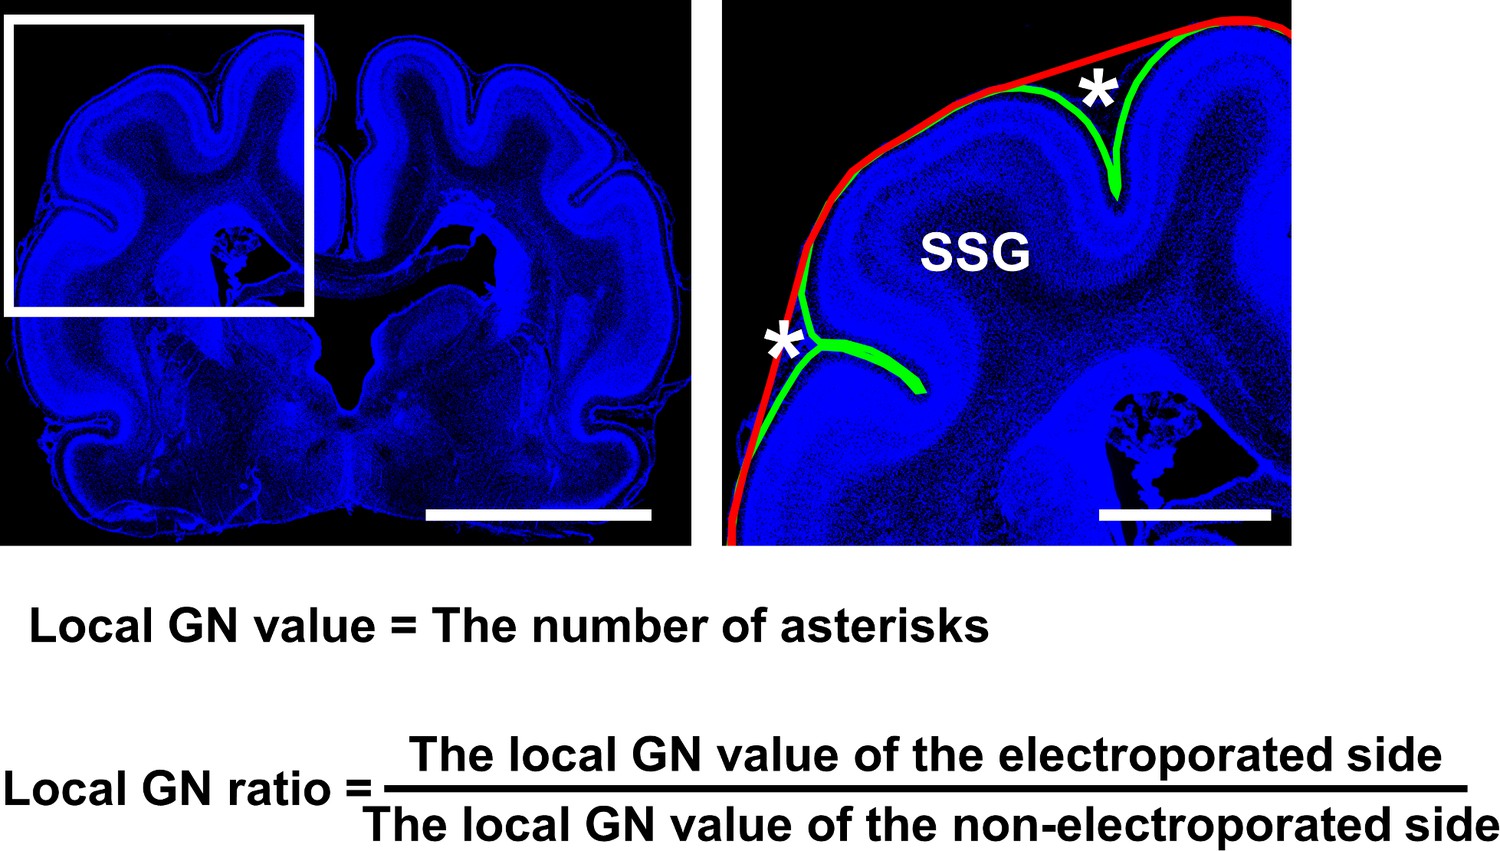
Definition of the local gyrification number (GN) ratio.
Coronal sections containing the suprasylvian gyrus (SSG) were stained with Hoechst 33342 (blue). (Left) A lower magnification image. (Right) A magnified image of the boxed area in the lower-magnification image. We counted how many times the complete contour (green line) was detached from the outer contour (red line) in the electroporated area (local GN value) (right panel, asterisks). To minimize variation of the local GN values depending on the positions of coronal sections in the brain, the local GN value on the electroporated side and that on the contralateral non-electroporated side of the cerebral cortex in the same brain section was calculated, and the former was divided by the latter (local GN ratio). The local GN ratio would be one if the number of sulci was the same between the electroporated side and the non-electroporated side, and would be higher than one if the number of sulci was increased by genetic manipulation. Scale bars = 5 mm (left) and 2 mm (right).
Figure 5—figure supplement 2
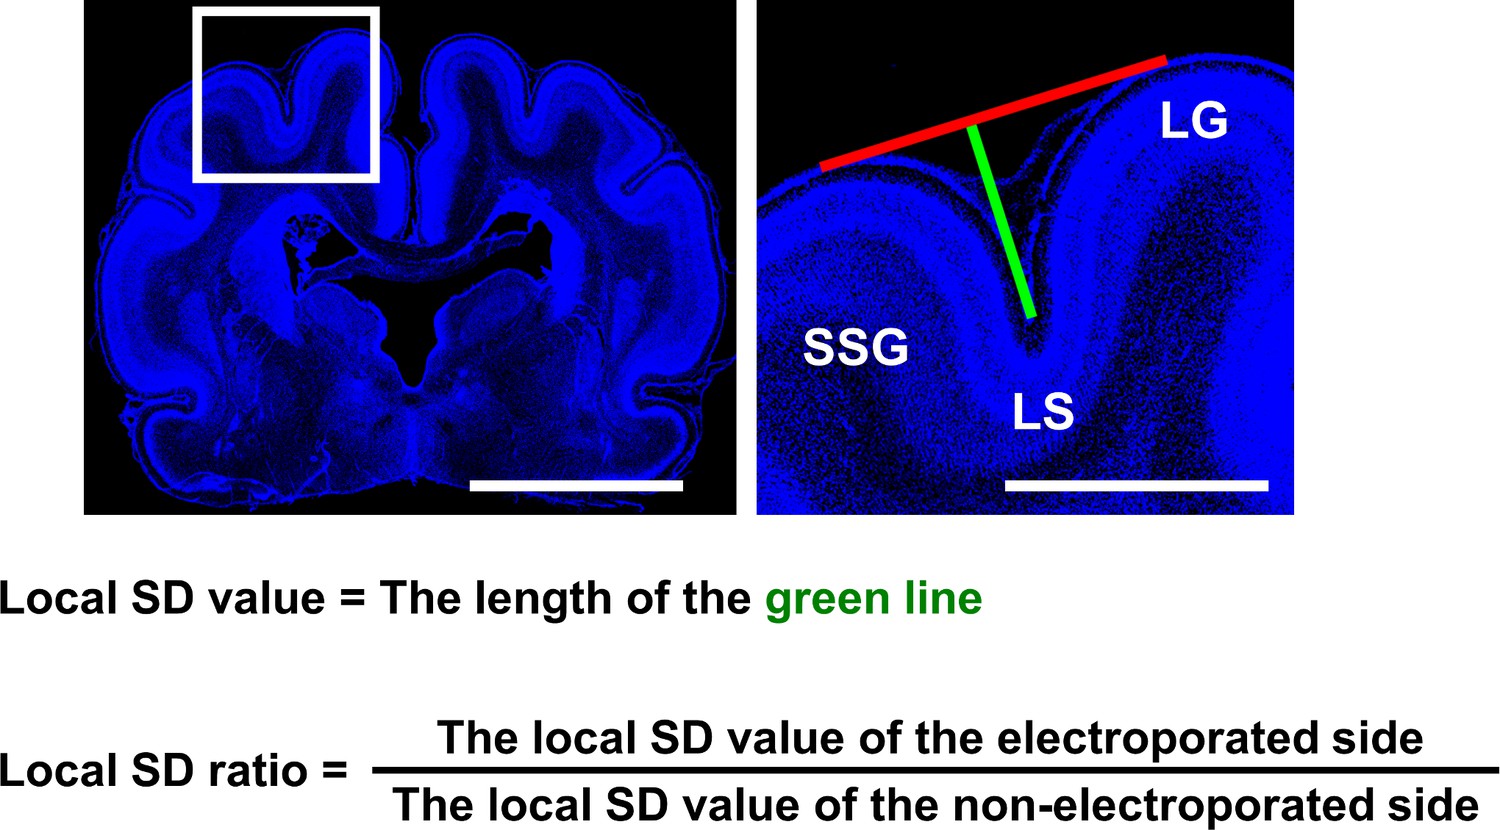
Definition of the local sulcus depth (SD) ratio.
Coronal sections containing the suprasylvian gyrus (SSG) were stained with Hoechst 33342 (blue). (Left) Lower-magnification image. (Right) Magnified image of the boxed area in the lower-magnification image. A line connecting the top of the SSG and that of the lateral gyrus (LG) was drawn (red line). A green line connecting the bottom of the lateral sulcus (LS) and the red line was drawn perpendicular to the red line. The length of the green line was used as the local SD value. To minimize variation of the local SD values depending on the positions of coronal sections in the brain, the local SD value on the electroporated side and that on the contralateral non-electroporated side of the cerebral cortex in the same brain section were measured, and the former was divided by the latter (local SD ratio). The local SD ratio would be one if the depth of the LS was the same between the electroporated side and the non-electroporated side, and would be smaller than one if cortical folding was inhibited by genetic manipulation. Scale bars = 5 mm (left) and 2 mm (right).
Figure 5—figure supplement 3
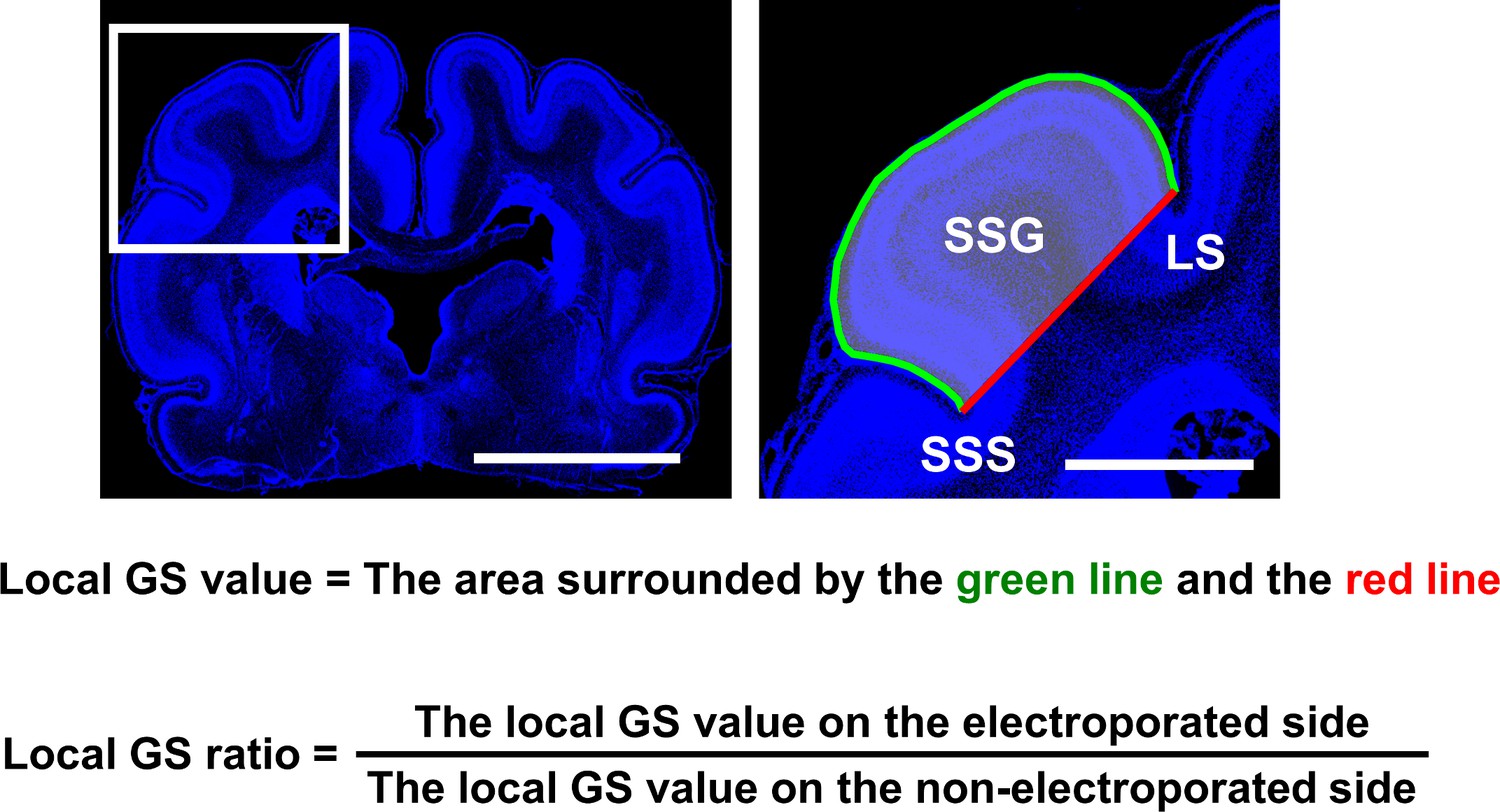
Definition of the local gyrus size (GS) ratio.
Coronal sections containing the suprasylvian gyrus (SSG) were stained with Hoechst 33342 (blue). (Left) Lower-magnification image. (Right) Magnified image of the boxed area of the lower-magnification image. The area surrounded by the brain surface (green line) and the red line connecting the bottom of the suprasylvian sulcus (SSS) and the bottom of the lateral sulcus (LS) was measured (local GS value). To minimize variation of the local GS values depending on the positions of coronal sections in the brain, the local GS value on the electroporated side and that on the contralateral non-electroporated side of the cerebral cortex in the same brain section were measured, and the former was divided by the latter (local GS ratio). The local GS ratio would be one if the size of the SSG was the same between the electroporated side and the non-electroporated side, and would be smaller than one if cortical folding was inhibited by genetic manipulation. Scale bars = 5 mm (left) and 2 mm (right).
Figure 6
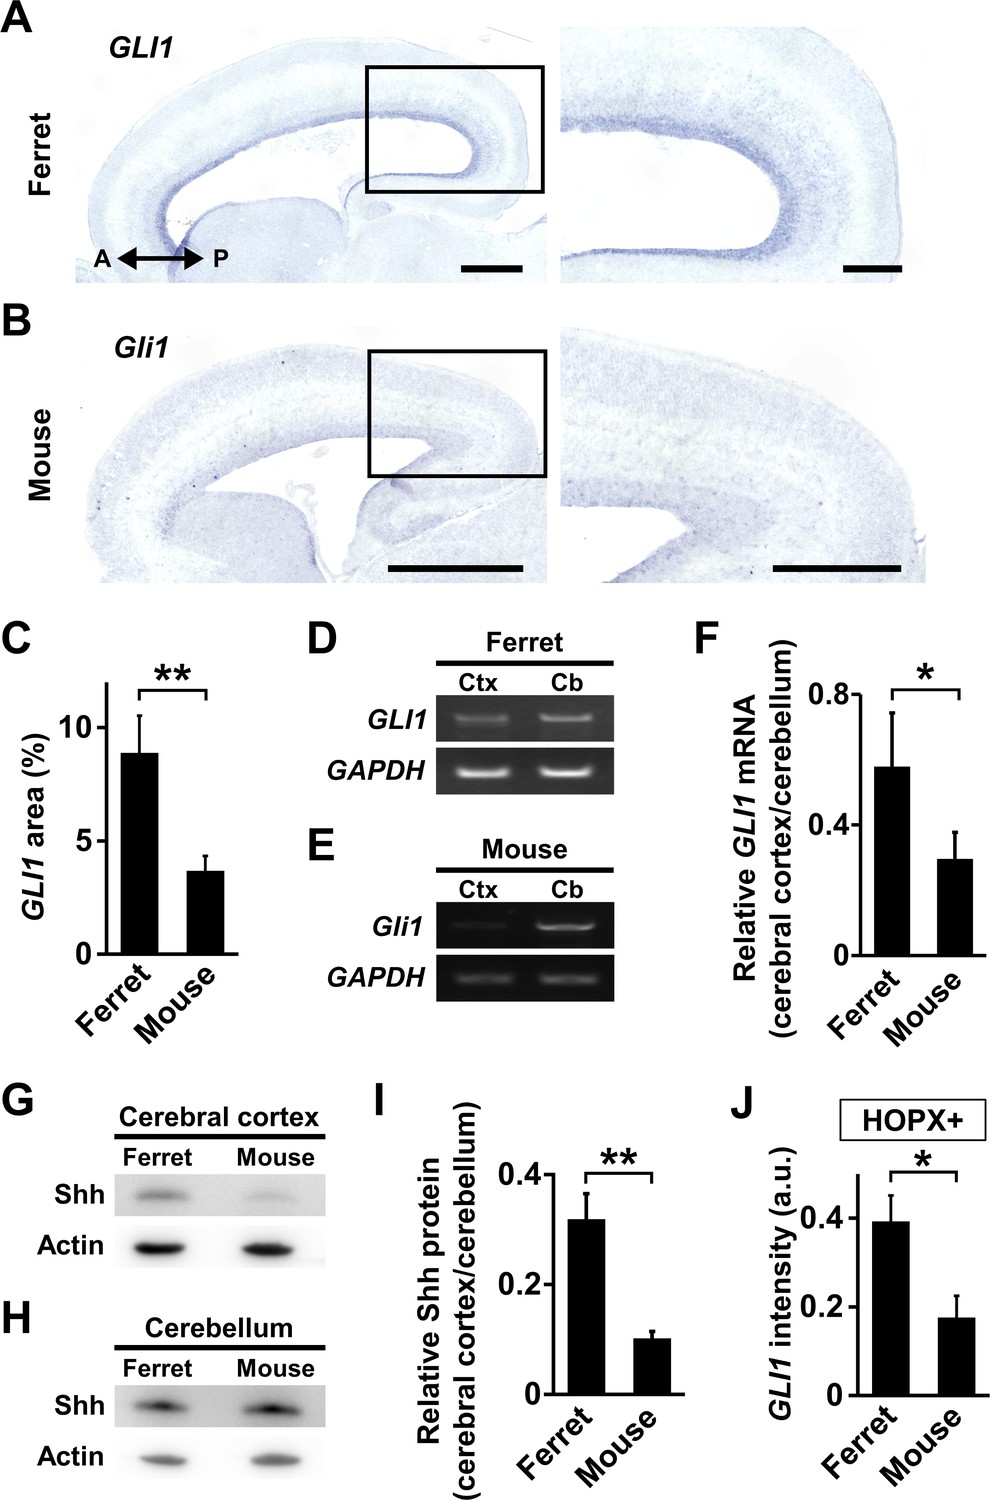
Shh signaling is more activated in the cerebral cortex of ferrets than that of mice.
(A, B) GLI1 expression in the developing ferret and mouse cerebral cortex. Sagittal sections of the ferret brain at P1 (A) and the mouse brain at E17 (B) were subjected to in situ hybridization for ferret GLI1 and mouse Gli1, respectively. The areas within the boxes in the left panels are magnified in the right panels. Scale bars = 1 mm (left), 500 μm (right). (C) Percentages of GLI1-positive areas in the germinal zones of ferret and mouse cerebral cortex. n = 3 animals. Bars present mean ± SD. **p<0.01, Student's t-test. .(D) RT-PCR for GLI1 and GAPDH in the cerebral cortex (Ctx) and the cerebellum (Cb) of ferrets at P1. (E) RT-PCR for Gli1 and GAPDH in the cerebral cortex (Ctx) and the cerebellum (Cb) of mice at E17. (F) Quantification of GLI1 mRNA levels in the cerebral cortex of mice and ferrets. GLI1 signal intensities from RT-PCR were measured, and GLI1 expression levels in the cerebral cortex were normalized with those in the cerebellum. n = 3 animals. Bars present mean ± SD.*p<0.05, Student's t-test. (G) Immunoblotting for Shh in the cerebral cortex of mice at E17 and ferrets at P1. (H) Immunoblotting for Shh in the cerebellum of mice at E17 and ferrets at P1. (I) Quantification of Shh protein levels in the cerebral cortex of mice and ferrets. Shh signal intensities on immunoblots were measured, and Shh signal intensities in the cerebral cortex were normalized with those in the cerebellum. n = 3 animals. Bars present mean ± SD.**p<0.01, Student's t-test. (J) Quantification of GLI1 signal intensity in each HOPX-positive cell in the germinal zone of the mouse and ferret cerebral cortex. Sagittal sections of the ferret brain at P1 and the mouse brain at E17 were subjected to in situ hybridization for ferret GLI1 and mouse Gli1, respectively, and to immunohistochemistry for HOPX. The average values of GLI1 and Gli1 signal intensities in the germinal zone were normalized with the corresponding values in the external granule layer of the cerebellum in the same sagittal sections. n = 3 animals for each condition. Bars present mean ± SEM.*p<0.05, Student's t-test. a.u., arbitrary units.
Tables
Key resources table
| Reagent type (species) or resource | Designation | Source or reference | Identifiers | Additional information |
|---|---|---|---|---|
| Antibody | Anti-GFP (rat monoclonal) | Nacalai tesque, Japan | Cat# 440426; RRID:AB_2313652 | IF(1:2000) |
| Antibody | Anti-GFP (rabbit polyclonal) | Medical and Biological Laboratories, Japan | Cat# 598; RRID:AB_591819 | IF(1:2500) |
| Antibody | Anti-Ctip2 (rat monoclonal) | Abcam | Cat# ab18465; RRID:AB_2064130 | IF(1:1000) |
| Antibody | Anti-Brn2 (goat polyclonal) | Santa Cruz Biotechnology | Cat# sc-6029; RRID:AB_2167385 | IF(1:150) |
| Antibody | Anti-Hop (mouse monoclonal) | Santa Cruz Biotechnology | Cat# sc-398703; RRID:AB_2687966 | IF(1:500) |
| Antibody | Anti-Hopx (rabbit polyclonal) | Atlas Antibodies | Cat# HPA030180; RRID:AB_10603770 | IF(1:1000) |
| Antibody | Anti-Tbr2 (sheep polyclonal) | R&D Systems | Cat# AF6166; RRID:AB_ 10569705 | IF(1:100) |
| Antibody | Anti-Tbr2 (rabbit polyclonal) | Abcam | Cat# ab23345; RRID:AB_778267 | IF(1:200) |
| Antibody | Anti-Pax6 (rabbit polyclonal) | Millipore | Cat# AB2237; RRID:AB_1587367 | IF(1:1000) |
| Antibody | Anti-Ki67(rat monoclonal) | Thermo Fisher Scientific | Cat# 14-5698-80; RRID:AB_10853185 | IF(1:200) |
| Antibody | Anti-cleaved caspase 3 (rabbit monoclonal) | BD Pharmingen | Cat# 559565; RRID:AB_397274 | IF(1:300) |
| Antibody | Anti-Shh (rabbit monoclonal) | Cell Signaling Technology | Cat# 2207; RRID:AB_2188191 | WB(1:2500) |
| Antibody | Anti-ß-actin (mouse monoclonal) | Sigma-Aldrich | Cat# A5441; RRID:AB_476744 | WB(1:30000) |
| Antibody | Alkaline phosphatase- conjugated anti-digoxigenin | Roche | Cat# 11093274910; RRID:AB_514497 | ISH(1:2500) |
| Recombinant DNA reagent | pCAG-EGFP (plasmid) | PMID:20181605 | N/A | N/A |
| Recombinant DNA reagent | pCAG control (plasmid) | PMID:26482531 | N/A | N/A |
| Recombinant DNA reagent | pCX-Shh-N (plasmid) | PMID:12112459 | N/A | N/A |
| Recombinant DNA reagent | pCAG-Shh-N (plasmid) | This paper | N/A | N/A |
| Recombinant DNA reagent | pCAGGS-HhipΔC22 (plasmid) | PMID:27558761 | N/A | N/A |
| Recombinant DNA reagent (Mus musculus) | pCRII-mouse Gli1 (plasmid) | This paper (our group) | N/A | vector: pCRII;cDNA fragment: mouse Gli1. |
| Recombinant DNA reagent (Mustela putorius furo) | pCRII-ferret GLI1 (plasmid) | This paper (our group) | N/A | vector: pCRII;cDNA fragment: ferret GLI1. |
| Sequence- based reagent (Mus musculus) | Mouse Gli1 forward (primer) | This paper (our group) | N/A | ctctgcttacacagtcagccgcagg |
| Sequence- based reagent (Mus musculus) | Mouse Gli1 reverse (primer) | This paper (our group) | N/A | cccatccctgggcacctcatgtagc |
| Sequence- based reagent (Mustela putorius fur) | Ferret GLI1 forward (primer) | This paper (our group) | N/A | gcatcagctcagcctataccgtc |
| Sequence- based reagent (Mustela putorius fur) | Ferret GLI1 reverse (primer) | This paper (our group) | N/A | tctggctcctcctcccaacttct |
| Sequence- based reagent (Mustela putorius fur) | Ferret HOPX forward (primer) | This paper (our group) | N/A | ctgtcgccagctctgtaagaggcag |
| Sequence- based reagent (Mustela putorius fur) | Ferret HOPX reverse (primer) | This paper (our group) | N/A | tcacttggtcttcggccagttggag |
| Sequence- based reagent (Mustela putorius fur) | GAPDH forward (primer) | This paper (our group) | N/A | gaccacagtccatgccatcact |
| Sequence- based reagent (Mustela putorius fur) | GAPDH reverse (primer) | This paper (our group) | N/A | tccaccaccctgttgctgtag |
| Commercial assay or kit | Click-iT EdU Alexa Fluor 647 Imaging Kit | Thermo Fisher Scientific | C10340 | N/A |
| Commercial assay or kit | Click-iT Plus Alexa Fluor 488 picolyl Azide Tool Kit | Thermo Fisher Scientific | C10641 | N/A |
| Software, algorithm | FIJI/ImageJ | http://fiji.sc | RRID:SCR_002285 | N/A |
| Software, algorithm | Multi Gauge | Fujifilm | RRID:SCR_014299 | N/A |
Additional files
-
Supplementary file 1
Data sets for quantification.
- https://cdn.elifesciences.org/articles/54873/elife-54873-supp1-v1.xlsx
-
Transparent reporting form
- https://cdn.elifesciences.org/articles/54873/elife-54873-transrepform-v1.docx
Download links
A two-part list of links to download the article, or parts of the article, in various formats.
Downloads (link to download the article as PDF)
Open citations (links to open the citations from this article in various online reference manager services)
Cite this article (links to download the citations from this article in formats compatible with various reference manager tools)
A discrete subtype of neural progenitor crucial for cortical folding in the gyrencephalic mammalian brain
eLife 9:e54873.
https://doi.org/10.7554/eLife.54873


