Brain functional networks associated with social bonding in monogamous voles
- Instituto de Neurobiología, Universidad Nacional Autónoma de México, Mexico
- Silvio O Conte Center for Oxytocin and Social Cognition, Center for Translational Social Neuroscience, Yerkes National Primate Research Center, Department of Psychiatry and Behavioral Sciences, Emory University, United States
- Escuela Nacional de Estudios Superiores, Unidad Juriquilla, Universidad Nacional Autónoma de México, Mexico
- Instituto Nacional de Perinatología Isidro Espinosa de los Reyes, Mexico
Figures
Figure 1 with 5 supplements
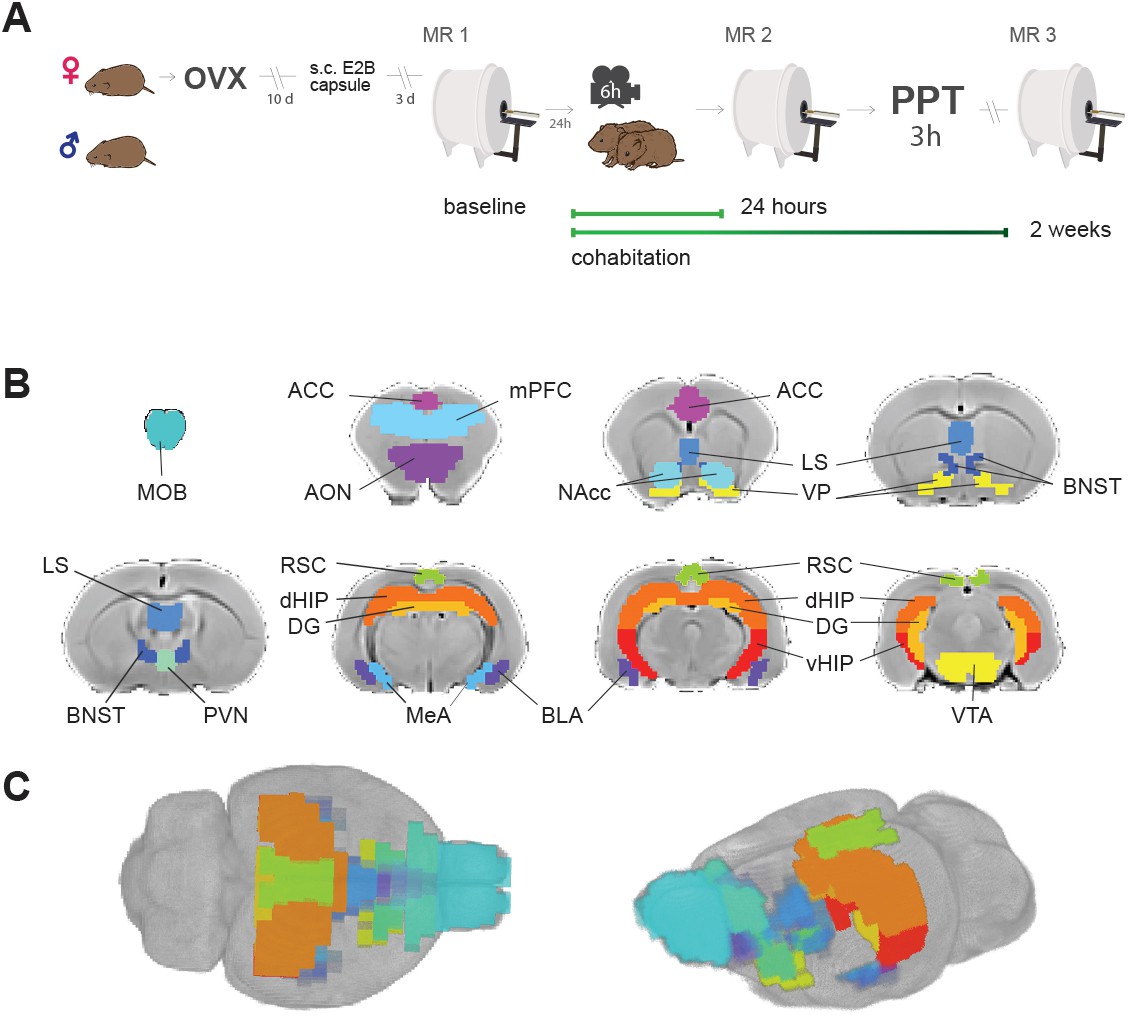
Experimental design and brain regions of interest.
(A) Sequence of experiments during a 30 day period: Female voles were bilaterally ovariectomized before MR and behavioral protocols. After being allowed to recover from surgery for 10 days, silastic capsules containing E2B (estradiol benzoate) were implanted via s.c. 4 days before cohabitation for sexual receptivity induction. Once couples went under cohabitation, they were housed together for the rest of the experiment and were only separated for PPT and MR scanning sessions. OVX: ovariectomy surgery. MR: magnetic resonance imaging scanning session. PPT: partner preference test. (B) Regions of interest (ROIs) for network functional connectivity analyses. Antero-posterior coronal slices of the prairie vole template overlayed with ROI masks with the resolution used in the analysis. Each color represents a different ROI. ACC: anterior cingulate cortex. AON: anterior olfactory nucleus. BLA: basolateral amygdala. BNST: bed nucleus of the stria terminalis. DG: dentate gyrus. dHIP: dorsal hippocampus. MeA: medial amygdala. MOB: main olfactory bulb. LS: lateral septum. mPFC: medial prefrontal cortex. NAcc: nucleus accumbens. PVN: paraventricular nucleus. RSC: retrosplenial cortex; VP: ventral pallidum. vHIP: ventral hippocampus. VTA: ventral tegmental area. (C) 3D views of ROI masks embedded within the prairie vole template.
Figure 1—figure supplement 1
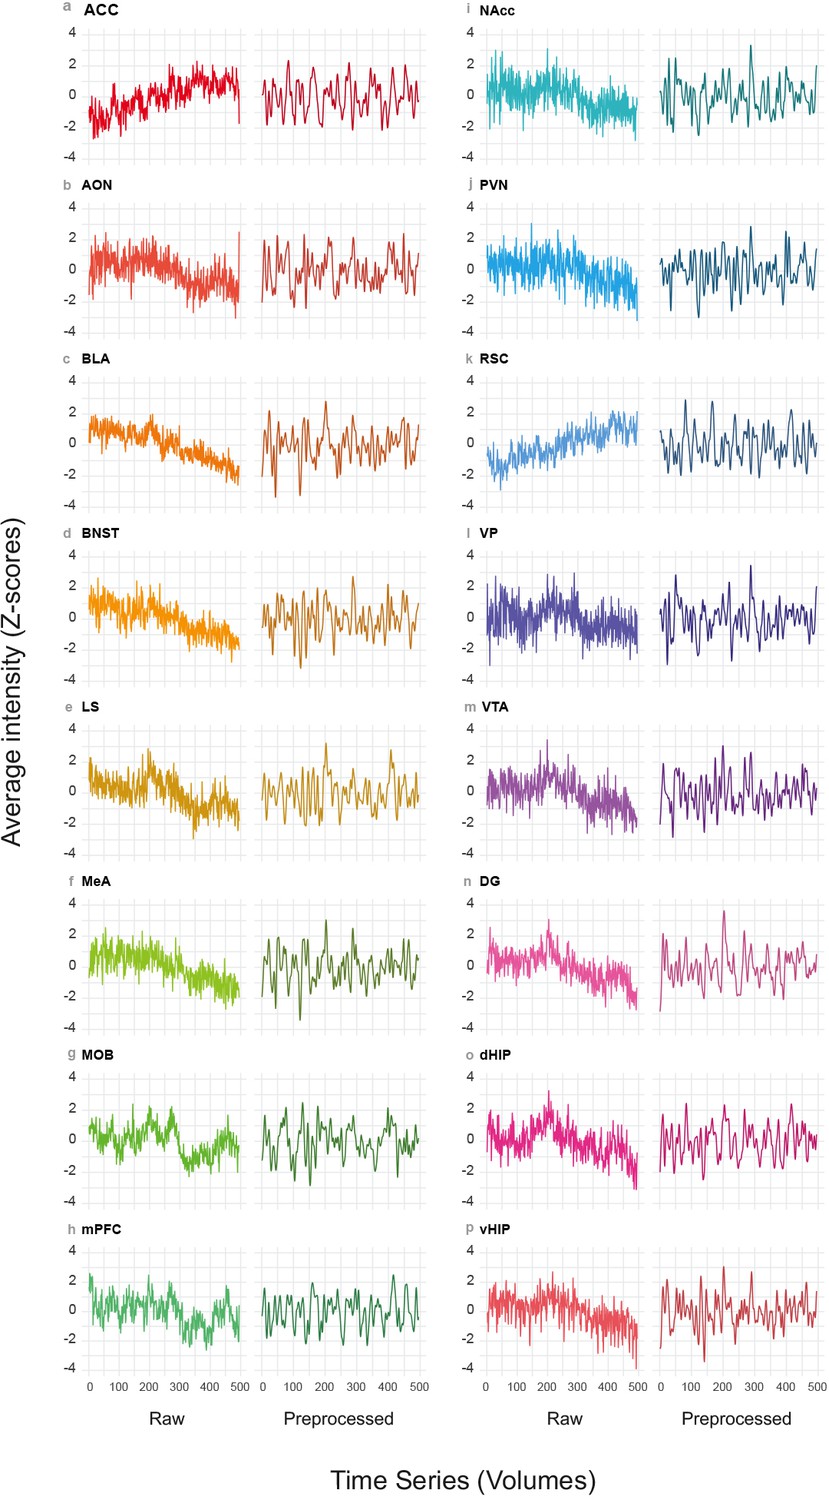
Representative rsfMRI time series.
(a–p) Representative rsfMRI time series of regions of interest (ROIs). For each ROI, the time series are shown before (Raw) and after pre-processing (Pre-processed). ACC: anterior cingulate cortex. AON: anterior olfactory nucleus. BLA: basolateral amygdala. BNST: bed nucleus of the stria terminalis. LS: lateral septum. MeA: medial amygdala. MOB: main olfactory bulb. mPFC: medial prefrontal cortex. NAcc: nucleus accumbens. PVN: paraventricular nucleus. RSC: retrosplenial cortex. VP: ventral pallidum. VTA: ventral tegmental area. DG: dentate gyrus. dHIP: dorsal hippocampus. vHIP: ventral hippocampus.
Figure 1—figure supplement 2
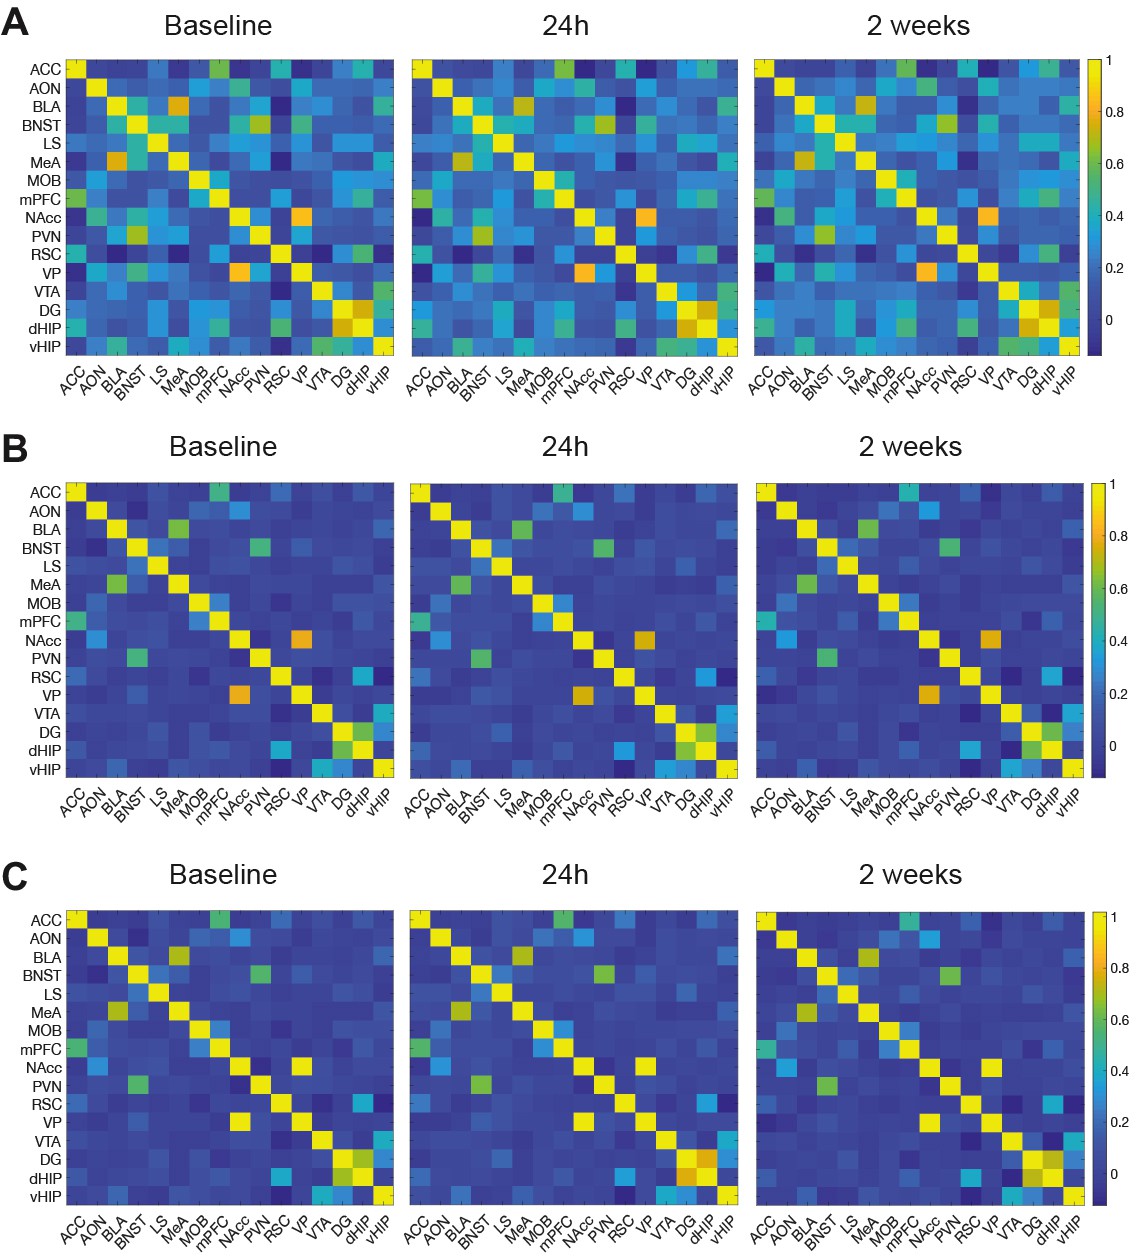
Average functional connectivity correlation matrices between ROIs in all subjects shown by MR acquisition sessions: baseline, 24 hr, and 2 weeks.
(A) Pearson’s correlation values of rsfMRI time-series connectivity matrices. (B) Partial-correlation values of rsfMRI time-series connectivity matrices. (C) Fisher z-transformed, rsfMRI time-series connectivity matrices used for functional connectivity analysis. ACC: anterior cingulate cortex. AON: anterior olfactory nucleus. BLA: basolateral amygdala. BNST: bed nucleus of the stria terminalis. LS: lateral septum. MeA: medial amygdala. MOB: main olfactory bulb. mPFC: medial prefrontal cortex. NAcc: nucleus accumbens. PVN: paraventricular nucleus. RSC: retrosplenial cortex. VP: ventral pallidum. VTA: ventral tegmental area. DG: dentate gyrus. dHIP: dorsal hippocampus. vHIP: ventral hippocampus.
Figure 1—figure supplement 3
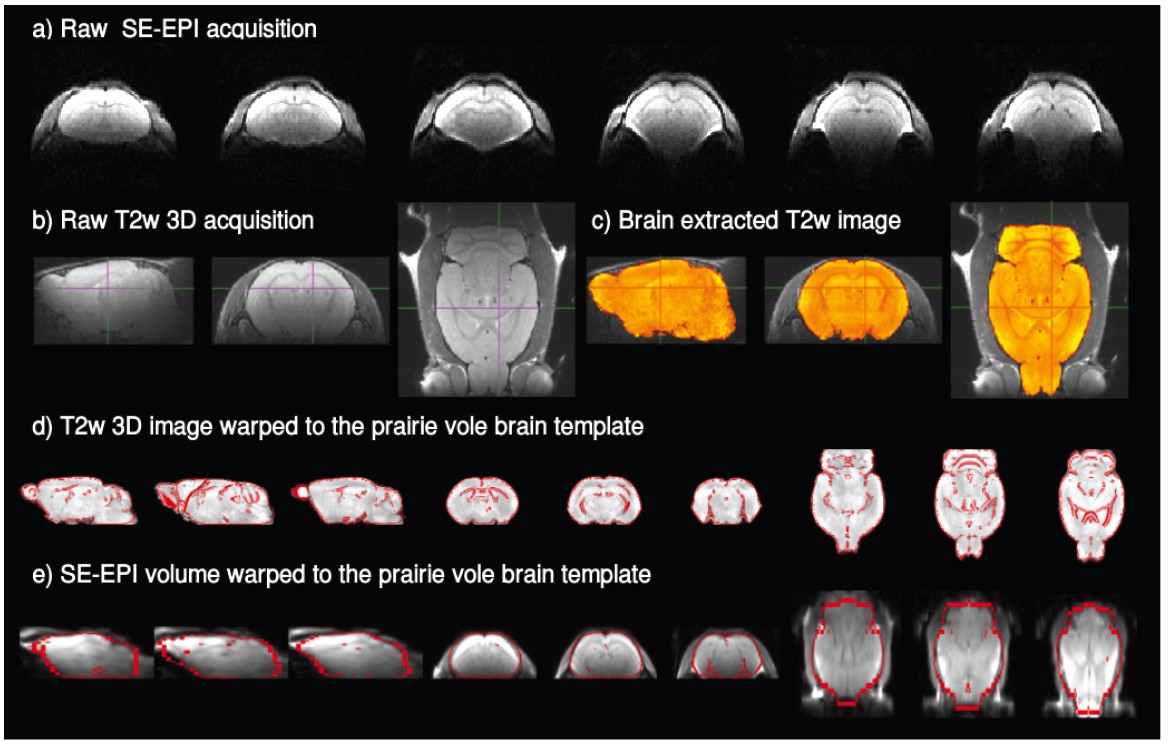
Representative rsfMRI and anatomical raw data and examples of the registration steps.
(a) Raw SE-EPI rsfMRI image; (b) raw anatomic image; (c) brain extraction and bias field correction of the anatomic image; (d) registration of the anatomic data (grayscale) to the prairie vole brain template (outlined in red); (e) final registration of a representative volume of the SE-EPI acquisition (grayscale) to the prairie vole brain template (outlined in red).
Figure 1—figure supplement 4

Average seed-based functional connectivity maps for each of the 16 ROIs here explored.
For every subject, session, and ROI, the average time series from the ROI is extracted and the functional connectivity with every voxel of the brain is estimated as the Pearson’s correlation. Then connectivity maps are Fisher z-transformed, and a single-group t-test is performed, family-wise error rates are controlled with a false discovery rate lower than 0.05. Connectivity maps represent Pearson’s correlation values. ACC: anterior cingulate cortex. AON: anterior olfactory nucleus. BLA: basolateral amygdala. BNST: bed nucleus of the stria terminalis. LS: lateral septum. MeA: medial amygdala. MOB: main olfactory bulb. mPFC: medial prefrontal cortex. NAcc: nucleus accumbens. PVN: paraventricular nucleus. RSC: retrosplenial cortex. VP: ventral pallidum. VTA: ventral tegmental area. DG: dentate gyrus. dHIP: dorsal hippocampus. vHIP: ventral hippocampus.
Figure 1—figure supplement 5

Vole temperature during acquisition, discarded images and signal-to-noise ratio.
(A) Prairie vole temperatures during MR acquisition sessions. A separate sub-sample was used to evaluate the design of the anesthesia protocol on physiological data in both male (n = 3) and female (n = 2) voles. Temperature mean was 34.93 ± 0.01°C. MRI data acquisition began when physiological measurements stabilized (approximately after ~15 min from bolus injection). (B) Two datasets from session 1 (baseline) showed signal loss in the posterior cortex and were discarded from the study. (C) Boxplots of the mean signal-to-noise ratio (SNR) values (n = 78) for each region of interest (16) used in the rsfMRI analyses. Top and bottom of the box are 25th and 75th percentiles, respectively, and the centerline shows data median. SNR estimates (n = 78) were calculated by dividing ROI mean signals by the standard deviation of the noise signal, as described elsewhere (Grandjean et al., 2020). ACC: anterior cingulate cortex. AON: anterior olfactory nucleus. BLA: basolateral amygdala. BNST: bed nucleus of the stria terminalis. LS: lateral septum; MeA: medial amygdala. MOB: main olfactory bulb. mPFC: medial prefrontal cortex. NAcc: nucleus accumbens. PVN: paraventricular nucleus. RSC: retrosplenial cortex. VP: ventral pallidum. VTA: ventral tegmental area. DG: dentate gyrus. dHIP: dorsal hippocampus. vHIP: ventral hippocampus.
Figure 2

Relationships between baseline functional connectivity and affiliative behavior (huddling) during cohabitation with mating in male and female prairie voles.
(A) Representation of a prairie vole brain with regions (nodes) that constitute the network with a significant negative association with huddling latency. Scatter-plot graphs (B–J) of the connections in a with best line fit between baseline functional connectivity (Fisher z-transformed partial-correlation values) and huddling latencies (minutes) during cohabitation. The higher the connectivity between these regions before cohabitation, the shorter the huddling latencies during cohabitation in voles of both sexes. ACC: anterior cingulate cortex. BLA: basolateral amygdala. DG: dentate gyrus. LS: lateral septum. MeA: medial amygdala. NAcc: nucleus accumbens. PVN: paraventricular nucleus. RSC: retrosplenial cortex. VP: ventral pallidum. VTA: ventral tegmental area.
-
Figure 2—source data 1
Functional connectivity values of edges that correlate significantly with huddling latencies in prairie voles.
- https://cdn.elifesciences.org/articles/55081/elife-55081-fig2-data1-v2.xlsx
Figure 3 with 1 supplement
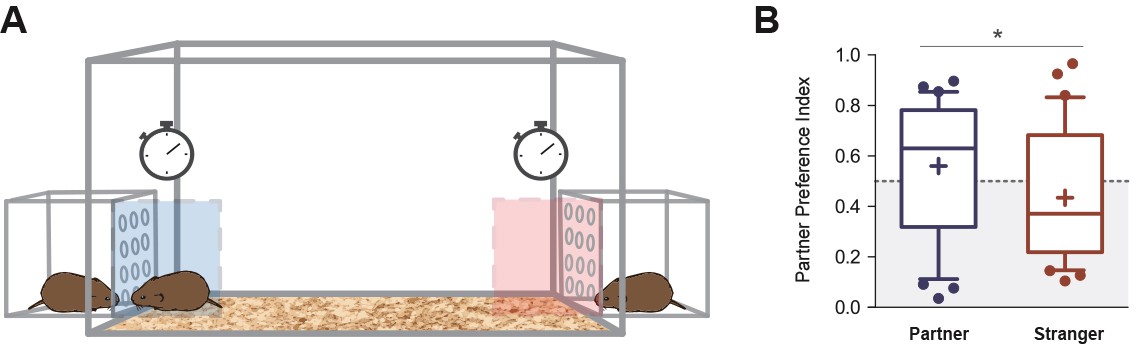
Partner preference test.
(A) Representative figure showing the design of the arena in which voles were tested for partner preference test. (B) Between 48 and 72 hr of cohabitation, partner preference was evaluated on each subject (N = 32). Partner preference index revealed a significant difference between the time spent on the incentive area related to the partner, with the incentive area related to the stranger vole. Boxplot graphs show whiskers with 10–90 percentiles; horizontal line inside the box shows data median, and ‘+’ represents data mean. (*) denotes significance at p<0.05.
-
Figure 3—source data 1
Values of parter preference index obtained from the proportion of time spent on social incentive areas related to the partner and stranger voles.
- https://cdn.elifesciences.org/articles/55081/elife-55081-fig3-data1-v2.csv
Figure 3—figure supplement 1
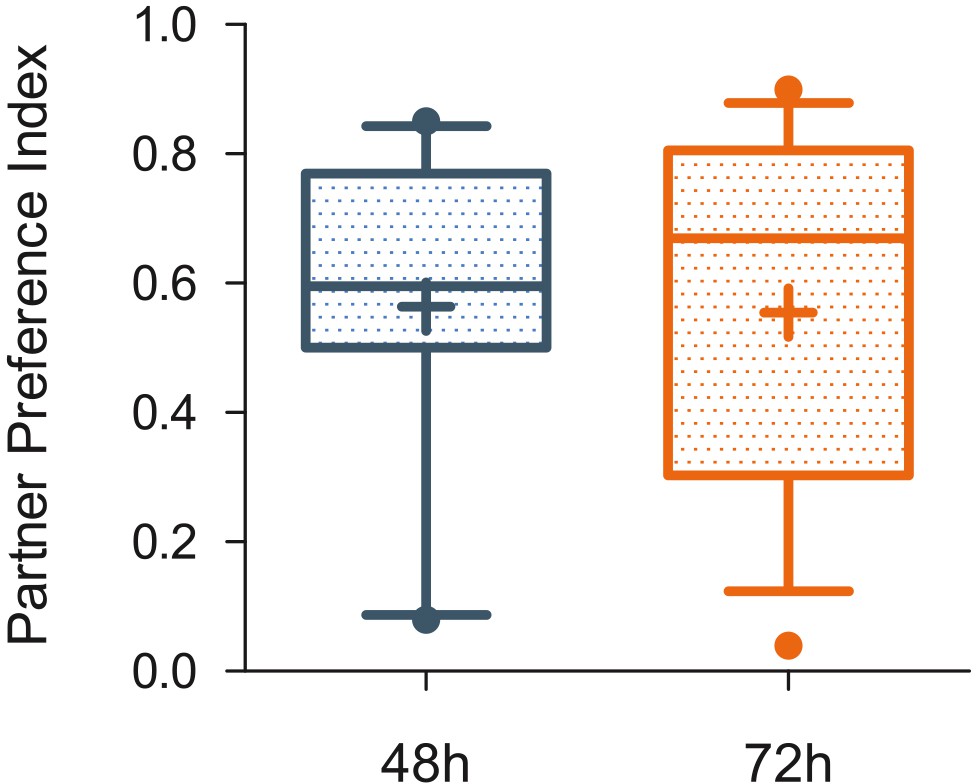
Partner preference indexes at two different time points.
No significant differences were found between Partner preference indexes obtained 48 hr after the onset of cohabitation (N = 16) in male (n = 7) and female (n = 9) prairie voles, with Partner preference Indexes obtained 72 hr after the onset of cohabitation in male (n = 9) and female (n = 7) voles.
-
Figure 3—figure supplement 1—source data 1
Partner preference index comparison at different PPT test times (48 vs 72 hr) from the onset of cohabitation.
- https://cdn.elifesciences.org/articles/55081/elife-55081-fig3-figsupp1-data1-v2.csv
Figure 4 with 1 supplement
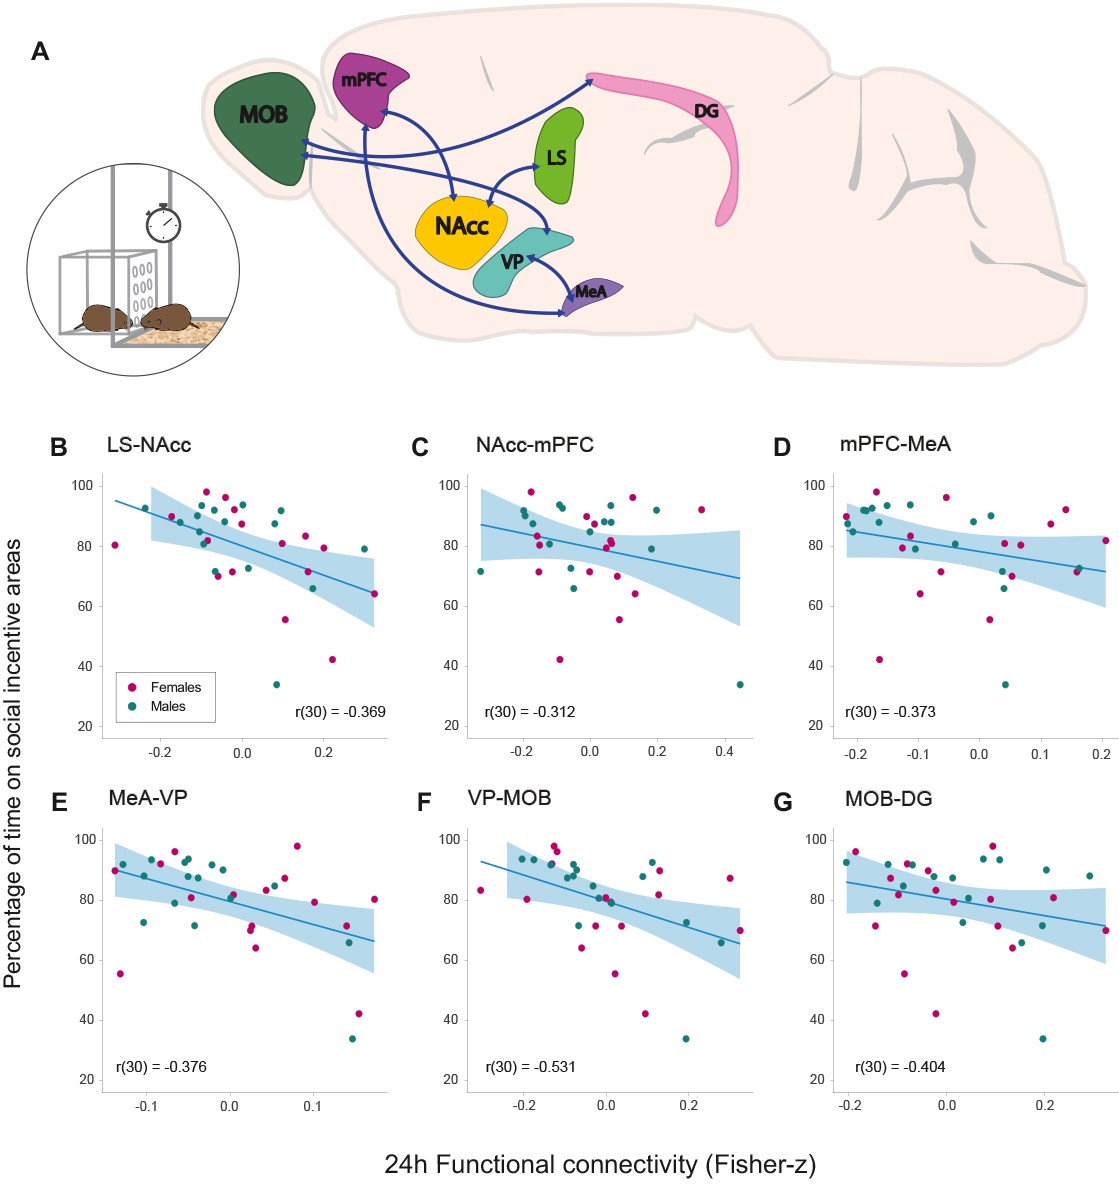
Relationships between functional connectivity 24 hr after the onset of cohabitation and social interaction during partner preference test in male and female prairie voles.
(A) Representation of a prairie vole brain with regions (nodes) that constitute the network with a significant negative association with the amount of social interaction during the PPT. Scatter-plot graphs (B–G) of the connections in a with best line fit between baseline functional connectivity (Fisher z-transformed partial-correlation values) and time on social incentive areas during cohabitation (percentage). The lower the connectivity between these regions at 24 hr of cohabitation, the longer the time spent on social incentive areas during the PPT. DG: dentate gyrus. LS: lateral septum. MeA: medial amygdala. MOB: main olfactory bulb. mPFC: medial prefrontal cortex. NAcc: nucleus accumbens. VP: ventral pallidum.
-
Figure 4—source data 1
Values of percentage of time spent on social incentive areas related to the partner and stranger voles.
- https://cdn.elifesciences.org/articles/55081/elife-55081-fig4-data1-v2.xlsx
Figure 4—figure supplement 1
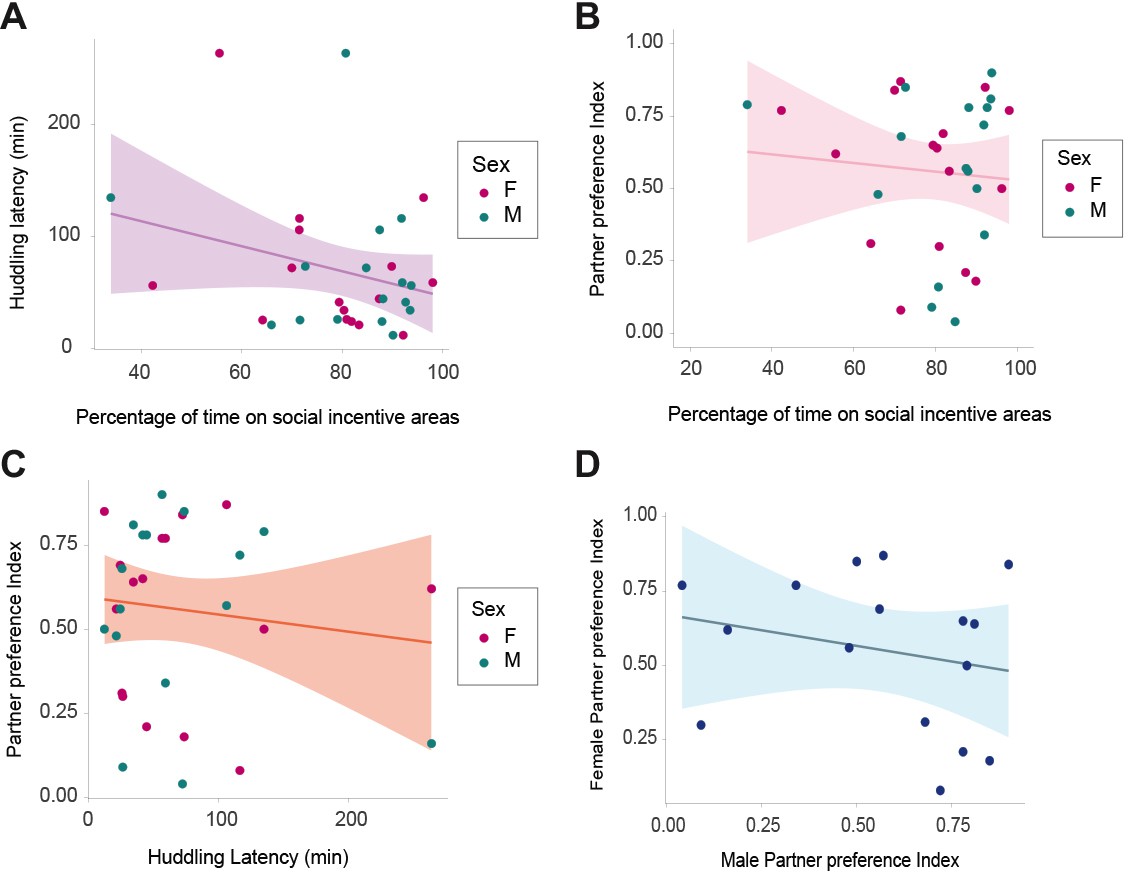
Relationships between social behaviors in the prairie vole.
Huddling latency was measured during the first hours of cohabitation, while percentage of time on social incentive areas and partner preference index were calculated from the partner preference test (PPT) evaluated between 48 hr or 72 hr after the onset of cohabitation. (A) No significant relationship was found between huddling latency and percentage of time on social incentive areas (rs(30) = −0.107; p=0.556), (B) between partner preference index and percentage of time on social incentive areas (rs(30)=0.89; p=0.627), (C) or between huddling latency and partner preference index (rs(30)=0.003; p=0.984) (N = 30). (D) Partner preference was neither reciprocated between male and female partners (rs(14) = −0.203; p=0.450) (N = 16). Sex = F: females; M: males.
Figure 5 with 2 supplements

Network-wide changes in time in brain functional connectivity of female and male prairie voles.
(A) NBR analysis via Linear mixed models (LMM) analysis results represented in a prairie vole brain with regions (nodes) comprising the brain network that undergoes significant changes in functional connectivity (Fisher z-transformed correlation values) after cohabitation with mating. Interregional connectivity (edges) is shown by color code. Red: increase of functional connectivity; blue: decrease of functional connectivity. ACC: anterior cingulate cortex. BLA: basolateral amygdala. dHIP: dorsal hippocampus. LS: lateral septum. mPFC: medial prefrontal cortex. NAcc: nucleus accumbens. RSC: retrosplenial cortex. vHIP: ventral hippocampus. VP: ventral pallidum. VTA: ventral tegmental area. (B–K) Functional connectivity values in violin plots showing full distribution of data and median. Connecting lines track longitudinal data of each subject between regions through specific MR acquisition time points (Session): Baseline, 24 hr, and 2 weeks of cohabitation. Color codes for data points and connecting lines distinguish male (cyan) from female subjects (pink). False discovery rate (FDR) post hoc significant differences are shown: *<0.05, **<0.01, ***<0.001.
-
Figure 5—source data 1
Functional connectivity values that changed significantly across sessions (Ses; 1, 2, and 3) in male and female prairie voles (females: F; males: M).
NA: data not available.
- https://cdn.elifesciences.org/articles/55081/elife-55081-fig5-data1-v2.csv
-
Figure 5—source data 2
Estimated marginal means (EMM) post hoc comparisons values obtained from the longitudinal analysis of functional connectivity data (edge), via linear mixed models with NBR.
Values are corrected for a false discovery rate (FDR) of q < 0.05 (PH_pFDR).
- https://cdn.elifesciences.org/articles/55081/elife-55081-fig5-data2-v2.csv
Figure 5—figure supplement 1
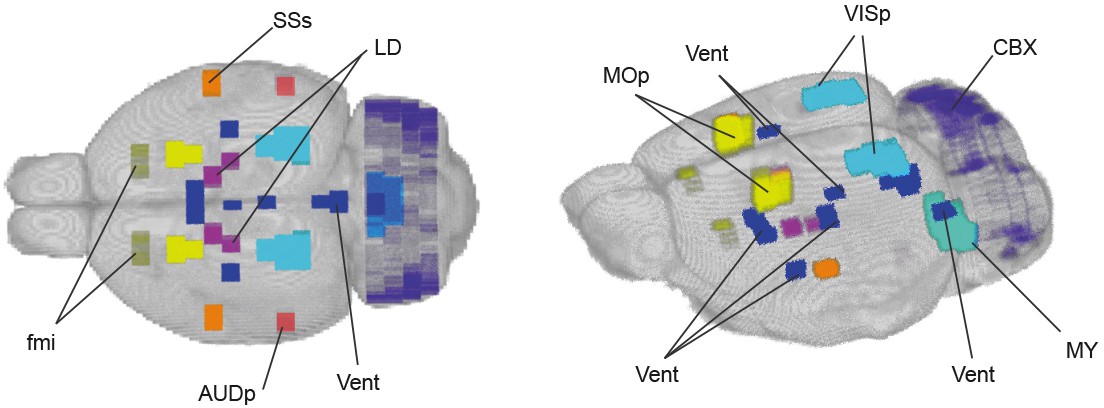
Control regions for the longitudinal analysis of rsfMRI data.
3D views of the nine control region masks embedded within the prairie vole template: primary auditory area (AUDp), the cerebellar cortex (CBX), forceps minor of the corpus callosum (fmi), laterodorsal thalamic nucleus (LD), primary motor area (MOp), motor-related medulla (MY), supplemental somatosensory a rea (SSs), primary visual area (VISp), and ventricle areas (Vent).
Figure 5—figure supplement 2
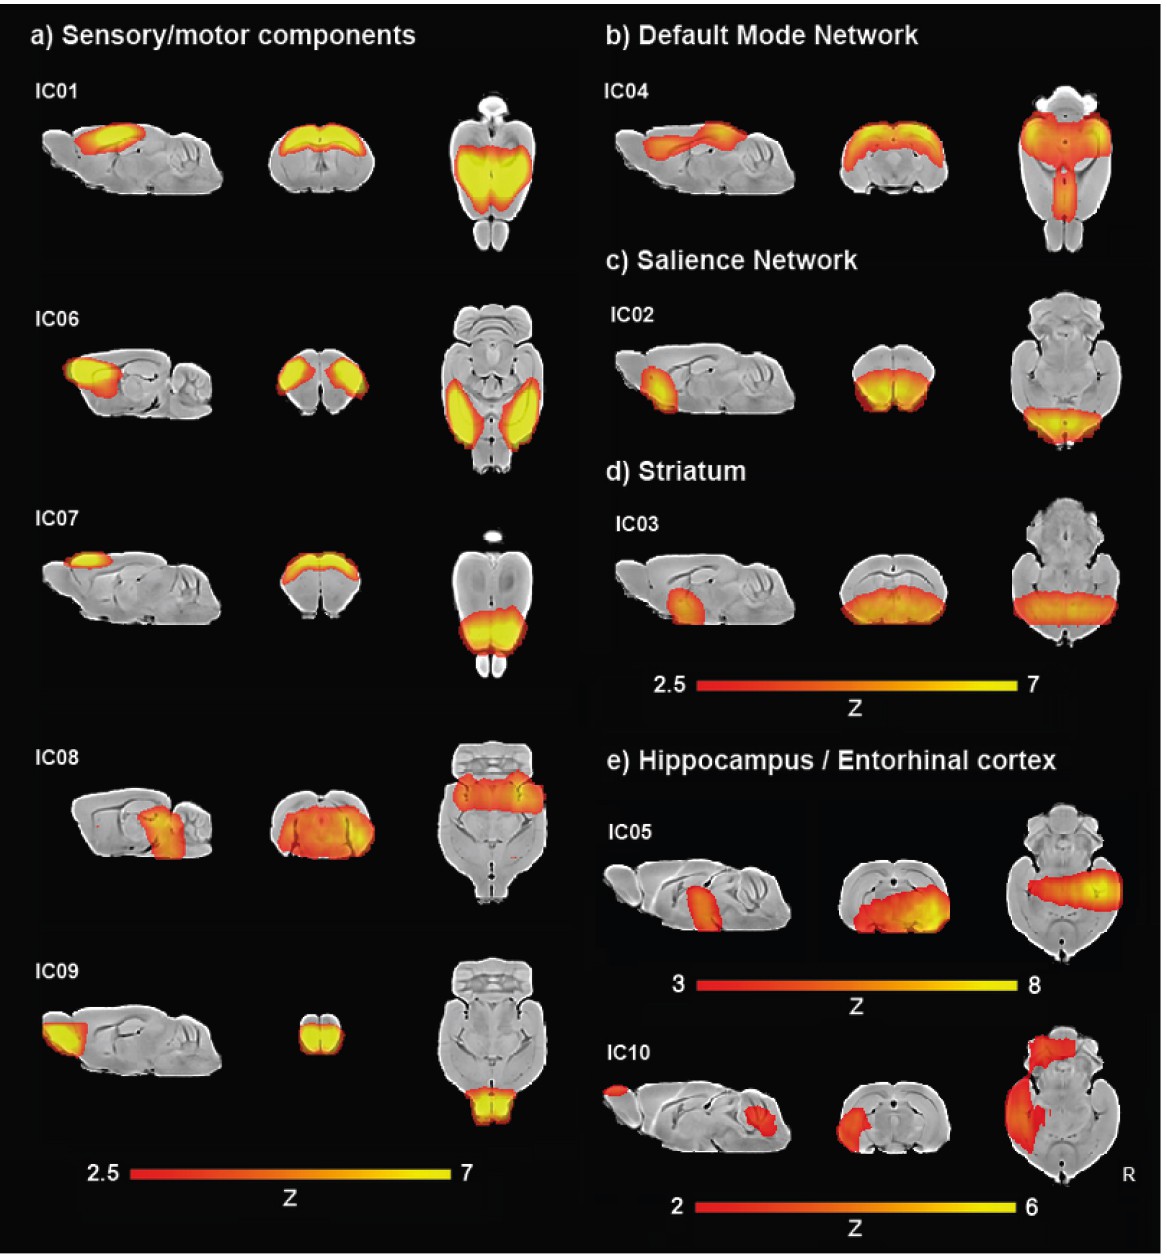
Ten components gICA.
(a) Sensory/motor components, including motor cortex (IC01, IC07), somatosensory cortex (IC06), parietal cortex (IC01), colliculi (IC08), and olfactory bulb (IC09). (b) Default-mode network (IC04). (c) Salience network (IC02). (d) Striatum (IC03), (e) Hippocampus and entorhinal cortex (IC05, IC10).
Figure 6
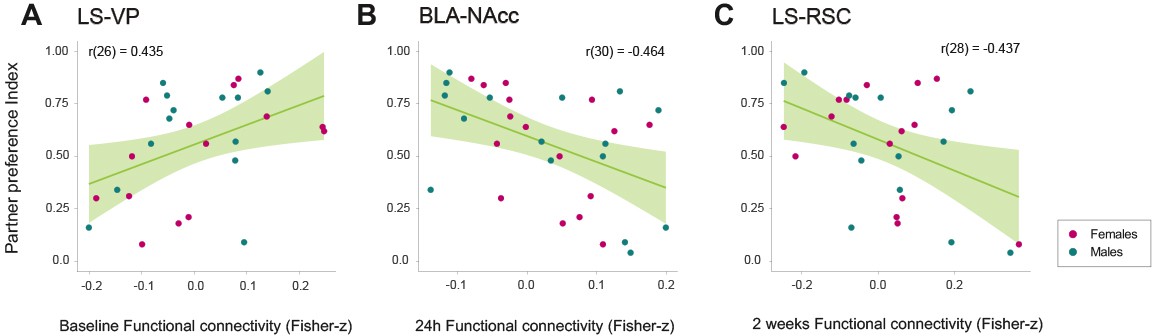
Relationships between relevant network connections and partner preference index during cohabitation with mating in male and female prairie voles.
Scatterplots (A–C) that show significant correlations (with best line fit) between functional connectivity (Fisher z-transformed partial-correlation values) and partner preference index in network connections that undergo longitudinal changes. BLA: basolateral amygdala. LS: lateral septum. NAcc: nucleus accumbens. RSC: retrosplenial cortex. VP: ventral pallidum.
-
Figure 6—source data 1
Functional connectivity values of edges that correlate significantly with partner preference index of prairie voles in each session: session 1 (s01), session 2 (s02), and session 3 (s03), which correspond to baseline, 24 hr, and 2 weeks after the onset of cohabitation, respectively.
- https://cdn.elifesciences.org/articles/55081/elife-55081-fig6-data1-v2.xlsx
Tables
Key resources table
| Reagent type (species) or resource | Designation | Source or reference | Identifiers | Additional information |
|---|---|---|---|---|
| Software, algorithm | Network-Based Statistic Toolbox | PMID:20600983 | RRID:SCR_002454 | |
| Software, algorithm | Network-Based R-Statistics | doi: 10.1101/2020.11.07.373019 | RRID:SCR_019114 | |
| Software, algorithm | nlme | CRAN | RRID:SCR_015655 | |
| Software, algorithm | FSL | PMID:21979382 | RRID:SCR_002823 | |
| Software, algorithm | ANTS – Advanced Normalization ToolS | PMID:20851191 | RRID:SCR_004757 | |
| Software, algorithm | ggplot2 | CRAN | RRID:SCR_014601 | |
| Software, algorithm | GraphPad Prism | GraphPad | RRID:SCR_002798 | |
| Software, algorithm | MATLAB | MathWorks | RRID:SCR_001622 | |
| Chemical compound, drug | Dexmedetomidine | Zoetis | PubChem CID: 5311068 | s.c. bolus dose:0.05 mg/kg |
| Chemical compound, drug | Isoflurane | PiSA | PubChem CID: 3763 | |
| Chemical compound, drug | β-Estradiol 3-benzoate | Sigma | PubChem CID: 222757 | Dose: 0.5 mg/mL dissolved in corn oil |
| Other | Dow Corning Silastic Laboratory Tubing | ThermoFisher Scientific | Length of tubing for capsule: 1.7 cm |
Additional files
Download links
A two-part list of links to download the article, or parts of the article, in various formats.
Downloads (link to download the article as PDF)
Open citations (links to open the citations from this article in various online reference manager services)
Cite this article (links to download the citations from this article in formats compatible with various reference manager tools)
Brain functional networks associated with social bonding in monogamous voles
eLife 10:e55081.
https://doi.org/10.7554/eLife.55081


