The S-phase-induced lncRNA SUNO1 promotes cell proliferation by controlling YAP1/Hippo signaling pathway
- Department of Cell and Developmental Biology, Cancer center at Illinois, University of Illinois at Urbana-Champaign, United States
- Department of BioHealth Informatics, School of Informatics and Computing, IUPUI, United States
- Regulatory RNAs and Cancer Section, Genetics Branch, Center for Cancer Research, National Cancer Institute, United States
- Department of Biological Sciences and Center for Systems Biology, The University of Texas at Dallas, United States
- LGC Biosearch Technologies, United States
- Division of RNA Biology and Cancer, German Cancer Research Center (DKFZ), Germany
- Department of Pediatrics, University of Minnesota, United States
- Center for Cancer Research National Cancer Institute, United States
- Molecular Genetics Section, Genetics Branch, Center for Cancer Research, National Cancer Institute, United States
- Division of Cancer University of Freiburg, German Cancer Consortium (DKTK), Germany
- Sanford Burnham Prebys Medical Discovery Institute, United States
Figures
Figure 1 with 2 supplements
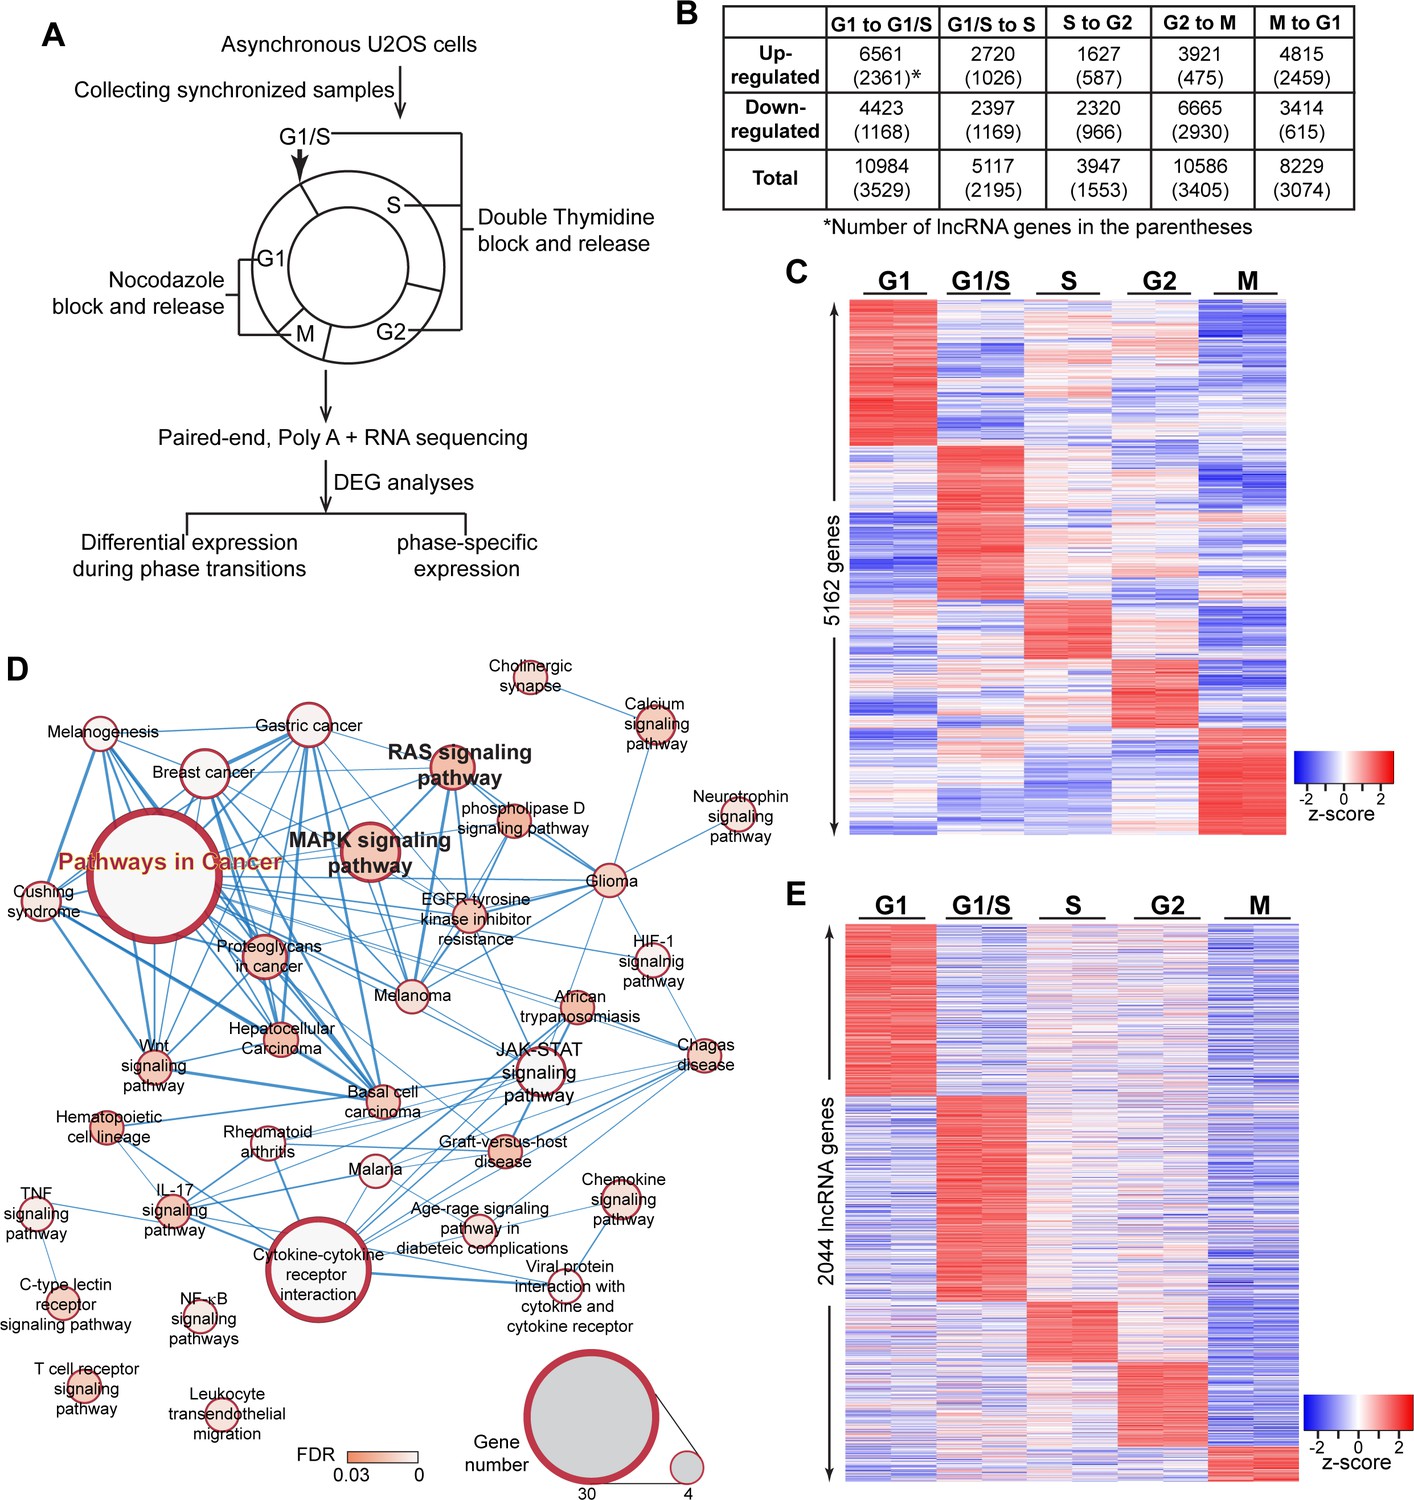
Transcriptome landscape of U2OS cells during cell-cycle progression.
(A) Schematic of sample preparation and analyses pipeline of RNA-seq. U2OS cells are synchronized to different phases of cell cycle (G1, G1/S, S, G2, M) in biological replicates, then subject to paired-end, polyA+, and high depth RNA-seq. Differential expression analyses are performed using gene count data to identify differentially expressed genes comparing every two adjacent phases. Phase-specific genes are further defined as detailly described in Materials and method. (B) Table representing the number of differentially expressed genes (DEGs) between every two adjacent cell-cycle phases. The number in the parenthesis refers to long non-coding DEGs. Detailed DEG information is available in Supplementary file 3. (C) Heatmap of all phase-specific genes. Full list of all 5162 phase-specific genes are listed in Supplementary file 5. (D) Top events from Kegg pathway analysis of S-phase-specific genes. Full results are listed in Supplementary file 4. (E) Heatmap showing cell-cycle phase-specific expression of lncRNAs in U2OS cells.
Figure 1—figure supplement 1
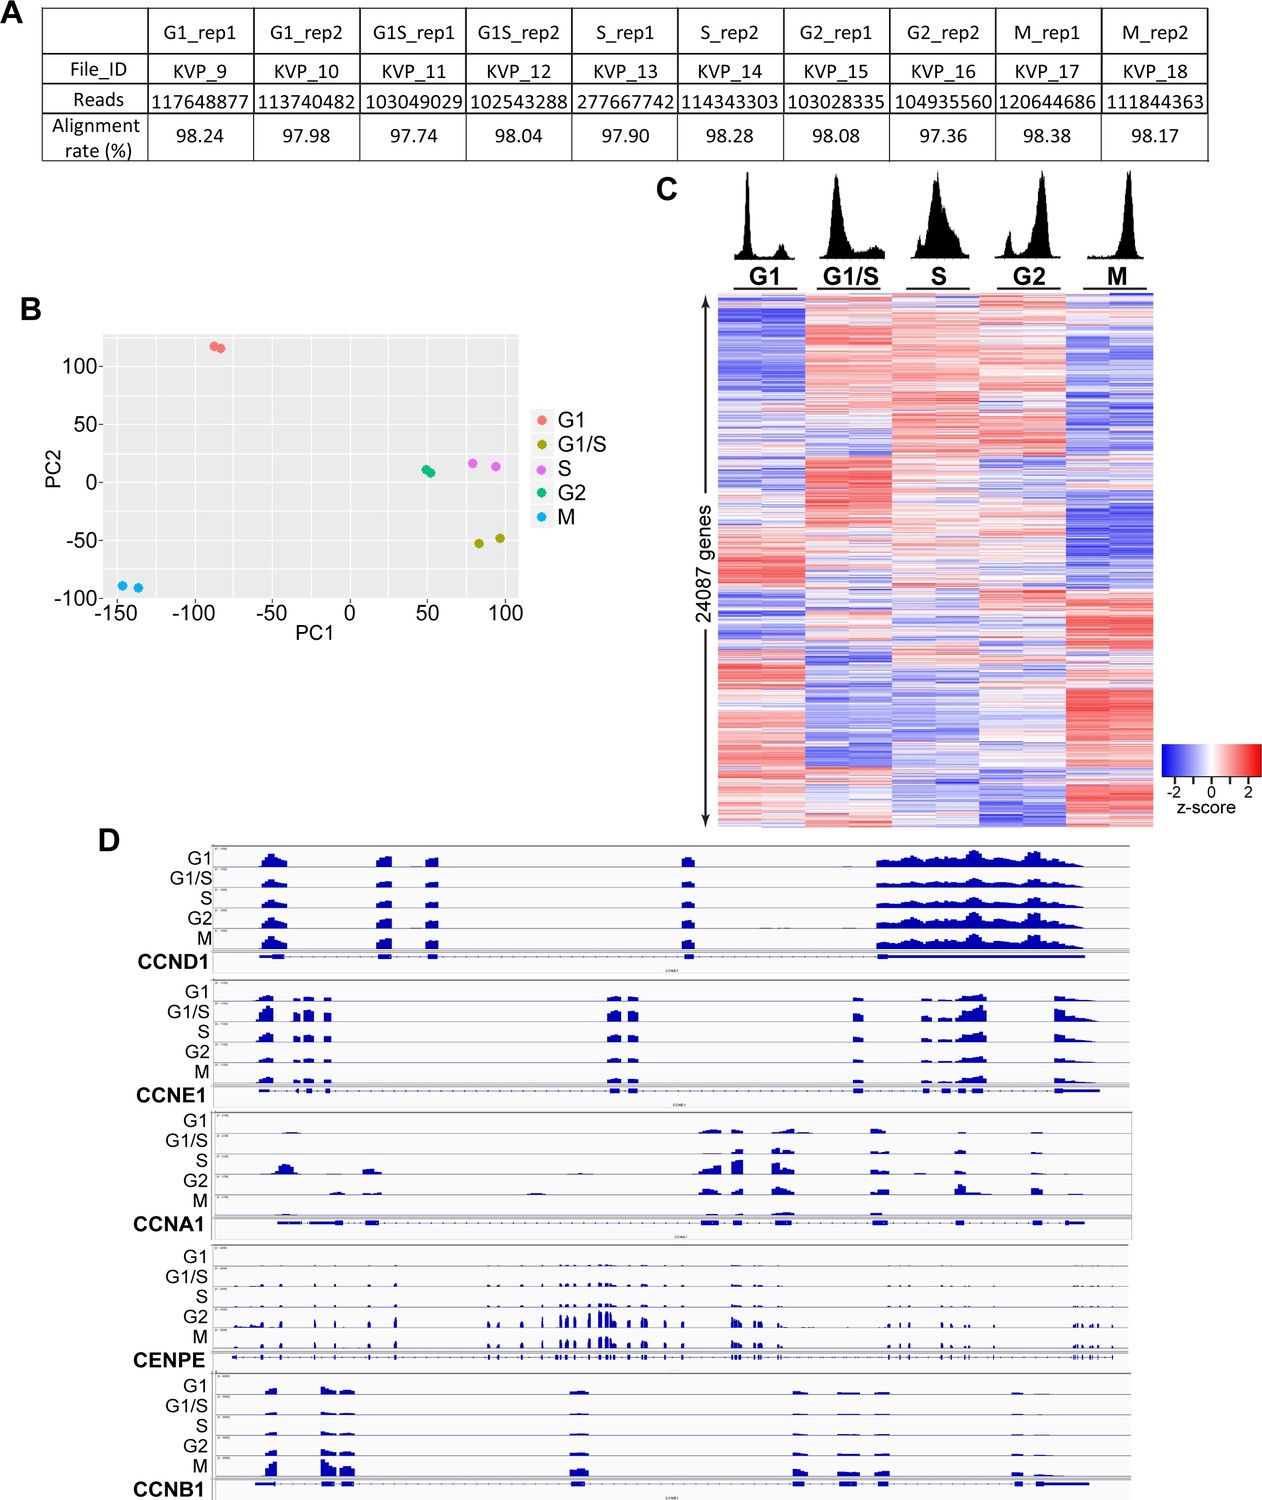
Cell-cycle-specific expression of genes in U2OS cells.
(A) Number of pair-end reads from fastq raw sequencing files of RNA-seq. (B) Plot showing PC1 and PC2 from the principle component analysis (PCA) of the 10 samples. Biological replicates are marked using the same color on the plot. (C) Heatmap showing the expression of all genes detected from RNA-seq. Genes (rows of heatmap) are hierarchically clustered using complete-linkage clustering method. PI-flow cytometry analyses on the top show the synchronization of U2OS cells. (D) RNA-seq signals (bigwig files) of several key cell-cycle marker genes during the 5 cell-cycle phases. Data is visualized using IGV.
Figure 1—figure supplement 2
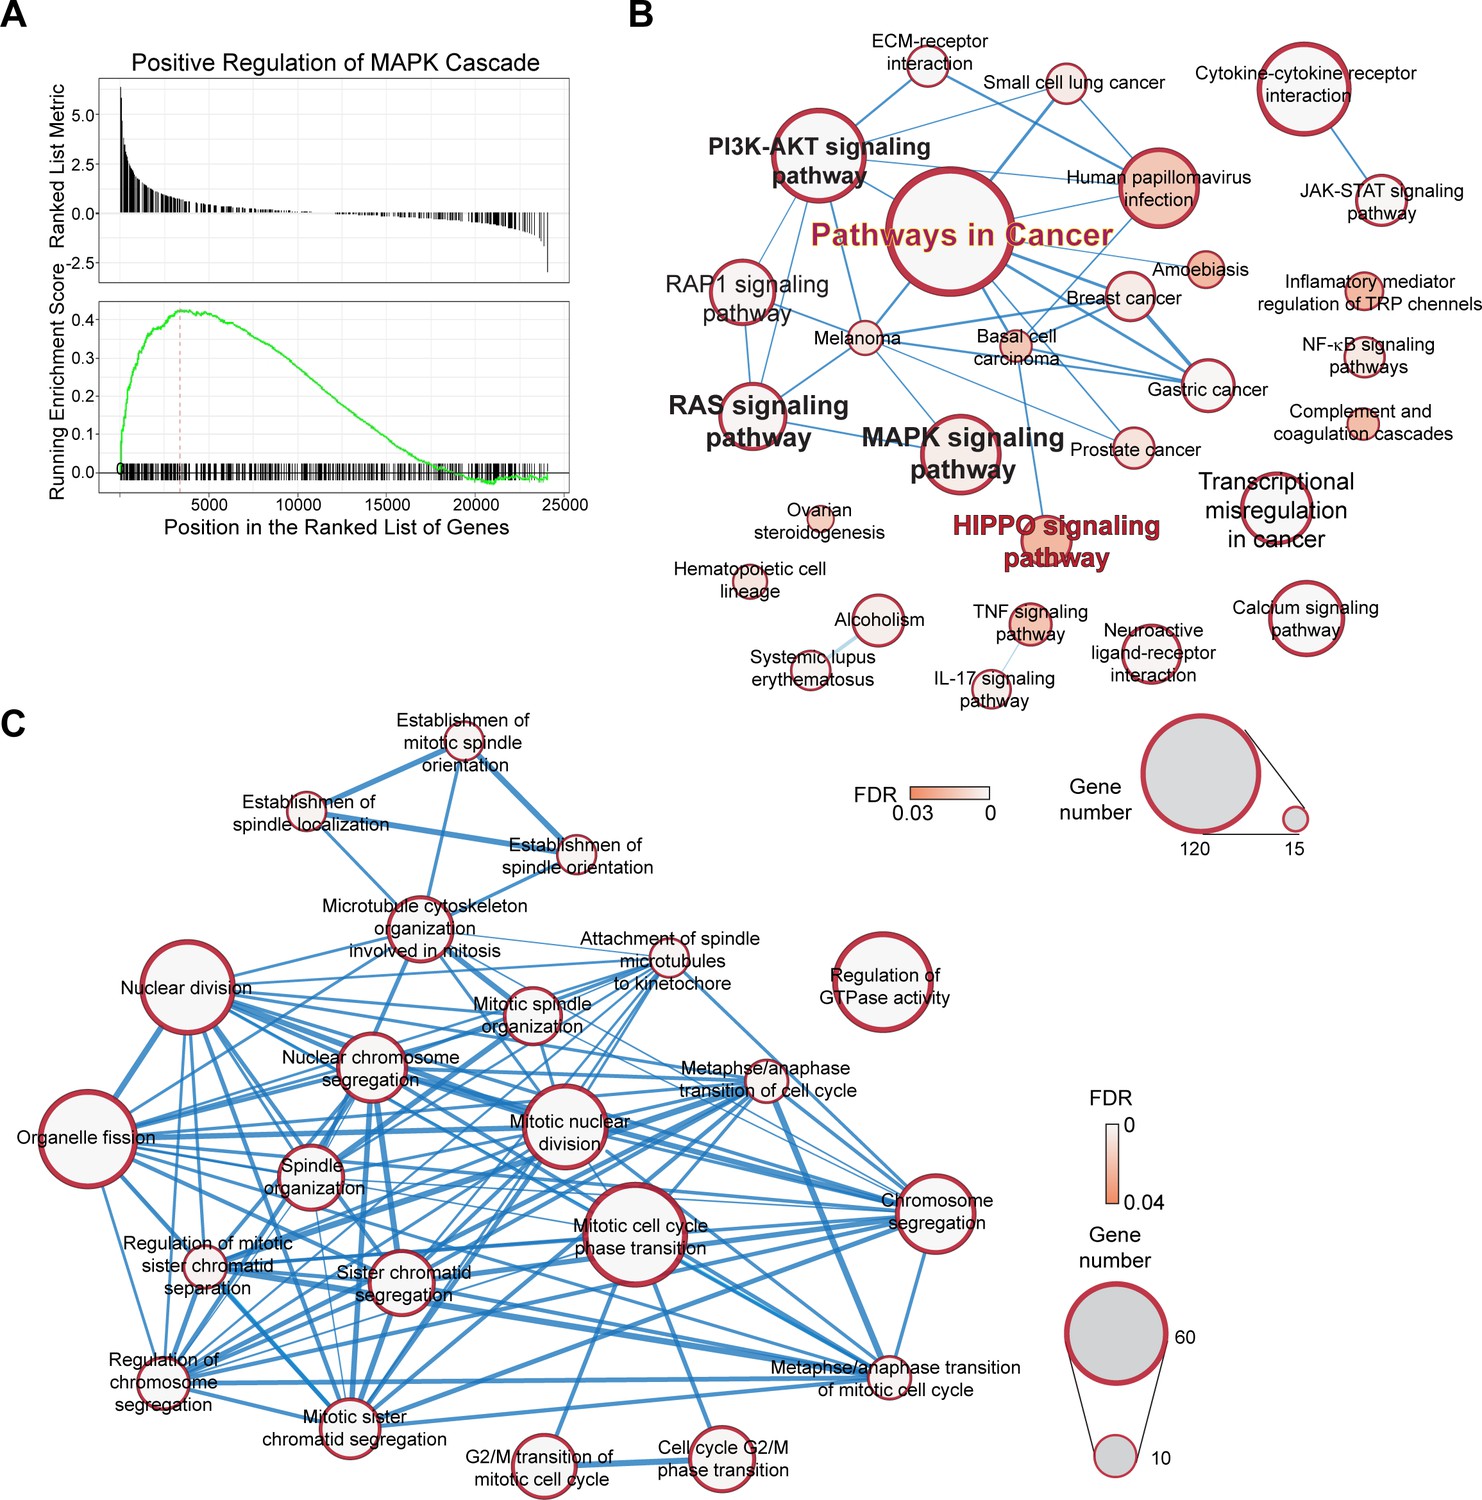
Pathways and biological processes of genes that showed differential expression during cell cycle.
(A) MAPK cascade from GSEA analysis of G1/S to S transition. Full results of GSEA analysis are listed in Supplementary file 4. (B) Top events from Kegg pathway analysis of DEGs from G1/S to S. Full results are listed in Supplementary file 4. (C) Gene ontology analysis showing the top enriched biological processes of M-phase-specific genes. Full results are listed in Supplementary file 4.
Figure 2 with 3 supplements
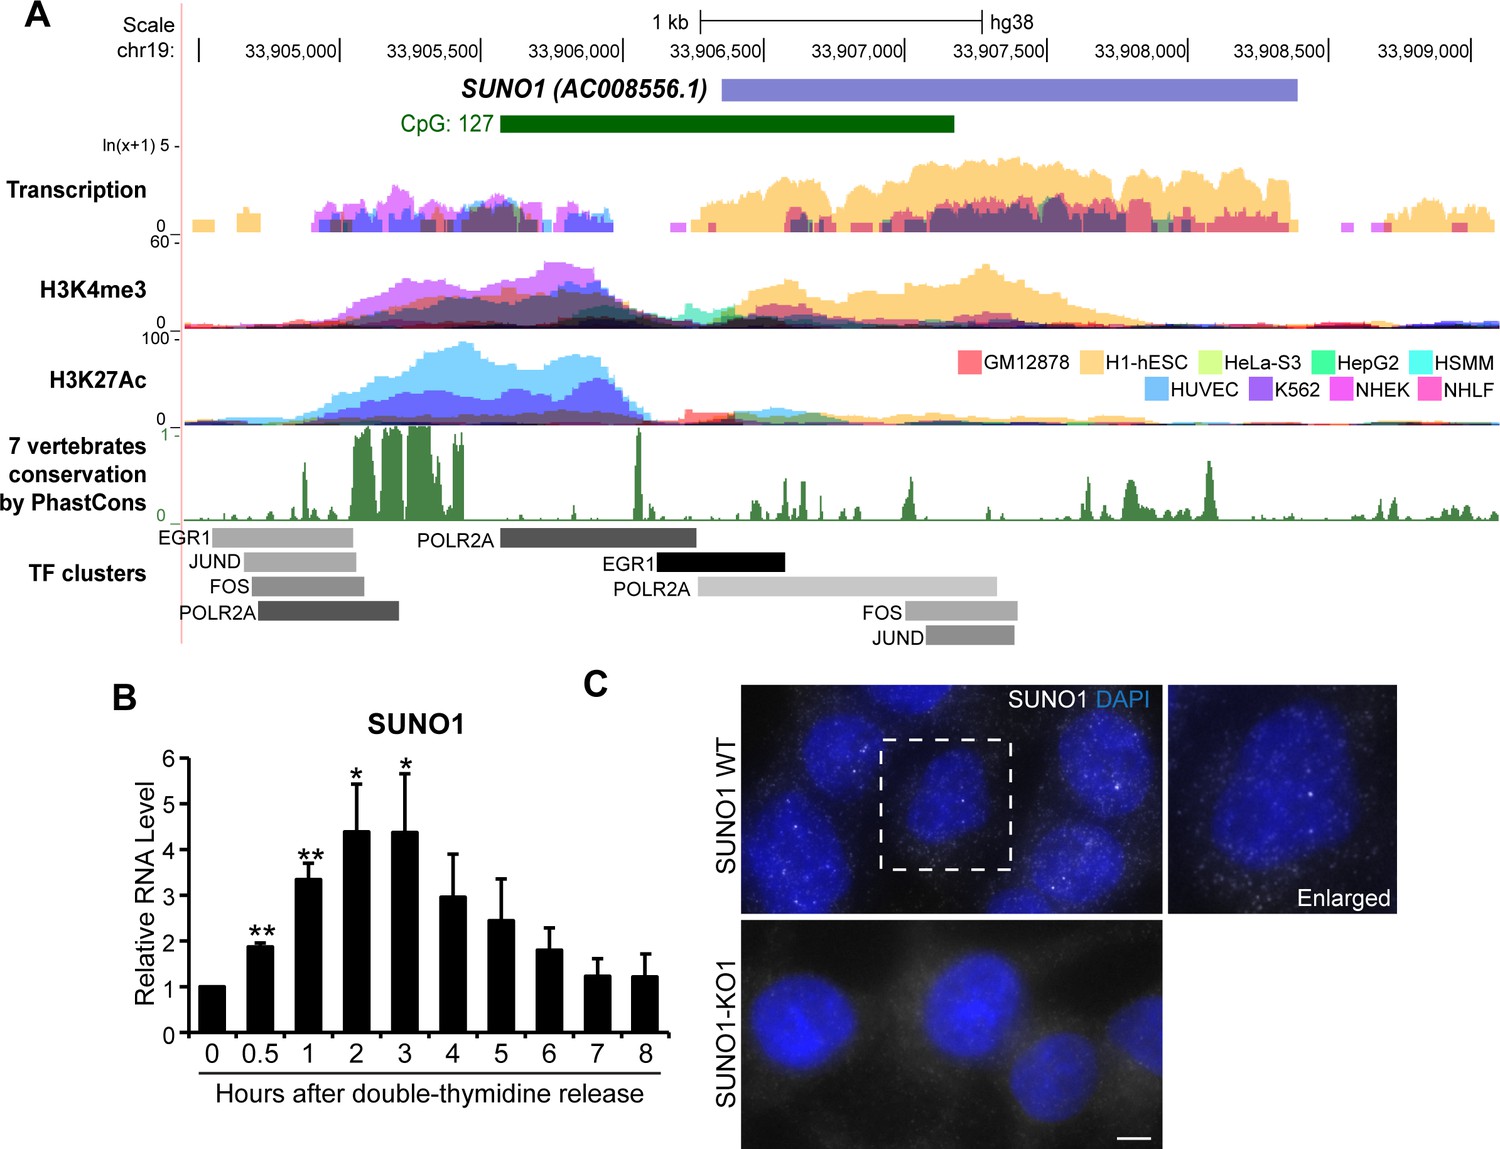
SUNO1 is an S-phase-induced lncRNA.
(A) UCSC genomic browser view of SUNO1 genomic locus, showing position of CpG island, transcription in 9 ENCODE cell lines, H3K4me3 ChIP-seq data set, H327Ac ChIP-seq data set, vertebrate conservation, and clusters of Pol II and cell-cycle-regulating transcription factors (TFs) from ENCODE data sets. (B) RT-qPCR to detect relative levels of SUNO1 in U2OS cells post double-thymidine block for indicated time points (hours). Data are presented as Mean ± SD, n = 2. Unpaired two-tail t-tests are performed. *p<0.05, **p<0.01, ***p<0.001. (C) Single-molecule RNA-FISH (smRNA-FISH) to detect SUNO1 RNA in wild-type and SUNO1 knock-out HCT116 cells. SUNO1 KO1 cells used as a negative control for SUNO1 RNA smRNA-FISH. DNA is counterstained with DAPI. Scale bar: 5 μm.
Figure 2—figure supplement 1
SUNO1 is upregulated during S-phase.
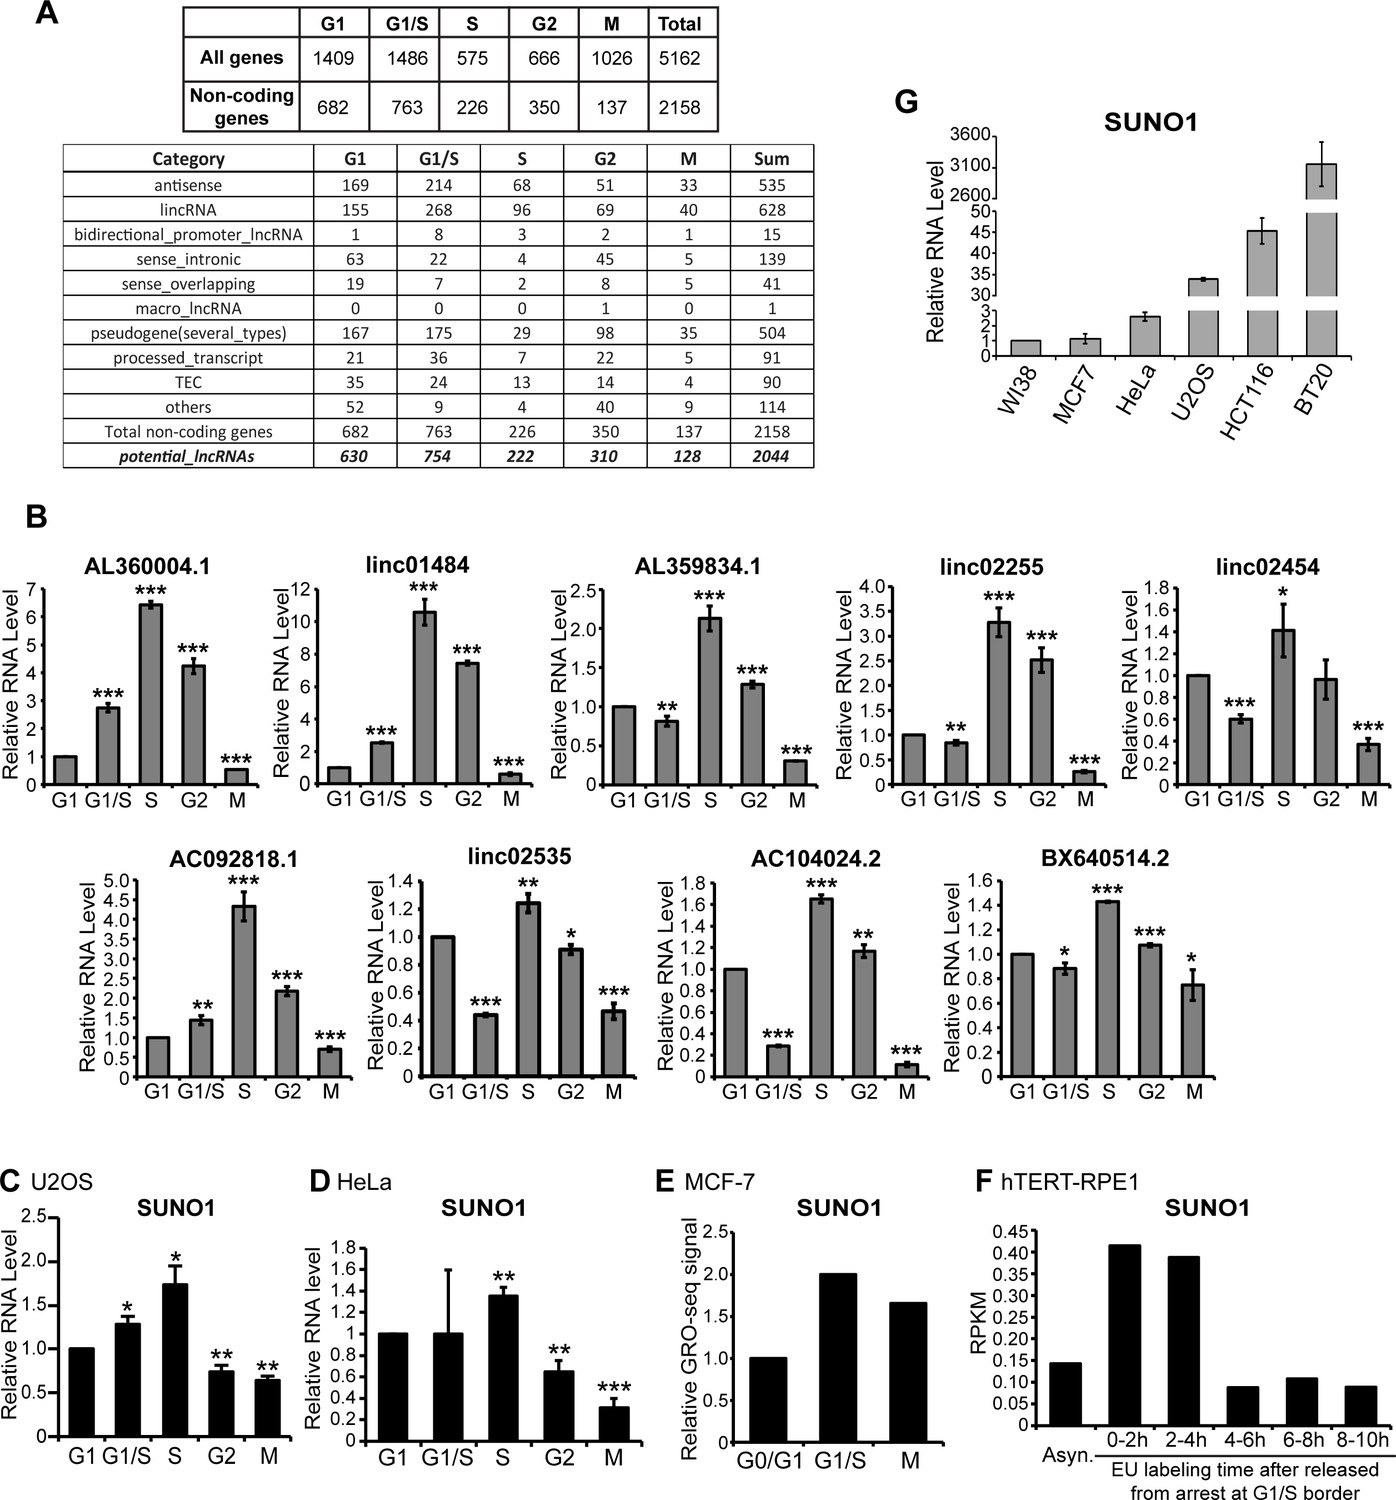
(A) Categorization of cell-cycle phase-specific genes that are differentially expressed during all five phases. Sub-classes of all non-coding RNA genes that are differentially expressed during specific cell cycle is further categorized in the lower table. The category ‘potential_lncRNAs’ refers to all except ‘others’ category. Detailed gene category information is available in Supplementary file 5. (B) RT-qPCR to quantify relative levels of S-phase-upregulated lncRNA candidates in cell-cycle-synchronized U2OS cells. Data are presented as Mean ± SD, n = 3. Unpaired two-tail t-tests are performed. *p<0.05, **p<0.01, ***p<0.001. (C) RT-qPCR to quantify the SUNO1 levels in cell-cycle-synchronized U2OS cells. Data are presented as Mean ± SD, n = 3. Unpaired two-tail t-tests are performed. *p<0.05, **p<0.01, ***p<0.001. (D) RT-qPCR to detect relative SUNO1 levels in cell-cycle-synchronized HeLa cells. Data are presented as Mean ± SD, n = 3. Unpaired two-tail t-tests are performed. *p<0.05, **p<0.01, ***p<0.001. (E) Relative GRO-seq signal of SUNO1 in MCF-7 cells at various cell-cycle stages. Raw GRO-seq dataset (Liu et al., 2017b; GSE94479) was reanalyzed. (F) RPKM of nascent SUNO1 RNA levels in hTERT-RPE1 cells during various cell-cycle stages (Yildirim et al., 2020; GSE137448). (G) RT-qPCR to determine the relative levels of SUNO1 in various human cell lines. Data are presented as Mean ± SD, n = 3.
Figure 2—figure supplement 2

Basic characterization of SUNO1.
(A) UCSC genome browser window of SUNO1 gene locus. Full track of transcription factor or co-factor ChIP-seq signature from ENCODE data sets is shown. (B) RT-qPCR to determine the relative percentage of SUNO1, 18S rRNA and GAPDH RNA in poly A+ and A- fractions of U2OS cells. Data are presented as Mean ± SD, n = 3. (C) RT-qPCR to determine the relative percentage of SUNO1, MALAT1, and GAPDH RNA in nuclear and cytoplasmic fractions of U2OS cells. Data are presented as Mean ± SD, n = 3.
Figure 2—figure supplement 3
Basic characterization of SUNO1.
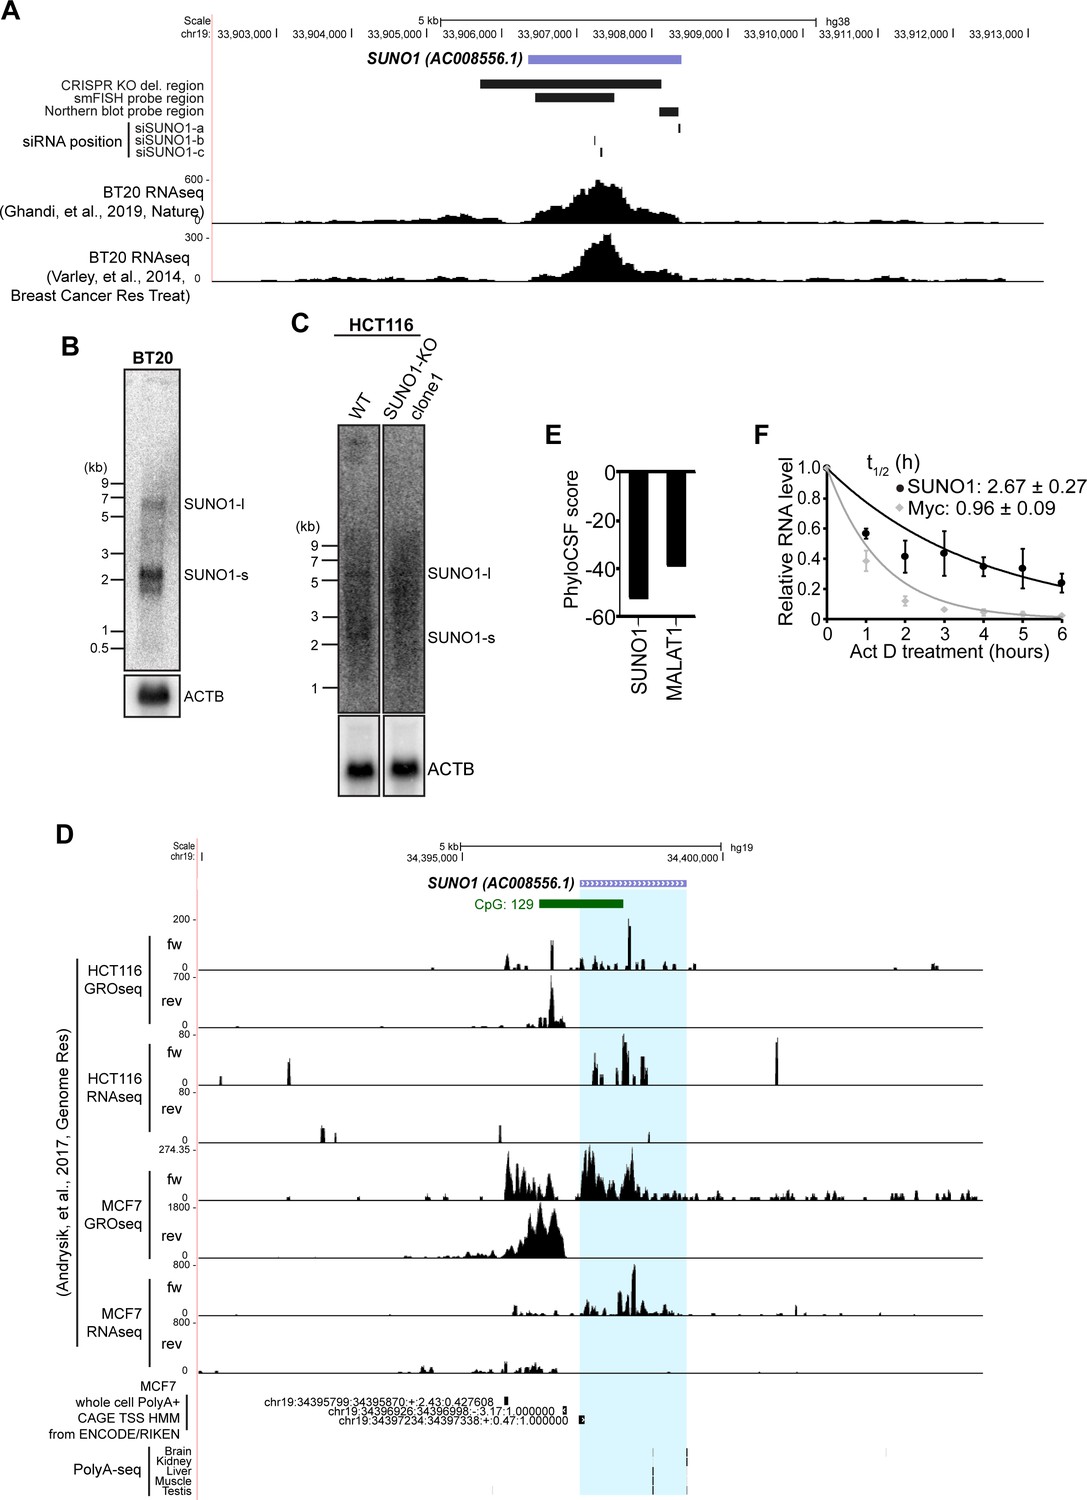
(A) UCSC genome browser window of SUNO1 gene locus. Position of the deleted region in CRISPR-KO cell lines, positions of the probes used in northern blot and smFISH, positions of the siRNAs used to deplete SUNO1, and the RNA-seq coverage tracks in BT-20 (Ghandi et al., 2019; Varley et al., 2014; SRX5414926, GSE58135) are shown. (B) Northern blot to detect SUNO1 RNA using Poly A+ RNA from BT20 cells. β-actin mRNA northern blot is used as positive control. (C) Northern blot to detect SUNO1 RNA using poly A+ RNA from WT and SUNO1-KO HCT116 cells. Please note the presence of two discrete bands at ~5.1 Kb and ~2.1 Kb only in the WT cells. β-actin mRNA northern blot is used as loading control. (D) UCSC genome browser window of SUNO1 gene locus. GROseq and RNAseq coverage tracks in HCT116 and MCF-7 cells (Andrysik et al., 2017; GSE86221, GSE86165), CAGE tracks, and PolyA-seq tracks are shown. (E) Predicted PhyloCSF scores of SUNO1 and MALAT1 to estimate the protein-coding potential of these transcripts. (F) Act D pulse-chase followed by RT-qPCR to determine the stability assay to determine SUNO1 half-life. Myc is used as a positive control. Data are presented as Mean ± SD, n = 3. Myc is an example of mRNA with short half-life. Half-life is calculated by exponential regression and shown as Mean ± SD.
Figure 3 with 3 supplements
SUNO1 depletion results in cell-cycle arrest and defects in S-phase entry.
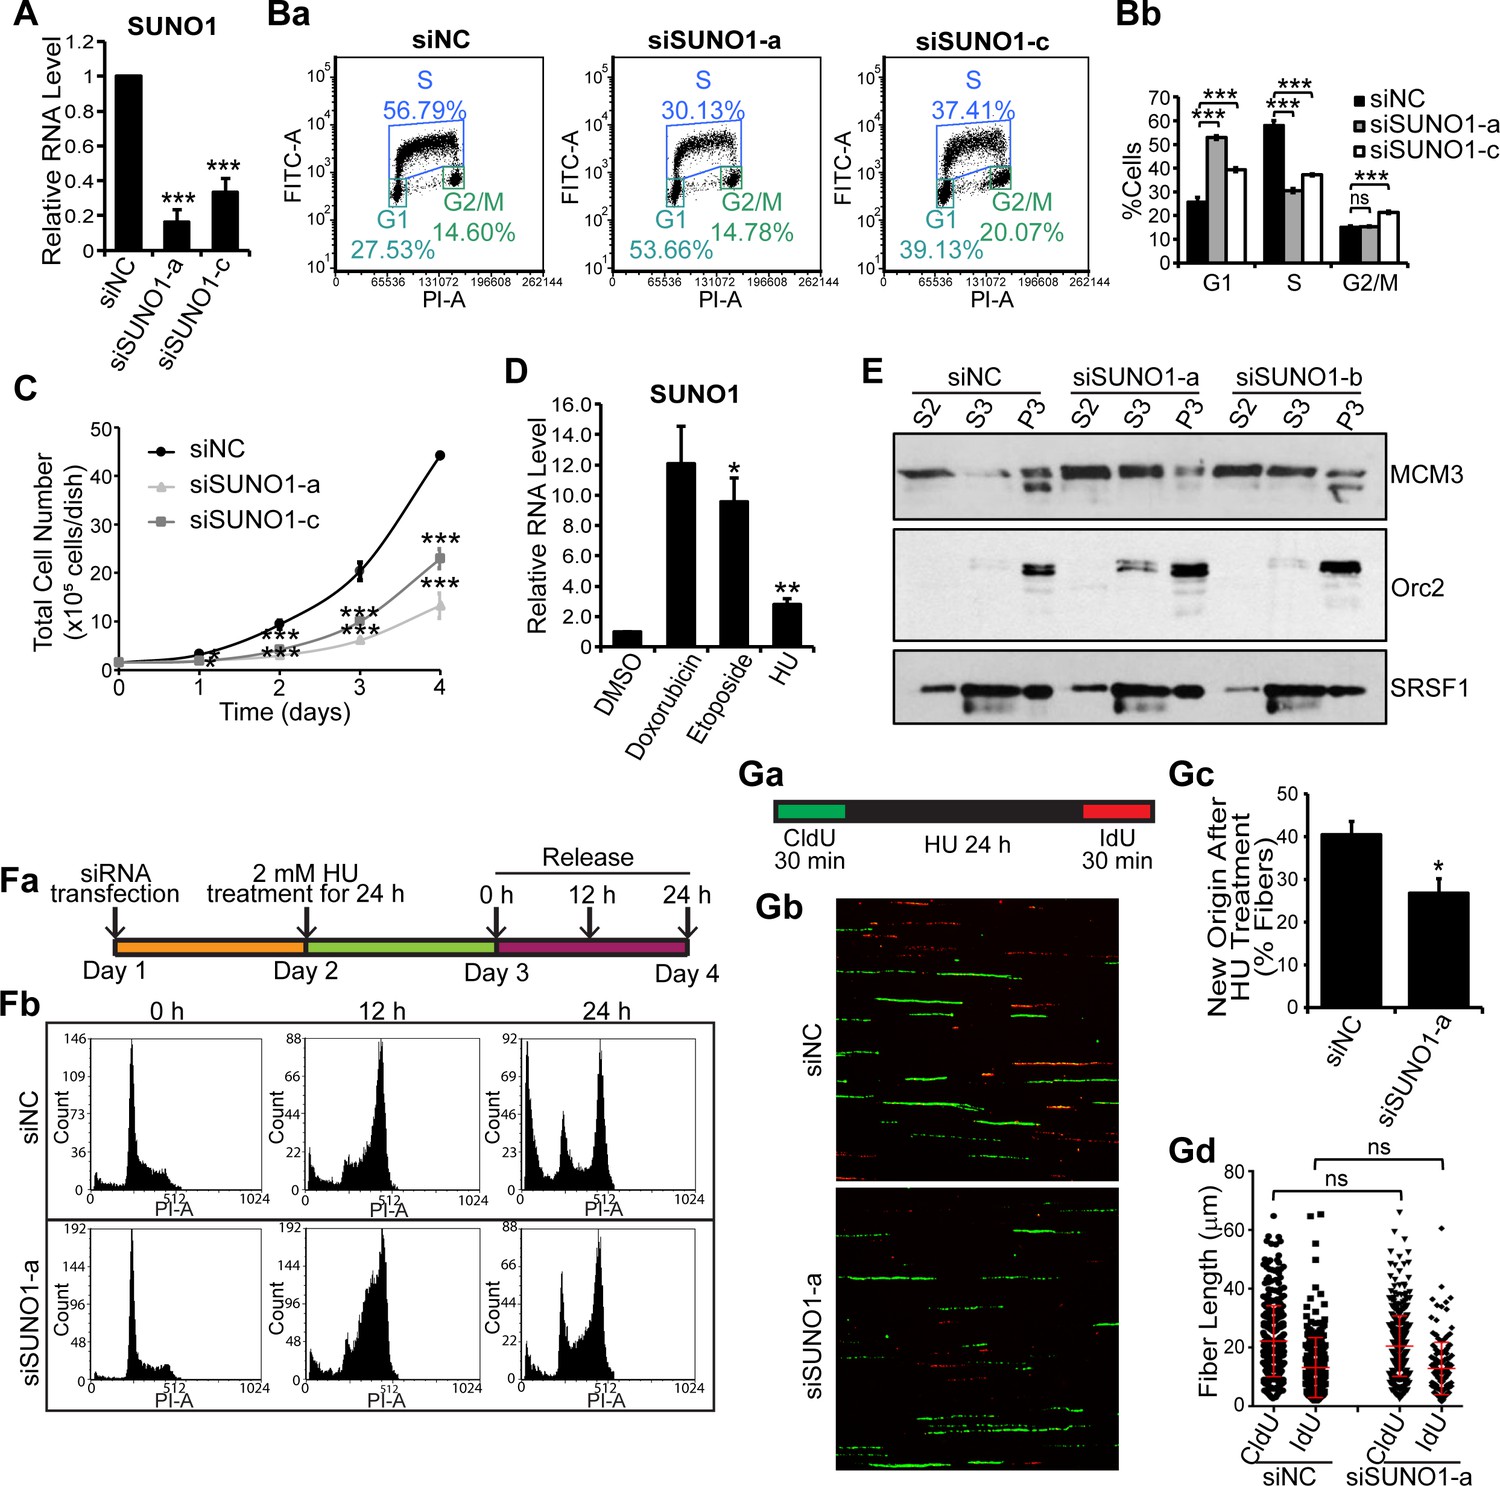
(A) RT-qPCR to quantify SUNO1 levels in control (siNC) and SUNO1-specific siRNA (a and c)-treated HCT116 cells. Data are presented as Mean ± SD, n = 3. Unpaired two-tail t-tests are performed. *p<0.05, **p<0.01, ***p<0.001. (B) BrdU-PI-flow cytometry analyses of control (siNC) and SUNO1-specific siRNA (a and c)-treated HCT116 cells. Dot graphs from one of the replicates are shown (Ba). Population of G1, S and G2/M cells are quantified (Bb). Data are presented as Mean ± SD, n = 3. Unpaired two-tail t-tests are performed. ns, not significant; *p<0.05; **p<0.01; ***p<0.001. (C) Growth curve assay of control (siNC) and SUNO1-specific siRNA (a and c)-treated HCT116 cells. Data are presented as Mean ± SD, n = 3. Unpaired two-tail t-tests are performed. *p<0.05, **p<0.01, ***p<0.001. (D) RT-qPCR to quantify SUNO1 levels in U2OS cells that are incubated with DMSO (control) and drugs (Doxorubicin [0.5 μM for 24 hr], Etoposide [20 μM for 24 hr] and Hydroxyurea [HU; 2 mM for 24 hr]), all of which induce double-strand DNA breaks. Data are presented as Mean ± SD, n = 3. Unpaired two-tail t-tests are performed. *p<0.05, **p<0.01, ***p<0.001. (E) Cellular fractionation to determine the chromatin loading of MCM3 and ORC2 in control (siNC) and SUNO1-depleted U2OS cells. S2 = cytoplasmic fraction; S3 = soluble nuclear fraction; P3 = insoluble chromatin fraction. SRSF1 is used as control. Refer to Figure 3—source data 1. (Fa) Flow chart showing the experimental plan. (Fb) PI-flow cytometry analyses to assess cell-cycle progression in U2OS cells transfected with siNC or siSUNO1-a, followed by 24 hr of 2 mM HU treatment, and released in fresh medium for 0, 12 and 24 hr. (G) Data from DNA fiber experiments in control and SUNO1-depleted U2OS cells. (Ga) DNA fiber experimental plan. DNA fiber experiments of U2OS cells treated with siNC or siSUNO1-a. U2OS cells are transfected with siNC or siSUNO1-a, pulse-labeled with CldU (green) for 30 min, followed by 24 hr of 2 mM HU treatment, and then released for 30 min in presence of IdU (red). DNA fiber spreads are prepared in biological triplicates. Representative images from one of the replicates are shown (Gb). The percentage of new origins (Gc) and the tract length of CldU and IdU fibers (Gd) are determined by counting 200 fibers per replicate. Data are presented as Mean ± SD, n = 3. Unpaired two-tail t-tests are performed. ns, not significant; *p<0.05; **p<0.01; ***p<0.001. Refer to Figure 3—source data 2.
-
Figure 3—source data 1
Uncropped images of the Western Blot in Figure 3E, Figure 3—figure supplement 2C, and Figure 3—figure supplement 3B.
- https://cdn.elifesciences.org/articles/55102/elife-55102-fig3-data1-v1.docx
-
Figure 3—source data 2
Quantification of the fiber assay in Figure 3G, Figure 3—figure supplement 2C, and Figure 3—figure supplement 3B.
- https://cdn.elifesciences.org/articles/55102/elife-55102-fig3-data2-v1.xlsx
Figure 3—figure supplement 1
Depletion of SUNO1 results in cell-cycle arrest and DNA damage.
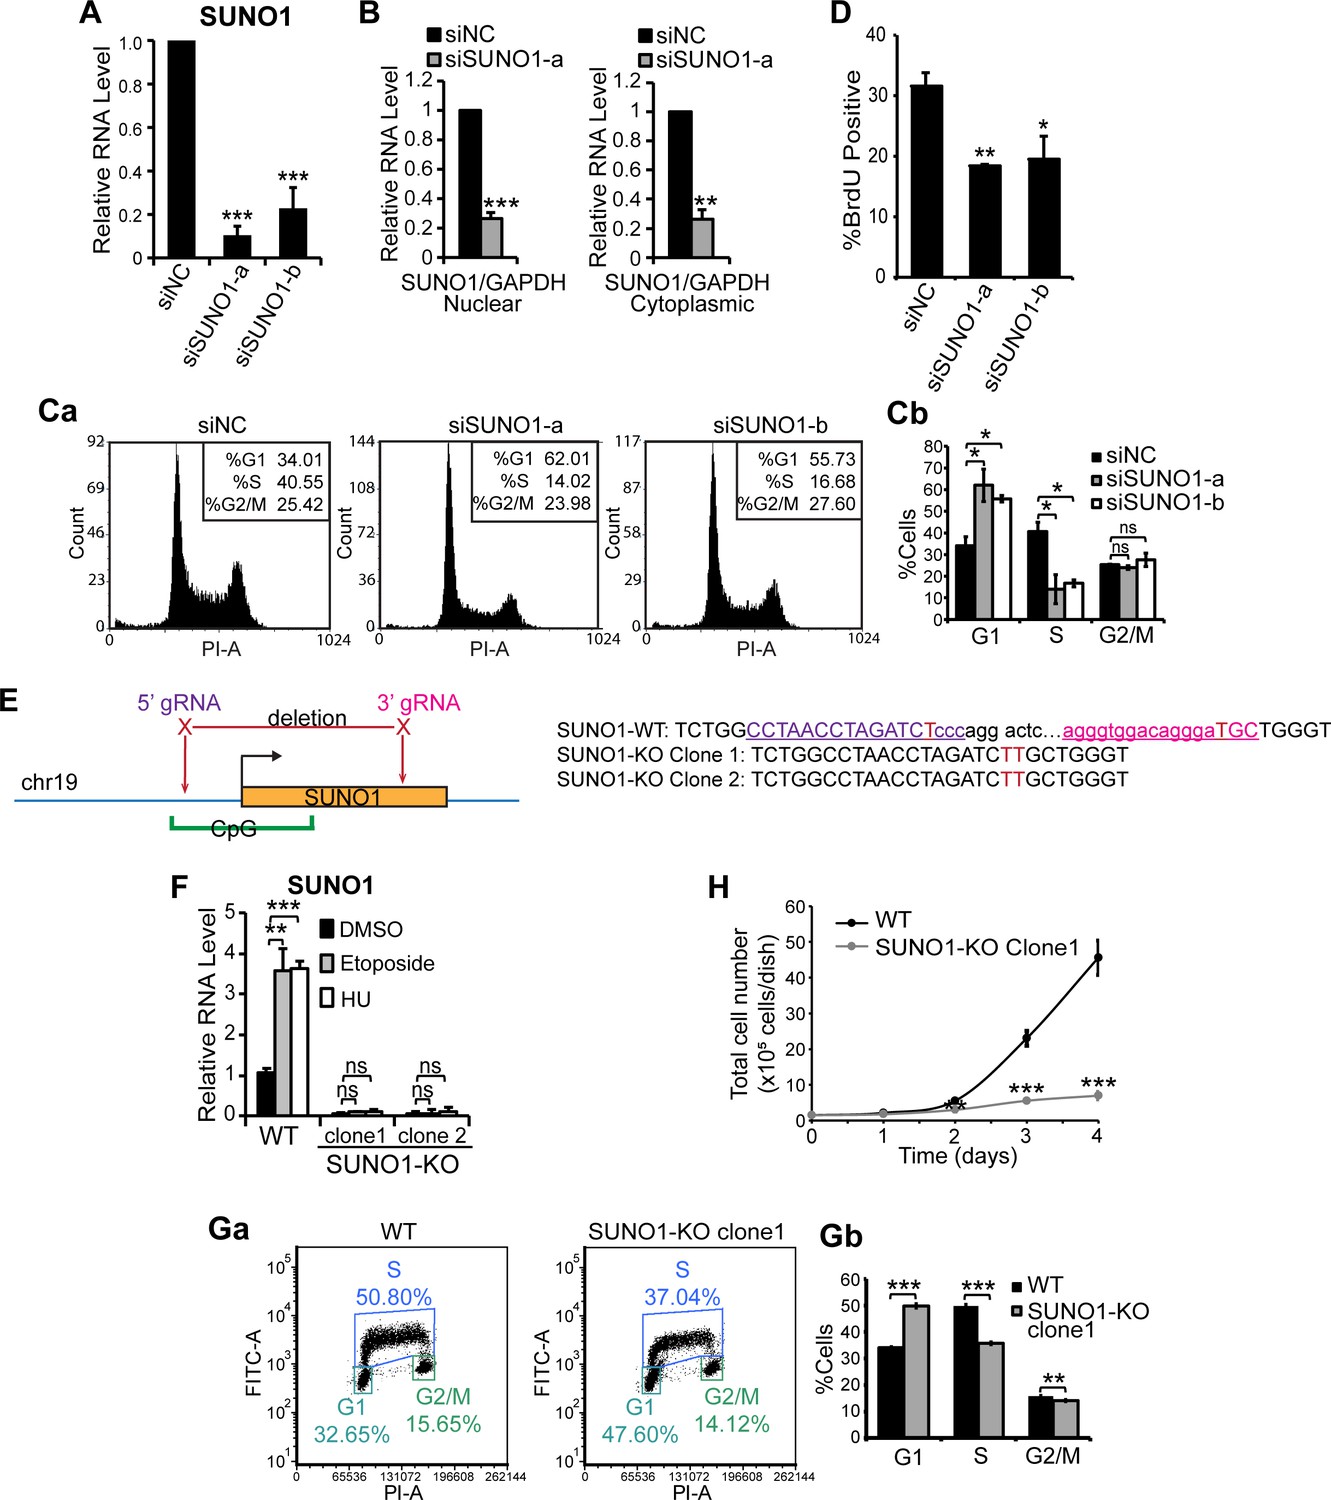
(A) RT-qPCR to quantify SUNO1 levels in control (siNC) and SUNO1-specific siRNA (a and b)-treated U2OS cells. Data are presented as Mean ± SD, n = 3. Unpaired two-tail t-tests are performed. *p<0.05, **p<0.01, ***p<0.001. (B) RT-qPCR to determine the relative levels of nuclear and cytoplasmic pool of SUNO1 in control and SUNO1-depleted WT HCT116 cells. Data are presented as Mean ± SD, n = 3. Unpaired two-tail t-tests are performed. *p<0.05, **p<0.01, ***p<0.001. (C) PI-flow cytometry analyses of control (siNC) and SUNO1-specific siRNA (a and b)-treated U2OS cells. Histograms from one of the replicates are shown (Ca). Cell-cycle statistics are presented as Mean ± SD, n = 3 (Cb). Unpaired two-tail t-tests are performed. *p<0.05, **p<0.01, ***p<0.001. (D) Percentage of BrdU positive cells of control (siNC) and SUNO1-depleted U2OS cells. Cells are incubated with 10 μM BrdU for 20 min. Data are presented as Mean ± SD, n = 200. Unpaired two-tail t-tests are performed. *p<0.05, **p<0.01, ***p<0.001. (E) Diagram showing position of two gRNAs that are used to make SUNO1 KO HCT116 and U2OS cells, and PCR sequencing of the junctions in the genomic DNA to confirm the deletion. The gRNA sequences are colored and underlined. The cutting sites of Cas9 are shown in red. The deletion in the KO clones is confirmed by PCR followed by sequencing. (F) RT-qPCR to detect the relative levels of SUNO1 in DMSO (control), Etoposide and HU-treated WT and SUNO1-KO HCT116 cells. Data are presented as Mean ± SD, n = 3. Unpaired two-tail t-tests are performed. ns, not significant; *p<0.05; **p<0.01; ***p<0.001. (G) BrdU-PI-flow cytometry analyses of WT and SUNO1-KO HCT116 cells. Dot graphs from one of the replicates are shown (Ga). Population of G1, S and G2/M cells are quantified (Gb). Data are presented as Mean ± SD, n = 3. Unpaired two-tail t-tests are performed. *p<0.05, **p<0.01, ***p<0.001. (H) Growth curve assay of WT and SUNO1-KO HCT116 cells. Data are presented as Mean ± SD, n = 3. Unpaired two-tail t-tests are performed. *p<0.05, **p<0.01, ***p<0.001.
Figure 3—figure supplement 2
SUNO-1depleted cells show DNA damage.
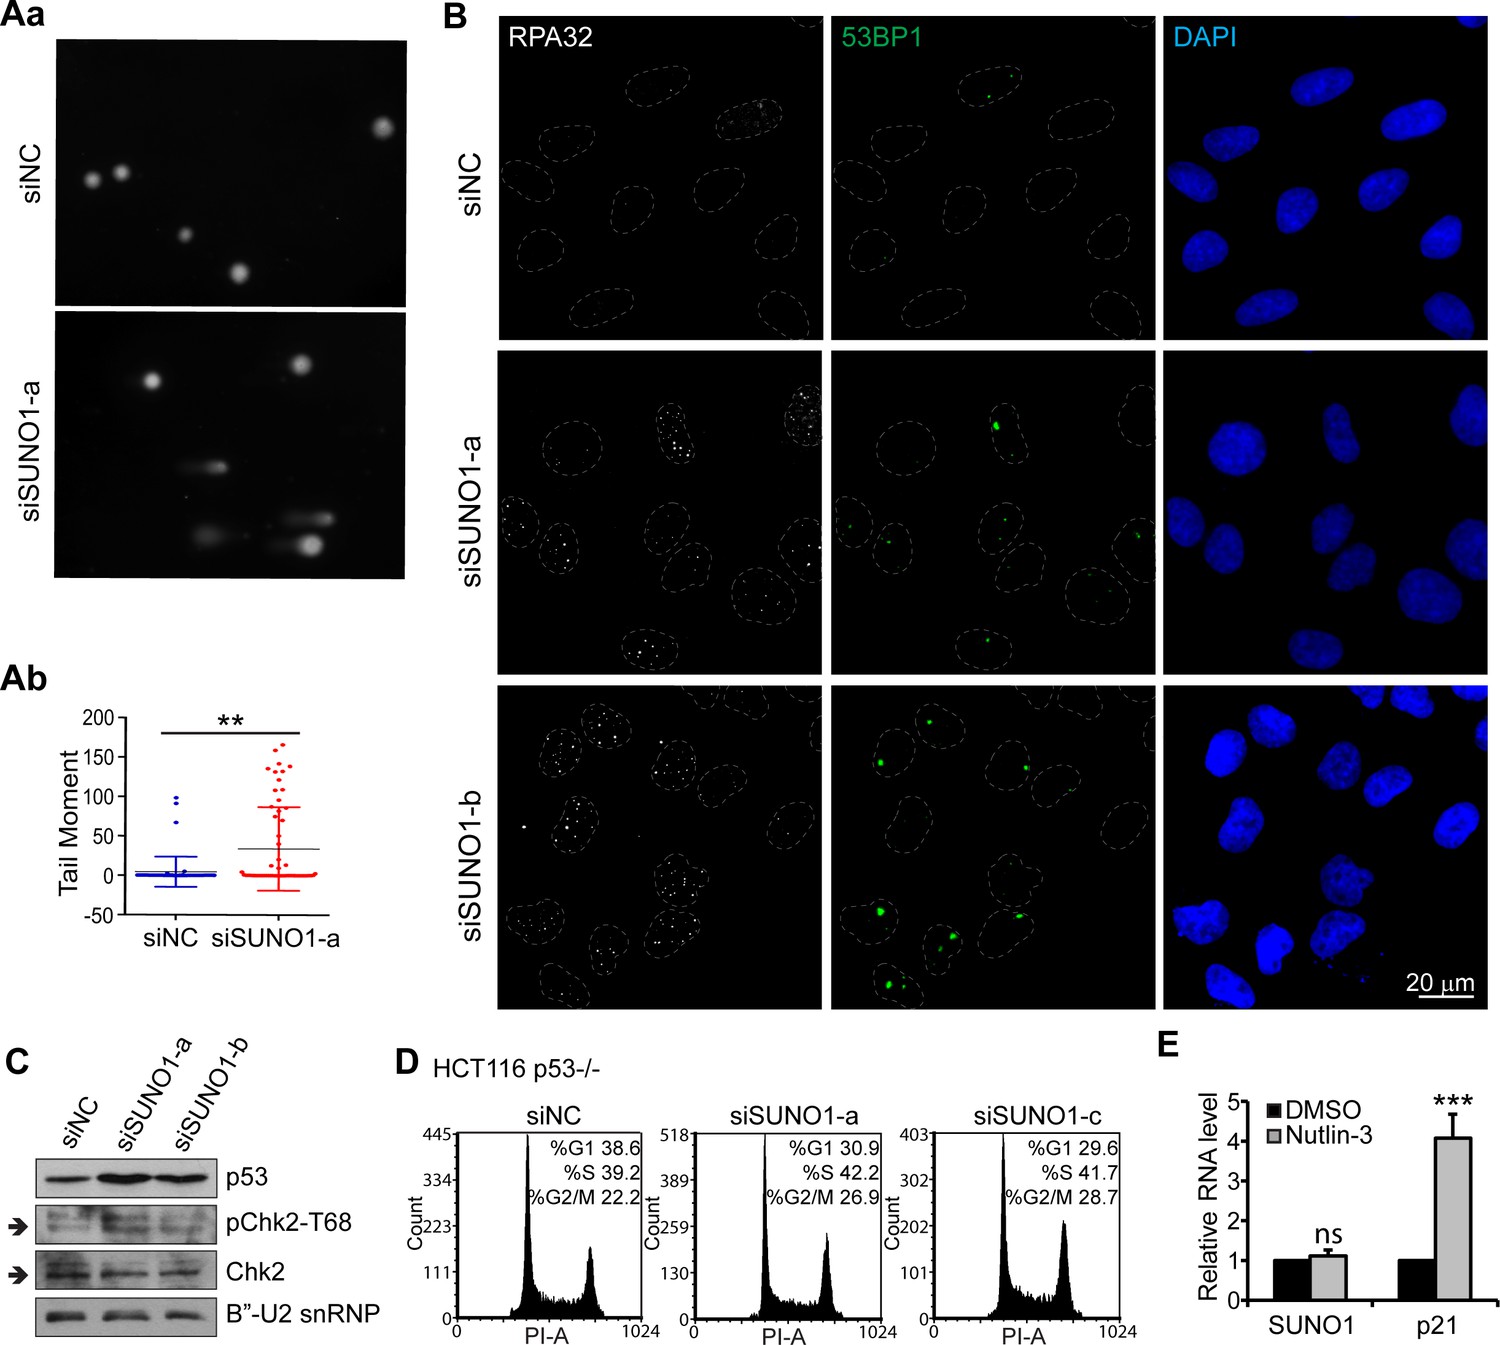
(A) Alkaline comet tail assay in control and SUNO1-depleted U2OS cells. A representative image is shown (Aa). Quantifications are shown (Ab) as Mean ± SD, n = 60 cells. Mann-Whitney test was performed. *p<0.05, **p<0.01, ***p<0.001. (B) Immunofluorescence staining to detect RPA32 and 53BP1 nuclear foci in control and SUNO1-depleted U2OS cells. Scale bar: 20 μm. (C) Immunoblot to detect p53, Chk2, and pChk2 (T68) levels in control and SUNO1-depleted U2OS cells. B’-U2snRNP is used as loading control. Refer to Figure 3—source data 1. (D) PI-flow cytometry data of control and SUNO1-depleted p53-/- HCT116 cells. (E) RT-qPCR to determine the relative levels of SUNO1, and p21 mRNA in control and Nutlin-3-incubated U2OS cells. Data are presented as Mean ± SD, n = 3. Unpaired two-tail t-tests are performed. *p<0.05, **p<0.01, ***p<0.001.
Figure 3—figure supplement 3
SUNO1-depleted cells are sensitive to drug-induced DNA damage.
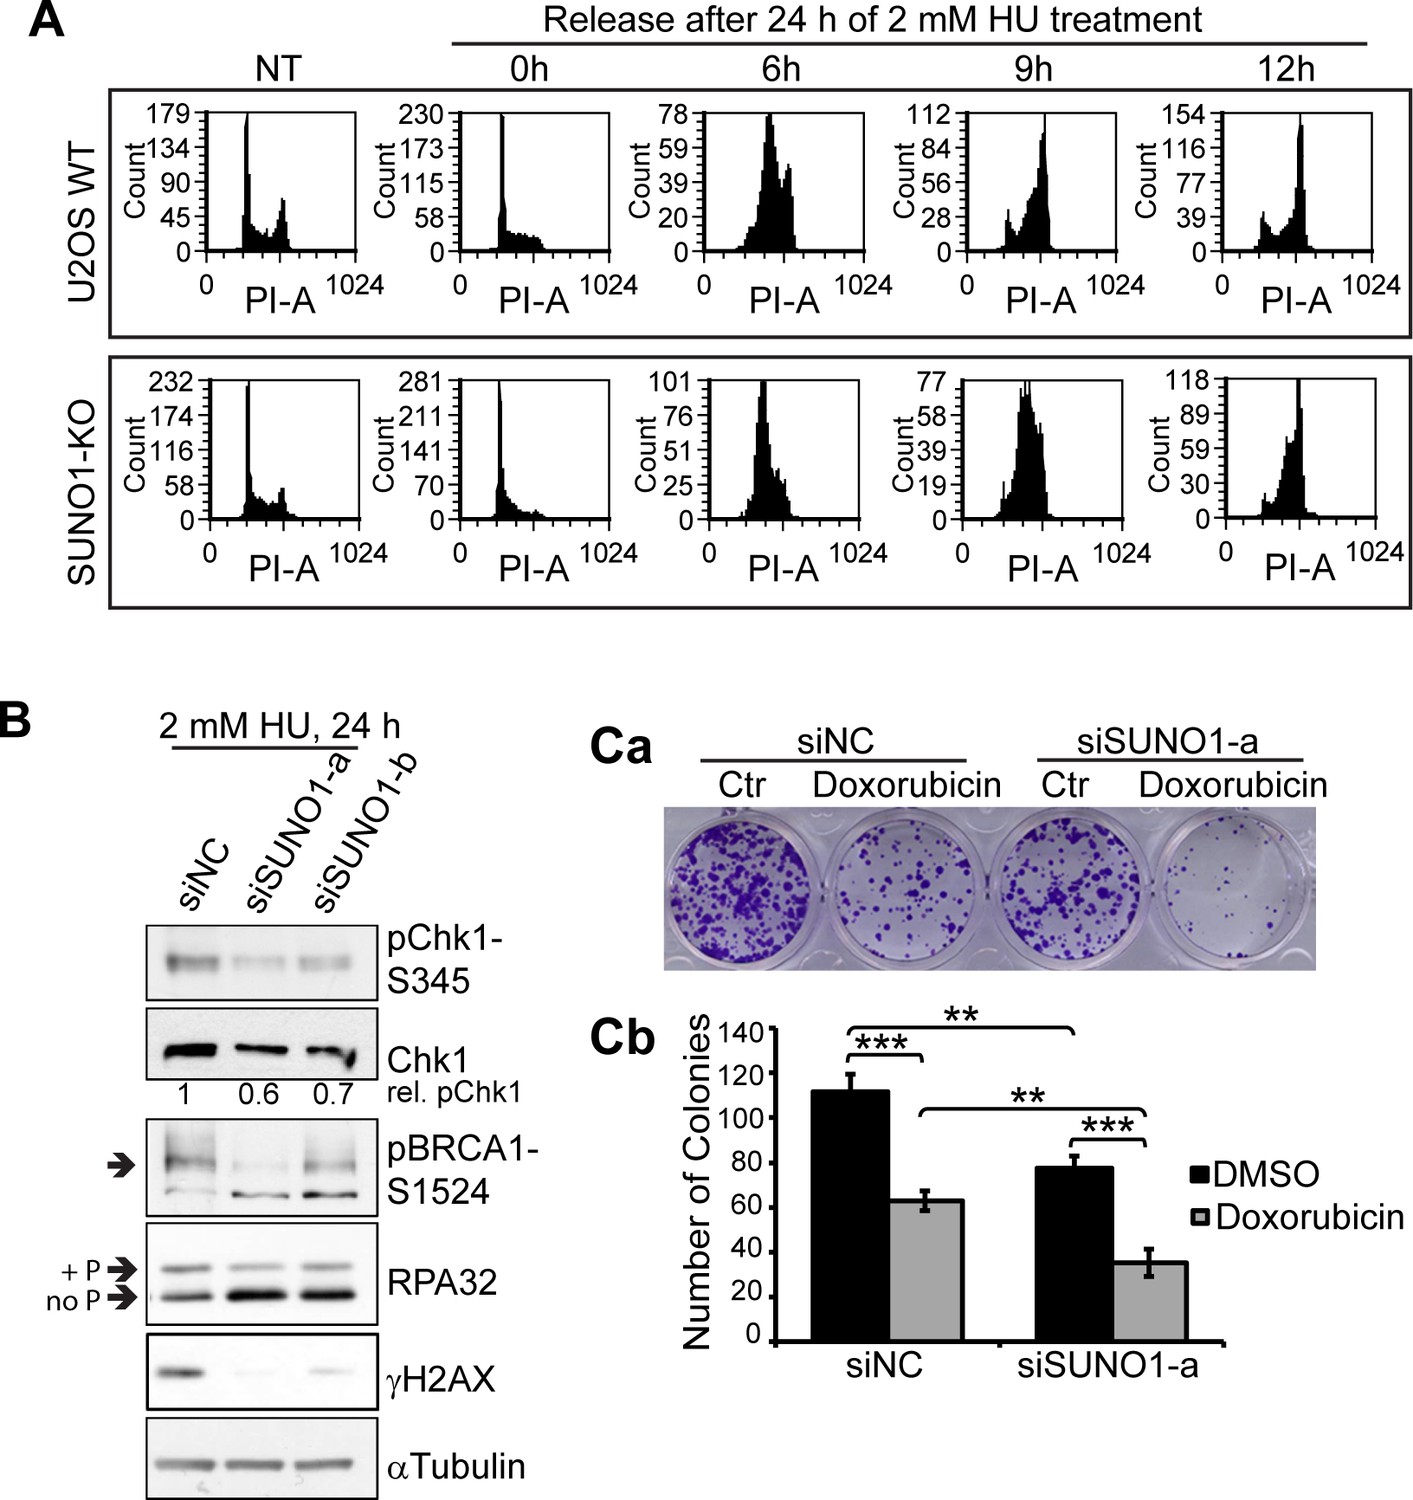
(A) PI-flow cytometry analyses to assess the cell-cycle progression in WT and SUNO1-KO U2OS cells that are non-HU-treated (NT) as well as the cells that are incubated for 24 hr in 2 mM HU, and released in fresh medium for 0, 6, 9, and 12 hr. (B) Immunoblot assays to detect the specified protein levels in control and SUNO1-depleted U2OS cells. α-tubulin is used as loading control. Refer to Figure 3—source data 1. (Ca–b) Anchorage-dependent long-term plastic colony cell proliferation assay of control and SUNO1-depleted HCT116 cells that were incubated with DMSO or Doxorubicin. Data are presented as Mean ± SD, n = 3. Unpaired two-tail t-tests are performed. *p<0.05, **p<0.01, ***p<0.001.
Figure 4 with 2 supplements

SUNO1 promotes cell proliferation by regulating the expression of WTIP, a positive regulator of YAP1.
(Aa) Venn diagram showing significantly downregulated genes in SUNO1-depleted wild-type (WT) HCT116 cells (36 and 76 hr post siRNA treatment). 149 common genes showed significant downregulation at both early (36 hr) and late (72 hr) time points post SUNO1 depletion. (Ab) Gene ontology (GO) analysis of all of the genes downregulated after 36 hr post SUNO1 knockdown. (B) RT-qPCR to show the levels of several YAP1 target gene mRNAs in control and SUNO1-depleted WT HCT116 cells. Data are presented as Mean ± SD, n = 3. Unpaired two-tail t-tests are performed. *p<0.05, **p<0.01, ***p<0.001. (C) Western blot to detect WTIP, Cyclin D1, YAP1, LATS1, pLATS1, TAZ, and CTGF in control and SUNO1-depleted WT HCT116 cell. B’-U2 snRNP and β-actin are used as loading control. Refer to Figure 4—source data 1. (D) Immunofluorescence staining to assess the cellular localization of YAP1 coupled with EdU incorporation assay. Cells in S-phase were labeled by EdU. Scale bar: 10 μm. (E) CTGF promoter luciferase assay. WT CTGF promoter (WT) or TEAD-binding sites mutated CTGF promoter (mutant) were cloned upstream of the luciferase reporter gene. WT or mutant reporters are transfected into control and SUNO1-depleted (siSUNO1-a or siSUNO1-b) U2OS cells, and the relative luciferase activity is quantified. Data are presented as Mean ± SD, n = 3. Unpaired two-tail t-tests are performed. ns, not significant; *p<0.05; **p<0.01; ***p<0.001. (Fa) Diagram showing relative genomic position of SUNO1 and other genes near SUNO1 locus. (Fb) RT-qPCR to show the relative mRNA levels from SUNO1 and other genes that are located in the genomic proximity of SUNO1 gene locus in control and SUNO1-depleted WT HCT116 cells. Data are presented as Mean ± SD, n = 3. Unpaired two-tail t-tests are performed. *p<0.05, **p<0.01, ***p<0.001.
-
Figure 4—source data 1
Uncropped images of the Western Blot in Figure 4C, Figure 4—figure supplement 1F, and Figure 4—figure supplement 2A.
- https://cdn.elifesciences.org/articles/55102/elife-55102-fig4-data1-v1.docx
Figure 4—figure supplement 1
SUNO1-depleted cells show defects in cell proliferation by downregulating the levels of YAP1 target genes.
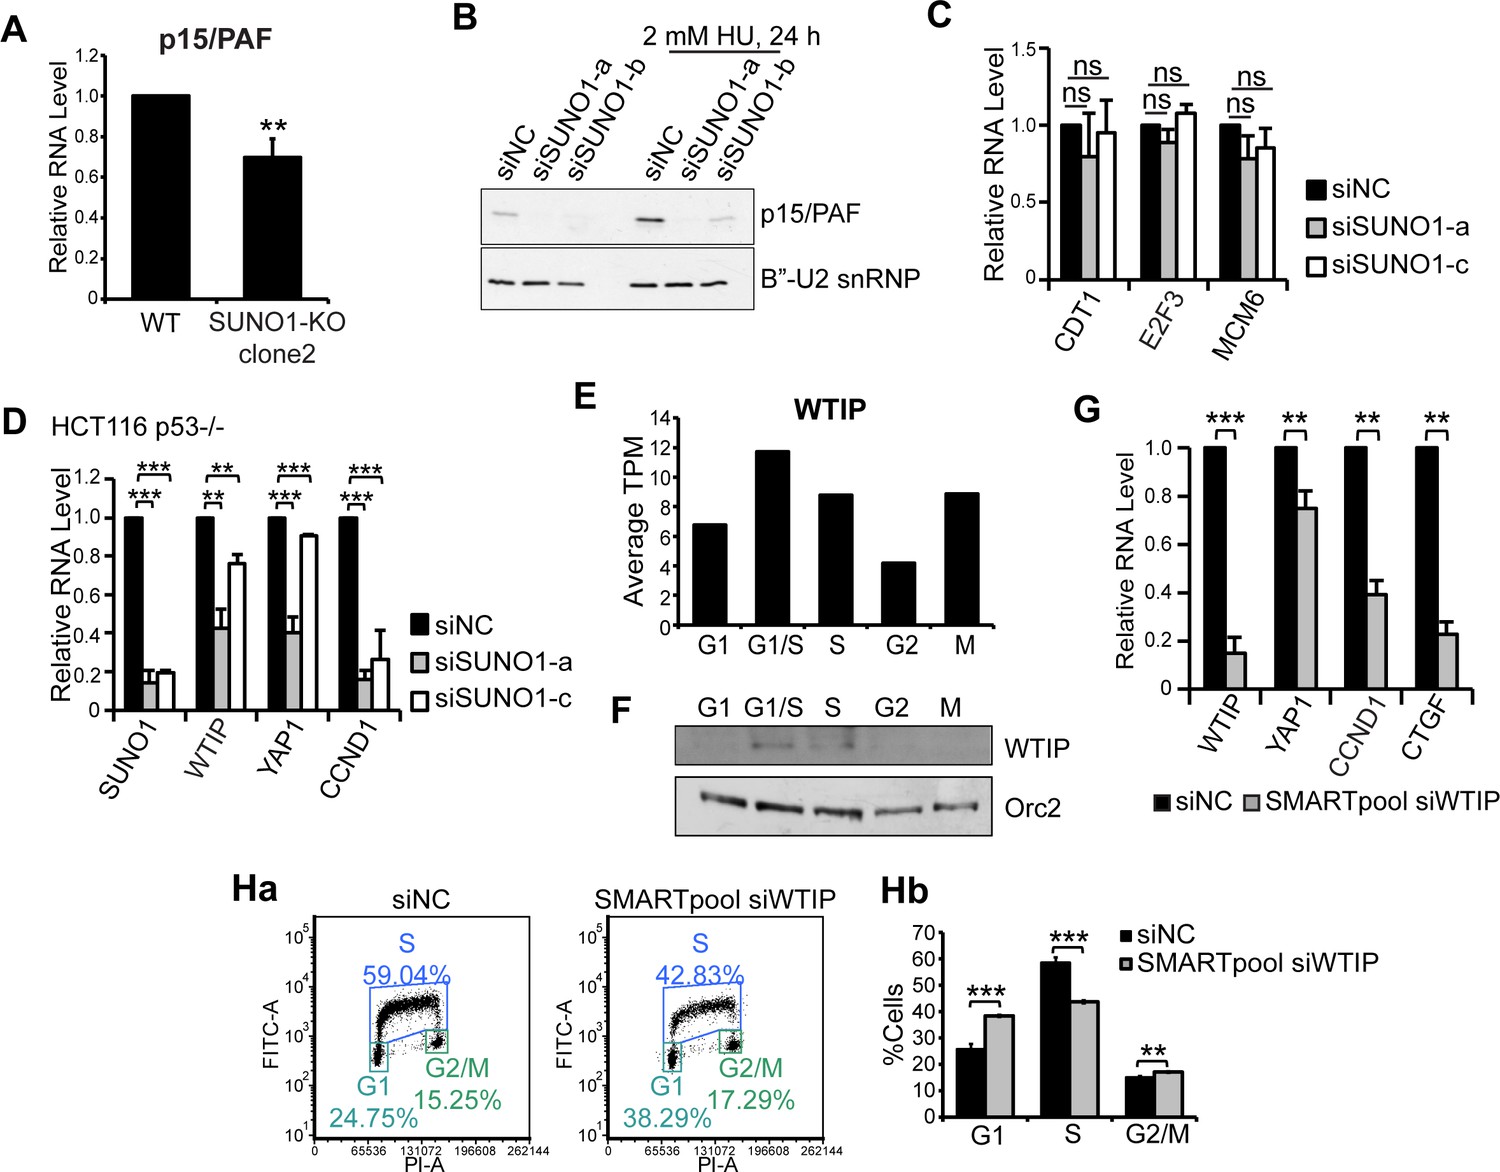
(A) RT-qPCR to detect the relative levels of p15/PAF mRNA in WT and SUNO1-KO HCT116 cells. Data are presented as Mean ± SD, n = 3. Unpaired two-tail t-tests are performed. *p<0.05, **p<0.01, ***p<0.001. (B) Immunoblot to detect the levels of p15/PAF in untreated and HU-treated control and SUNO1-depleted U2OS cells. B’-U2snRNP is used as loading control. Please note increased levels of p15/PAF in HU-treated control (siNC) cells versus un-treated control cells. (C) RT-qPCR to detect relative levels of several indicated E2F1 target mRNAs in control and SUNO1-depleted WT HCT116 cells. Data are presented as Mean ± SD, n = 3. Unpaired two-tail t-tests are performed. ns, not significant. (D) RT-qPCR assays to detect the relative levels of indicated gene RNAs in control and SUNO1-depleted p53-/- HCT116 cells. Data are presented as Mean ± SD, n = 3. Unpaired two-tail t-tests are performed. *p<0.05, **p<0.01, ***p<0.001. (E) Average TPM of WTIP in the cell-cycle RNA-seq data. (F) Immunoblot assays to detect the expression of WTIP protein during cell cycle. ORC2 is used as loading control. Refer to Figure 4—source data 1. (G) RT-qPCR to detect the relative levels of indicated gene mRNAs in control and WTIP-depleted WT HCT116 cells. Data are presented as Mean ± SD, n = 3. Unpaired two-tail t-tests are performed. *p<0.05, **p<0.01, ***p<0.001. (H) BrdU-PI-flow cytometry analyses of control (siNC) and WTIP-depleted (SMARTpool siWTIP) HCT116 cells. Dot graphs from one of the replicates are shown (Ha). Population of G1, S and G2/M cells are quantified (Hb). Data are presented as Mean ± SD, n = 3. Unpaired two-tail t-tests are performed. *p<0.05, **p<0.01, ***p<0.001. .
Figure 4—figure supplement 2
Stable overexpression of WTIP partially rescues the cell-cycle phenotype caused by SUNO1 depletion.
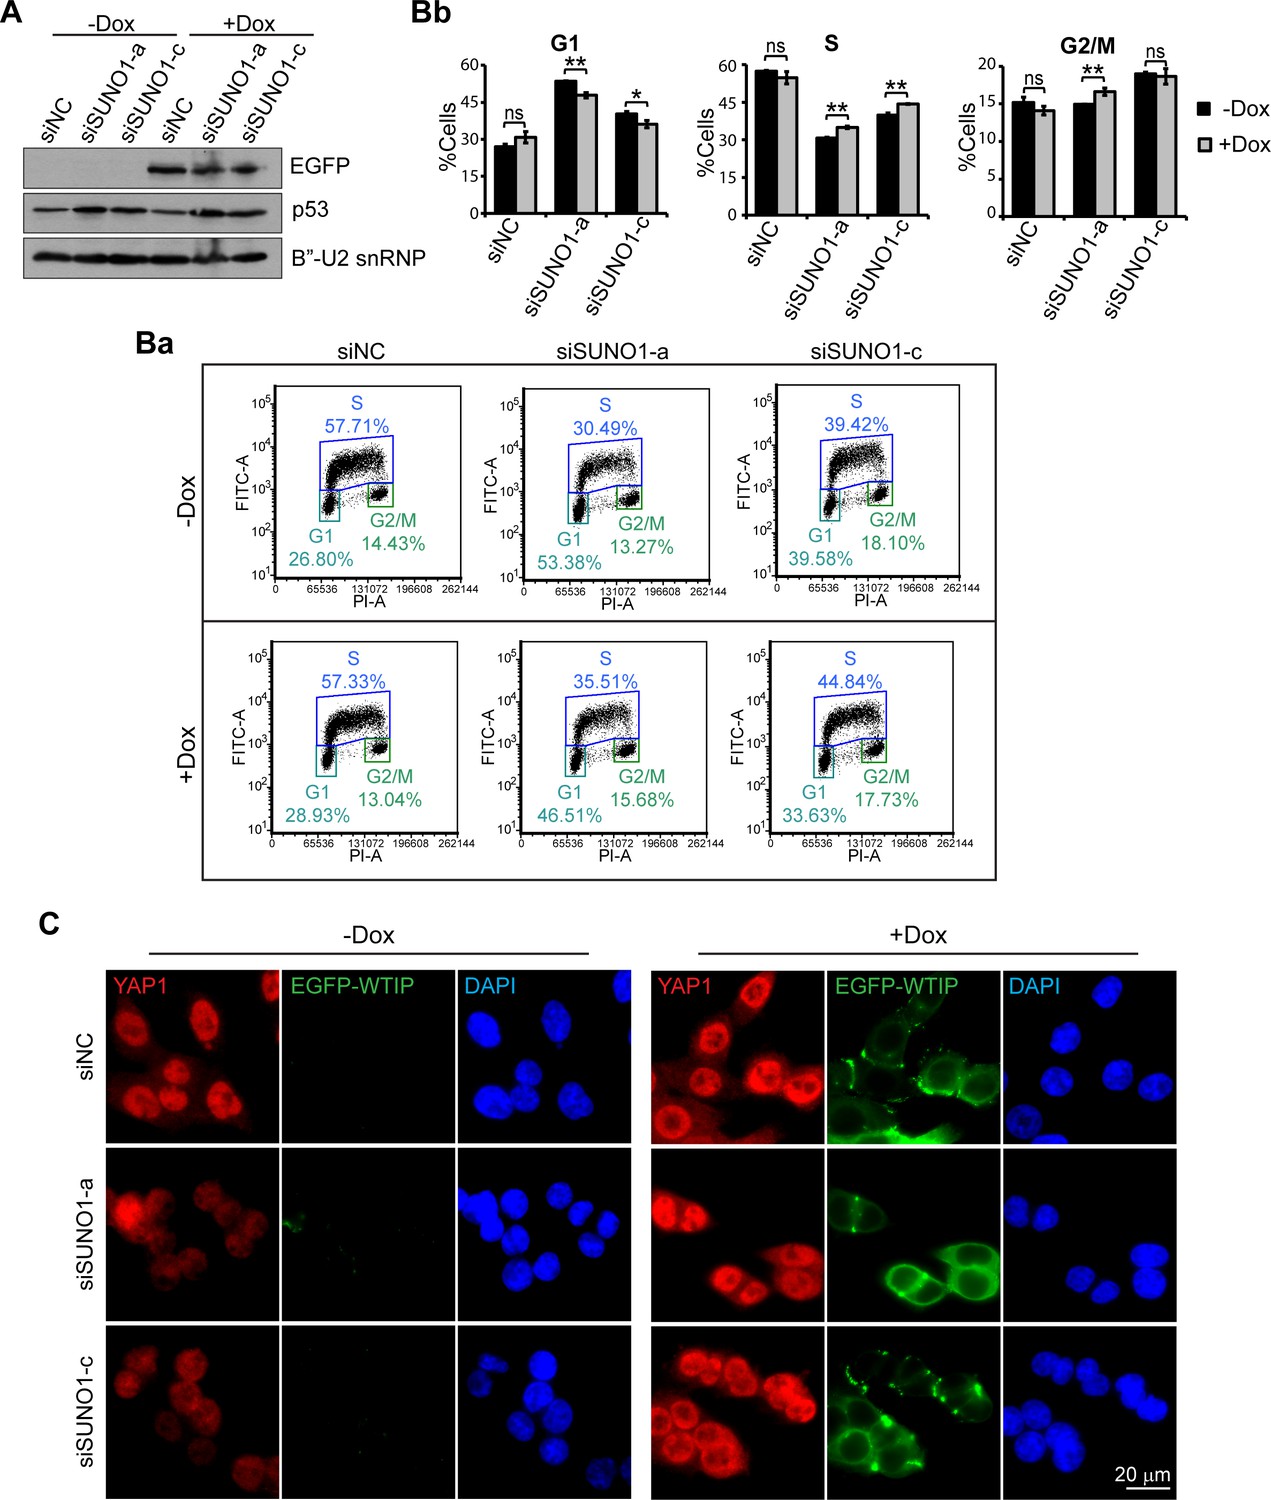
(A) Immunoblot to detect EGFP-WTIP and p53 levels in control and SUNO1-depleted HCT116 cells with or without doxycycline (Dox) to induce the expression of EGFP-WTIP. B’-U2snRNP is used as loading control. Refer to Figure 4—source data 1. (B) BrdU-PI-flow cytometry analyses of control and SUNO1-depleted HCT116 cells with or without induction of EGFP-WTIP. Dot graphs from one of the replicates are shown (Ba). Population of G1, S and G2/M cells are quantified (Bb). Data are presented as Mean ± SD, n = 3. Unpaired two-tail t-tests are performed. ns, not significant; *p<0.05; **p<0.01; ***p<0.001. (C) Immunofluorescence staining to detect YAP1 (red) in control and SUNO1-depleted HCT116 cells with or without the induction of EGFP-WTIP (green). Scale bar: 20 μm.
Figure 5 with 2 supplements
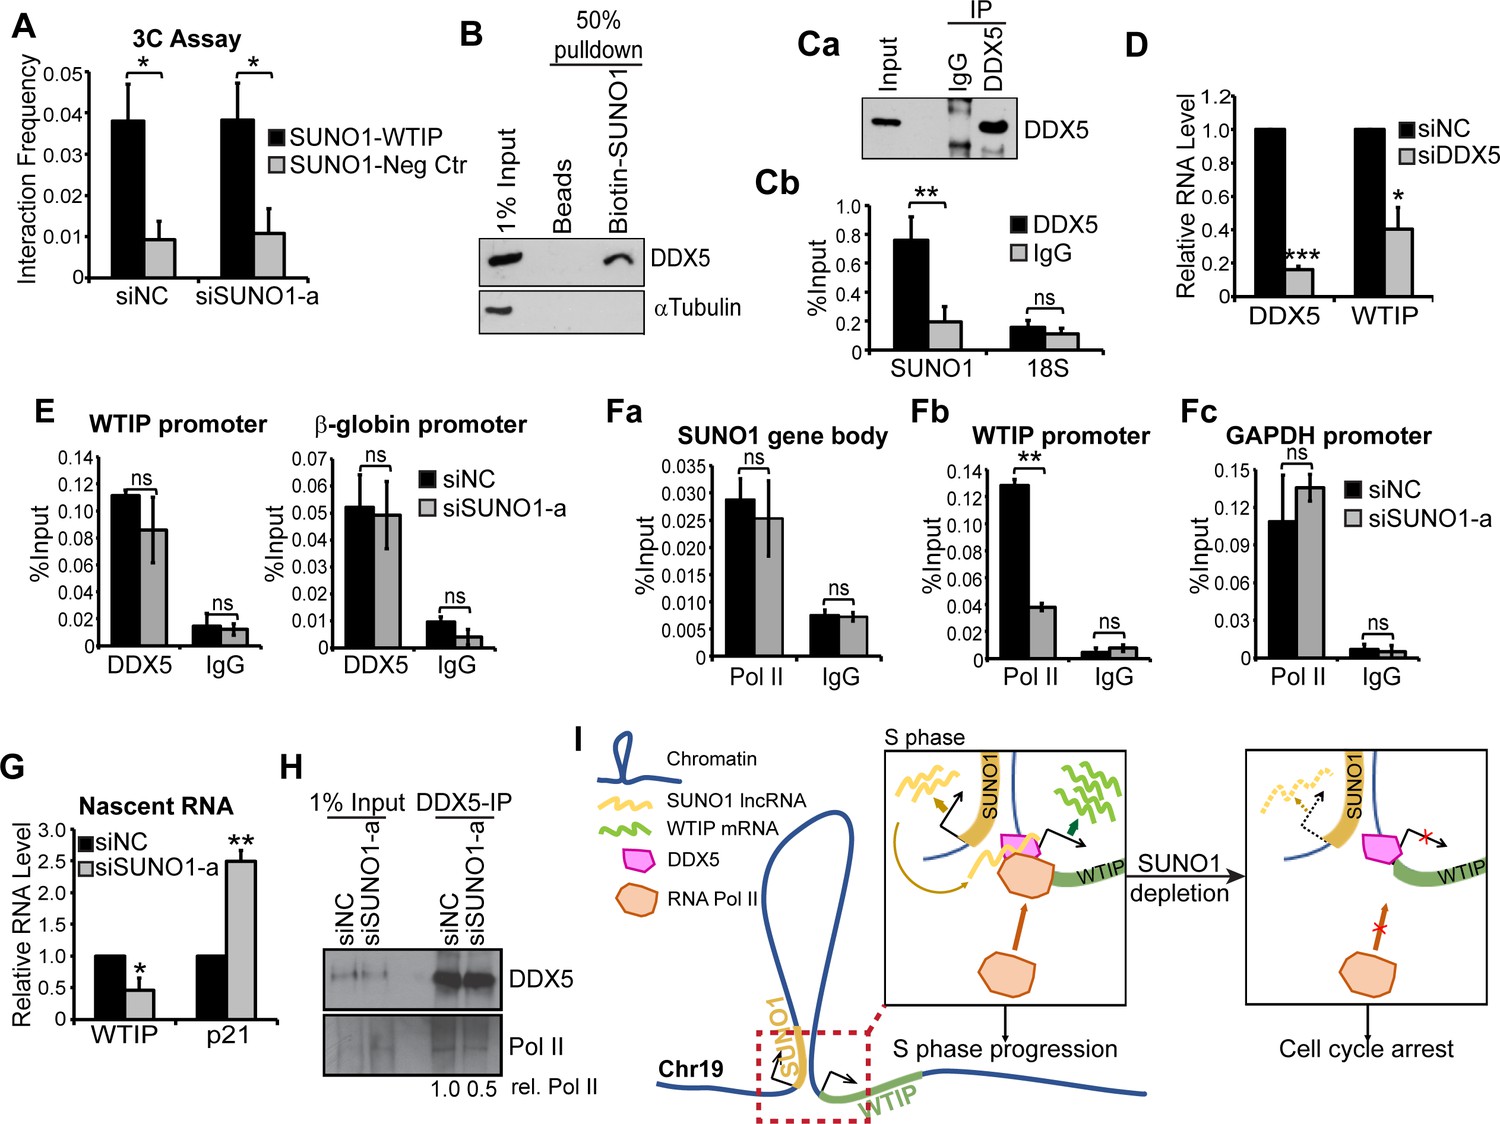
SUNO1 promotes WTIP transcription by stabilizing the interaction between DDX5 and RNA polymerase II on chromatin.
(A) 3C analyses to quantify the physical interaction frequency between SUNO1 and WTIP genes in presence or absence of SUNO1 RNA in WT HCT116 cells. Data are presented as Mean ± SD, n = 2. Unpaired one-tail t-tests are performed. *p<0.05, **p<0.01, ***p<0.001. (B) Western blot analysis to detect DDX5 and αTubulin in biotinylated RNA pulldown of SUNO1 in WT HCT116 cells. αTubulin serves as a negative control. (C) DDX5-RIP in WT HCT116 cells followed by (Ca) western blot to detect DDX5 and (Cb) RT-qPCR to quantify the levels of SUNO1 and 18S rRNA. 18S rRNA serves as a negative control for the binding of DDX5 to non-specific RNAs. Data are presented as Mean ± SD, n = 3. Unpaired two-tail t-tests are performed. ns, not significant; *p<0.05; **p<0.01; ***p<0.001. (D) RT-qPCR to quantify relative levels of DDX5 and WTIP mRNAs in control and DDX5-depleted WT HCT116 cells. Data are presented as Mean ± SD, n = 3. Unpaired two-tail t-tests are performed. *p<0.05, **p<0.01, ***p<0.001. (E) DDX5 ChIP-qPCR to quantify DDX5 association at the WTIP and β-globin promoter in control and SUNO1-depleted cells. IgG ChIP-qPCR on the same target genes serves as negative control. Data are presented as Mean ± SD, n = 3. Unpaired two-tail t-tests are performed. ns, not significant. (F) RNA pol II ChIP-qPCR to quantify RNA pol II association at the SUNO1 gene body (Fa), WTIP promoter (Fb), and GAPDH promoter (Fc) in control and SUNO1-depleted cells. IgG ChIP-qPCR on the same target genes serves as negative control. Data are presented as Mean ± SD, n = 3. Unpaired two-tail t-tests are performed. ns, not significant; *p<0.05; **p<0.01; ***p<0.001. (G) Click-iT nascent RNA capture assays followed by RT-qPCR to quantify relative pre-mRNA levels of WTIP and p21 in control versus SUNO1-depleted WT HCT116 cells. Note: increased levels of p21 nascent RNA (a direct target of p53) in SUNO1-depleted cells confirm DNA-damage-induced p53-mediated check-point activation upon SUNO1 depletion. Data are presented as Mean ± SD, n = 3. Unpaired two-tail t-tests are performed. *p<0.05, **p<0.01, ***p<0.001. (H) DDX5-IP on chromatin followed by DDX5 and RNA pol II immunoblot assays to detect the relative levels of RNA pol II that are associated with DDX5 on chromatin in control and SUNO1-depleted WT HCT116 cells. (I) Model depicting the mode of action of SUNO1 in regulating the transcription of WTIP. During S-phase, enhanced levels of SUNO1 lncRNA promotes WTIP transcription by stabilizing the chromatin interactions between DDX5 and RNA pol II on promoters of genes such as WTIP. In the absence of SUNO1, WTIP transcription is compromised due to defects in the loading of RNA pol II.
Figure 5—figure supplement 1
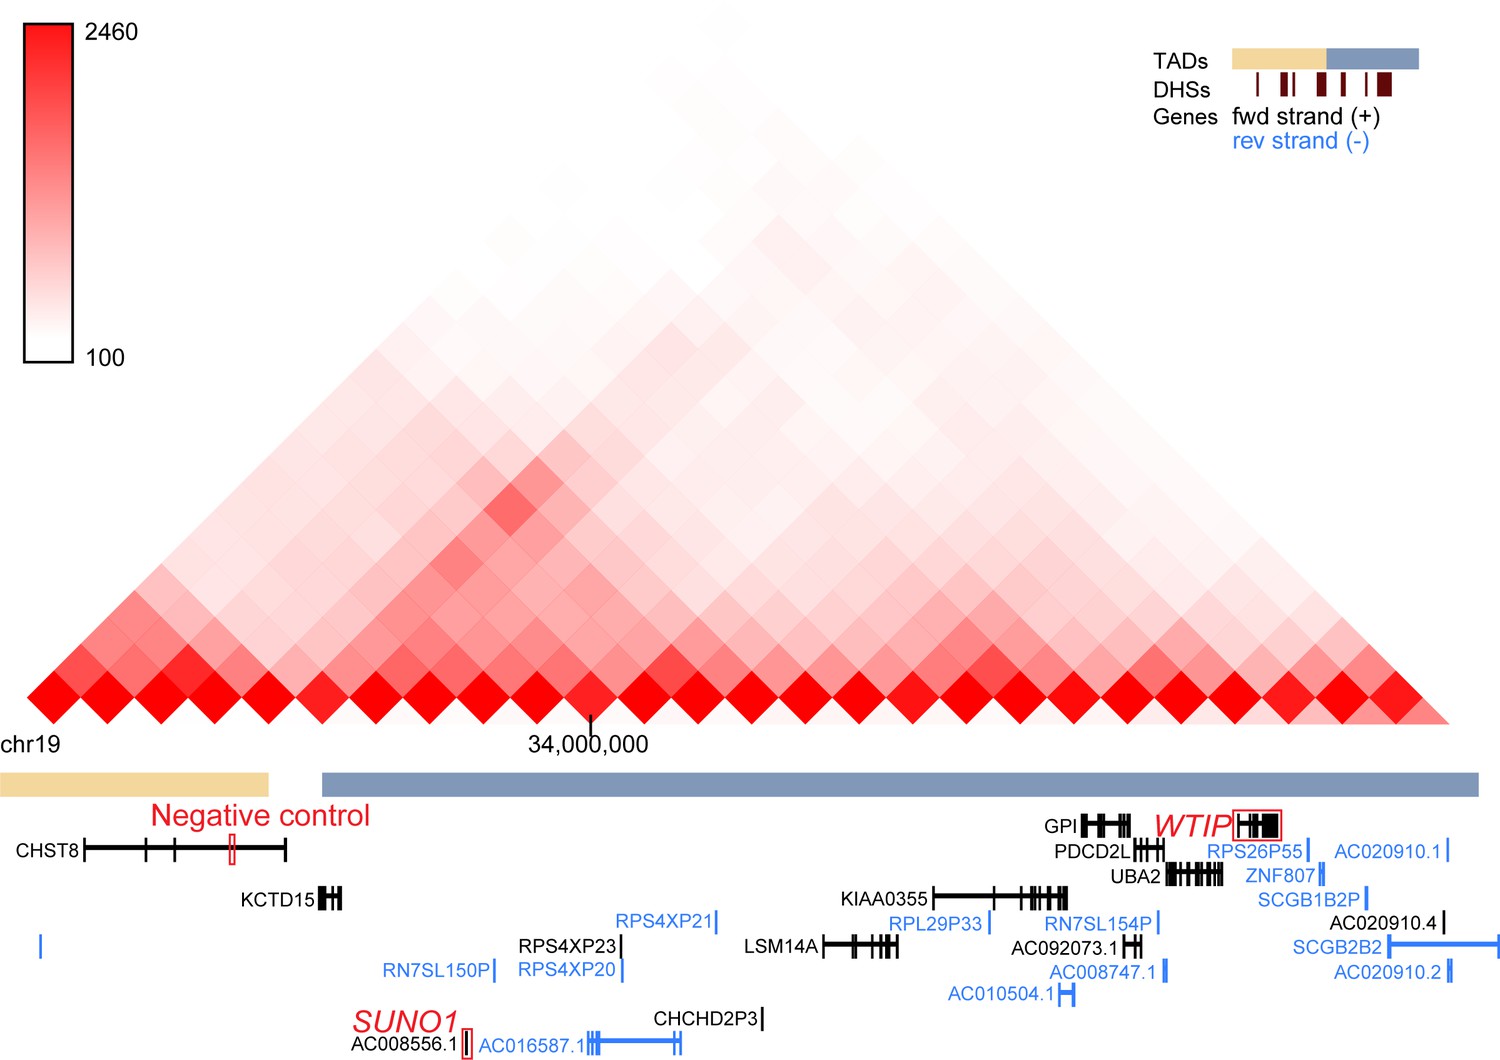
SUNO1 and WTIP locate in a single TAD. Hi-C data covering SUNO1, WTIP, and the negative control genomic loci in HCT116 cells (Rao et al., 2017; GSE104334) is visualized by 3D Genome Browser (http://promoter.bx.psu.edu/hi-c/view.php).
Figure 5—figure supplement 2
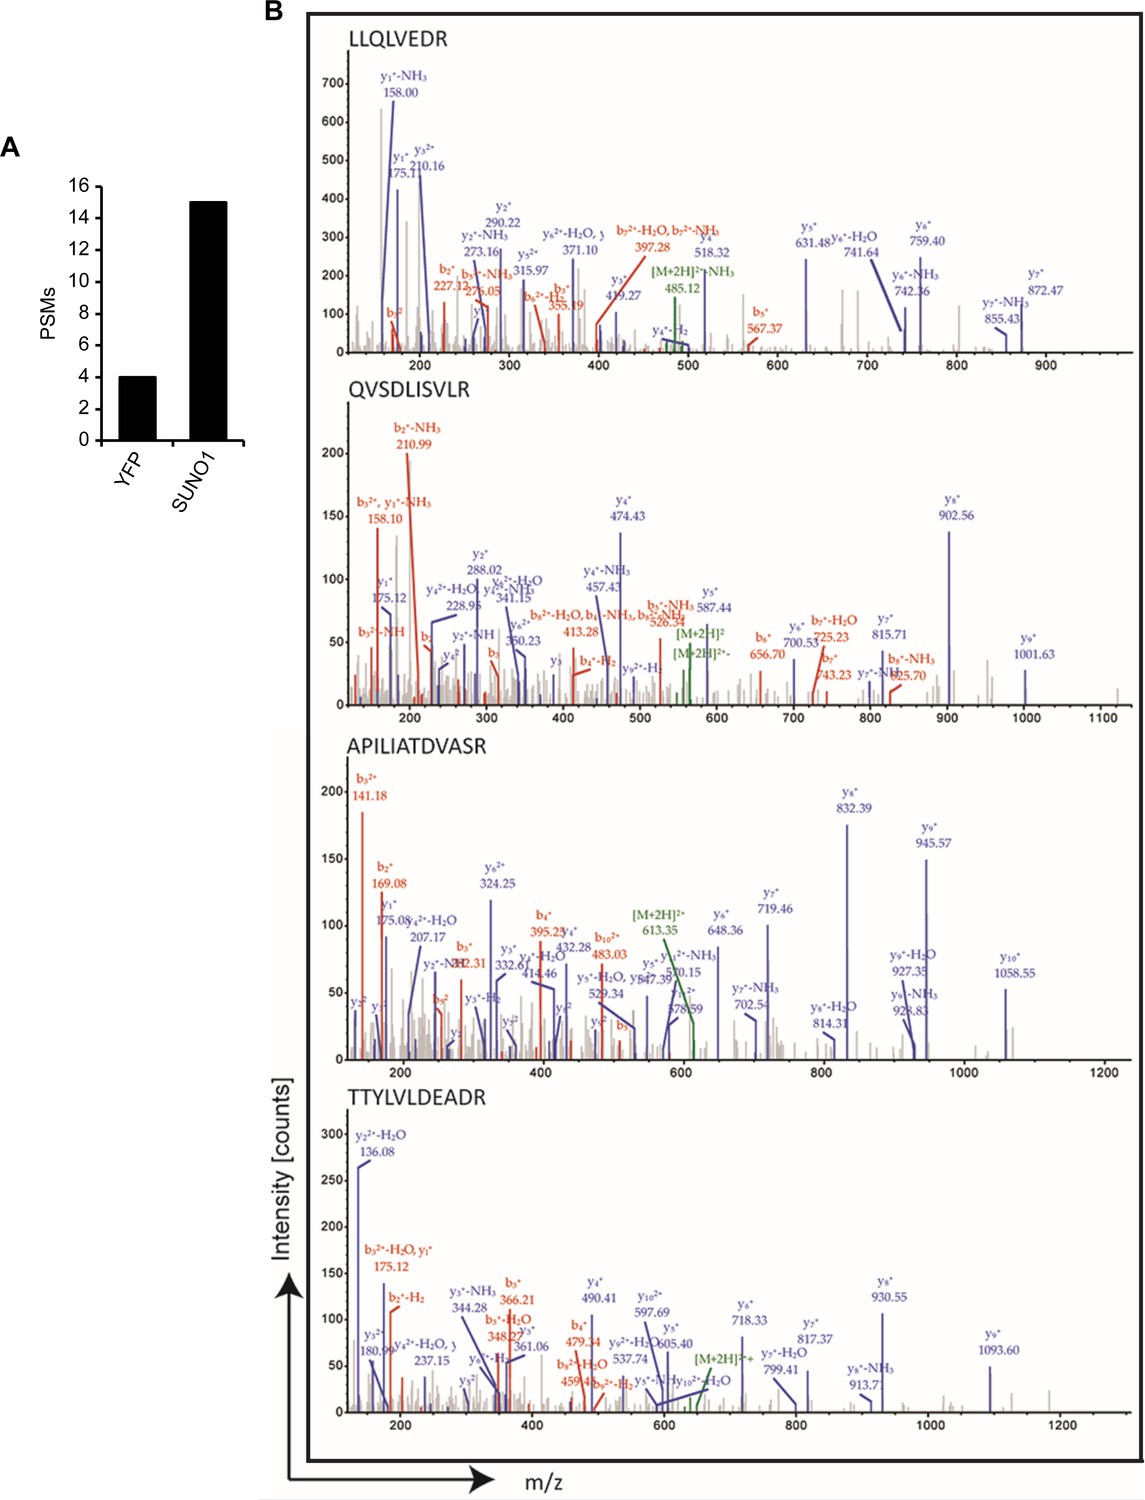
SUNO1 interacts with DDX5.
(A) Peptide spectrum matches (PSMs) corresponding to DDX5 in the YFP and SUNO1 biotinylated RNA pulldowns from mass spectrometry analysis. (B) MS/MS spectrum for the peptides from DDX5 protein.
Figure 6 with 1 supplement
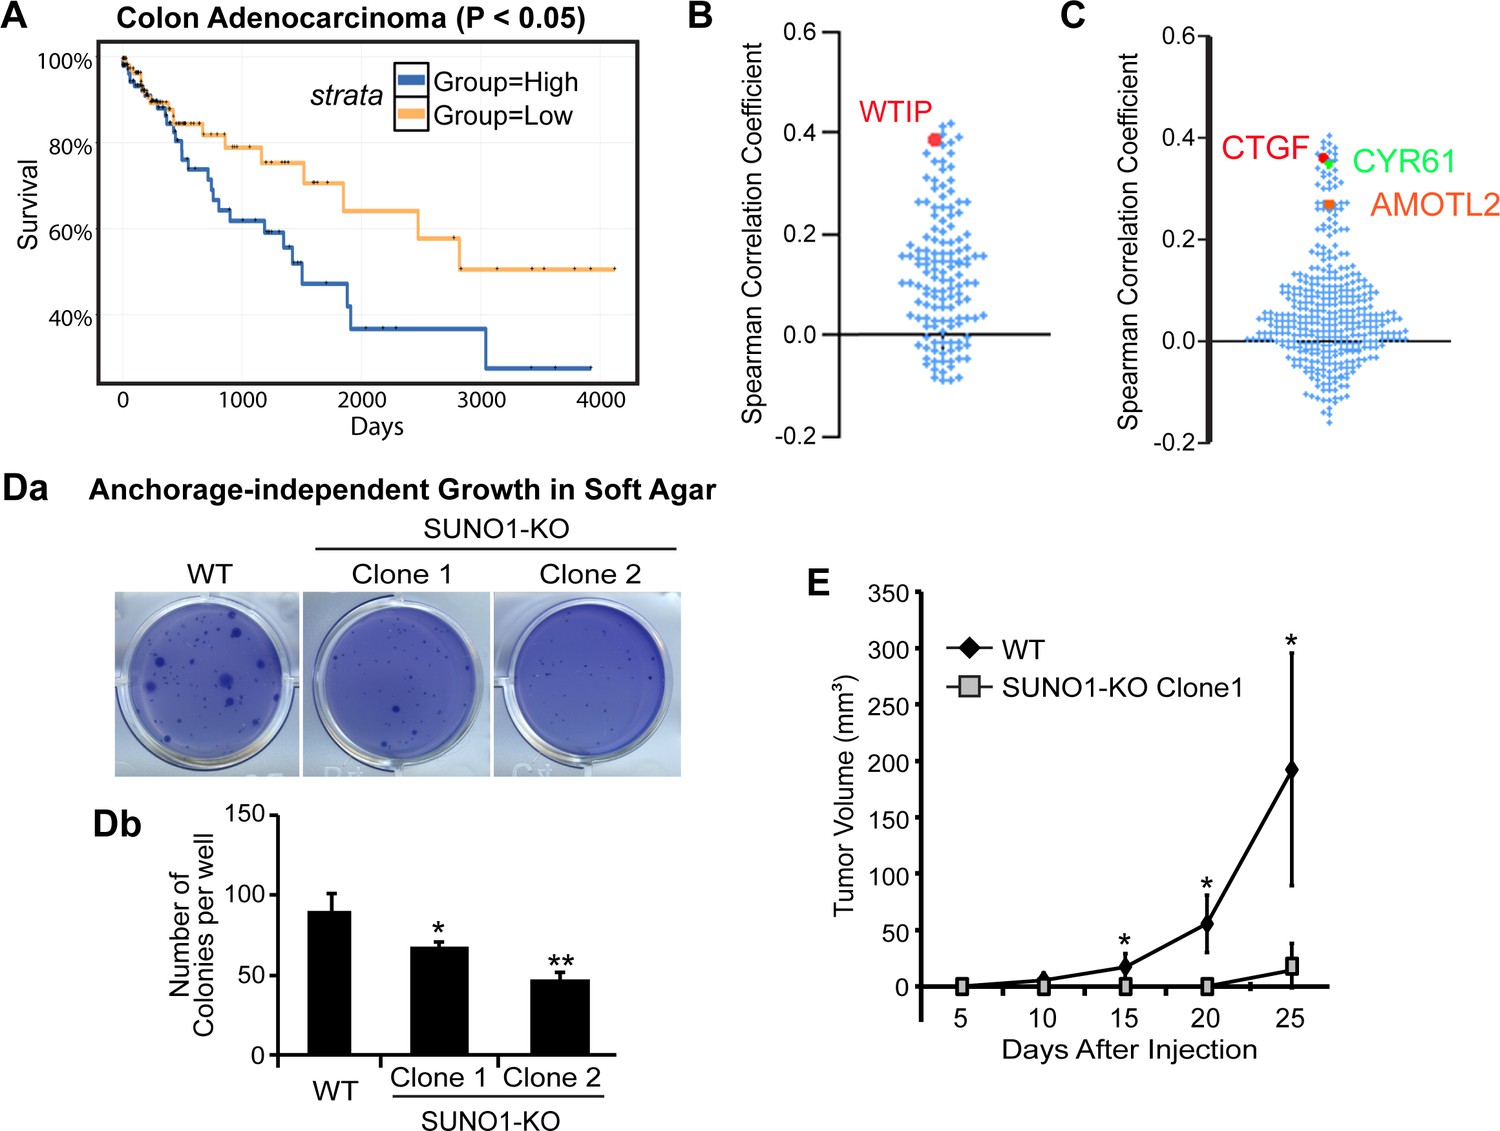
SUNO1 contributes to tumorigenicity under in vitro and in vivo conditions.
(A) Kaplan-Meier analyses to depict the survival rate in TCGA colon adenocarcinoma patients with high and low levels of SUNO1. Expression levels are separated into high and low levels across cancer samples based on median. (B) Spearman correlation of the expression levels of the 149 genes that are downregulated in SUNO1-depleted cells (Figure 4A; Supplementary file 6) with SUNO1 in colon adenocarcinoma patient tumor samples. Each dot represents one of the downregulated genes upon SUNO1 knockdown, and its Spearman correlation coefficient with SUNO1 is plotted. All of the included positively correlated genes with SUNO1 exhibited a p-value<0.01 at a 5% FDR. WTIP is highlighted in red. (C) Spearman correlation of the expression levels of YAP1/TAZ/TEAD target genes with SUNO1 in colon adenocarcinoma patient tumor samples. Each dot represents one of the YAP1/TAZ/TEAD direct target genes, and its Spearman correlation coefficient with SUNO1 is plotted. CTGF, CYR61 and AMOTL2 is highlighted. (Da–b) Long-term anchorage-independent colony formation assay in soft agar of wild-type and SUNO1-CRISPR KO HCT116 (Clone one and Clone 2) cells. (E) Tumor formation of wild-type control and SUNO1-CRISPR KO HCT116 (clone 1) cells in mouse xenograft experiments. Data are presented as Mean ± SD, n = 5. Paired two-tail t-tests are performed. *p<0.05, **p<0.01, ***p<0.001.
Figure 6—figure supplement 1
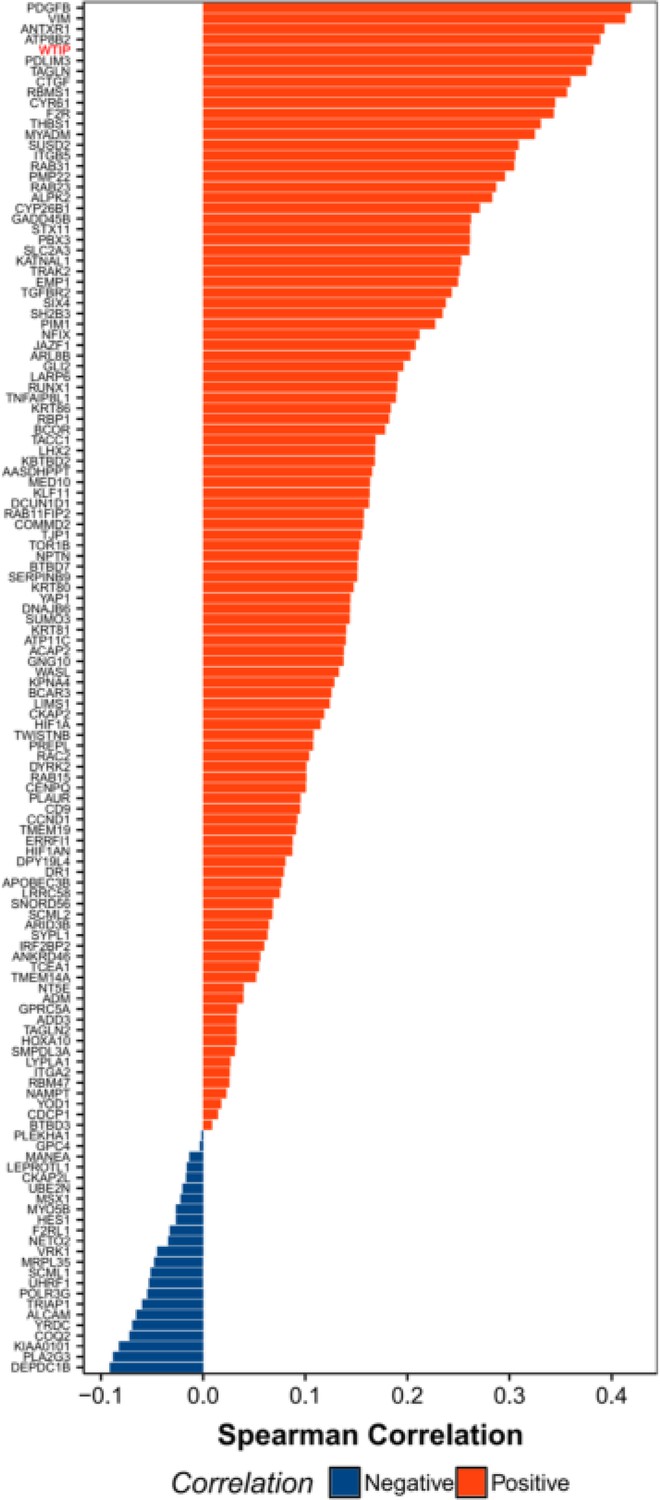
Distribution of spearman correlation values for various genes with respect to SUNO1 across the colon adenocarcinoma cancer samples from the TCGA project.
WTIP gene is highlighted in red. All of the included positively correlated genes with SUNO1 exhibited a p-value<0.01 at a 5% FDR.
Author response image 1
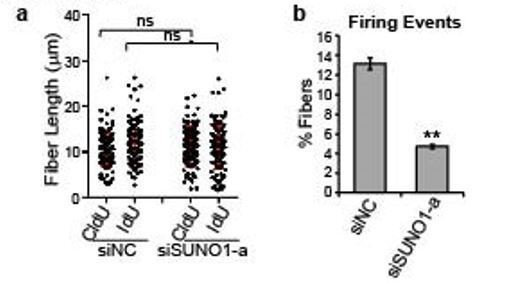
Control and SUNO1-depleted cells were incubated with CldU (30min), washed using the media followed by IdU (another 30 min).
DNA fibers were made (DNA combing), were stained using antibodies to detect CldU- and IdU-incorporated DNA fibers. a) Fiber length were quantified from microscopic images. n=120 fibers. Unpaired two-tail t-tests are performed. ns, not significant, p > 0.05. b) Firing events are calculated by counting the number of fibers containing an origin over the total fibers. Data was presented as Mean ± SD, n=3. Unpaired two-tail t-tests are performed. **p < 0.01.
Author response image 2
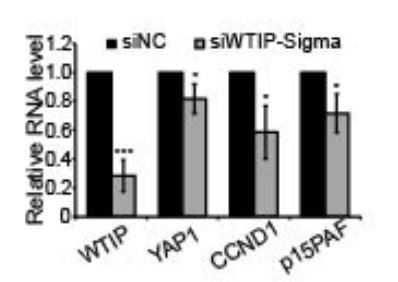
RT-qPCR to detect the levels of WTIP and YAP1 targets in control and WTIP-depleted cells.
Data are presented as Mean ± SD, n=3. Unpaired two-tail t-tests are performed. *p < 0.05.
Author response image 3

Flow cytometry analyses to quantify the G1, S and G2/M population of cells in control and WTIP-depleted cells.
Histograms from one of the replicates are shown. Population of G1, S and G2/M cells are quantified by de novo FCS Express 5 software. Data are presented as Mean ± SD, n=3. Unpaired two-tail t-tests are performed. ns, not significant; *p < 0.05, **p < 0.01, ***p < 0.001.
Author response image 4
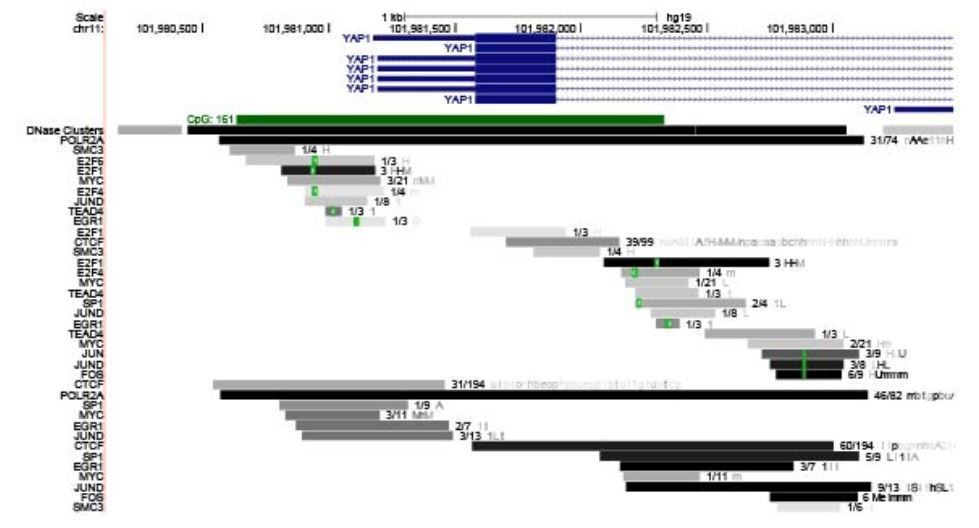
UCSC genome view of the promoter of YAP1 gene.
ChIP-seq data set revealed TEAD and JUND binding signature on the YAP1 promoter.
Tables
Key resources table
| Reagent type (species) or resource | Designation | Source or reference | Identifiers | Additional information |
|---|---|---|---|---|
| Antibody | Anti-BrdU (Mose monoclonal) | Sigma-Aldrich | B9434 | IF (1:800) |
| Antibody | Anti-MCM3 (Rabbit polyclonal) | Stillman B. lab, CSHL | clone 738 | WB (1:1000) |
| Antibody | Anti-Orc2 (Rabbit polyclonal) | Stillman B. lab, CSHL | clone 205–6 | WB (1:500) |
| Antibody | Anti-SRSF1 (Mouse monoclonal) | Krainer A. lab, CSHL | clone 96 | WB (1:1000) |
| Antibody | Anti-p53 (Mouse monoclonal) | Santa Cruz | sc-126 | WB (1:500) |
| Antibody | Anti-B’-U2 snRNP (Mouse polyclonal) | Spector lab, CSHL | clone 4G3 | WB (1:250) |
| Antibody | Anti-Chk1 (Rabbit polyclonal) | Cell Signaling | #2345 | WB (1:500) |
| Antibody | Anti-pChk1-S345 (Rabbit polyclonal) | Cell Signaling | #2348 | WB (1:500) |
| Antibody | Anti-Chk2 (Rabbit polyclonal) | Cell Signaling | #2662 | WB (1:500) |
| Antibody | Anti-pChk2-T68 (Rabbit polyclonal) | Cell Signaling | #2661 | WB (1:500) |
| Antibody | Anti-pBRCA1-S1524 (Rabbit polyclonal) | Cell Signaling | #9009 | WB (1:400) |
| Antibody | Anti-RPA32 (Rat polyclonal) | Cell Signaling | #2208 | WB (1:700), IF (1:500) |
| Antibody | Anti-γH2AX (Rabbit monoclonal) | Cell Signaling | #9718 | WB (1:700) |
| Antibody | Anti-αTubulin (Mouse monoclonal) | Sigma-Aldrich | T5168 | WB (1:5000) |
| Antibody | Anti-WTIP (Mouse polyclonal) | Sigma-Aldrich | SAB1411722 | WB (1:200) |
| Antibody | Anti-Cyclin D1 (Rabbit polyclonal) | Cell Signaling | #2922 | WB (1:500) |
| Antibody | Anti-LATS1 (Mouse monoclonal) | Santa Cruz | sc-398560 | WB (1:100) |
| Antibody | Anti-pLATS1-S909 (Rabbit polyclonal) | Cell Signaling | #9157 | WB (1:1000) |
| Antibody | Anti-YAP1 (Mouse monoclonal) | Santa Cruz | sc-376830 | WB (1:100), IF (1:50) |
| Antibody | Anti-TAZ (Mouse monoclonal) | Santa Cruz | sc-518036 | WB (1:100) |
| Antibody | Anti-CTGF (Mouse monoclonal) | Santa Cruz | sc-365970 | WB (1:100) |
| Antibody | Anti-β-Actin (Mouse monoclonal) | Santa Cruz | sc-47778 | WB (1:300) |
| Antibody | Anti-p15/PAF (Rabbit polyclonal) | Santa Cruz | sc-9996 | WB (1:200) |
| Antibody | Anti-GFP (Mouse monoclonal) | Santa Cruz | sc-67280 | WB (1:100) |
| Antibody | Anti-DDX5 (Mouse monoclonal) | Millipore | clone204, #05–580 | WB (1:200) |
| Antibody | Anti-Pol II (Mouse monoclonal) | Millipore | clone CTD4H8, #05–623 | WB (1:1000), ChIP (5 μg/experiment) |
| Antibody | Anti-53BP1 (Rabbit polyclonal) | Cell Signaling | #4937 | IF (1:300) |
| Antibody | Anti-DDX5 (Rabbit polyclonal) | BETHYL | A300-523A | ChIP (5 μg/experiment) |
| Antibody | Anti-BrdU (CldU) (Rat monoclonal) | Bio-Rad | OBT0030G, Clone BU1/75 (ICR1) | DNA fiber assay (1:200) |
| Antibody | Anti-BrdU (IdU) (Mouse monoclonal) | BD | #347580, clone B44 | DNA fiber assay (1:200) |
| Transfected construct | pT3.5 Caggs-FLAG-hCas9 | This paper | Construct to express Cas9 for making KO cell lines | |
| Transfected construct | pCR4-TOPO-U6-gRNA | This paper | Backbone of the construct to express gRNAs for making KO cell lines | |
| Transfected construct | pcDNA-PB7 | This paper | Construct to express PiggyBac transposase for making KO cell lines | |
| Transfected construct | pPBSB-CG-Luc-GFP-Puro | This paper | Construct to express the puromycin resistent gene for making KO cell lines | |
| Transfected construct (human) | pTRIPZ-EGFP:WTIP | Addgene Ibar et al., 2018 | #66953 | Lentiviral vector for Tet-inducible EGFP:WTIP fusion protein expression |
| Commercial assay or kit | FITC BrdU Flow Kit (RUO) | BD Pharmingen | #559619 | |
| Commercial assay or kit | ChIP-IT High Sensitivity kit | Active Motif | #53040 | |
| Commercial assay or kit | CometAssay Kit | Trevigen | 4250–050 K | |
| Commercial assay or kit | Dual-Luciferase Reporter Assay System | Promega | E1910 | |
| Commercial assay or kit | Click-iT Nascent RNA Capture Kit | Invitrogen | C10365 | |
| Commercial assay or kit | FiberPrep (DNA Extraction Kit) | Genomic vision | EXTR-001 | |
| Cell line (H. sapiens) | HCT116 | ATCC | CCL-247 | |
| Cell line (H. sapiens) | BT20 | ATCC | HTB-19 | |
| Cell line (H. sapiens) | U2OS | ATCC | HTB-96 | |
| Cell line (H. sapiens) | HeLa | ATCC | CCL-2 | |
| Cell line (H. sapiens) | HCT116 p53 -/- | Vogelstein B. lab, Johns Hopkins Uni. | ||
| Chemical compound, drug | Thymidine | Sigma-Aldrich | T9250 | |
| Chemical compound, drug | Nocodazole | Sigma-Aldrich | M1404 | |
| Chemical compound, drug | Doxorubicin hydrochloride | Sigma-Aldrich | D1515 | |
| Chemical compound, drug | Etoposide | Sigma-Aldrich | E1383 | |
| Chemical compound, drug | Hydroxyurea | Sigma-Aldrich | H8627 | |
| Chemical compound, drug | Nutlin-3 | Sigma-Aldrich | N6287 | |
| Chemical compound, drug | Actinomycin D | Sigma-Aldrich | A9415 | |
| Chemical compound, drug | Doxycyline Hyclate | Sigma-Aldrich | D9891 | |
| Chemical compound, drug | BrdU | Sigma-Aldrich | B9285 | |
| Chemical compound, drug | EdU | Invitrogen | A10044 | |
| Chemical compound, drug | CldU | Sigma-Aldrich | C6891 | |
| Chemical compound, drug | IdU | MP Biomedicals | SKU02100357.2 | |
| Chemical compound, drug | Alexa Fluor 488 Azide | Invitrogen | A10266 | |
| Sequence-based reagent | SUNO1-5'gRNA | This paper | gRNA for SCRISPR KO | CCTAACCTAGATCTCCC |
| Sequence-based reagent | SUNO1-3'gRNA | This paper | gRNA for SCRISPR KO | AGGGTGGACAGGGATGC |
| Sequence-based reagent | SUNO1-F | This paper | qPCR primers | CACCAACAGACGTGAGTTCGA |
| Sequence-based reagent | SUNO1-R | This paper | qPCR primers | AGAACACTGCGAGGCTCACA |
| Sequence-based reagent | siNC | This paper | control siRNA | targeted sequence: UUCUCCGAACGUGUCACGU |
| Sequence-based reagent | siSUNO1-a | This paper | SUNO1-specific siRNA | targeted sequence: GCACGUGGUAAUACAUAAU |
| Sequence-based reagent | siSUNO1-b | This paper | SUNO1-specific siRNA | targeted sequence: GAGGAAUGCUGAUCUAGAA |
| Sequence-based reagent | siSUNO1-c | This paper | SUNO1-specific siRNA | targeted sequence: GGCGUGAUUUAGAUGGAAA |
| Transfected construct (Human) | siRNA to WTIP (SMARTpool) | Dharmacon | L-023639-02-0005 |
Additional files
-
Supplementary file 1
Gene count, gene expression (TPM), and biotype of quantifiable genes of RNA-seq.
First sheet ‘gene_count_all’ contains raw counts from HTSeq-count analysis. Second sheet ‘TPM_all’ contains TPM (Transcripts Per Million) as the expression level of each gene in all samples. TPM is calculated using Stringtie. Third sheet ‘list_of_24087_genes’ includes the genes that have quantifiable expression (CPM >= 0.075 in at least two samples). Last sheet ‘biotype_of_24087_genes’ includes the detailed categorization information of these genes. The biotype information is based on Ensemble (https://useast.ensembl.org/info/genome/genebuild/biotypes.html).
- https://cdn.elifesciences.org/articles/55102/elife-55102-supp1-v1.xlsx
-
Supplementary file 2
Differential expression results.
Five sheets represent the full results (of 24087 genes) of differential expression tests (exactTest from edgeR) between G1 vs. G1S, G1S vs. S, S vs. G2, G2 vs. M, M vs. G1, respectively.
- https://cdn.elifesciences.org/articles/55102/elife-55102-supp2-v1.xlsx
-
Supplementary file 3
DEG list and biotype classification.
File three is a subset of File two and it includes only DEGs information. The gene categories are also provided as individual sheets. Statistics summarizing the categorization of each comparison (between two phases) is listed in Figure 1B.
- https://cdn.elifesciences.org/articles/55102/elife-55102-supp3-v1.xlsx
-
Supplementary file 4
Gene ontology and GSEA.
Six sheets represent the detailed, full output from GSEA/GO/Kegg pathway analyses in this study. They correspond to data presented in Figure 1—figure supplement 2A, Figure 1—figure supplement 2B, Figure 1D, Figure 1—figure supplement 2C, respectively.
- https://cdn.elifesciences.org/articles/55102/elife-55102-supp4-v1.xlsx
-
Supplementary file 5
Phase-specific genes.
First sheet ‘all_phase_specific_with_TPM’ includes all 5162 phase-specific genes and their TPM values. Second sheet ‘2044_phase_specific_lncRNAs’ shows the list of 2044 lncRNAs only. The lncRNA categorization criteria are explained in detail in Supplementary file 1, last sheet, ‘biotype_of_24087_genes’. Statistics summarizing the categorization is listed in Figure 2—figure supplement 1A.
- https://cdn.elifesciences.org/articles/55102/elife-55102-supp5-v1.xlsx
-
Supplementary file 6
Deregulated genes in SUNO1 KD cells compared to control cells detected by Microarray analyses.
- https://cdn.elifesciences.org/articles/55102/elife-55102-supp6-v1.xlsx
-
Supplementary file 7
SUNO1-binding proteins detected by RNA affinity Pulldown followed by Mass Spectrometry.
- https://cdn.elifesciences.org/articles/55102/elife-55102-supp7-v1.xlsx
-
Supplementary file 8
List of primers, siRNAs, gRNAs, and antibodies.
- https://cdn.elifesciences.org/articles/55102/elife-55102-supp8-v1.xlsx
-
Transparent reporting form
- https://cdn.elifesciences.org/articles/55102/elife-55102-transrepform-v1.pdf
Download links
A two-part list of links to download the article, or parts of the article, in various formats.
Downloads (link to download the article as PDF)
Open citations (links to open the citations from this article in various online reference manager services)
Cite this article (links to download the citations from this article in formats compatible with various reference manager tools)
The S-phase-induced lncRNA SUNO1 promotes cell proliferation by controlling YAP1/Hippo signaling pathway
eLife 9:e55102.
https://doi.org/10.7554/eLife.55102


