VIP interneurons in mouse primary visual cortex selectively enhance responses to weak but specific stimuli
- Allen Institute for Brain Science, United States
Figures
Figure 1
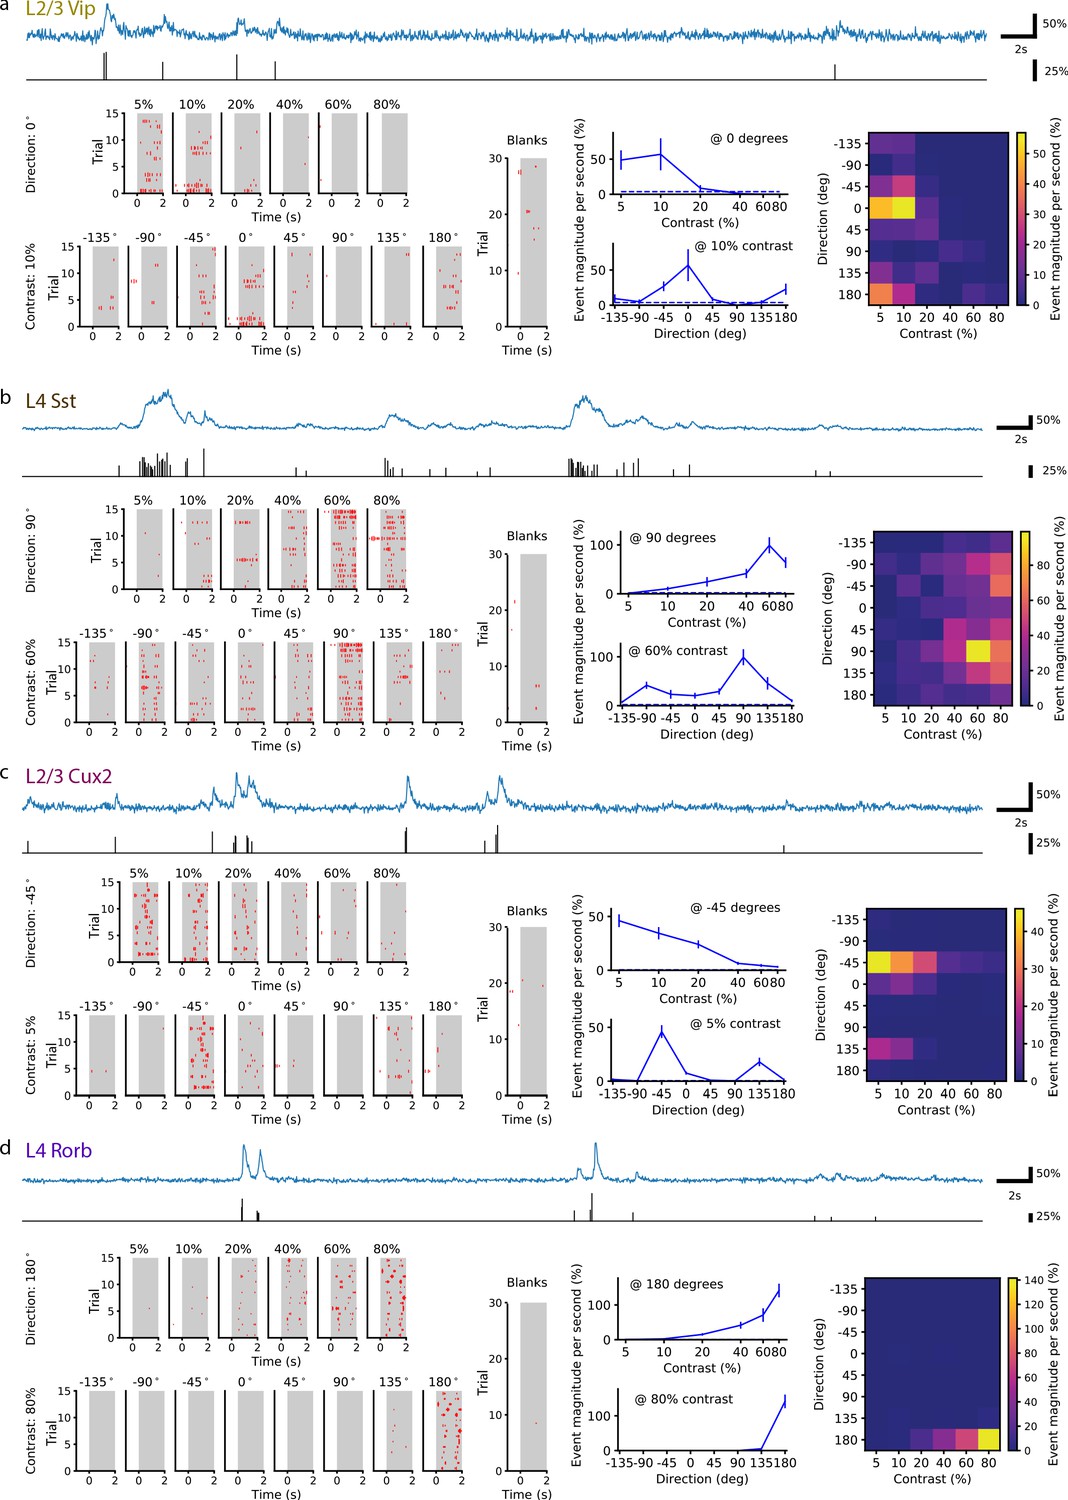
Single neurons are tuned for stimulus direction and contrast.
(a) A single VIP interneuron recorded in layer 2/3 of a Vip mouse responds to low contrast with a preference for motion with a direction of 0 degrees (front-to-back). Top: In blue, 20 s of the dF/F trace for this neuron and, in black, the corresponding events extracted from the dF/F trace. Left: Event rasters for each contrast at the peak direction (0 degrees), each direction at the peak contrast (10%), and blank (i.e. 0% contrast) trials. Middle: Contrast tuning curve at the peak direction and direction tuning curve at the peak contrast; mean ± SEM. Right: Heatmap shows the mean response for all stimulus contrasts and directions. (b) Same as a, for a single SST neuron recorded in layer 4 of an Sst mouse. This neuron is tuned for high contrast with a preference for motion with a direction of ±90 (up/down). (c) Same as a, for a pyramidal neuron recorded in layer 2/3 of a Cux2 mouse. This neuron is tuned for low contrast with a preference for motion with a direction of -45 degrees. (d) Same as a, for pyramidal neuron recorded in layer 4 of a Rorb mouse. This neuron is tuned for high contrast with a preference for motion with a direction of 180 degrees (back-to-front).
-
Figure 1—source data 1
The total number of cells, experimental sessions, and mice per Cre line.
- https://cdn.elifesciences.org/articles/55130/elife-55130-fig1-data1-v1.docx
Figure 2 with 2 supplements
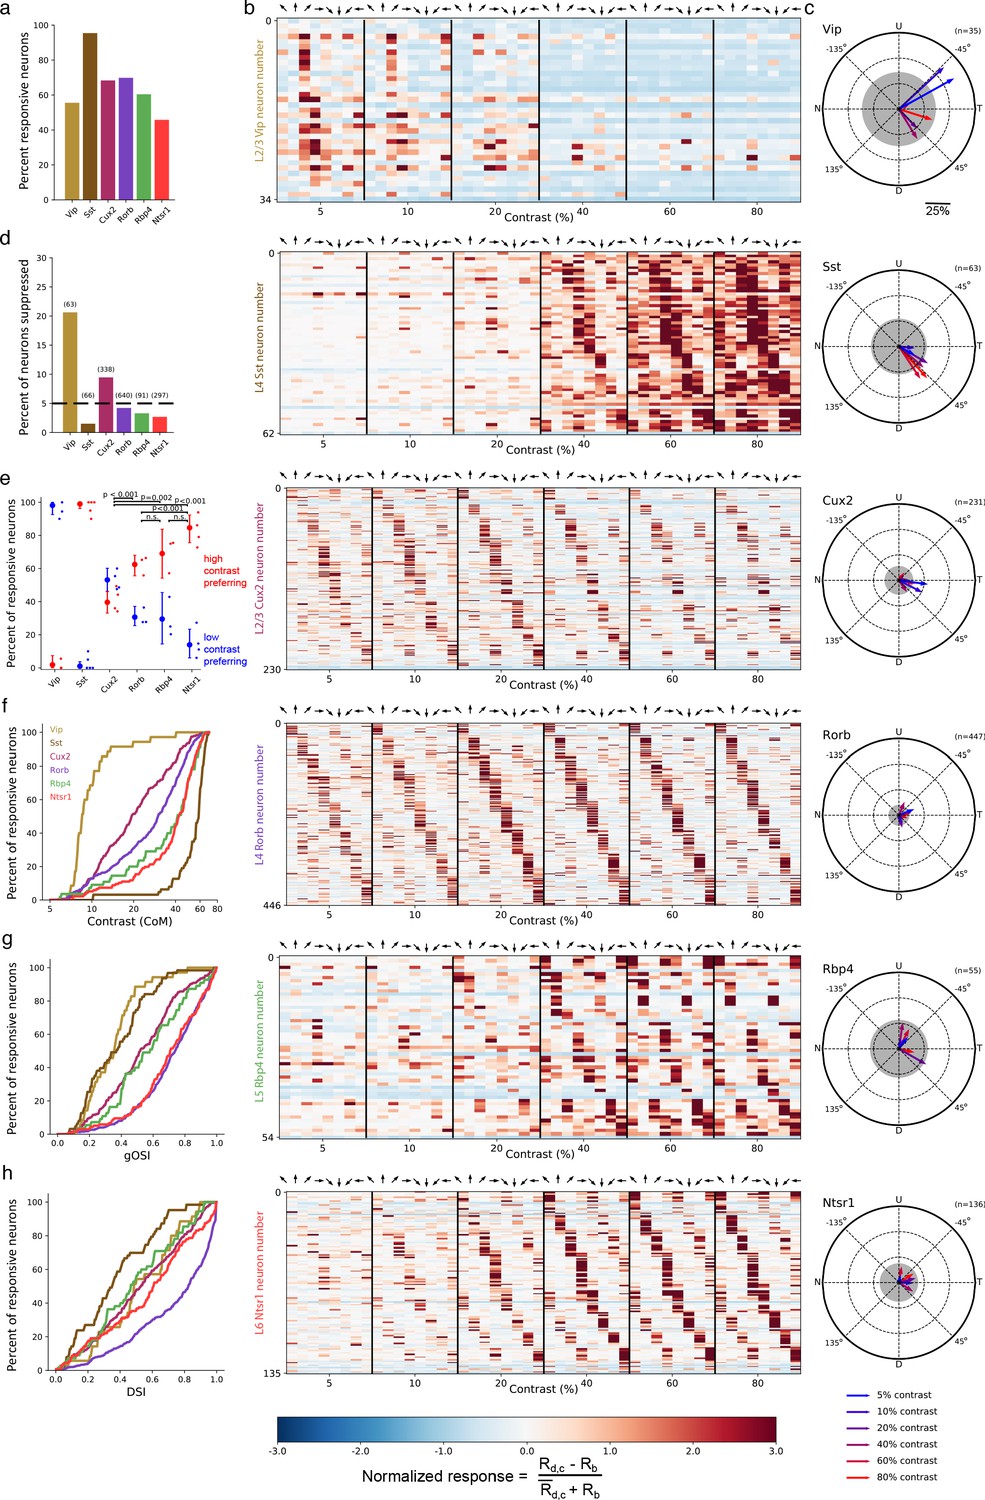
Contrast and direction preferences are cell-type and layer specific.
(a) The fraction of imaged cells that were significantly responsive to the gratings stimulus (bootstrapped χ2 test, p<0.01). (b) Waterfall plots showing the response significance at each contrast and direction of all responsive cells (χ2 test; p < 0.01) from mice of each Cre line. Each row is one neuron and neurons are ordered by direction preference at the cell’s peak contrast. The responses to each stimulus condition are normalized per neuron to be , where is the normalized response, is the mean response to a grating with direction d and contrast c, is the mean blank (0% contrast) response, and is the mean response to gratings across all directions and contrasts. (c) Radial plot of the average direction preference of cells of each Cre line at each contrast. Arrows are the vector sum of all responsive cells at a given contrast. Gray shaded region indicates a 95% confidence interval of the vector sum for a population with uniformly-distributed direction preferences, multiple comparisons corrected for the six contrasts. Scale: The distance between each pair of concentric dashed rings is 25%. N: Nasal, T: Temporal, U: Up, D: Down. (d) Fraction of all cells of each Cre line that are suppressed by contrast. The mean response to all grating directions at 80% contrast must be significantly below the mean blank response (bootstrapped distribution of mean response differences; family-wise type 1 error < 0.05; see Materials and methods). (e) Distribution of contrast response types by Cre line determined by fitting of rising sigmoid (high contrast preferring), falling sigmoid (low contrast preferring), or the product of rising and falling sigmoids (intermediate contrast preferring; not shown due to a very small percentage of neurons tuned for intermediate contrasts). P-values are shown for pairwise comparisons of the fraction of high contrast preferring pyramidal neurons in each layer (bootstrap test of difference of sample proportions). See Materials and methods. (f) Cumulative distribution of contrast preferences (center-of-mass of a cell’s contrast response function; CoM) across Cre lines. (g) Cumulative distribution of global orientation selectivity indices (gOSI) across Cre lines. (h) Cumulative distribution of direction selectivity indices across Cre lines.
Figure 2—figure supplement 1
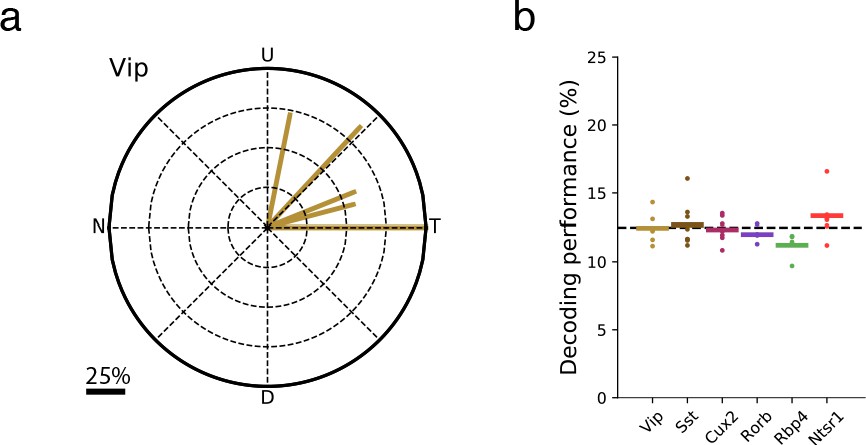
The direction of VIP neuron bias was consistent across mice and did not result from stimulus direction-selective running behavior.
(a) Vector sums for each of the six Vip-Cre experiments. N: Nasal, T: Temporal, U: Up, D: Down. (b) Performance of a linear support vector classifier trained to decode the direction of grating (1-of-8 classification) from the running speed of the mouse. The average validation performance for three-fold cross-validation is shown. Each dot is the performance for one experiment; bars are the mean across experiments of a given Cre line.
Figure 2—figure supplement 2
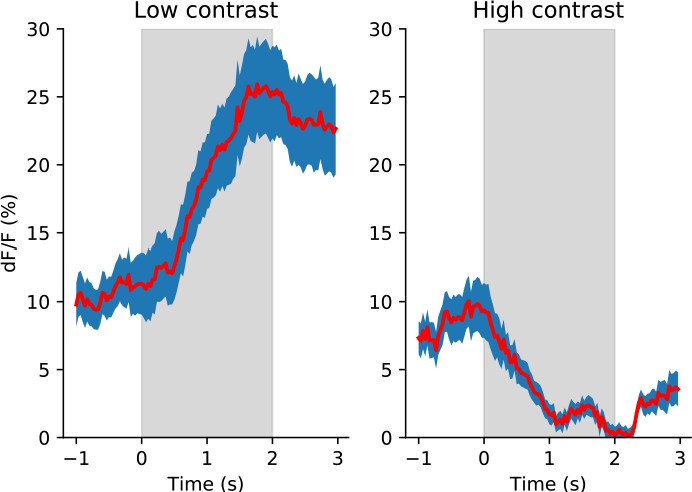
VIP neurons have evoked responses to low contrast gratings but response suppression to high contrast gratings.
Average fluorescence responses of all VIP neurons to low (left) and high (right) contrast gratings are shown at the neuron’s preferred direction (n=63 neurons; mean ± SEM). Gray shading indicates the stimulus presentation window of 2 s; time is relative to stimulus onset.
Figure 3 with 1 supplement
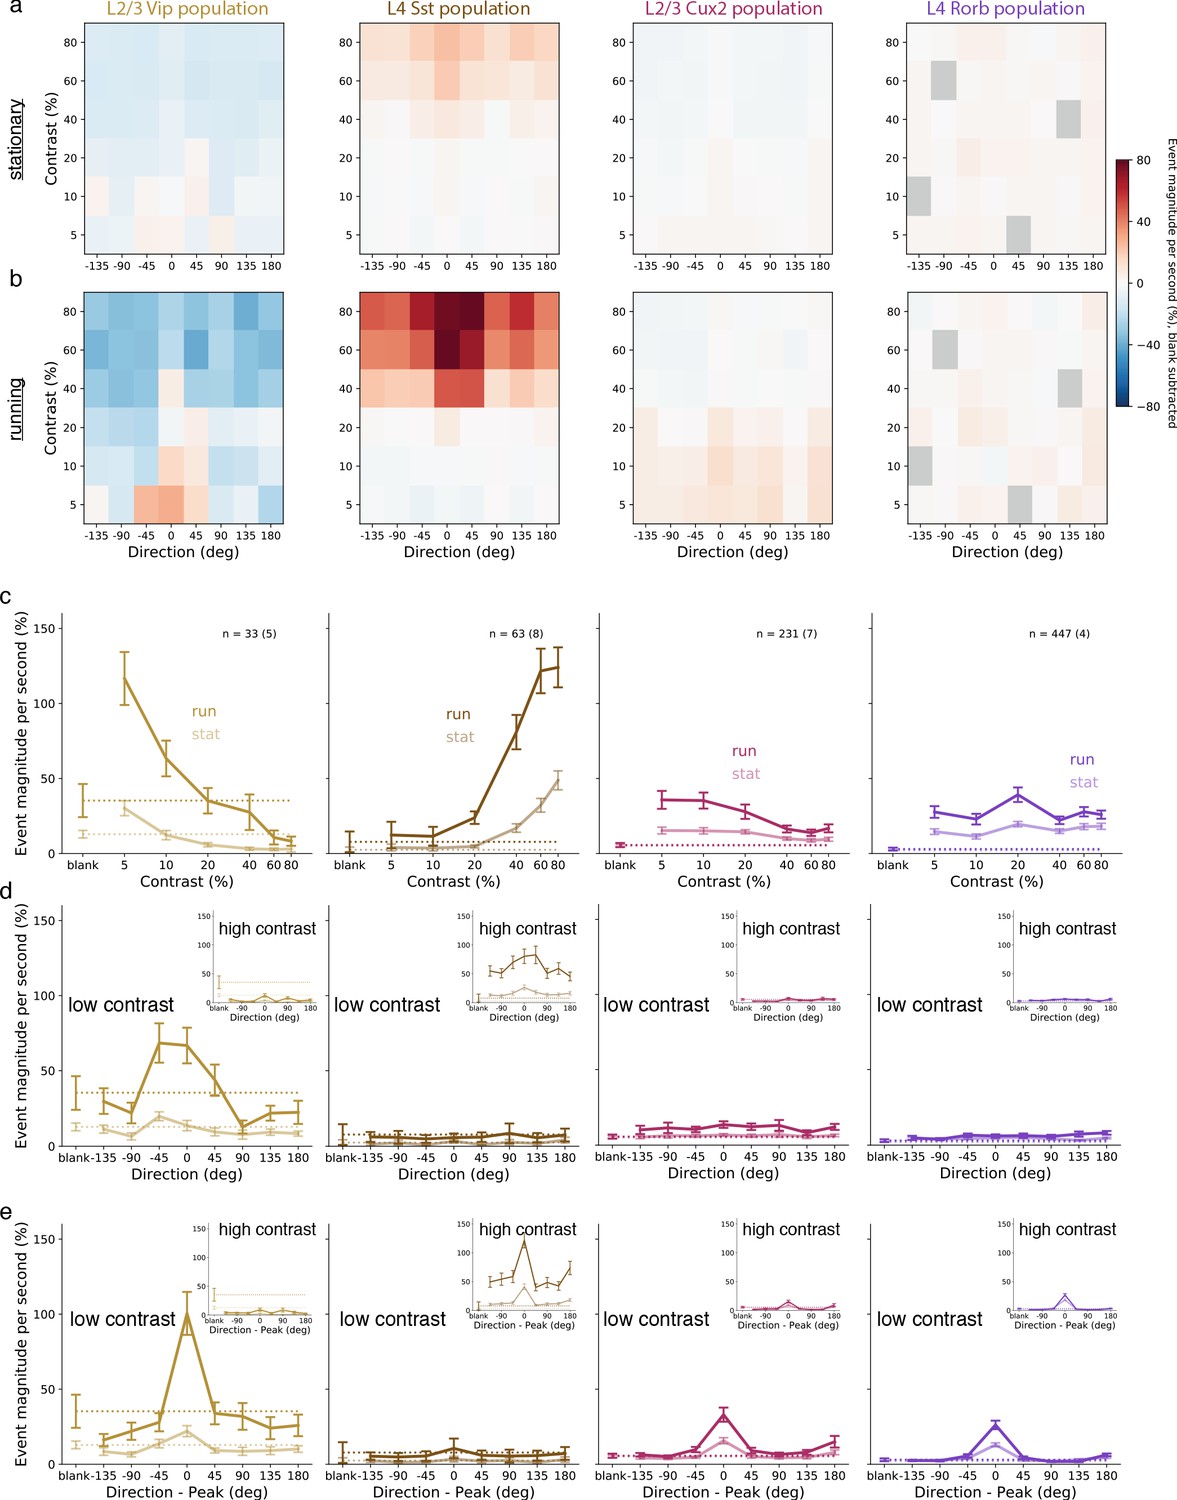
Average population responses of inhibitory, but not excitatory, cells are strongly biased toward front-to-back visual motion which is enhanced during locomotion.
(a) Mean blank-subtracted event magnitude (a.u.; extracted events derived from dF/F trace) of all neurons from mice of each superficial Cre line during stationary periods. Gray boxes in Rorb plots indicate insufficient run and stationary data. (b) Same as a, for running periods. (c) Mean population contrast responses tuning at peak direction during stationary (faint lines) and running (bold lines) periods. (d) Mean population direction response tuning at low (5-10%) contrast. Insets: mean population direction response tuning at high (60-80%) contrast. (e) Mean single-neuron direction tuning (i.e. aligned to each neuron’s peak direction). Insets: mean single-neuron direction tuning at high (60-80%) contrast. All error bars are SEM. Sample size indicates number of neurons with number of experiments in parenthesis.
Figure 3—figure supplement 1

Distributions of single neuron response magnitudes across stimulus conditions for key Cre lines.
(a) The distribution of responses of all VIP neurons in layer 2/3 of Vip mice by grating direction and contrast. Each dot is one neuron. Box plots show lower quartile, median (red bar), and upper quartile. (b) Same as a but for all SST neurons in layer 4 of Sst mice. (c) Same as a but for all pyramidal neurons in layer 2/3 of Cux2 mice. (d) Same as a but for all pyramidal neurons in layer 4 of Rorb mice. (e) Same as a but shown for stimulus direction relative to the cell’s peak direction (i.e. stimulus direction – peak direction). (f) Same as e but for all SST neurons in layer 4 of Sst mice. (g) Same as e but for all pyramidal neurons in layer 2/3 of Cux2 mice. (h) Same as e but for all pyramidal neurons in layer 4 of Rorb mice.
Figure 4

Generalized Linear Models reveal the contribution of stimulus direction, stimulus contrast, locomotion, and the interactions between these terms, to the activity of neuronal populations.
(a) Schematic of the Poisson GLM consisting of a blank term, a binary run state term (1 for running, 0 for stationary), 8 direction terms, 6 contrast terms, 8 run x direction interaction terms, 6 run x contrast interaction terms, 48 direction x contrast interaction terms, and 48 run x direction x contrast interaction terms. The responses are predicted by summing these 126 terms and raising the sum to an exponential. (b) GLM results for the population of layer 2/3 VIP neurons recorded from Vip mice. Left: The model weights are shown as heatmaps (top) as well as means and 95% confidence intervals (bottom). Sparse weights were obtained using an L1-regularization penalty, resulting in the majority of weights to be zero. For direction x contrast and run x direction x contrast interaction terms, means and confidence intervals are only shown for terms with non-zero weights. Right: Predicted responses to stimulus conditions minus predicted blank response when the mouse is stationary (top) and running (bottom). (c) Same as b, but for the population of layer 4 SST neurons recorded from Sst mice. (d) Same as b, but for the population of layer 2/3 pyramidal neurons recorded from Cux2 mice.
Figure 5
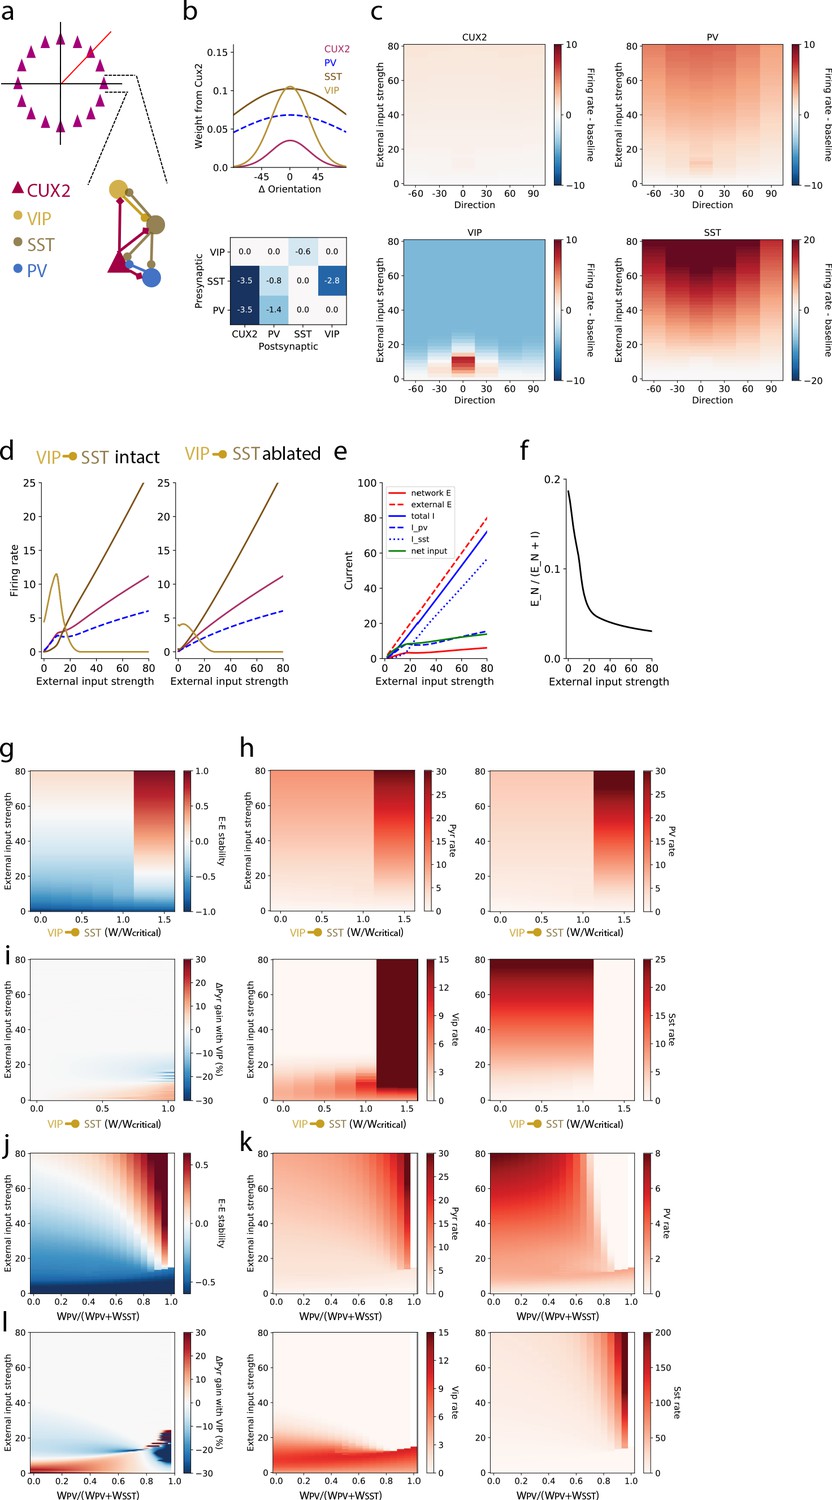
A stabilized supralinear network (SSN) model with three interneuron populations reproduces contrast and direction tuning of multiple neuron types and implicates VIP neurons in enhancement of network gain for weak inputs.
(a) Top: The network architecture is a ring corresponding to the peak of each L2/3 pyramidal (“CUX2”) neuron’s direction tuning curve. The entire ring spans 180 degrees of direction. Bottom: A schematic illustrates the connectivity among neuron types. (b) Top: The distribution of excitatory connection strength from CUX2 pyramidal neurons onto each neuron type is Gaussian with mean equal to the difference in orientation preference of pre- and post-synaptic neurons. The distributions of recurrent connections onto CUX2 neurons and connections onto VIP neurons are narrow (standard deviation of 30 degrees) compared to the distributions onto PV and SST neurons (standard deviation of 100 degrees). Bottom: Inhibitory connection weights are all broadly tuned (standard deviation of 100 degrees). (c) The average population responses across direction and contrast conditions qualitatively reproduce experimental data for CUX2, SST, and VIP neurons shown in Figure 3. (d) Left: The steady state firing rates are shown for model neurons of each type with peak direction tuning of zero degrees in response to an external input of zero degrees. Right: The steady state firing rates of the same model neurons in response to an external input of zero degrees with the VIP-to-SST connection strength set to zero demonstrates that this connection is necessary for a high gain of CUX2 and PV neurons at the low input levels for which VIP neurons are most responsive. (e) Currents to the pyramidal neurons in panel d show that most additional external excitatory input above 15 is offset by the recruitment of inhibition. Inhibition from PV neurons dominates at weak external input strengths while inhibition from SST neurons dominates at strong external input strengths. (f) The relative fraction of currents that pyramidal neurons receive from other pyramidal neurons, rather than inhibitory neurons, decreases as external input strength increases. This shows the relative dominance of inhibition over excitation in the network. (g) The linear stability of the E-E subnetwork shows a transition from non-ISN dynamics (E-E stability < 0) to ISN dynamics (E-E stability > 0) at an external input strength of ~55 for networks with connection weight from VIP to SST neurons below a critical value (WVIP→SST≈-0.6). Above the critical value, the E-E subnetwork is highly unstable for all external input strengths greater than ~20. (h) The firing rates of all four neuron types remain similar below the critical value of WVIP→SST, except VIP neurons which increase substantially with increasing WVIP→SST but remain most active at weak external input strengths. Above the critical value, rates of pyramidal, PV and VIP neurons increase substantially, and SST neuron rates are near zero, for all external input strengths. (i) The effect of the VIP-to-SST neuron connection on pyramidal neuron gain shows that the increase in gain occurs only at weak external input strengths. The gain effect increases with increasing WVIP→SST below the critical value. W/Wcritical for the networks shown in panels b-f is 0.99, where W is -0.6. (j-l) Same as (g-i), except varying the weight of PV inputs onto pyramidal neurons relative to the total weight of inhibitory (i.e. PV and SST) inputs onto pyramidal neurons. The external input strength at which the E-E stability (panel j) transitions from non-ISN to ISN decreases as the relative weight from PV neurons increase, but the stability behavior, firing rates (panel k), and gain effect (panel l) remain the similar until a bifurcation near WPV/(WPV+WSST)=0.8. The network becomes unstable at very high relative PV weights (WPV/(WPV+WSST) >0.95). WPV/(WPV+WSST) for the networks shown in panels b-f is 0.5.
Tables
Key resources table
| Reagent type (species) or resource | Designation | Source or reference | Identifiers | Additional information |
|---|---|---|---|---|
| Genetic reagent (M. musculus) | Vip-IRES-Cre | Jackson Laboratory | Stock #: 010908; RRID:MGI:4436915 | Dr. Z Josh Huang (Cold Spring Harbor Laboratory) |
| Genetic reagent (M. musculus) | Sst-IRES-Cre | Jackson Laboratory | Stock #: 013044; RRID:IMSR_JAX:013044 | Dr. Z Josh Huang (Cold Spring Harbor Laboratory) |
| Genetic reagent (M. musculus) | Cux2-CreERT2 | MMRRC | RRID:MMRRC_032779-MU | PMID:22879516 |
| Genetic reagent (M. musculus) | Rorb-IRES2-Cre | Jackson Laboratory | Stock #: 023526 RRID:IMSR_JAX:023526 | PMID:25071457 |
| Genetic reagent (M. musculus) | Rbp4-Cre_KL100 | MMRRC | RRID:MMRRC_031125-UCD | PMID:24360541 |
| Genetic reagent (M. musculus) | Ntsr1-Cre_GN220 | Jackson Laboratory | Stock #: 017266; RRID:MMRRC_030648-UCD | PMID:24360541 |
| Genetic reagent (M. musculus) | CaMKII-tTA x Ai93-GCaMP6f | Jackson Laboratory | Stock #: 024108; RRID:IMSR_JAX:024108 | PMID:22855807; PMID:25741722 |
| Genetic reagent (M. musculus) | Ai148-GCaMP6f | Jackson Laboratory | Stock #: 030328; RRID:IMSR_JAX:030328 | PMID:30007418 |
| Software, algorithm | NumPy | NumPy | RRID:SCR_008633 | |
| Software, algorithm | Matplotlib | MatPlotLib | RRID:SCR_008624 | |
| Software, algorithm | pandas | pandas | DOI:10.5281/zenodo.3509134 | |
| Software, algorithm | statsmodel | statsmodel | RRID:SCR_016074 | |
| Software, algorithm | scipy | SciPy | RRID:SCR_008058 | |
| Software, algorithm | scikit-learn | scikit-learn | RRID:SCR_002577 |
Additional files
Download links
A two-part list of links to download the article, or parts of the article, in various formats.
Downloads (link to download the article as PDF)
Open citations (links to open the citations from this article in various online reference manager services)
Cite this article (links to download the citations from this article in formats compatible with various reference manager tools)
VIP interneurons in mouse primary visual cortex selectively enhance responses to weak but specific stimuli
eLife 9:e55130.
https://doi.org/10.7554/eLife.55130


