Loss of Doc2b does not influence transmission at Purkinje cell to deep nuclei synapses under physiological conditions
- Department of Neurobiology, Harvard Medical School, United States
Figures
Figure 1 with 4 supplements
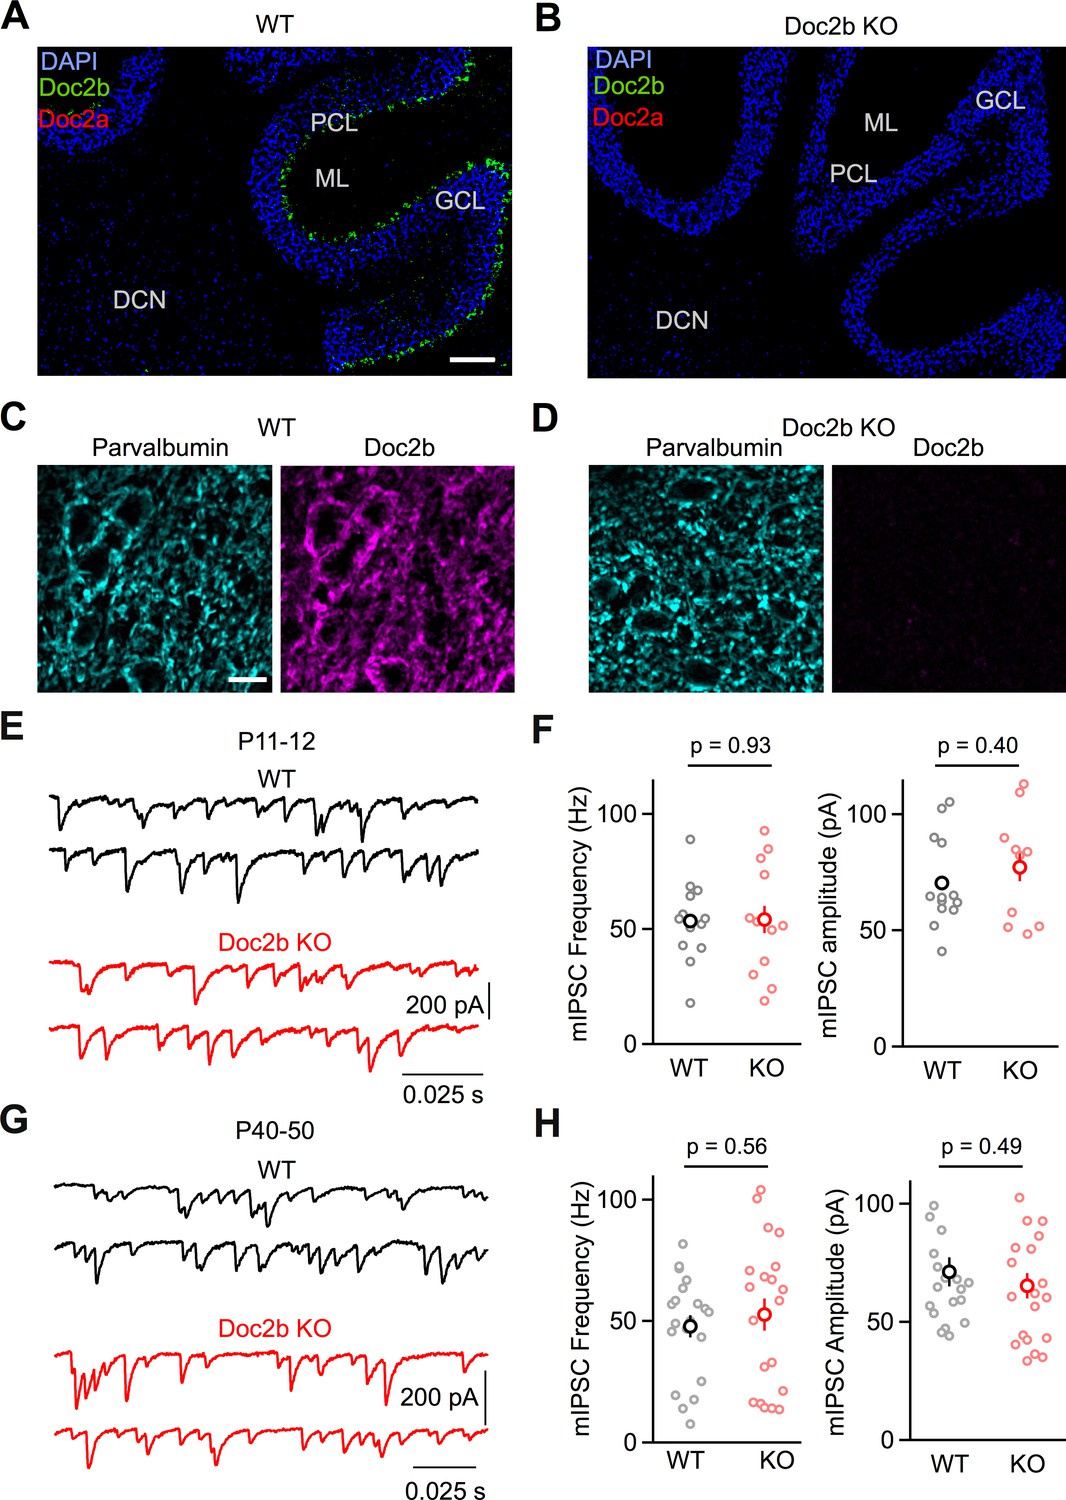
Loss of Doc2b does not affect mIPSC frequency at the PC to DCN synapse.
(A) Sagittal cerebellum slice from a WT mouse at postnatal day 60 (P60) labeled using FISH for DAPI (blue), Doc2b (green), and Doc2a (red). Abbreviations, Purkinje Cell Layer (PCL), Molecular Layer (ML), Granule Cell Layer (GCL), and Deep Cerebellar Nuclei (DCN). Scale bar, 200 μm. (B) Same as in (A) but for Doc2b KO. Images are on the same scale as in (A). (C) Sagittal DCN section from a WT mouse at postnatal day 60 (P60) immunostained for parvalbumin (left, cyan) and Doc2b (right, magenta). Scale bar, 25 μm. (D) Same as in (C) but for Doc2b KO. Images are on the same scale as in (C). (E) mIPSCs were recorded at the PC to DCN synapse in P40-50 mice in the presence of TTX, NBQX, and CPP. Representative traces from individual cells for WT and Doc2b KO littermates. (F) Summary data for mIPSC frequency and amplitude at the PC to DCN synapse in P40-50 mice. n = 14 cells (3 animals) for WT, n = 12 cells (3 animals) for Doc2b KO. Individual cells are shown as small circles and genotype average is shown as larger bold circle. Statistical significance was assessed using two-tailed Student’s t-tests after data were found to be normally distributed (Shapiro-Wilk test) (see Materials and Methods for details). (G) Same as in (C) but for P11-12 mice. (H) Same as in (D) but for P11-12 mice. n = 20 cells (3 animals) for WT, n = 20 cells (2 animals) for Doc2b KO.
-
Figure 1—source data 1
PC to DCN mini frequencies and amplitudes.
- https://cdn.elifesciences.org/articles/55165/elife-55165-fig1-data1-v1.xlsx
Figure 1—figure supplement 1
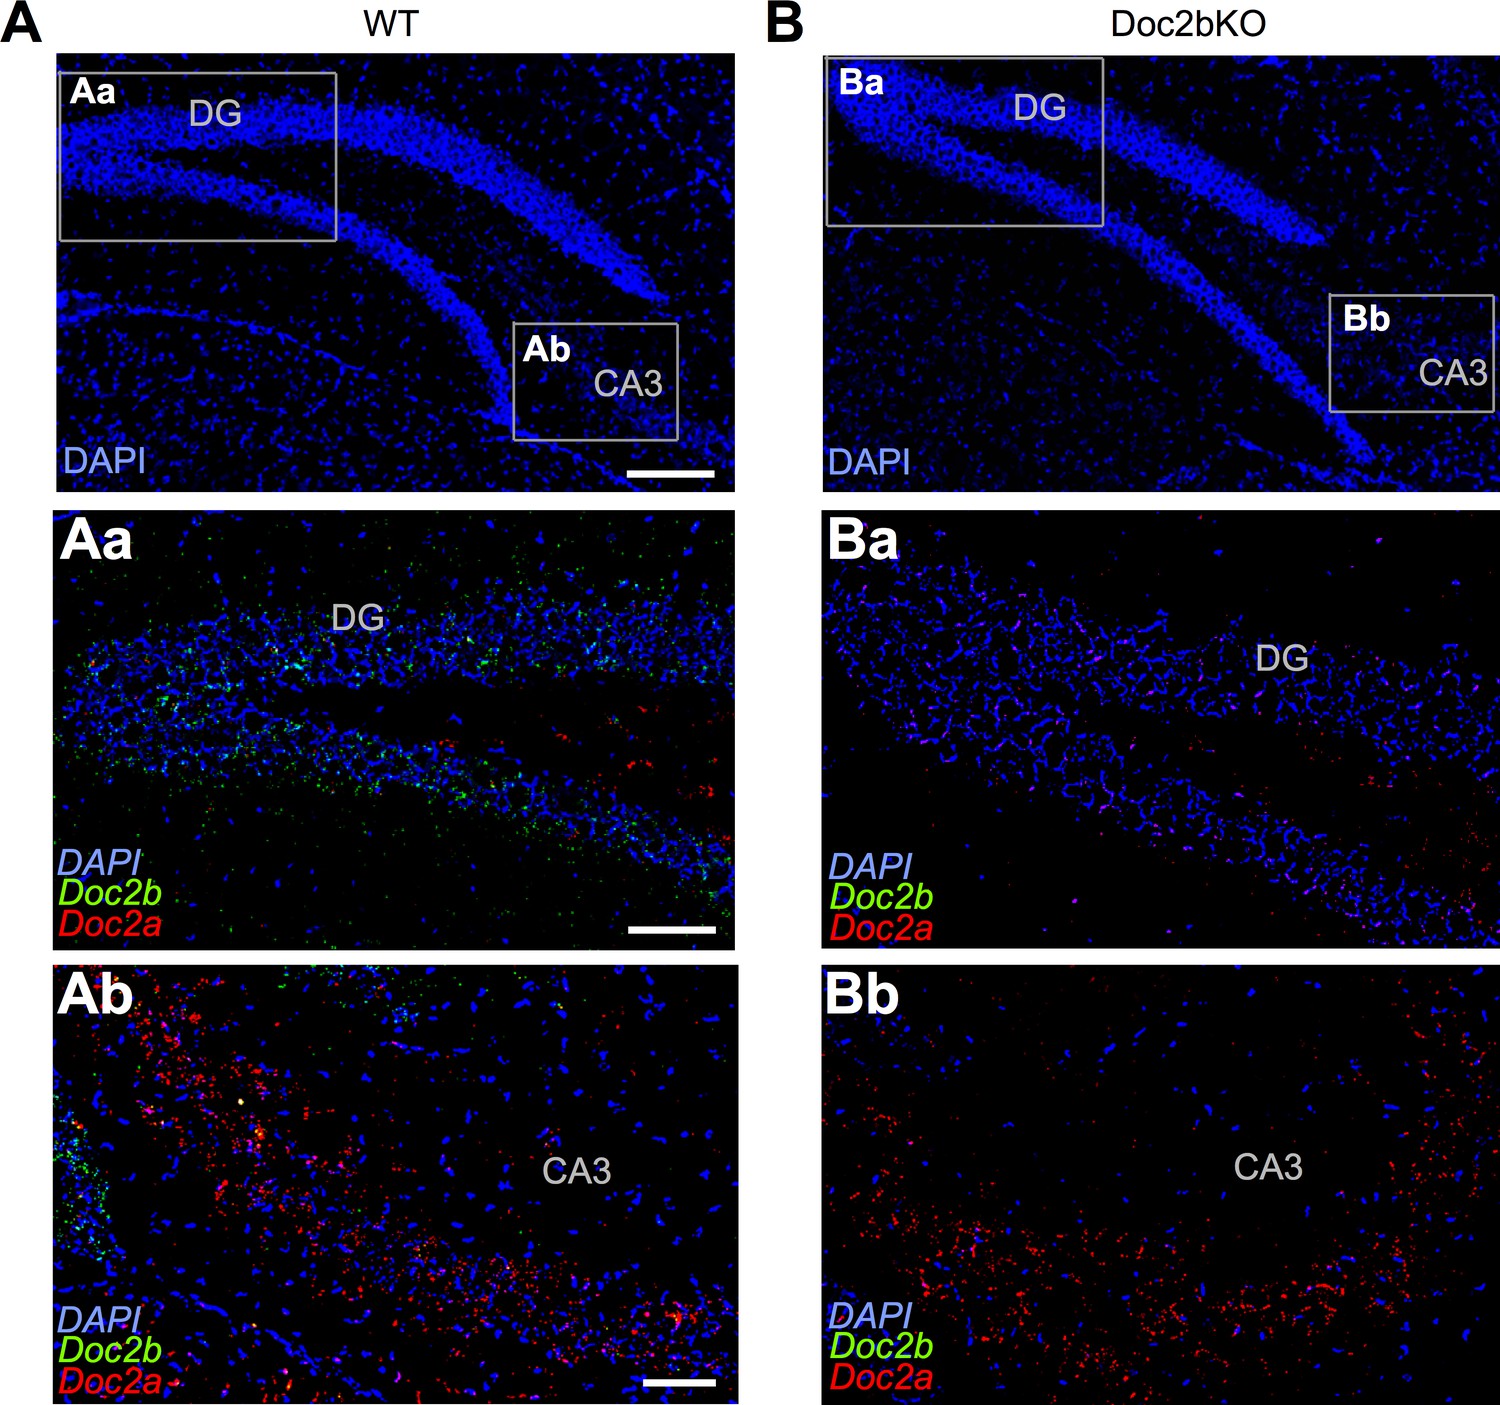
Doc2a expression is normal in Doc2b KO.
(A) Sagittal hippocampus slice from a WT mouse at P60 labeled with RNAscope probe for DAPI (blue). Scale bar, 200 μm. (Aa). Inset from (A) with expanded view of dentate gyrus, labeled with RNAscope probes for DAPI, Doc2b (green), and Doc2a (red). Scale bar, 50 μm. (Ab). Inset from (A) with expanded view of CA3 hippocampus, labeled with RNAscope probes for DAPI, Doc2b, and Doc2a. Scale bar, 50 μm. (B) Same as in (A) but for Doc2b KO. Images are on the same scale as in (A). (Ba) Same as in (Aa) but for Doc2b KO. (Bb) Same as in (Ab) but for Doc2b KO.
Figure 1—figure supplement 2
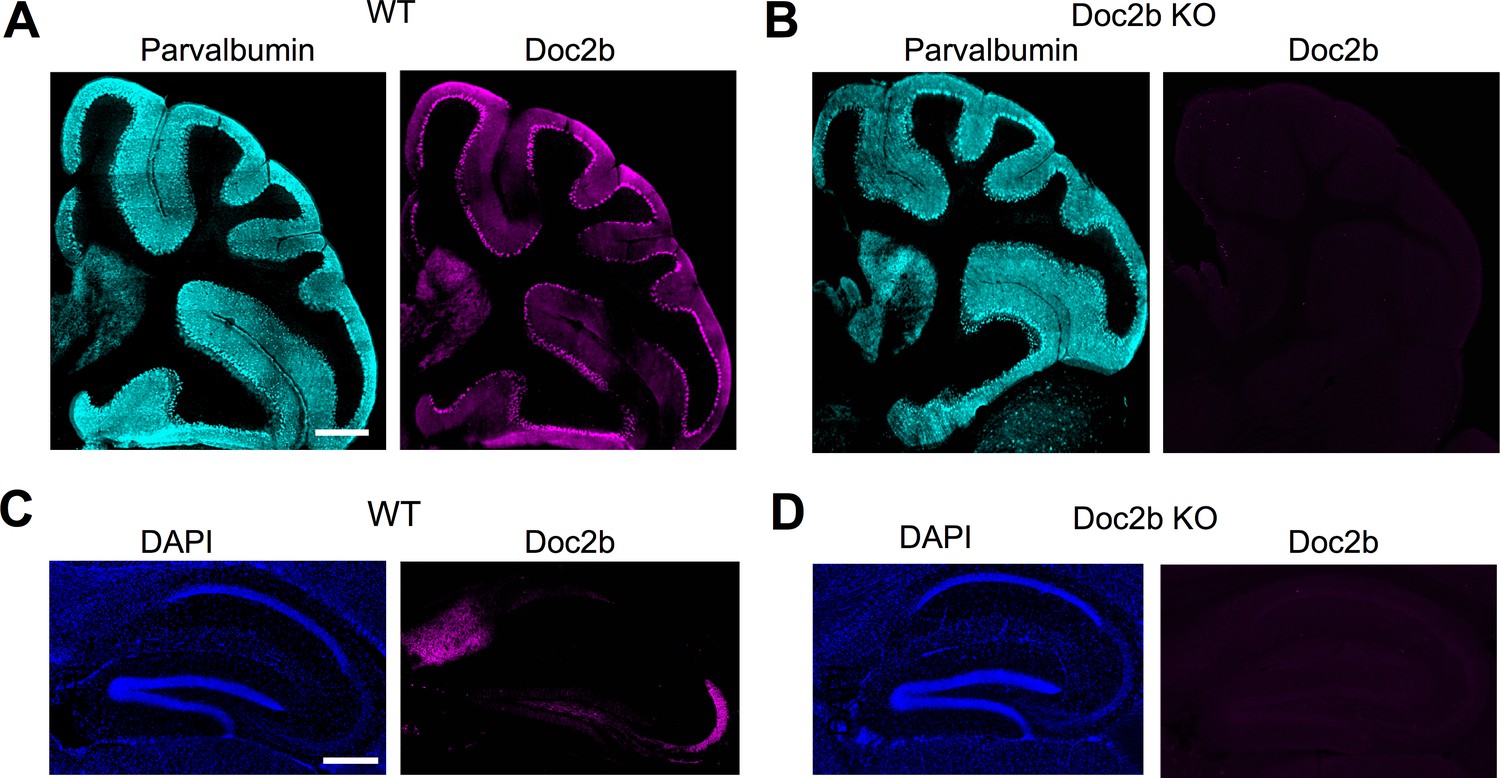
Doc2b immunohistochemistry in wildtype and Doc2b KO animals.
(A) Sagittal cerebellum slice from a WT mouse at postnatal day 60 (P60) immunostained for parvalbumin (left, cyan) and Doc2b (right, magenta). Scale bar, 300 μm. (B) Same as in (A) but for Doc2b KO. Images are on same scale as in (A). (C) Sagittal hippocampus slice from a WT mouse at P60 immunostained for DAPI (top, blue) and Doc2b (bottom, magenta). Scale bar, 300 μm. Abbreviation, Dentate gyrus (DG). (D) Same as in (C) but for Docb2 KO. Images are on same scale as in (C).
Figure 1—figure supplement 3
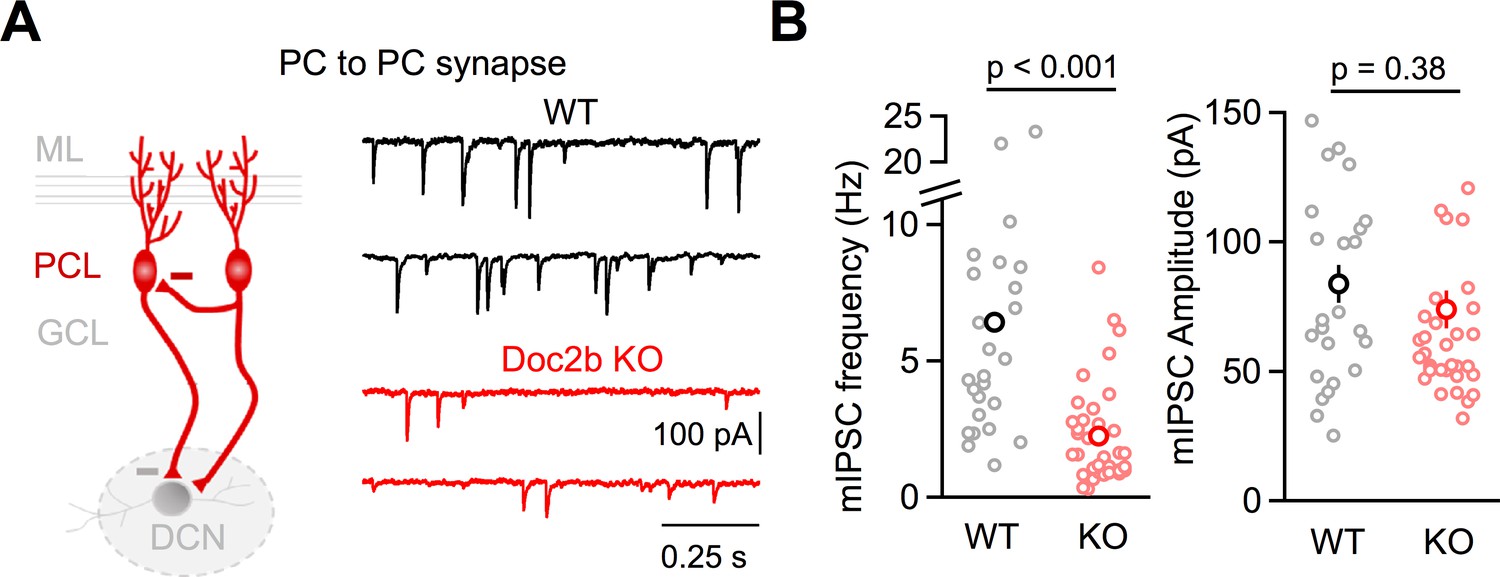
Doc2b KO reduces mIPSC frequency at PC to PC collateral synapses.
(A) mIPSCs were recorded at PC to PC synapses in P7-8 mice in the presence of TTX, NBQX, CPP, and strychnine. Representative traces from individual cells for WT (black) and Doc2b KO (red) littermates. (B) Summary data for mIPSC frequency and amplitude at PC to PC synapses. n = 25 cells (7 animals) for WT, n = 36 cells (7 animals) for Doc2b KO. Left: Statistical significance was assessed using two-tailed Wilcoxon Signed-Rank test after the data were found to be asymmetrically distributed (Shapiro-Wilk test). Right: Statistical significance was assessed using two-tailed Student’s t-tests after data were found to be normally distributed (Shapiro-Wilk test).
Figure 1—figure supplement 4
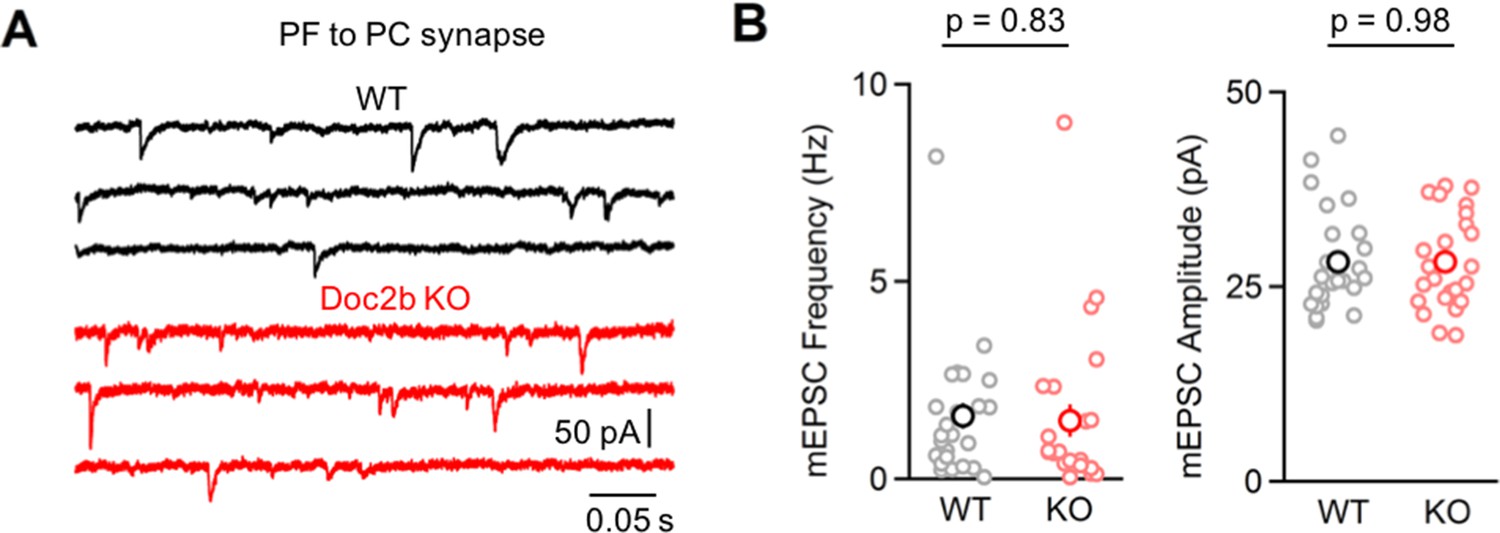
Postsynaptic loss of Doc2b does not alter mEPSC frequency onto PCs.
(A) mEPSCs were recorded at PC to PC synapses in P11-12 mice in the presence of TTX and gabazine. Representative traces from individual cells for WT (black) and Doc2b KO (red) littermates. (B) Summary data for mEPSC frequency and amplitude at PF to PC synapses. n = 25 cells (four animals) for WT, n = 24 cells (three animals) for Doc2b KO. Statistical significance was assessed using two-tailed Student’s t-tests.
Figure 2 with 2 supplements
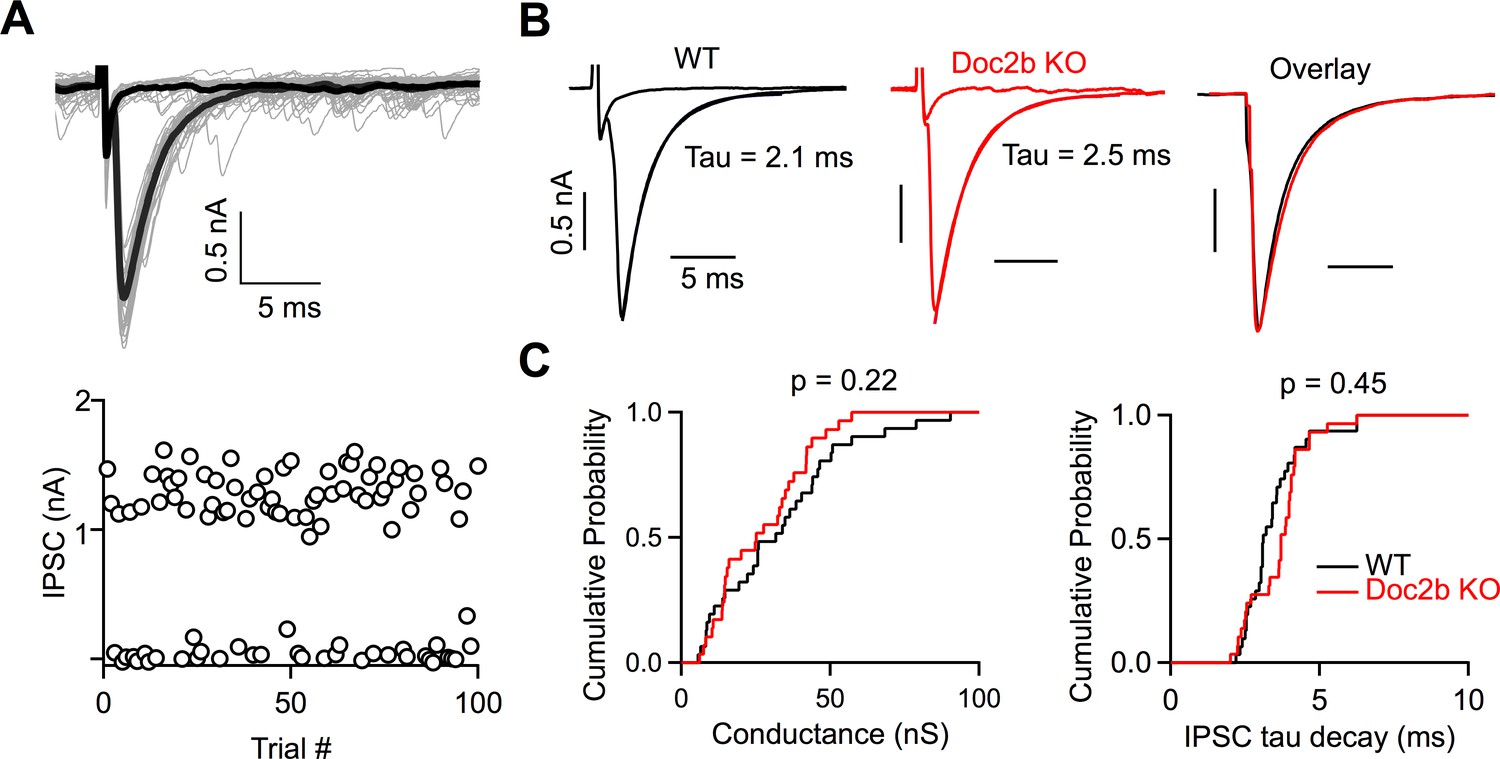
Doc2b does not contribute to the strength or kinetics of evoked release.
(A) Top: Example minimal stimulation of a PC input to a DCN neuron, where the stimulus intensity was lowered until failures or single inputs were evoked with similar probability. Bold traces show average traces for failures and single inputs. Bottom: IPSC amplitudes at a fixed stimulus intensity. (B) Representative examples of single inputs from WT and Doc2b KO mice. (C) Summary data for minimal conductances and single IPSC decay time constant (tau) for WT and Doc2b KO. n = 30 inputs for WT, n = 29 inputs for Doc2b KO. Average conductance was 30.9 ± 4 nS for WT and 26.9 ± 3 nS for Doc2b KO. Average IPSC tau decay was 3.43 ± 0.2 ms for WT and 3.63 ± 0.2 for Doc2b KO. Left: Statistical significance was assessed using two-tailed Wilcoxon Signed-Rank test after the data were found to be asymmetrically distributed (Shapiro-Wilk test). Right: Statistical significance was assessed using two-tailed Student’s t-tests after data were found to be normally distributed (Shapiro-Wilk test).
-
Figure 2—source data 1
PC to DCN single fibers and spontaneous events.
- https://cdn.elifesciences.org/articles/55165/elife-55165-fig2-data1-v1.xlsx
Figure 2—figure supplement 1
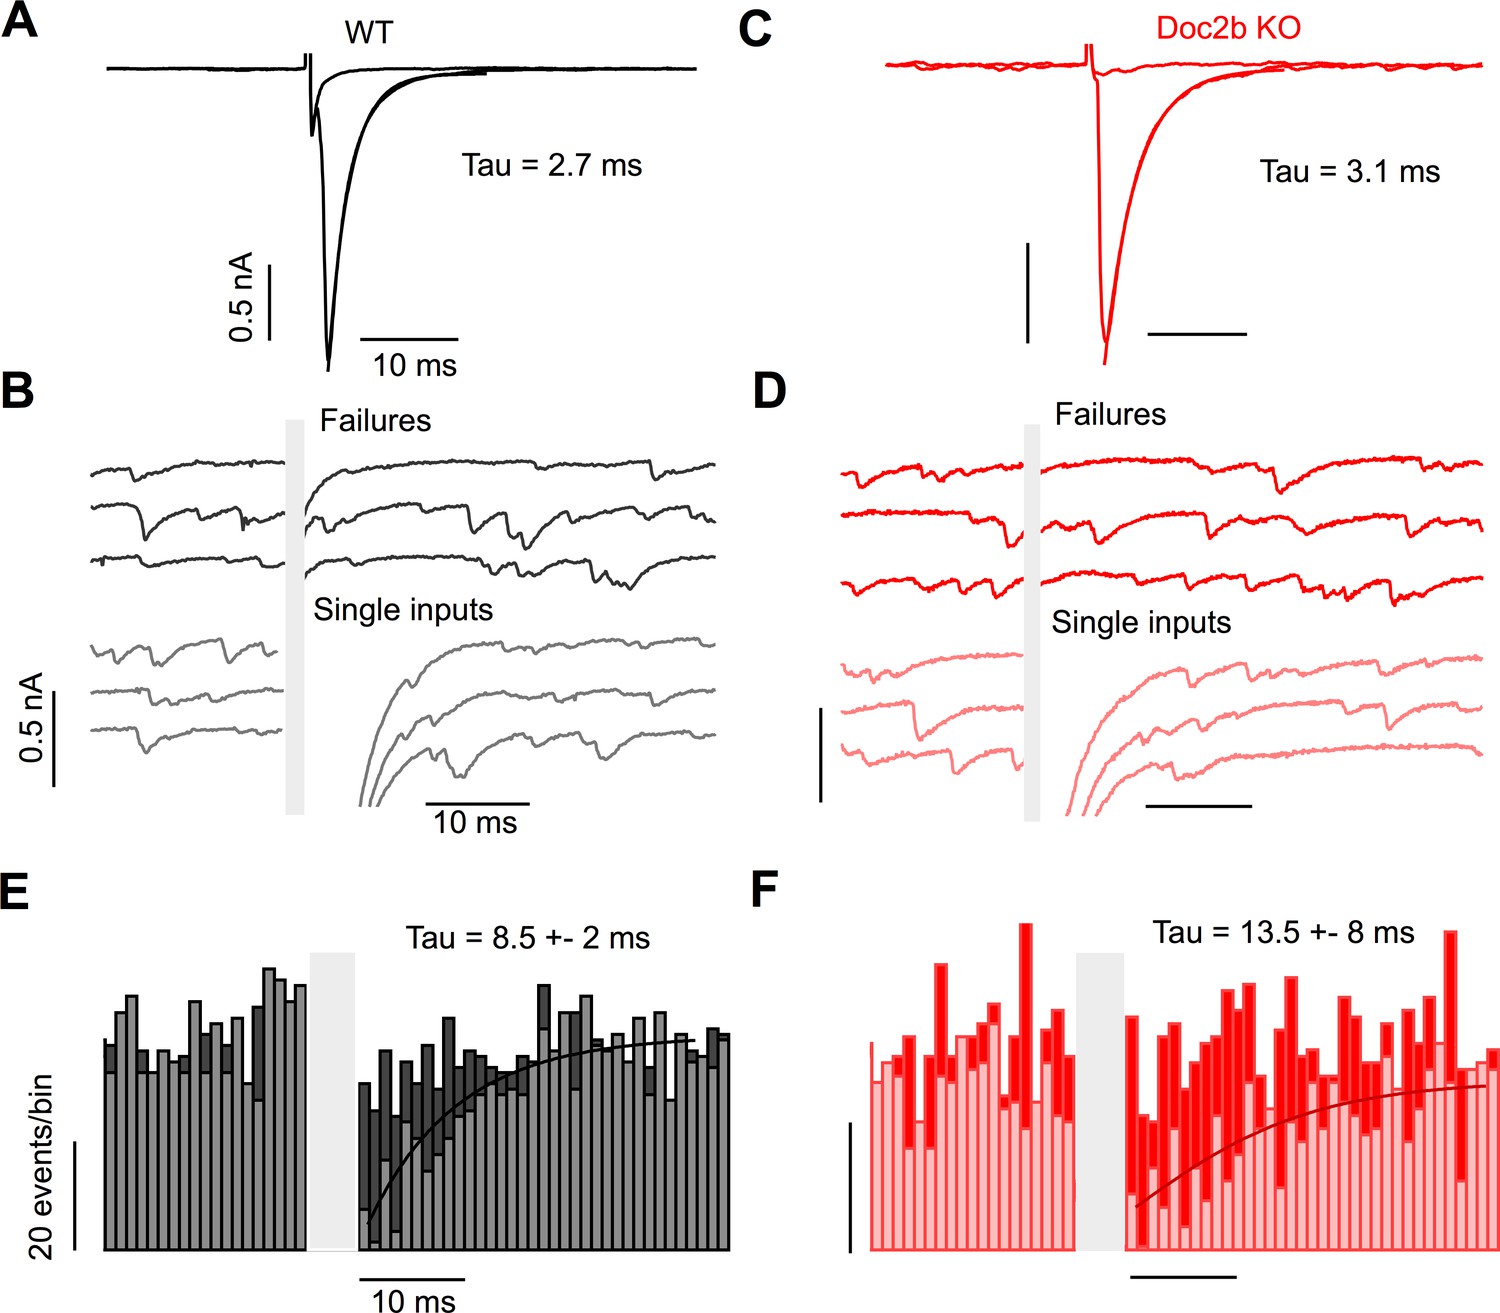
Asynchronous release after single stimuli does not occur at the PC to DCN synapse.
(A) Representative example of single input from WT, showing average failure and average input. (B) Individual trials from the example in (A) showing failures (top) and successfully evoked single inputs (bottom). Stimulus artifact is blanked for clarity. (C) Same as in (A) but for Doc2b KO. Same scale as in (A). (D) Same as in (B) but for Doc2b KO. Same scale as in (B). (E) Summary data of spontaneous events occurring before and after a minimal electrical stimulus in WT, sorted by events occurring during failures (dark) and inputs (light). Stimulus duration blanked for clarity. n = 9 cells (3 animals). (F) Same as in (E) but for Doc2b KO. n = 11 cells (4 animals). Same scale as in (E).
Figure 2—figure supplement 2
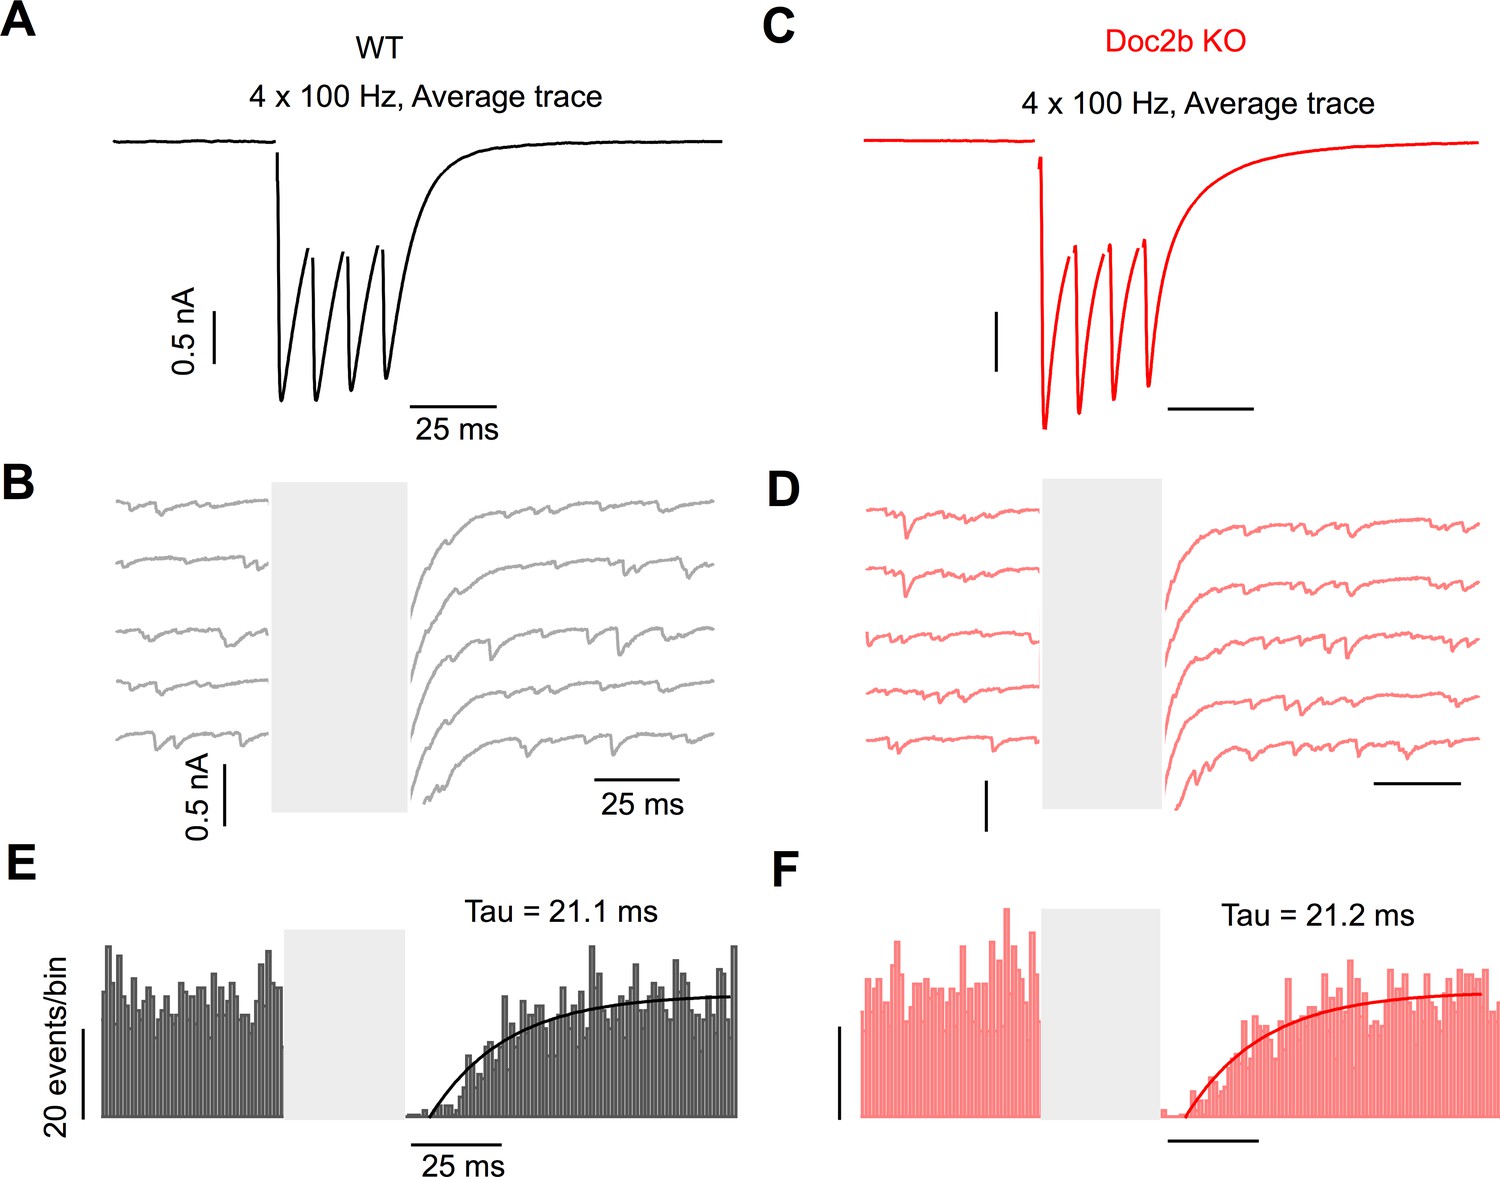
Asynchronous release after stimulus bursts does not occur at the PC to DCN synapse.
(A) Representative example of DCN response to 4 × 100 Hz burst stimulation of PC fibers from WT. (B) Individual trials from the example in (A). Stimulus artifact is blanked for clarity. (C) Same as in (A) but for Doc2b KO. Same scale as in (A). (D) Same as in (B) but for Doc2b KO. Same scale as in (B). (E) Summary data of spontaneous events occurring before and after burst stimulation in WT. Stimulus duration blanked for clarity. n = 9 cells (three animals). (F) Same as in (E) but for Doc2b KO. n = 11 cells (four animals). Same scale as in (E).
Figure 3

Short-term plasticity at the developing PC to DCN synapse is unaffected by Doc2bKO.
(A) PC axons were stimulated at various frequencies and responses were recorded from large DCN neurons in P13-15 mice. Representative IPSCs for WT are shown with stimulus artifact blanked for clarity. (B) Same as in (A) but for Doc2b KO. Same scale as in (A) unless indicated otherwise. (C) Normalized paired pulse ratio (PPR) as a function of stimulation frequency. Data are mean ± S.E.M. n = 14 cells (6 animals) for WT, n = 11 cells (6 animals) for Doc2b KO. Statistical significance was assessed using two-tailed Student’s t-tests after data were found to be normally distributed (Shapiro-Wilk test). (D) Same as in C but showing steady-state IPSC amplitude as a function of stimulation frequency. (E) Same as in C but showing steady-state decay time constant (λ) as a function of stimulation frequency.
-
Figure 3—source data 1
PC to DCN train data for young animals.
- https://cdn.elifesciences.org/articles/55165/elife-55165-fig3-data1-v1.xlsx
Figure 4

Doc2b is not necessary for frequency-invariant transmission at the mature PC to DCN synapse.
(A) Example of DCN response to PC axon stimulation at 10 Hz or 100 Hz in WT. Stimulus artifact blanked for clarity. (B) Same as in (A) but for Doc2b KO. Same scale as in (A) unless indicated otherwise. (C) Normalized steady-state IPSC amplitude as a function of stimulation frequency. Data are mean ± S.E.M. n = 10 cells (four animals) for WT, n = 9 cells (four animals) for Doc2b KO. Statistical significance was assessed using two-tailed Student’s t-tests after data were found to be normally distributed (Shapiro-Wilk test). (D) Same as in C but showing steady-state decay time constant (λ) as a function of stimulation frequency. (E) Example of DCN response to PC axon stimulation switched between 100 Hz and 10 Hz in WT and Doc2b KO, showing the frequency-independence of steady-state. Scale on right is same as scale on left. (F) Normalized IPSC amplitudes as a function of stimulus number for the protocol in (D). (G) Expanded view of examples in (D), showing a hidden facilitation unmasked when stepping from 10 Hz to 100 Hz. Scale on right is same as scale on left. (H) Same as in (E) but expanded view of frequency step from 10 Hz to 100 Hz.
-
Figure 4—source data 1
PC to DCN train data for adult animals.
- https://cdn.elifesciences.org/articles/55165/elife-55165-fig4-data1-v1.xlsx
Tables
Key resources table
| Reagent type (species) or resource | Designation | Source or reference | Identifiers | Additional information |
|---|---|---|---|---|
| Gene (M. musculus) | Doc2b (gene) Doc2b (protein) | UniProtKB | P-70169 | |
| Strain, strain background (M. musculus) | Doc2b KO mice | Doi:http://doi.org/10.1126/science.1183765; PMID:20150444 | ||
| Antibody | Rabbit polyclonal anti-Doc2b | Synaptic Systems | Cat #174 103; RRID:AB_2619874 | IHC (1:200) |
| Antibody | Mouse monoclonal anti-Parvalbumin | Sigma-Aldrich | Product#P3088-.2ML; RRID:AB_477329 | IHC (1:500) |
| Antibody | Goat anti-rabbit IgG H and L Alexa Fluor647 | Abcam | Ab150083; RRID:AB_2714032 | IHC (1:1000) |
| Antibody | Goat anti-mouse IgG H and L Alexa Fluor568 | Abcam | Ab175473 | IHC (1:1000) |
| Sequence-based reagent | Fluorophore-conjugated Probe-Mm-Doc2b | ACD Bio | Cat#484798 | |
| Sequence-based reagent | 2.5 VS Probe -Mm-Doc2A probe | ACD Bio | Cat#531549-C2 | |
| Software, algorithm | Matlab | Mathworks (https://www.mathworks.com/ downloads/) | RRID:SCR_001622 | Version R2017a |
| Software, algorithm | IgorPro | Wavemetrics (https://www.wavemetrics.com/order/order_igordownloads6.htm) | RRID:SCR_000325 | Version 6.37 |
| Software, algorithm | ImageJ software | ImageJ (http://imagej.nih.gov/ij/) | RRID:SCR_003070 | |
| Software, algorithm | OlyVIA software | Olympus (https://www.olympus-lifescience.com/en/support/downloads/) | RRID:SCR_016167 | Version 2.9.1 |
| Sequence-based reagent | Doc2b primers | This paper | PCR primers | 5’CATTGCCACTTCATAAGCGTAAGTTTCC 3’ 5’CGAGGATGGAACCCTGTTTACTCTGG 33’ 5’CCTTCTATCGCCTTCTTGACG 3’ |
| Chemical compound, drug | NBQX disodium salt | Abcam | Ab120046 | |
| Chemical compound, drug | (R)-CPP | Abcam | Ab120159 | |
| Chemical compound, drug | Strychnine hydrochloride | Abcam | Ab120416 | |
| Chemical compound, drug | SR95531 (gabazine) | Abcam | Ab120042 | |
| Chemical compound, drug | Tetrodotoxin citrate | Abcam | Ab120055 | |
| Other | DAPI stain | Invitrogen (ThermoFIsher Scientific) | Cat#00-3958-02 | (1 µg/mL) |
Additional files
Download links
A two-part list of links to download the article, or parts of the article, in various formats.
Downloads (link to download the article as PDF)
Open citations (links to open the citations from this article in various online reference manager services)
Cite this article (links to download the citations from this article in formats compatible with various reference manager tools)
Loss of Doc2b does not influence transmission at Purkinje cell to deep nuclei synapses under physiological conditions
eLife 9:e55165.
https://doi.org/10.7554/eLife.55165


