LTD at amygdalocortical synapses as a novel mechanism for hedonic learning
- Department of Neurobiology and Behavior, SUNY – Stony Brook, United States
Figures
Figure 1 with 2 supplements
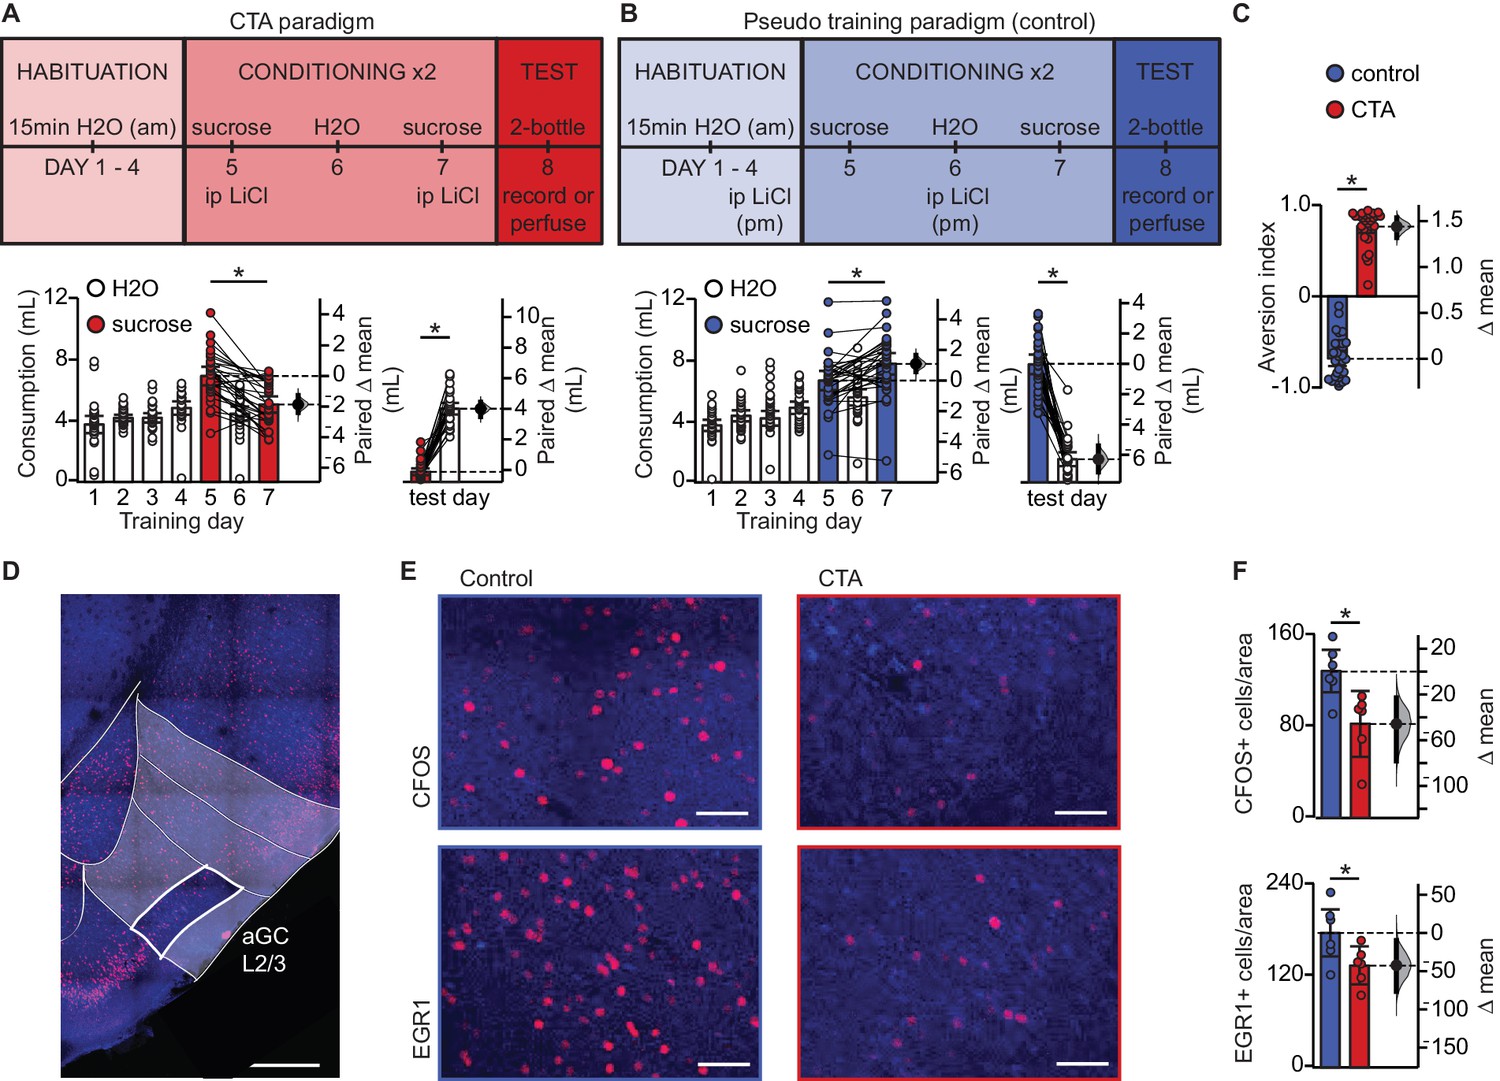
Conditioned taste aversion learning differentially recruits EXC neurons in L2/3 aGC.
(A) Behavioral paradigm schematic. Animals in the control group (N = 30) received ip LiCl (7.5 mL/kg of 0.15M LiCl) the evening prior to exposure to a sucrose solution. Animals in the CTA group (N = 28) received ip LiCl after sucrose exposure. (B) Fluid consumption across training days for each group. Rats in both groups showed an initial preference for sucrose over water which shifts after conditioning (Control: C1 sucrose 6.66 ± 0.63 mL vs. C2 sucrose 7.75 ± 0.70 mL, p<10−3; CTA: C1 sucrose 6.93 ± 0.61 mL vs. C2 sucrose 5.06 ± 0.53 mL, p<10−7) and at testing (2-bottle test, Control: sucrose 7.72 ± 0.64 mL vs. H2O 1.52 ± 0.45 mL, p<10−14; CTA: sucrose: 0.66 ± 0.22 mL vs. H2O 4.79 ± 0.38 mL, p<10−16). (C) Aversion index on test day (Control −0.68 ± 0.08 vs. CTA 0.76 ± 0.07, p<10−32). (D) Representative image depicting region of interest (ROI, L2/3 aGC, white box). Scale bar = 500 μm. Red: immediate early gene; blue: Nissl counterstain. For details on imaging procedures see Materials and methods. (E) Representative images of c-Fos expression (top) and EGR1 expression (bottom) following 2-bottle testing from control group (left) and CTA group (right). Scale bar = 100 μm. (F) Average counts of c-Fos expressing and EGR1 expressing neurons normalized to the area of the ROI. (c-Fos [N = 6]: Control 128.13 ± 9.46 positive nuclei/0.1 mm2 vs. CTA 82.21 ± 11.73, p<0.01; EGR1 [N = 6], control: 175.90 ± 15.65 vs. CTA: 133.03 ± 10.10, p<0.05). IEG expression was not significantly correlated with sucrose consumption for any group (Control: c-Fos, rs = 0.60, p=0.21; EGR1, rs = 0.43, p=0.40; CTA: c-Fos, rs = −0.37, p=0.47; EGR1, rs = 0.60, p=0.21). * indicates p≤0.05. Error bars ± 95% CI. The source data reported in the figure are in the Figure 1—source data 1.
-
Figure 1—source data 1
This file contains source data and statistics presented in each panel of Figure 1, Figure 1—figure supplement 1 and Figure 1—figure supplement 2.
Excel worksheet tabs are labeled to indicate the specific figure. Each data table is labeled to indicate the specific figure panel. The statistics worksheet indicates specific tests and values applied to each data set in the figure and supplements.
- https://cdn.elifesciences.org/articles/55175/elife-55175-fig1-data1-v1.xlsx
Figure 1—figure supplement 1
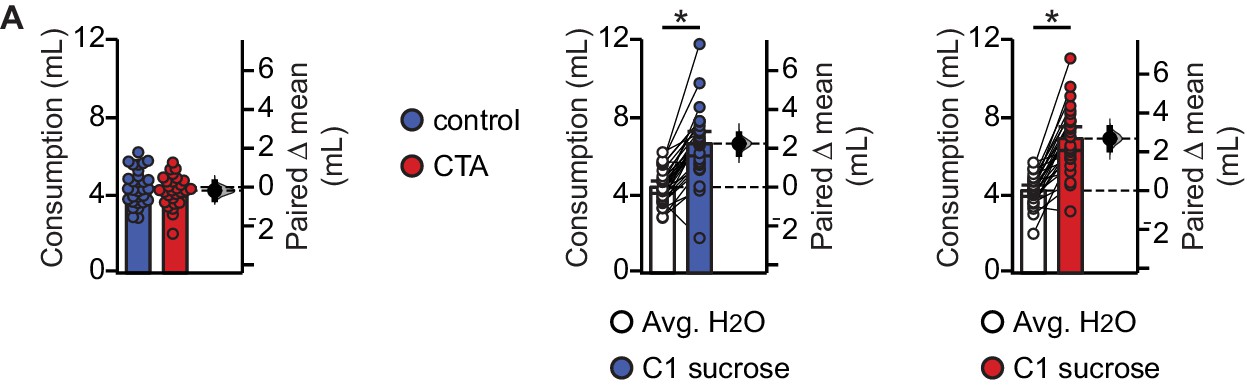
Baseline water consumption and initial sucrose palatability do not differ between groups.
(A) Average water consumption prior to conditioning did not differ between groups and rats in both groups showed an initial preference for sucrose over water (Control, [N = 30]: average H2O 4.42 ± 0.32 mL/day vs. C1 sucrose 6.66 ± 0.63 mL, p<10−9; CTA, [N = 28]: average H2O 4.24 ± 0.29 mL/day vs. C1 sucrose 6.93 ± 0.61 mL, p<10−10. Control H2O vs. CTA H2O, p=0.43). * indicates p≤0.05. Error bars ± 95% CI. The source data reported in the figure are in the Figure 1—source data 1.
Figure 1—figure supplement 2

Stability of CTA learning across testing days.
(A) Diagram of behavioral paradigm to assess whether the 2-bottle test represents an extinction trial. (B) Average fluid consumption across training sessions (Extinction testing, [N = 8 rats]: average H2O 4.77 ± 0.74 mL/day vs. C1 sucrose 7.70 ± 0.99 mL, p<0.01; C1 sucrose 7.70 ± 0.99 mL vs. C2 sucrose 4.84 ± 1.38 mL, p<0.01). (C) Results from 2-bottle tests on two consecutive days (Test A: sucrose 0.54 ± 0.29 mL vs. H2O 5.41 ± 1.75 mL, p<10−4; Test B: sucrose 0.47 ± 0.26 mL vs. H2O 4.90 ± 2.00 mL, p<10−3). (D) Aversion indices on test day and 24 hr later (AI: test A 0.77 ± 0.15 vs. test B 0.74 ± 0.16, p=0.74). * indicates p≤0.05. Error bars ± 95% CI. The source data reported in the figure are in the Figure 1—source data 1.
Figure 2 with 1 supplement
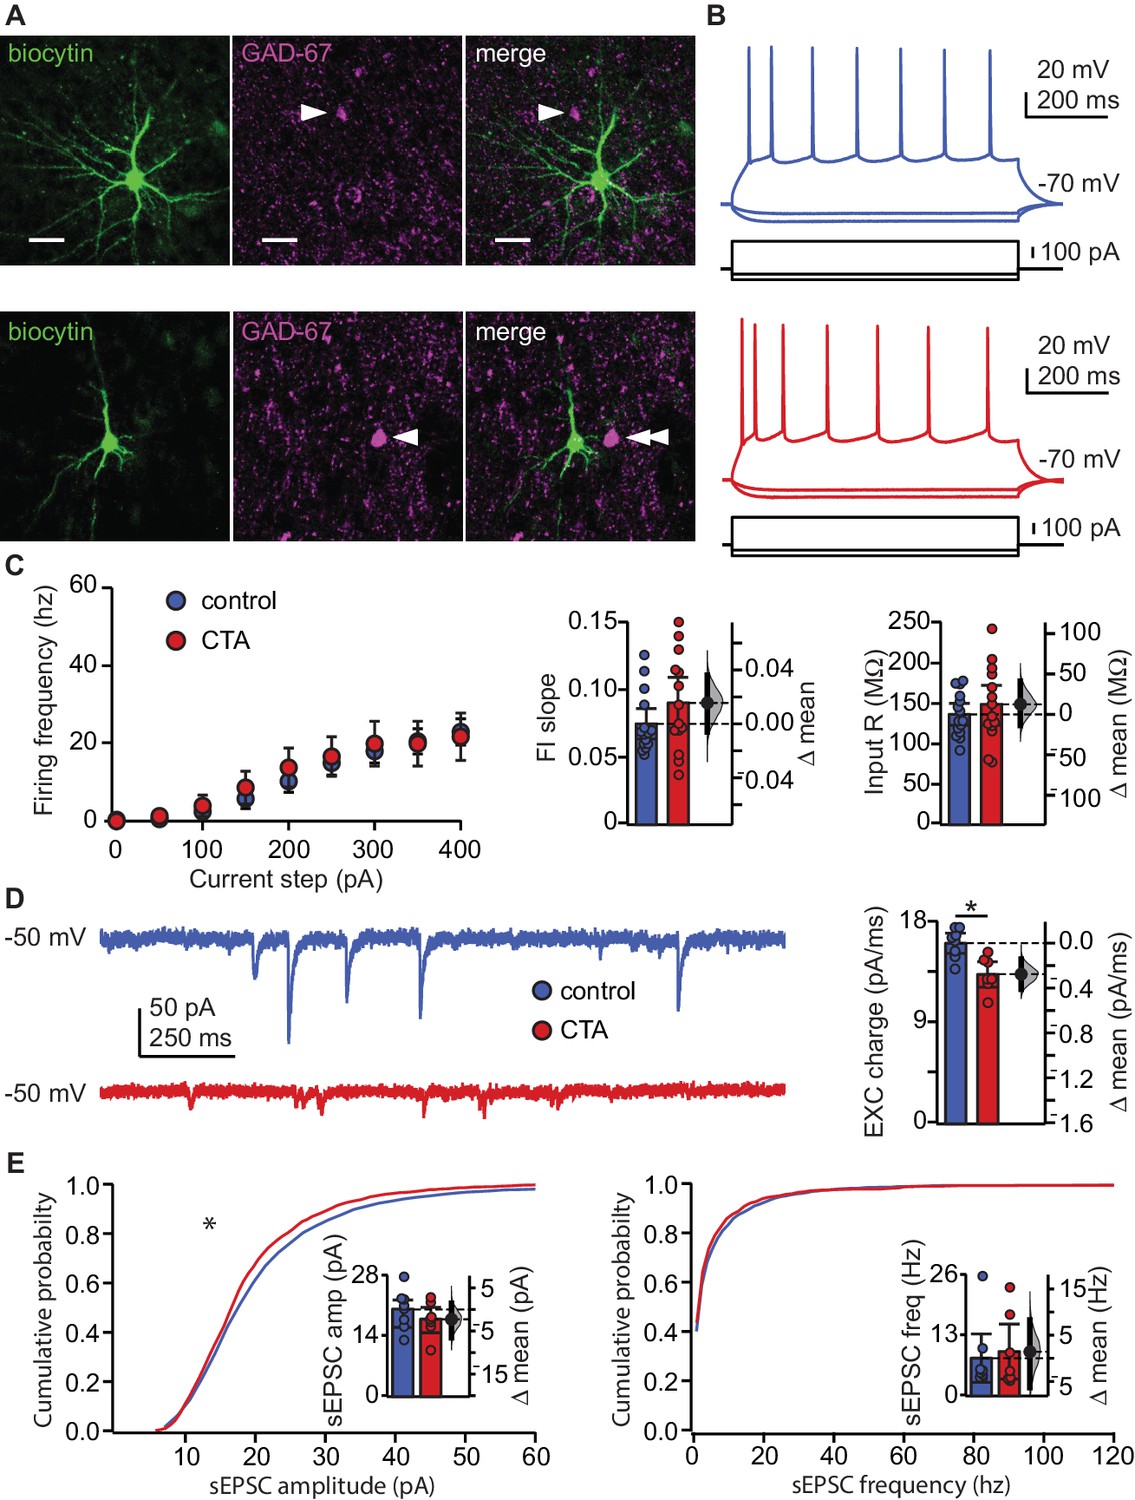
CTA learning does not affect intrinsic excitability but reduces excitatory synaptic drive onto EXC neurons in L2/3 aGC.
(A) Images of example recorded neurons from a control animal (top) and CTA animal (bottom). Left: biocytin (green), middle: GAD-67 (magenta), right: Merge showing lack of co-localization. Scale bar = 25 μm. (B) Steady-state firing patterns of neurons from a control animal (top) and CTA animal (bottom). (C) FI curves from control (N = 15 rats, 3–4 cells/animal) and CTA animals (N = 14 rats, 3–4 cells/animal). Average FI slope and input resistance did not differ between groups (FI slope: Control 0.07 ± 0.01 vs. CTA 0.09 ± 0.02, p=0.17; Input Resistance: Control 136.47 ± 13.62 MΩ vs. CTA 148.97 ± 24.59 MΩ, p=0.38). (D) Sample traces of sEPSCs (holding = −50 mV) onto a control neuron and CTA neuron. Average EXC charge was larger in the control group (Control, [N = 8 rats, 3 cells/animal] 16.09 ± 0.90 pC vs. CTA [N = 7 rats, 3–4 cells/animal] 13.32 ± 1.14 pC, p<0.01). (E) Cumulative probability plots showing a decrease in sEPSC amplitude (left), but not sEPSC instantaneous frequency (right) in the CTA group (sEPSC amplitude [n = 24 cells/group, α = 0.0004]: Control vs. CTA, p<10−11; sEPSC frequency [n = 24 cells/group, α = 0.0004]: Control vs. CTA, p=0.02). Average sEPSC amplitude and frequency (insets) did not differ between groups (sEPSC amplitude: Control, [N = 8 rats, 3 cells/animal] 20.23 ± 3.12 pA vs. CTA [N = 7 rats, 3–4 cells/animal] 17.94 ± 2.96 pA, p=0.32; sEPSC frequency: Control, [N = 8 rats, 3 cells/animal] 8.14 ± 5.17 Hz vs. CTA [N = 7 rats, 3–4 cells/animal] 9.55 ± 5.90 Hz, p=0.75). * indicates p≤0.05. Error bars ± 95% CI. The source data reported in the figure are in the Figure 2—source data 1.
-
Figure 2—source data 1
This file contains source data and statistics presented in each panel of Figure 2, Figure 2—figure supplement 1.
Excel worksheet tabs are labeled to indicate the specific figure. Each data table is labeled to indicate the specific figure panel. The statistics worksheet indicates specific tests and values applied to each data set in the figure and supplements.
- https://cdn.elifesciences.org/articles/55175/elife-55175-fig2-data1-v1.xlsx
Figure 2—figure supplement 1

Changes in synaptic drive do not mask changes in intrinsic excitability.
(A) FI curves from the control group before and after bath application of synaptic blockers (20 μm DNQX, 50 μm AP5, 20 μm picrotoxin). Average FI slope decreased (Control [n = 18 cells from three rats] pre 0.055 ± 0.005 vs. post 0.051 ± 0.006, p<0.006) and input resistance increased (Control [n = 18 cells from three rats] pre 128.24 ± 21.27 MΩ vs. post 141.95 ± 21.99 MΩ, p<0.009) in the presence of synaptic blockers. (B) FI curves from the CTA group before and after bath application of synaptic blockers (20 μm DNQX, 50 μm AP5, 20 μm picrotoxin). Average FI slope was unchanged (CTA [n = 19 cells from three rats] pre 0.062 ± 0.010 vs. post 0.059 ± 0.011, p=0.16) but input resistance increased (CTA [n = 19 cells from three rats] pre 130.32 ± 18.66 MΩ vs. post 139.26 ± 19.96 MΩ, p<0.05) in the presence of synaptic blockers. (C) Comparison of FI curves from the control and CTA groups after bath application of synaptic blockers (20 μm DNQX, 50 μm AP5, 20 μm picrotoxin). FI slope (Control vs. CTA, p=0.19) and input resistance (Control vs. CTA, p=0.86) did not differ between groups in the presence of synaptic blockers. * indicates p≤0.05. Error bars ± 95% CI. The source data reported in the figure are in the Figure 2—source data 1.
Figure 3 with 1 supplement
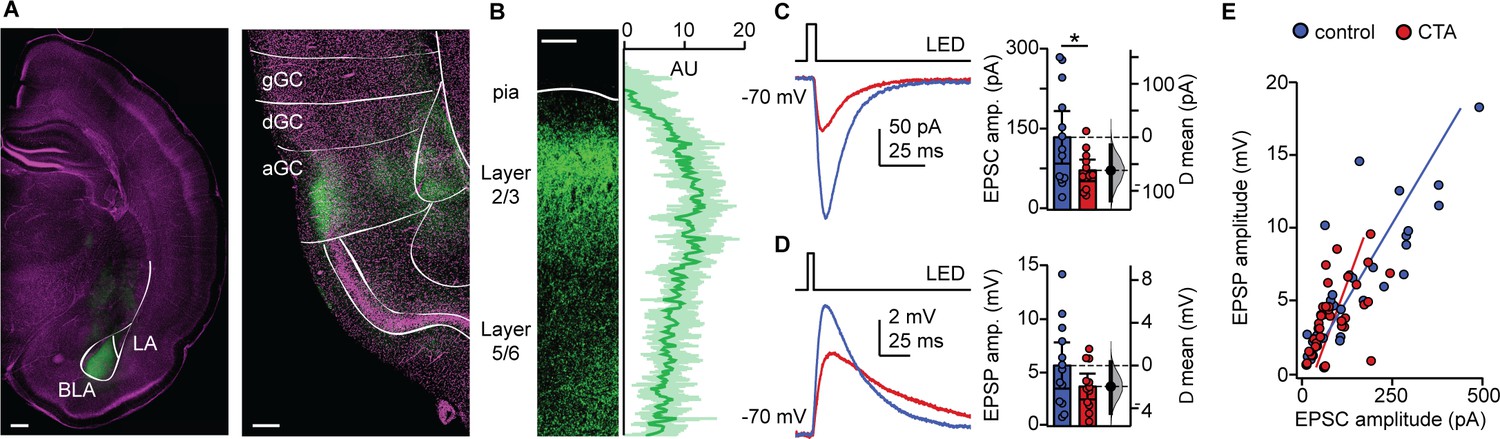
CTA decreases BLA input onto L2/3 pyramidal neurons in aGC.
(A) Example of histological verification of injection site and expression of opsin construct in BLA terminal fields in aGC. Left: Image of ChR2-Venus expression at BLA injection site (scale bar = 500 µm; BLA, basolateral nucleus; LA, lateral nucleus); right: image of ChR2-Venus expression of BLA afferent fibers in aGC (scale bar = 250 µm; green: ChR2-Venus, magenta: Hoechst; gGC, granular GC; dGC, dysgranular GC; aGC, agranular GC). (B) Left: Image of ChR2-VENUS expression in BLA afferent fiber in aGC. Scale bar = 250 μm. Right: Calibration curve of ChR2-VENUS intensity across lamina in aGC (±1 SD). (C) Sample traces of optogenetically-evoked BLA-EPSCs. BLA-EPSC amplitudes onto CTA neurons were reduced (Control [N = 13 rats, 2–3 cells/animal] 135.42 ± 49.17 pA vs. CTA [N = 12 rats, 2–3 cells/animal] 73.36 ± 20.17 pA, p<0.03). (D) Sample traces of optogenetically-evoked BLA-EPSPs. Summary of BLA-EPSP amplitudes onto control neurons and CTA neurons (Control [N = 13 rats, 2–3 cells/animal] 5.67 ± 2.16 mV vs. CTA [N = 12 rats, 2–3 cells/animal] 3.70 ± 1,20 mV, p=0.14). (E) Input-output plot of BLA-EPSCs and BLA-EPSPs for the control group and CTA group (Control [n = 30 cells] rs = 0.84, p<10−6; CTA [n = 34 cells] rs = 0.69, p<10−5). * indicates p≤0.05. Error bars ± 95% CI. The source data reported in the figure are in the Figure 3—source data 1.
-
Figure 3—source data 1
This file contains source data and statistics presented in each panel of Figure 3, Figure 3—figure supplement 1.
Excel worksheet tabs are labeled to indicate the specific figure. Each data table is labeled to indicate the specific figure panel. The statistics worksheet indicates specific tests and values applied to each data set in the figure and supplements.
- https://cdn.elifesciences.org/articles/55175/elife-55175-fig3-data1-v1.xlsx
Figure 3—figure supplement 1
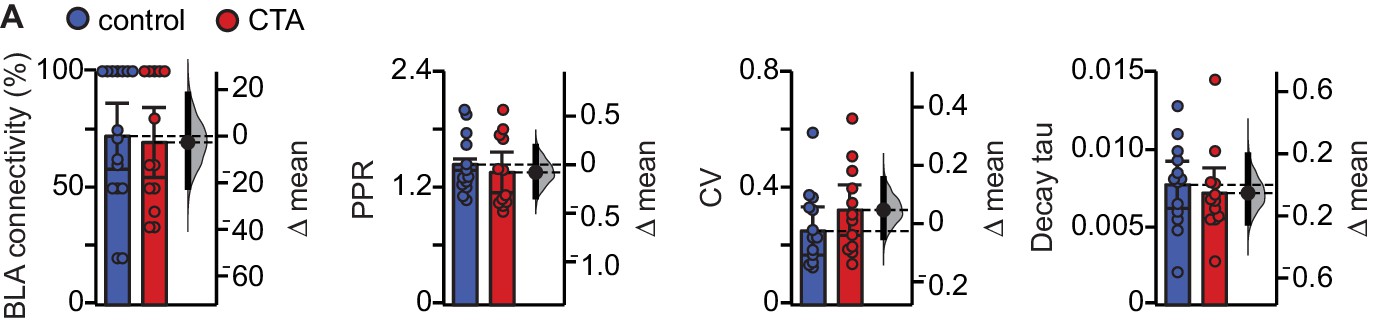
CTA does not affect connectivity, PPR, CV, or decay tau.
(A) CTA does not affect the percentage of neurons that receive input from BLA (Control [N = 16 rats] 72.43 ± 14.19% vs. CTA [N = 13 rats] 69.74 ± 15.04%, p=0.80), paired-pulse ratio (Control [N = 13 rats, 2–3 cells/animal] 1.45 ± 0.17 vs. CTA [N = 12 rats, 2–3 cells/animal] 1.36 ± 0.21, p=0.55), coefficient of variation (Control [N = 13 rats, 2–3 cells/animal] 0.28 ± 0.06 vs. CTA [nN = 12 rats, 2–3 cells/animal] 0.32 ± 0.09, p=0.38), or decay tau (Control [N = 13 rats, 2–3 cells/animal] 0.008 ± 0.002 vs. CTA [N = 12 rats, 2–3 cells/animal] 0.007 ± 0.002, p=0.66). Error bars ± 95% CI. The source data reported in the figure are in the Figure 3—source data 1.
Figure 4 with 1 supplement

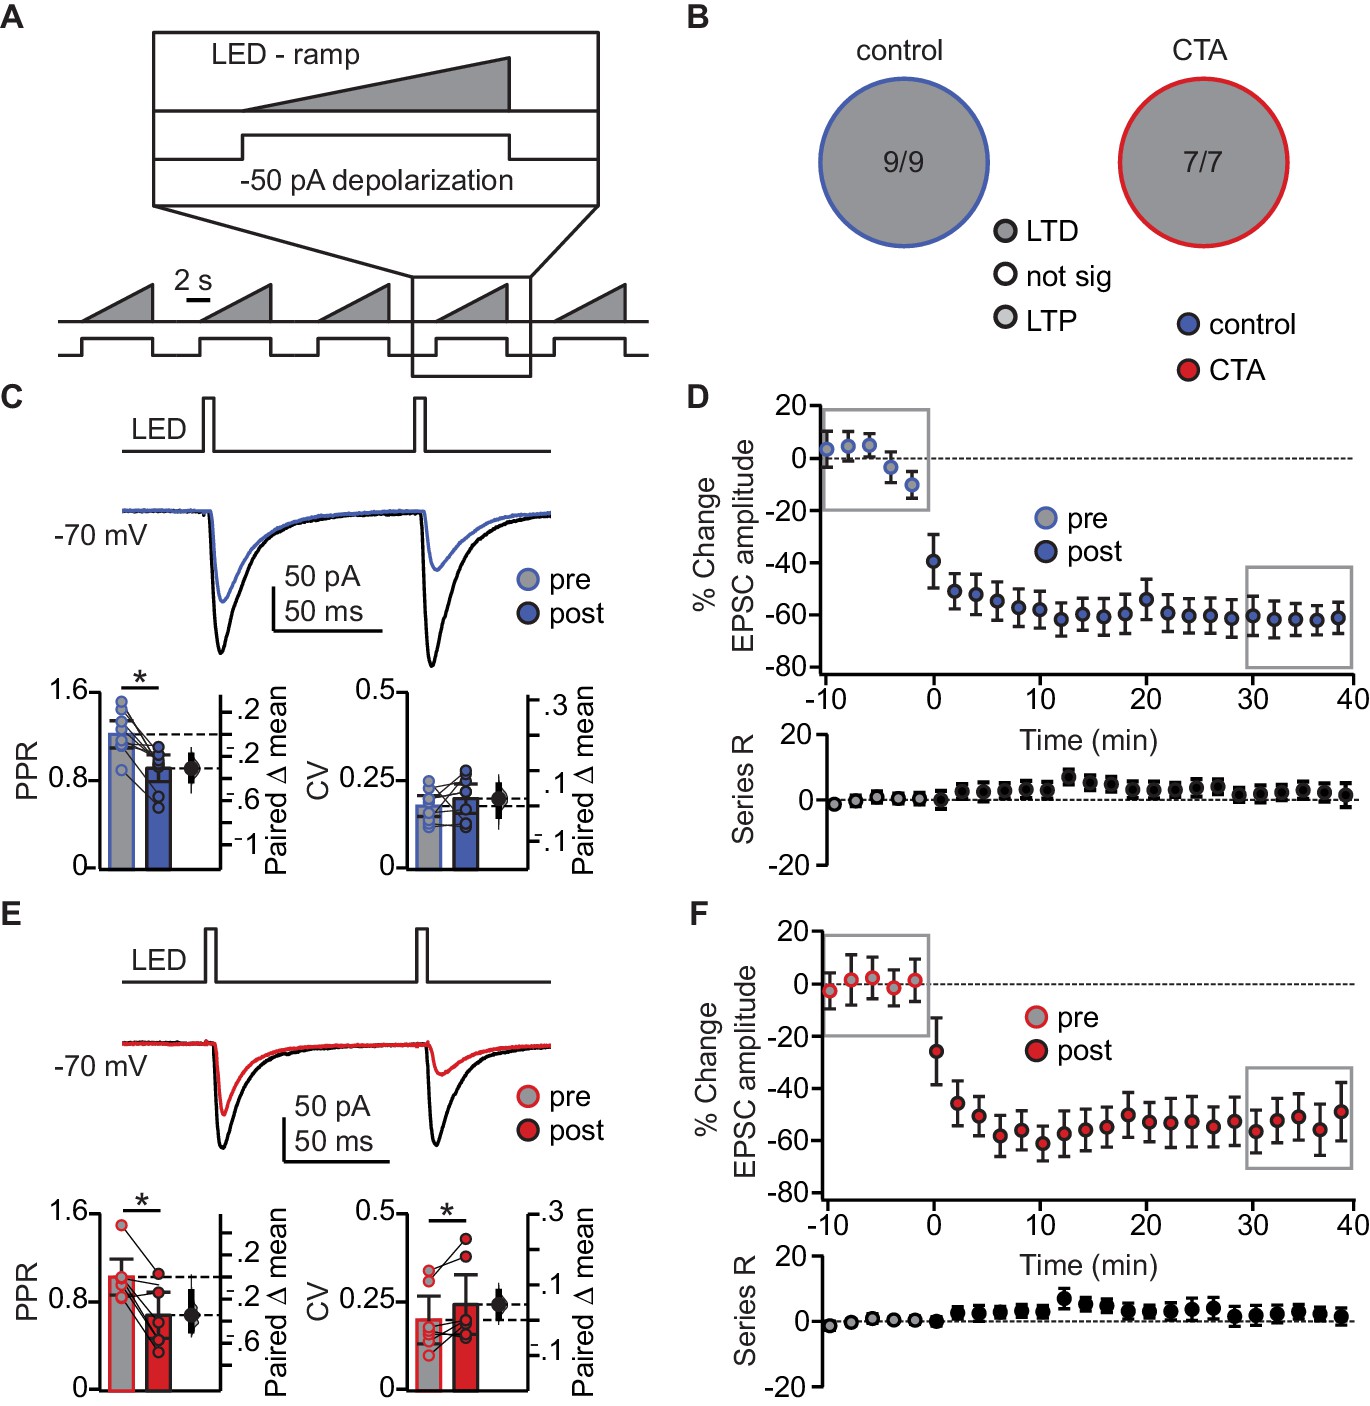
CTA learning occludes LTD induction onto L2/3 pyramidal neurons in aGC.
(A) Schematic of 20 Hz plasticity induction paradigm. BLA terminal fields were activated with 20 bursts of 20 light pulses (5 ms) at 20 Hz delivered every 250 ms, while the postsynaptic neuron was depolarized subthreshold by injection of a 50 pA current step. (B) Distribution of the outcome of plasticity induction across all neurons recorded (Control LTD [n = 13 cells from 8 rats] 56.52%, no change [n = 5 cells from 5 rats] 21.74%, LTP [n = 5 cells from two rats] 21.74% vs. CTA LTD [n = 5 cells from five rats] 21.74%, no change [n = 7 cells from 4 rats] 30.43%, LTP [n = 11 cells from 6 rats] 47.83%, 3 × 2 χ2, p<0.05). (C) Sample traces of control group BLA-EPSC before and after 20 Hz plasticity induction. 20 Hz LTD induction did not affect control group PPR or CV (Control [n = 13 cells from 8 rats]: PPR pre 1.66 ± 0.38 vs. post 1.36 ± 0.26, p=0.10; CV pre 0.27 ± 0.09 vs. post 0.27 ± 0.09, p=0.96). (D) Time course of change in BLA-EPSC amplitude (Control: % change from baseline −35.66 ± 2.65) and series resistance (Control: % change from baseline 2.57 ± 0.78) following 20 Hz LTD induction in control group. Boxes indicate pre- and post-induction epochs. (E) Sample traces of CTA group BLA-EPSC before and after 20 Hz plasticity induction. 20 Hz LTP induction did not affect CTA group PPR or CV (CTA [n = 11 cells from 6 rats]: PPR pre 1.39 ± 0.33 vs. post 1.22 ± 0.31, p=0.09; CV pre 0.33 ± 0.08 vs. post 0.27 ± 0.10, p=0.41). (F) Time course of change in BLA-EPSC amplitude (CTA: % change from baseline 62.37 ± 8.55) and series resistance (CTA: % change from baseline 0.94 ± 0.47) following 20 Hz LTP induction in CTA group. Boxes indicate pre- and post-induction epochs. * indicates p≤0.05. Error bars ± 95% CI. The source data reported in the figure are in the Figure 4—source data 1.
-
Figure 4—source data 1
This file contains source data and statistics presented in each panel of Figure 4, Figure 4—figure supplement 1.
Excel worksheet tabs are labeled to indicate the specific figure. Each data table is labeled to indicate the specific figure panel. The statistics worksheet indicates specific tests and values applied to each data set in the figure and supplements.
- https://cdn.elifesciences.org/articles/55175/elife-55175-fig4-data1-v1.xlsx
Figure 4—figure supplement 1

Activity during 20Hz induction protocol and relationship between baseline PPR, CV, or decay tau and post-induction plasticity.
(A) Sample traces from the control and CTA group before and after plasticity induction superimposed. (B) Summary of spiking activity during the 20 Hz plasticity induction protocol. In both groups, the induction protocol elicited action potentials in a subset of neurons (Control: spikes [n = 7 cells from 4 rats] 30.43%, no spikes [n = 16 cells from 11 rats] 69.57% vs. CTA: spikes [n = 9 cells from 4 rats] 39.13%, no spikes [n = 14 cells from 7 rats] 60.87%, χ2, p=0.75). (C) In both the control group and CTA group there was not a significant correlation between the magnitude of plasticity induced with the 20 Hz protocol and the initial PPR (Control: rs = 0.00, p=1.00; CTA: rs = −0.07, p=0.75), CV (Control: rs = 0.12, p=0.59; CTA: rs = −0.12, p=0.59), or decay tau (Control: rs = 0.07, p=074; CTA: rs = 0.11, p=0.61). The source data reported in the figure are in the Figure 4—source data 1.
Figure 5 with 1 supplement
Occlusion of LTD following CTA is specific to BLA activity regime.
(A) Schematic of tonic induction paradigm. BLA terminal fields were activated with 6 s ramping stimuli delivered every 250 ms, while the postsynaptic neuron was depolarized subthreshold by injection of a 50 pA current step. (B) Distribution of the outcome of plasticity induction across all neurons recorded (Control LTD [n = 9 cells from 4 rats] 100.00%, vs. CTA LTD [n = 7 cells from 4 rats] 100.00%, 3 × 2 χ2, p=1.00). (C) Sample traces of control group BLA-EPSC before and after ramp plasticity induction. Ramp LTD induction reduced control group PPR but did not affect CV (Control [n = 9 cells from 4 rats]: PPR pre 1.22 ± 0.12 vs. post 0.92 ± 0.12, p<10−3; CV pre 0.18 ± 0.03 vs. post 0.20 ± 0.04, p=0.33). (D) Time course of change in BLA-EPSC amplitude (Control: % change from baseline −61.87 ± 10.92) and series resistance (Control: % change from baseline 4.37 ± 4.01) following ramp LTD induction in control group. Boxes indicate pre- and post-induction epochs. (E) Sample traces of CTA group BLA-EPSC before and after ramp plasticity induction. Ramp LTD induction reduced CTA group PPR and increased CV (CTA [n = 7 cells from 4 rats]: PPR pre 1.03 ± 0.16 vs. post 0.68 ± 0.21, p<0.03; CV pre 0.20 ± 0.07 vs. post 0.24 ± 0.08, p<0.03). (F) Time course of change in BLA-EPSC amplitude (CTA: % change from baseline −52.70 ± 6.48) and series resistance (CTA: % change from baseline 2.16 ± 4.79) following ramp LTD induction in CTA group. Boxes indicate pre- and post-induction epochs. * indicates p≤0.05. Error bars ± 95% CI. The source data reported in the figure are in Figure 5—source data 1.
-
Figure 5—source data 1
This file contains source data and statistics presented in each panel of Figure 5, Figure 5—figure supplement 1.
Excel worksheet tabs are labeled to indicate the specific figure. Each data table is labeled to indicate the specific figure panel. The statistics worksheet indicates specific tests and values applied to each data set in the figure and supplements.
- https://cdn.elifesciences.org/articles/55175/elife-55175-fig5-data1-v1.xlsx
Figure 5—figure supplement 1

Activity during ramp induction protocol and relationship between baseline PPR, CV, or decay tau and post-induction plasticity.
(A) Sample traces from the control and CTA group before and after plasticity induction superimposed. (B) Summary of spiking activity during the ramp plasticity induction protocol. The ramp induction protocol elicited action potentials in a subset of CTA neurons (CTA: spikes [n = 3 cells from 3 rats] 42.86%, no spikes [n = 4 cells from 2 rats] 57.14%) but no control neurons. (C) In the control group there was a significant correlation between the amount of plasticity induced with the ramp protocol and the initial coefficient of variation (Control: rs = −0.85, p<0.01) but not with the paired-pulse ratio (PPR) (Control: rs = −0.34, p=0.37), or decay tau (Control: rs = 0.28, p=0.47). There was not a significant correlation between the magnitude of plasticity induced with the ramp protocol and the initial PPR (CTA: rs = 0.16, p=0.73), CV (CTA: rs = 0.18, p=0.70), or decay tau (CTA: rs = −0.22, p=0.64) in the CTA group. The source data reported in the figure are in Figure 5—source data 1.
Figure 6 with 1 supplement

BLA terminal field activation in vivo with the phasic 20 Hz pattern eliminated sucrose preference.
(A) Cartoon of experimental approach. AAV9.hSyn.eGFP.WPRE.bGH: (GFP control group) or AAV9.CAG.ChR2-Venus.WPRE.SV40 (Paired 20 Hz group) were injected in BLA and an optic fiber (400 µm diameter, coated with DiL) was implanted in aGC. (B) Correct positioning of injection site in BLA and of optic fiber in aGC were verified histologically. Left, green: injection site of ChR2-Venus; magenta: Hoechst counterstain; Right, green DiL indicating optic fiber tract; magenta: counterstain. White lines delineate anatomical landmarks indicating the location of BLA (left) and GC (right) based on the rat brain atlas (Paxinos and Watson, 1998). Scale bar = 500 µm. (C) To control for non-specific effects of light stimulation, one group of rats was injected with an AAV9 construct containing only the fluorescent tag Venus (GFP control, N = 8 rats). Diagram of behavioral paradigm for CTA in which the LiCl injection was substituted with 20 Hz optogenetic stimulation of BLA terminal fields in GC following sucrose exposure. Fluid consumption across training days for GFP control group. Rats showed an initial preference for sucrose over water which persisted after conditioning (GFP control: C1 sucrose 11.60 ± 1.01 mL vs. C2 sucrose 12.27 ± 0.86 mL, p=0.23) and at testing (GFP control: test day sucrose 12.03 ± 0.73 mL vs. test day H2O 0.77 ± 0.12 mL, p<10−7). (D) Diagram of behavioral paradigm for CTA in which the LiCl injection was substituted with 20 Hz optogenetic stimulation of BLA terminal fields in GC following sucrose exposure for rats that were injected with ChR2 (paired 20 Hz opto, N = 8 rats). Fluid consumption across training days for paired opto group. Rats showed an initial preference for sucrose over water which shifted after conditioning (paired 20 Hz opto: C1 sucrose 11.10 ± 2.55 mL vs. C2 sucrose 12.36 ± 1.43 mL, p=0.41) at testing (paired 20 Hz opto: test day sucrose 7.91 ± 2.10 mL vs. test day H2O 5.35 ± 2.31 mL, p=0.24). (E) Diagram of behavioral paradigm for CTA in which rats received non-contingent 20 Hz optogenetic stimulation of BLA terminal fields in GC the evening prior to sucrose exposure (non-paired 20 Hz opto, [N = 5 rats]). Fluid consumption across training days for GFP control group. Rats showed an initial preference for sucrose over water which persisted after conditioning (non-paired 20 Hz opto: C1 sucrose 13.11 ± 4.22 mL vs. C2 sucrose 12.31 ± 1.62 mL, p=0.68) and at testing (non-paired 20 Hz opto: test day sucrose 11.98 ± 3.40 mL vs. test day H2O 2.86 ± 2.33 mL, p=0.07). (F) Diagram of behavioral paradigm for CTA in which the LiCl injection was substituted with optogenetic ramp stimulation of BLA terminal fields in GC following sucrose exposure for rats that were injected with ChR2 (ramp opto, [N = 6 rats]). Fluid consumption across training days for ramp opto group. Rats showed an initial preference for sucrose over water which persisted after conditioning (ramp opto: C1 sucrose 7.64 ± 1.66 mL vs. C2 sucrose 9.60 ± 2.24 mL, p=0.06) and at testing (ramp opto: test day sucrose 9.81 ± 1.89 mL vs. test day H2O 0.73 ± 0.43 mL, p<10−4). (G) Sucrose preference scores (C1 sucrose/average H2O) did not differ between groups (GFP Control 1.70 ± 0.28, paired 20 Hz opto 1.52 ± 0.32, non-paired 20 Hz opto 1.90 ± 0.74, ramp opto 1.30 ± 0.17, 1-way ANOVA p=0.25). Aversion index of the paired 20 Hz opto group differed from both the GFP control and ramp opto on test day (GFP Control 1.70 ± 0.28, paired 20 Hz opto 1.52 ± 0.32, non-paired 20 Hz opto 1.90 ± 0.74, ramp opto 1.30 ± 0.17, 1-way ANOVA p<10−3, GFP control vs. paired 20 Hz opto, p=0.001; paired 20 Hz opto vs. ramp opto, p=0.0017). * indicates p≤0.05. Error bars ± 95% CI. The source data reported in the figure are in the Figure 6—source data 1.
-
Figure 6—source data 1
This file contains source data and statistics presented in each panel of Figure 6, Figure 6—figure supplement 1.
Excel worksheet tabs are labeled to indicate the specific figure. Each data table is labeled to indicate the specific figure panel. The statistics worksheet indicates specific tests and values applied to each data set in the figure and supplements.
- https://cdn.elifesciences.org/articles/55175/elife-55175-fig6-data1-v1.xlsx
Figure 6—figure supplement 1
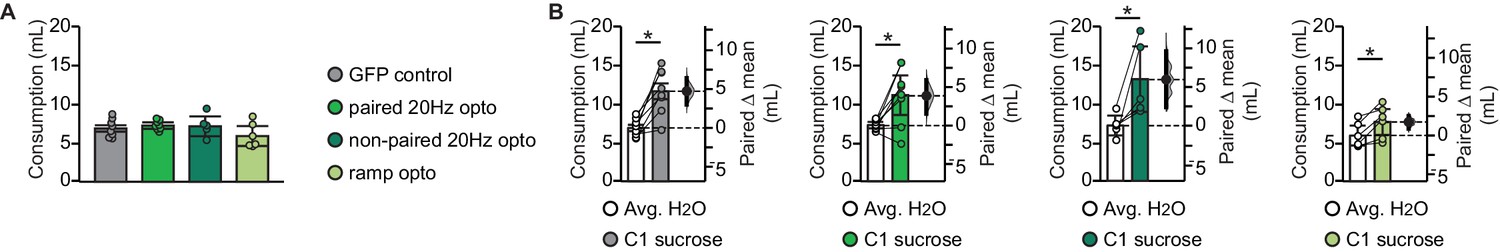
Baseline water consumption and initial sucrose palatability do not differ between groups.
(A) Average water consumption prior to conditioning did not differ between groups (GFP control: average H2O 6.87 ± 0.41 mL/day vs. paired 20 Hz opto: average H2O 7.23 ± 0.42 mL/day vs. non-paired 20 Hz opto: average H2O 7.14 ± 1.28 mL/day vs. ramp opto: average H2O 5.90 ± 1.28 mL/day, 1-way ANOVA p=0.21). (B) Rats in all four groups drank significantly more sucrose on the first conditioning day compared to baseline water intake (GFP control: average H2O 6.87 ± 0.41 mL/day vs. C1 sucrose 11.60 ± 1.01 mL, p<10−3; paired 20 Hz opto: average H2O 7.23 ± 0.42 mL/day vs. C1 sucrose 11.10 ± 2.55 mL, p=0.0128; non-paired 20 Hz opto: average H2O 7.14 ± 1.28 mL/day vs. C1 sucrose 13.11 ± 4.22 mL, p<10−5; ramp opto: average H2O 5.90 ± 1.28 mL/day vs. C1 sucrose 7.64 ± 1.66 mL, p<10−5). * indicates p≤0.05. Error bars ± 95% CI. The source data reported in the figure are in Figure 6—source data 1.
Additional files
Download links
A two-part list of links to download the article, or parts of the article, in various formats.
Downloads (link to download the article as PDF)
Open citations (links to open the citations from this article in various online reference manager services)
Cite this article (links to download the citations from this article in formats compatible with various reference manager tools)
LTD at amygdalocortical synapses as a novel mechanism for hedonic learning
eLife 9:e55175.
https://doi.org/10.7554/eLife.55175


