Social aversive generalization learning sharpens the tuning of visuocortical neurons to facial identity cues
- Department of Psychology (Biological Psychology, Clinical Psychology, and Psychotherapy), University of Würzburg, Germany
- Center for Mental Health, Medical Faculty, University of Würzburg, Germany
- Center for the Study of Emotion and Attention, University of Florida, United States
- Department of Psychology, Education, and Child Studies, Erasmus University Rotterdam, Netherlands
Figures
Figure 1
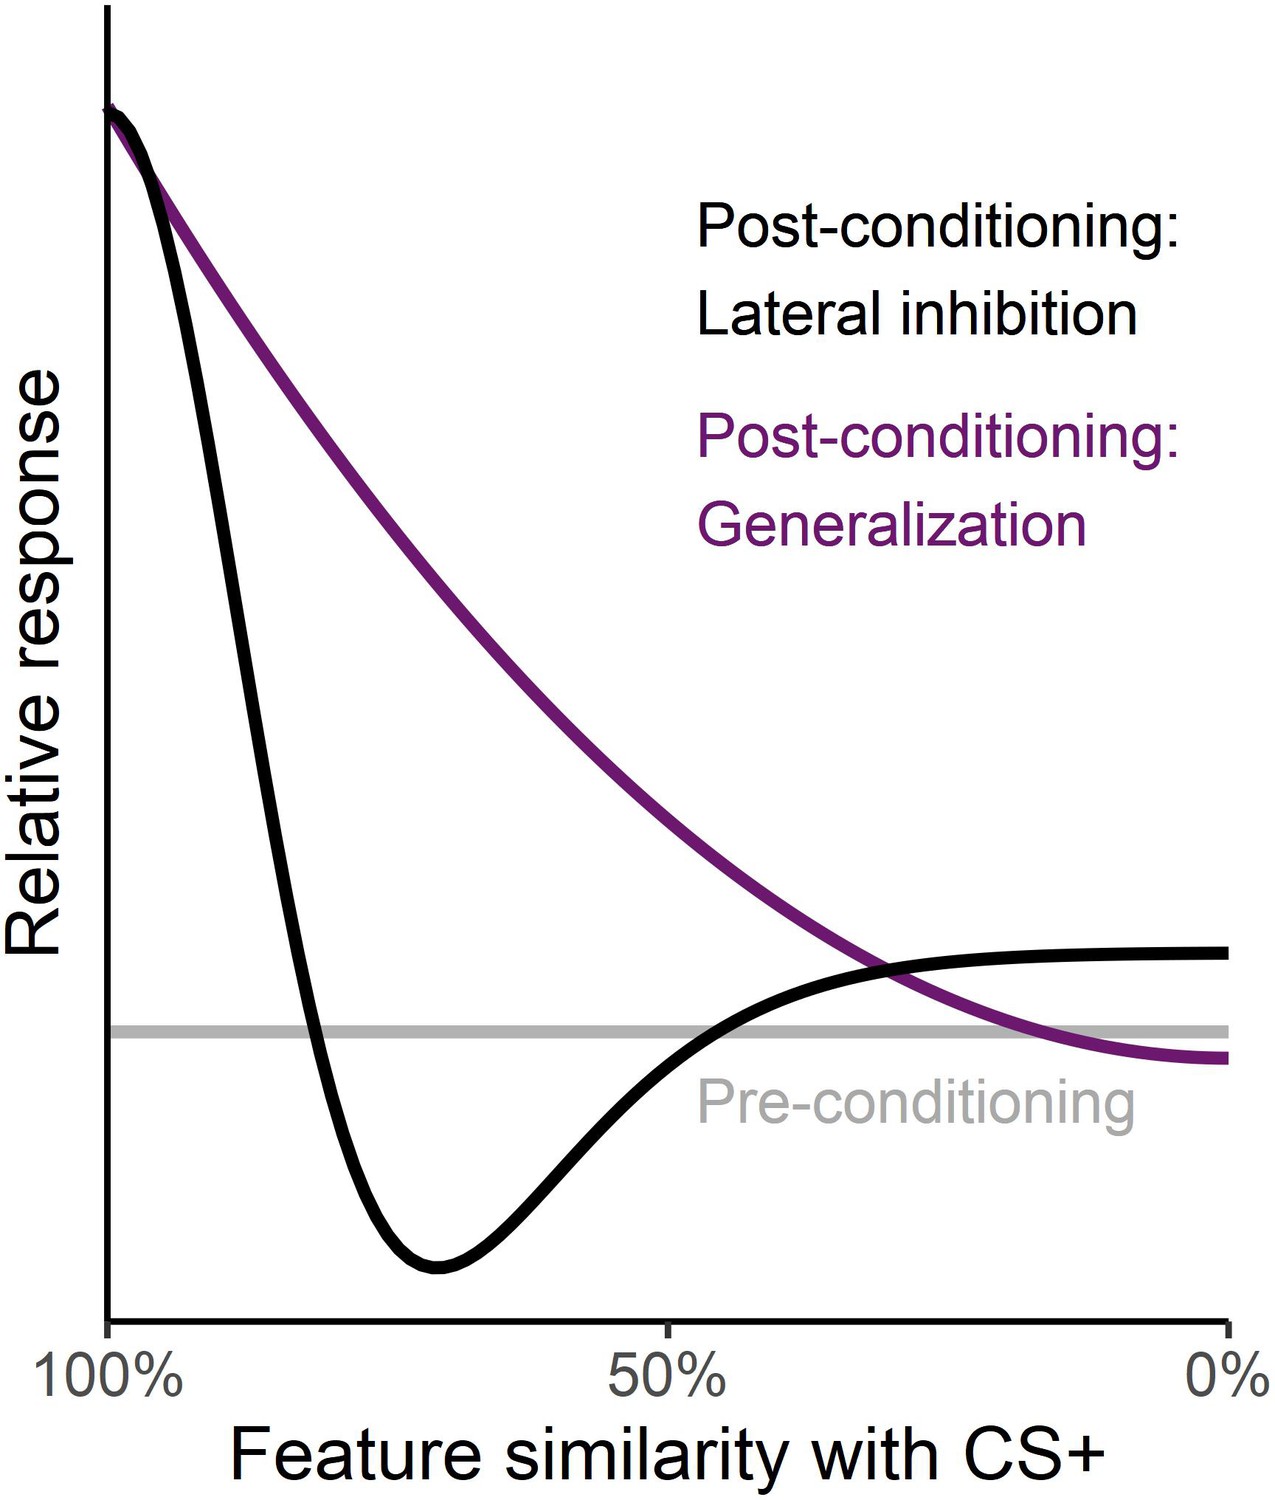
Different tuning functions during aversive learning.
The flat grey line depicts relative (behavioral or neural) responses along a physical feature gradient during pre-conditioning. The black curve shows a possible tuning function for lateral inhibition after aversive conditioning as seen in orientation-selective neuronal populations in the visual cortex (McTeague et al., 2015). Relative responses are enhanced for the specific feature associated with the aversive event and supressed for the most similar features. In contrast, the purple curve depicts a gradually decreasing generalization gradient observed in self-report and somato-visceral indices of generalization learning.
Figure 2
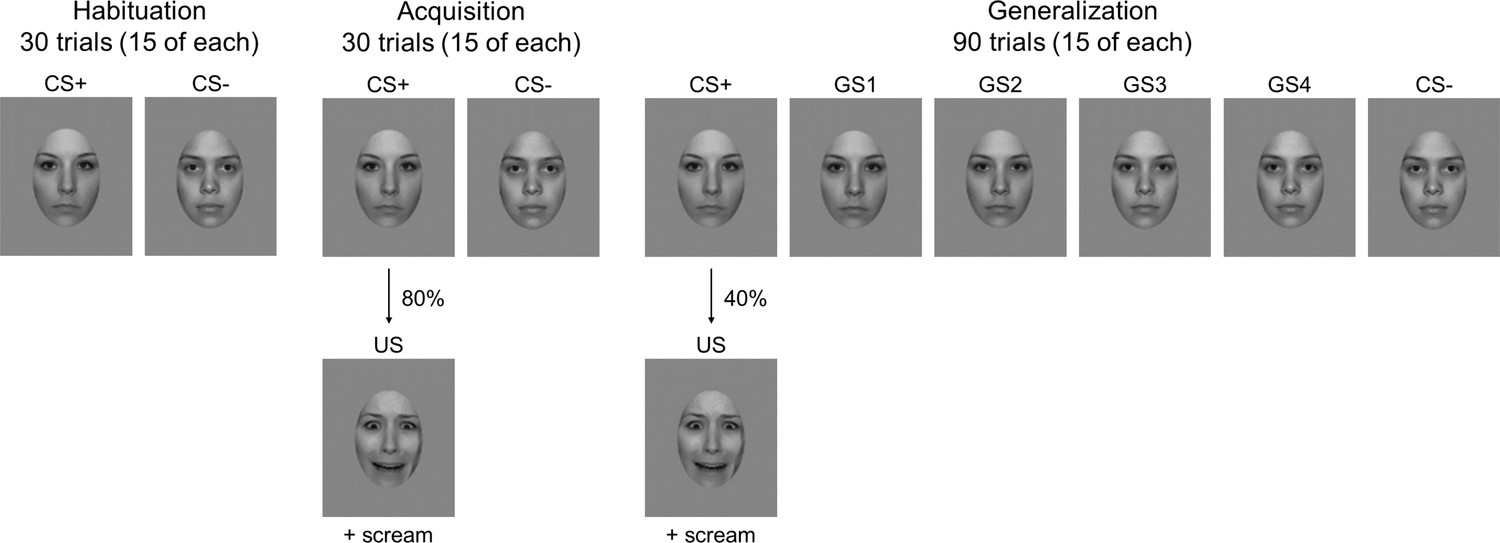
Experimental design.
Habituation, acquisition and generalization phase are illustrated. Stimuli were randomly presented for 3 s during each of the three parts of the experiment. The US consisted of a 1500 ms presentation of the respective CS+ face displaying a fearful expression, which was accompanied by a 95 dB shrill female scream. The assignment of face to CS+/CS- was counterbalanced between participants.
Figure 3
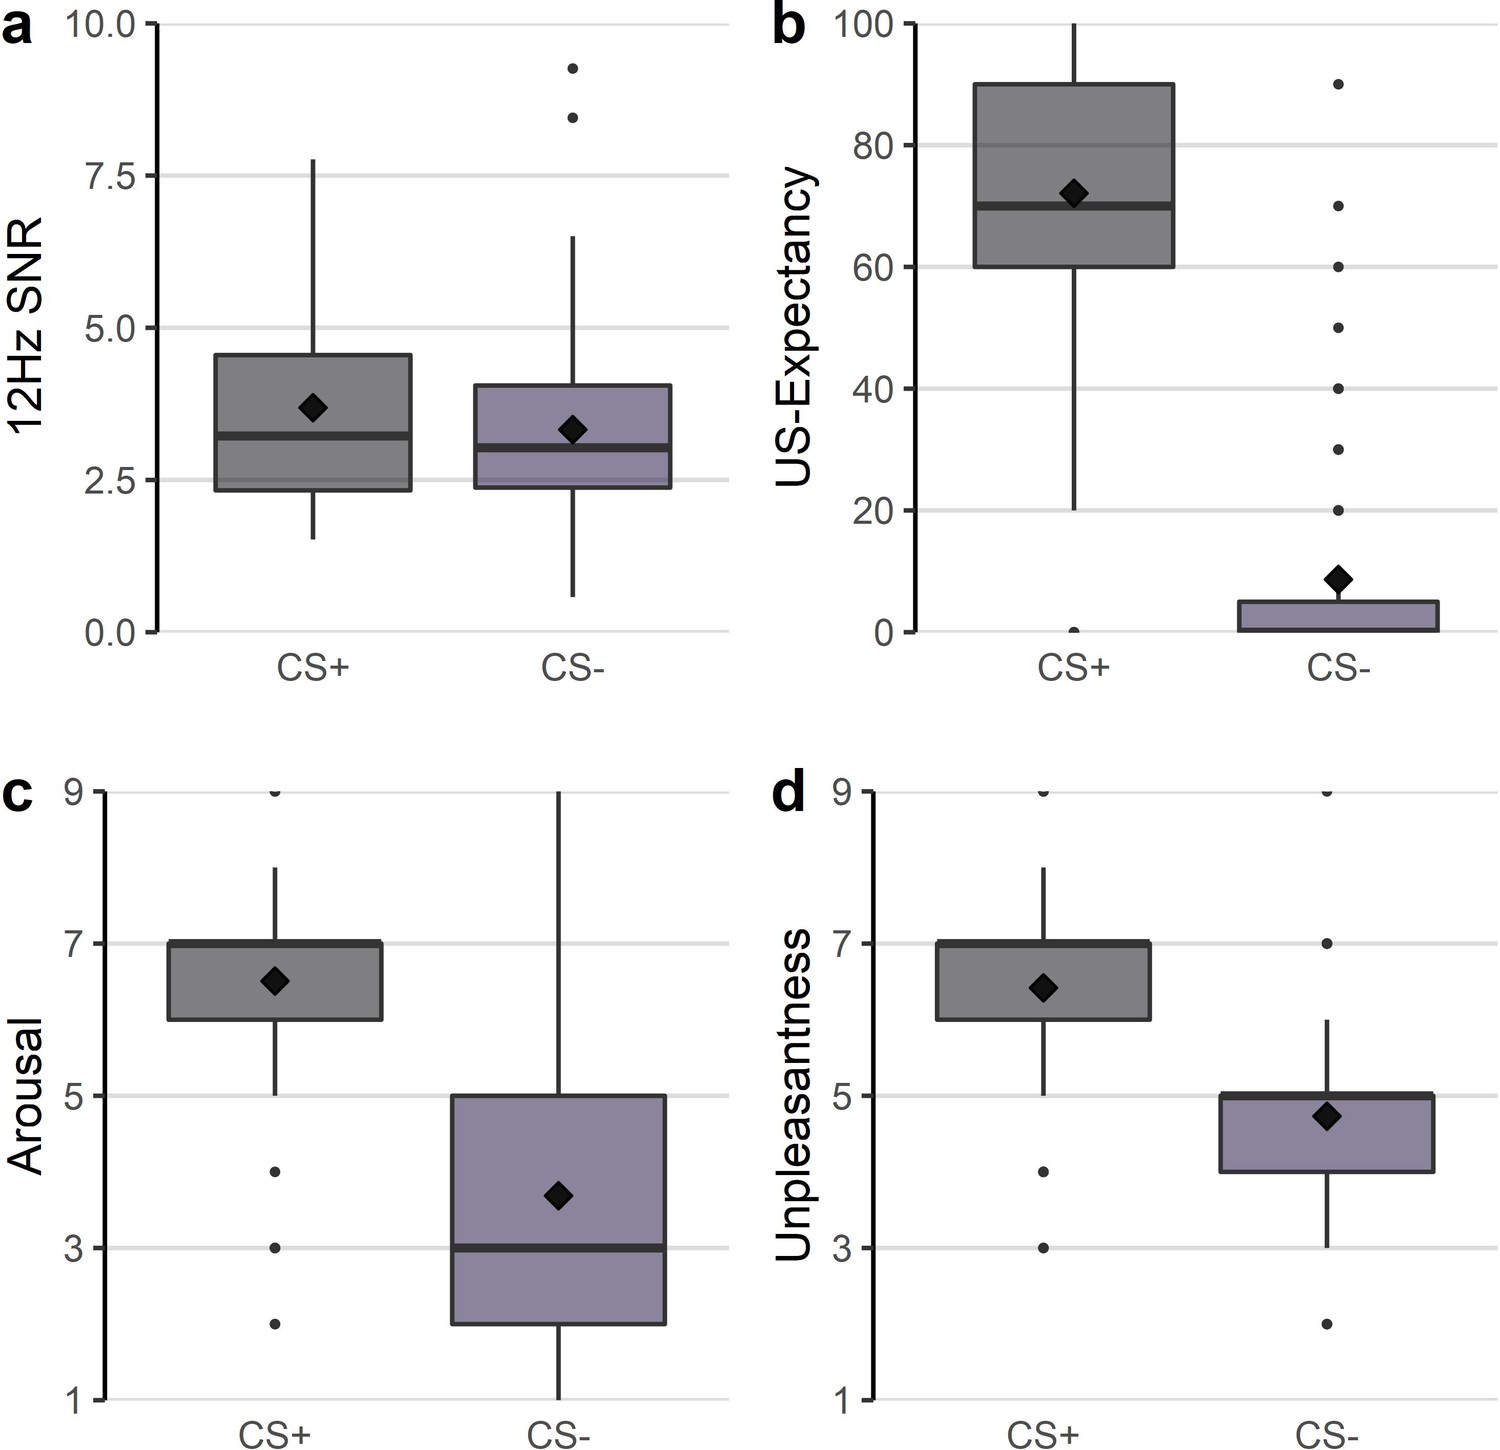
Boxplots and means (diamonds) of the (a) 12 Hz ssVEP signal-to-noise ratios (SNR) during the acquisition phase and mean US expectancy (b), arousal (c), and unpleasantness ratings (d) after acquisition.
Figure 4
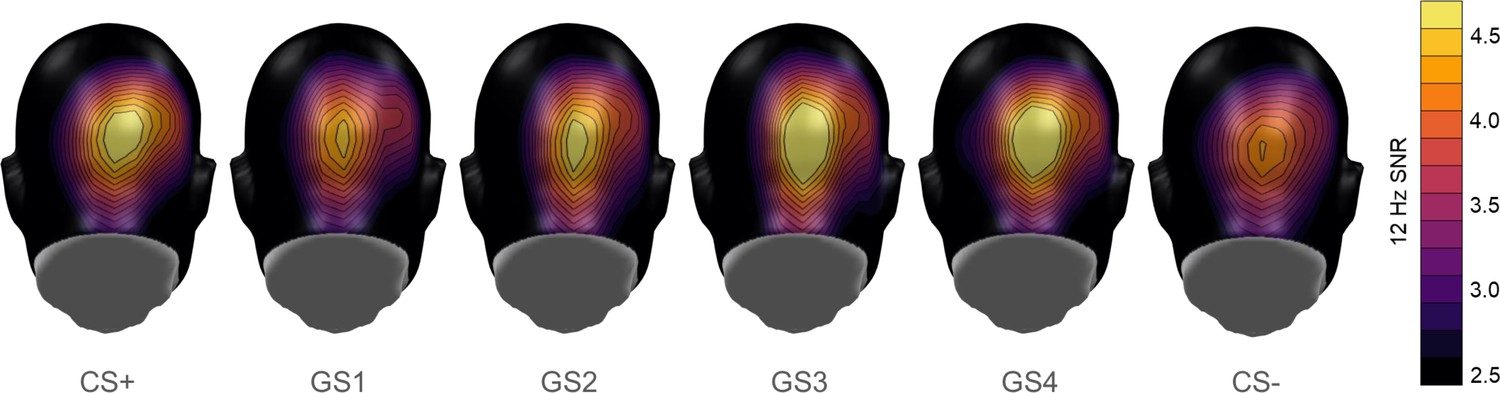
Mean scalp topographies of the 12 Hz ssVEP signal-to-noise ratios to the conditions during the generalization test.
Figure 5

Generalization test: (a) Mean 12 Hz signal-to-noise ratios (SNR) ±SEM of the ssVEP during the generalization test.
(b) Mean US-expectancy, (c) arousal and, (d) unpleasantness ratings ± SEM after generalization. Prediction intervals are shown for the mean ±1 SD of the SPAI covariate to illustrate the influence of social anxiety.
Figure 6
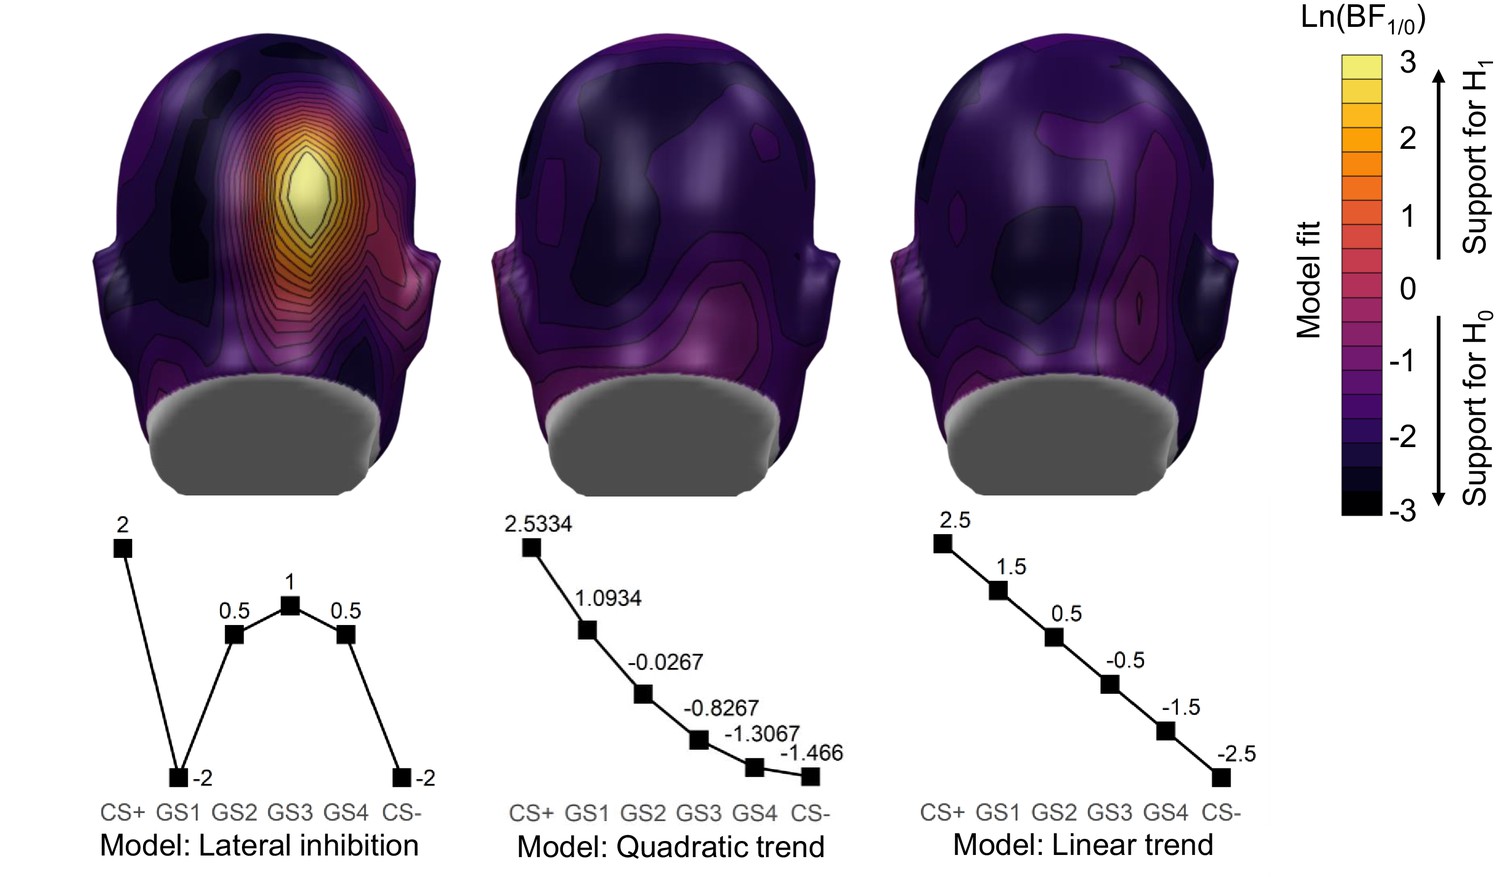
Bayesian model fit: Topographical distributions of the Bayes Factor for comparing the main effect model ‘SNR ~ CS-type’ to the null model for each contrast.
Weights used for the contrasts are displayed at the bottom row. Natural log-transformed BFs are illustrated, so that positive values display support for the full effect model while negative values display support for the null model.
Figure 7
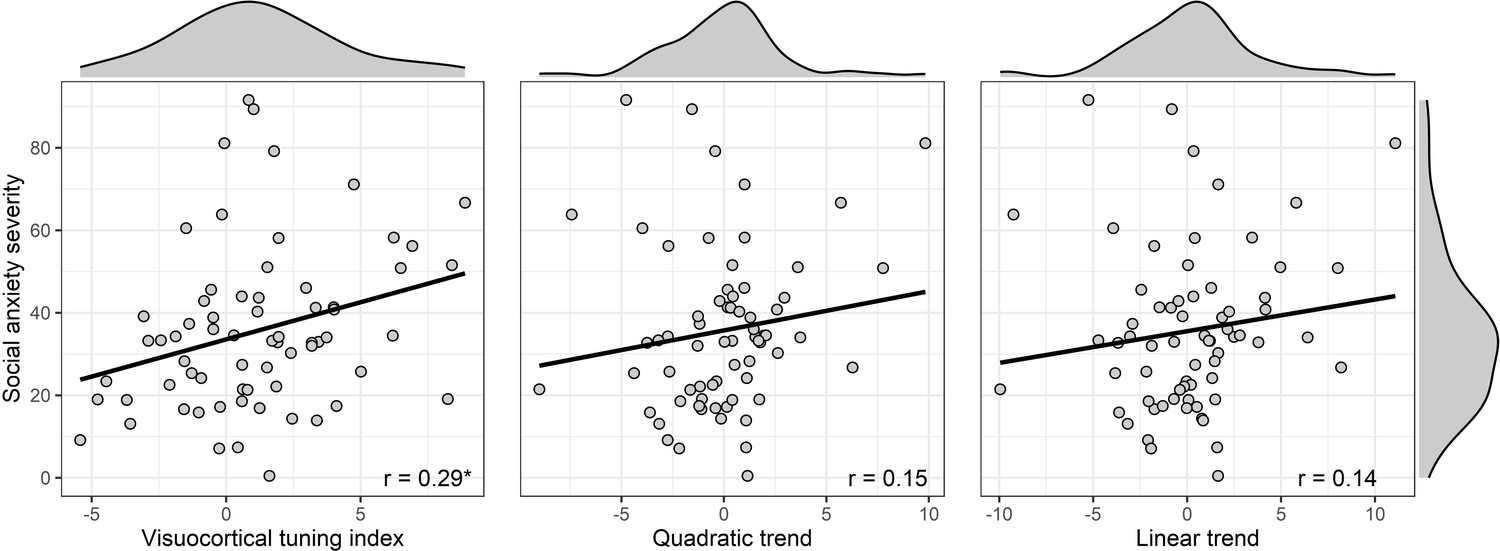
Comparison of the correlations between social anxiety and the different contrast models.
Only the visuocortical tuning index as a parameter for the accentuation of the lateral inhibition pattern significantly increased with social anxiety. Marginal density plots display the distributions of the social anxiety scores and the ssVEP indices.
Tables
Table 1
Results of the linear mixed model analyses during habituation.
| ssVEP-SNRs: | ||||
|---|---|---|---|---|
| CS-Type | F(1,65)=3.18 | p=0.079 | R²=0.047 | CI = [.000,. 187] |
| Social anxiety | t(65)=2.18 | p=0.033 | β = 0.48 | SE = 0.21 |
| CS-Type x Social anxiety | F(1,65)=0.69 | p=0.408 | R²=0.011 | CI = [.000,. 112] |
| Valence: | ||||
| CS-Type | F(1,65)=4.07 | p=0.048 | R²=0.059 | CI = [.001,. 207] |
| Social anxiety | t(65)=1.34 | p=0.186 | β = −0.15 | SE = 0.12 |
| CS-Type x Social anxiety | F(1,65)=1.16 | p=0.285 | R²=0.018 | CI = [.000,. 130] |
| Arousal: | ||||
| CS-Type | F(1,65)=0.34 | p=0.562 | R²=0.005 | CI = [.000,. 096] |
| Social anxiety | t(65)=1.24 | p=0.221 | β = 0.21 | SE = 0.17 |
| CS-Type x Social anxiety | F(1,65)=2.18 | p=0.145 | R²=0.032 | CI = [.000,. 162] |
Table 2
Results of the linear mixed model analyses during acquisition learning.
| ssVEP-SNRs: | ||||
|---|---|---|---|---|
| CS-Type | F(1,65)=5.50 | p=0.022 | R²=0.078 | CI = [.003,. 235] |
| Social anxiety | t(65)=2.00 | p=0.050 | β = 0.37 | SE = 0.19 |
| CS-Type x Social anxiety | F(1,65)=1.57 | p=0.168 | R²=0.013 | CI = [.000,. 118] |
| Valence: | ||||
| CS-Type | F(1,65)=49.51 | p<0.001 | R²=0.432 | CI = [.271,. 587] |
| Social anxiety | t(65)=0.80 | p=0.424 | β = 0.09 | SE = 0.12 |
| CS-Type x Social anxiety | F(1,65)=0.00 | p=0.982 | R²=0.000 | CI = [.000,. 075] |
| Arousal: | ||||
| CS-Type | F(1,65)=91.13 | p<0.001 | R²=0.584 | CI = [.447,. 705] |
| Social anxiety | t(65)=0.05 | p=0.959 | β = 0.01 | SE = 0.16 |
| CS-Type x Social anxiety | F(1,65)=1.29 | p=0.259 | R²=0.020 | CI = [.000,. 135] |
| US expectancy: | ||||
| CS-Type | F(1,65)=323.15 | p<0.001 | R²=0.833 | CI = [.771,. 884] |
| Social anxiety | t(65)=0.17 | p<0.867 | β = −0.30 | SE = 1.77 |
| CS-Type x Social anxiety | F(1,65)=0.15 | p=0.736 | R²=0.002 | CI = [.000,. 083] |
Table 3
Results of the linear mixed model analyses during generalization learning.
| ssVEP-SNRs: | ||||
|---|---|---|---|---|
| CS-Type | F(5,325)=3.39 | p=0.009 | R²=0.045 | CI = [.020,. 111] |
| Social anxiety | t(65)=1.94, | p=0.056 | β = 0.40 | SE = 0.21 |
| CS-Type x Social anxiety | F(5,325)=1.57 | p=0.167 | R²=0.024 | CI = [.009,. 080 |
| Valence: | ||||
| CS-Type | F(5,325)=35.83 | p<0.001 | R²=0.355 | CI = [.286,. 436] |
| Social anxiety | t(65)=0.17 | p<0.867 | β = 0.13 | SE = 0.12 |
| CS-Type x Social anxiety | F(5,325)=1.83 | p=0.107 | R²=0.027 | CI = [.011,. 086] |
| Arousal: | ||||
| CS-Type | F(5,325)=66.80 | p<0.001 | R²=0.507 | CI = [.443,. 574] |
| Social anxiety | t(65)=1.12, | p=0.267 | β = −0.12 | SE = 0.18 |
| CS-Type x Social anxiety | F(5,325)=0.71 | p=0.618 | R²=0.011 | CI = [.005,. 060] |
| US expectancy: | ||||
| CS-Type | F(5,325)=57.30 | p<0.001 | R²=0.469 | CI = [.402,. 540] |
| Social anxiety | t(65)=1.37 | p=0.174 | β = −2.79 | SE = 2.03 |
| CS-Type x Social anxiety | F(5,325)=0.97 | p=0.435 | R²=0.015 | CI = [.006,. 067] |
Table 4
Summary of the Bayesian linear model analysis.
| BFM/0 | Model | Lateral inhibition | Quadratic trend | Linear trend | Inhibition vs quadratic | Inhibition vs Linear | |
|---|---|---|---|---|---|---|---|
| M1: | SNR ~ CS-type | 13.26 | 0.14 | 0.13 | 104.17 | 97.62 | |
| M2: | SNR ~ CStype + SA | 18.33 | 0.15 | 0.17 | 105.49 | 125.16 | |
| M3: | SNR ~ CS type + SA + CS-type x SA | 57.32 | 0.11 | 0.38 | 858.52 | 502.184 |
-
Bayes factors of main and interaction effect models (M1 – M3) compared to the ‘random intercept only’ model (Null model) for the lateral inhibition pattern (weights: +2,–2, +0.5, +1, +0.5,–2 for CS+, GS1, GS2, GS3, GS4, CS-), quadratic trend (weights: +2.5334, +1.0934,–0.0267, −0.8267,–1.3067, −1.4667) and linear trend (weights: +2.5, +1.5, +0.5,–0.5, −1.5,–2.5). The last two columns display direct model comparisons between the lateral inhibition pattern to the quadratic or linear trend by dividing respective BFs for each main and interaction effect model. SA, social anxiety.
Additional files
Download links
A two-part list of links to download the article, or parts of the article, in various formats.
Downloads (link to download the article as PDF)
Open citations (links to open the citations from this article in various online reference manager services)
Cite this article (links to download the citations from this article in formats compatible with various reference manager tools)
Social aversive generalization learning sharpens the tuning of visuocortical neurons to facial identity cues
eLife 9:e55204.
https://doi.org/10.7554/eLife.55204


