Early life adversity decreases pre-adolescent fear expression by accelerating amygdala PV cell development
- Department of Neuroscience, Brown University, United States
- Department of Cognitive, Linguistic, and Psychological Sciences, Brown University, United States
Figures
Figure 1
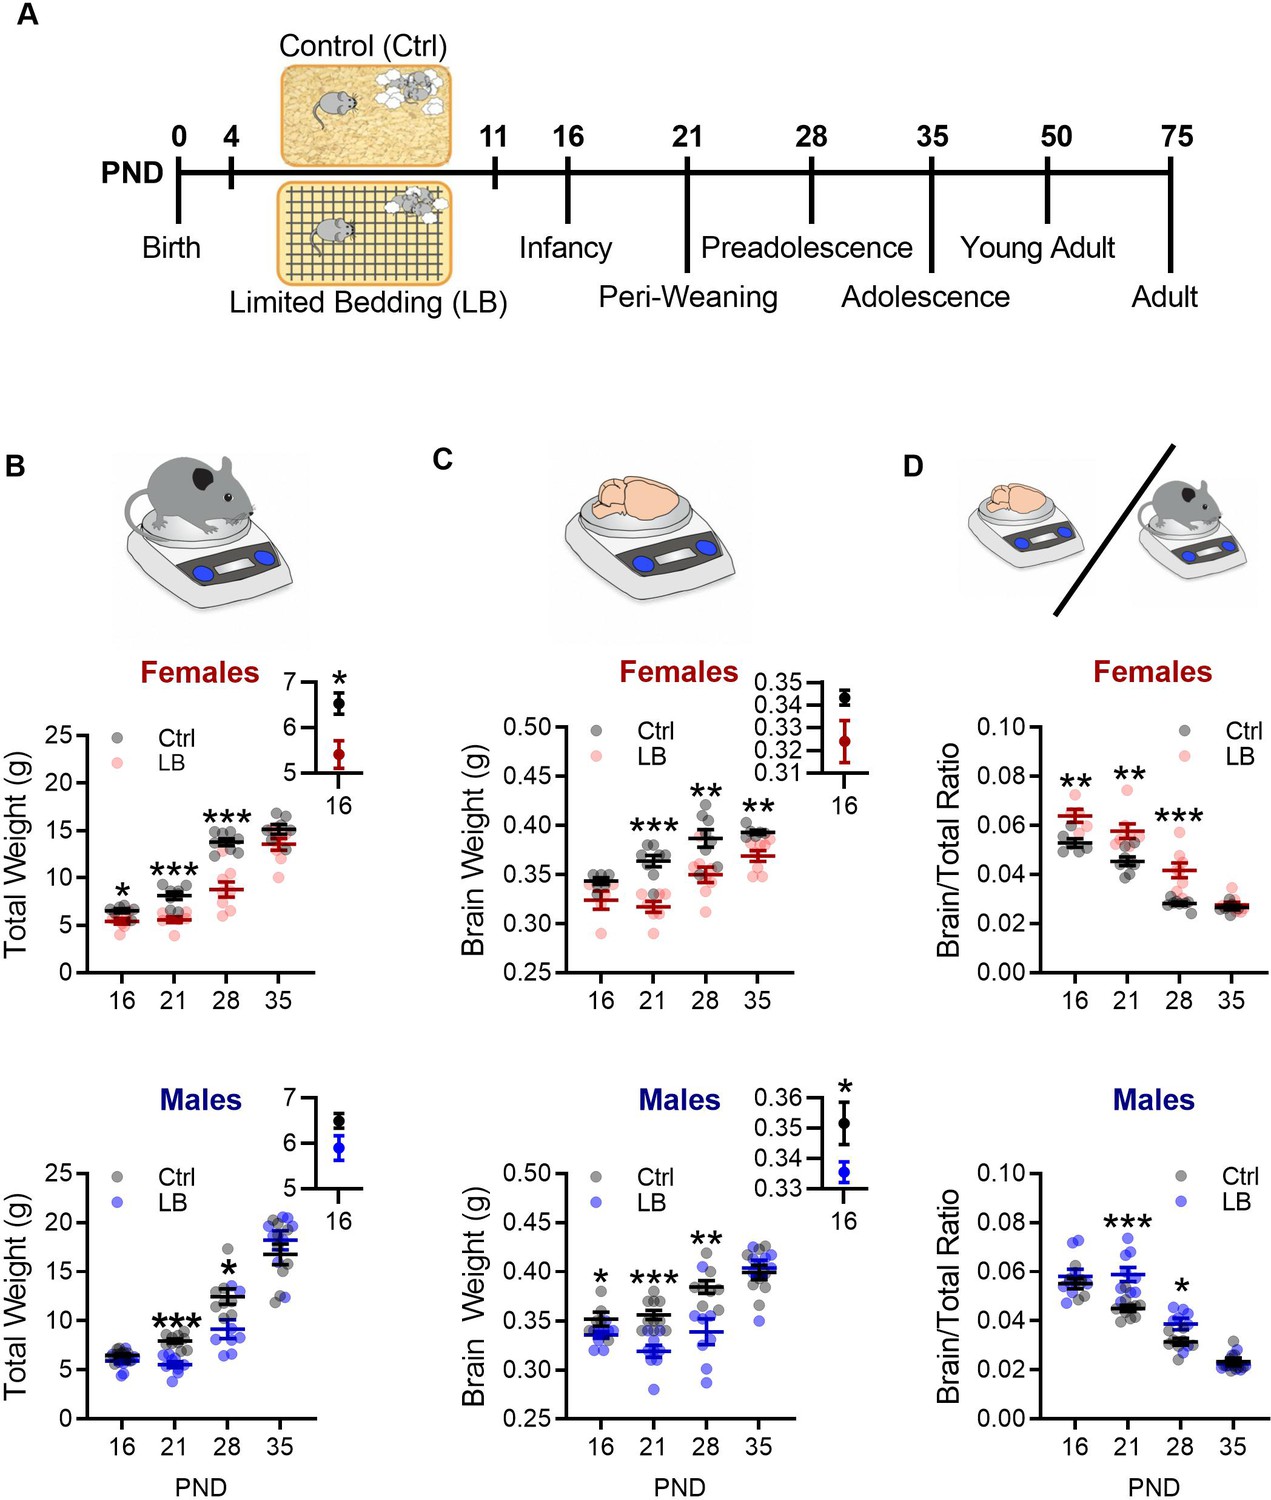
Limited bedding (LB) resources early in life, altered somatic and brain development.
(A) Timeline of resource restriction manipulation (PND 4–11) and description of developmental time points tested. Somatic effects of LB rearing on Males and Females. (B) Graphs depicting LB changes in total body weight for females (top) and males (bottom). Insets show a close up of mean and SEM for PND 16 data. When compared to ctrl females, LB females have decreased total weight at PND 16 (t11 = 2.84, p=0.015) 21 (t13 = 4.99, p<0.001) and 28 (t14 = 5.73, p<0.001), but not at PND 35 (t13 = 1.90, p=0.078). When compared to ctrl males, LB males have decreased total weight at PND 21 (t17 = 6.64, p<0.001) and 28 (t14 = 2.65, p=0.018), but not at 16 (t18 = 1.90, p=0.073) or 35 (t15 = 0.98, p=0.33). (Females: Ctrl n = 6, 8, 8, 7; LB n = 7, 7, 8, 8) (Males: Ctrl n = 10, 10, 8, 9; LB n = 10, 9, 8, 8). (C) Graphs depicting LB changes in total brain weight for females (top) and males (bottom). Insets show a close up of mean and SEM for PND 16 data. However, when we assessed brain weight, LB female mice did not differ from ctrl females at PND 16 (t9 = 2.11, p=0.063), with differences emerging at PND 21 (t13 = 5.62, p<0.001), 28 (t14 = 3.11, p=0.0075), and 35 (t12 = 3.55, p=0.0039). LB males had significantly different brain weight when compare to ctrl males at PND 16 (t13 = 2.29, p=0.038), 21 (t17 = 4.84, p<0.001) and 28 (t14 = 3.13, p=0.0073), but not at PND 35 (t14 = 0.40, p=0.69). (D) When we assessed brain to total weight ratio, female LB mice had a higher ratio at PND 16 (t9 = 3.59, p=0.0057), 21 (t13 = 3.69, p=0.0027), and 28 (t14 = 4.33, p<0.001), but not at PND 35 (t12 = 0.69, p=0.50) when compared to ctrl females. However, LB males did not significantly differ from ctrl males at PND 16 (t13 = 0.76, p=0.45), however, by PND 21 (t17 = 4.44, p<0.001) and 28 (t14 = 2.60, p=0.020) LB males had significantly higher brain/total weight ratio when compared to ctrl males, with effects dissipating by PND 35 (t14 = 0.51, p=0.61). For panels (C) and (D): (Females: Ctrl n = 6, 8, 8, 6; LB n = 5, 7, 8, 8) (Males: Ctrl n = 6, 10, 8, 8; LB n = 9, 9, 8, 8). Dots in panels represent individual data points. Bars represent group means + / - SEM. Unpaired two-tailed student t-tests were used for data analysis. *=p < 0.05, **=p < 0.01, ***=p < 0.001.
Figure 2 with 1 supplement
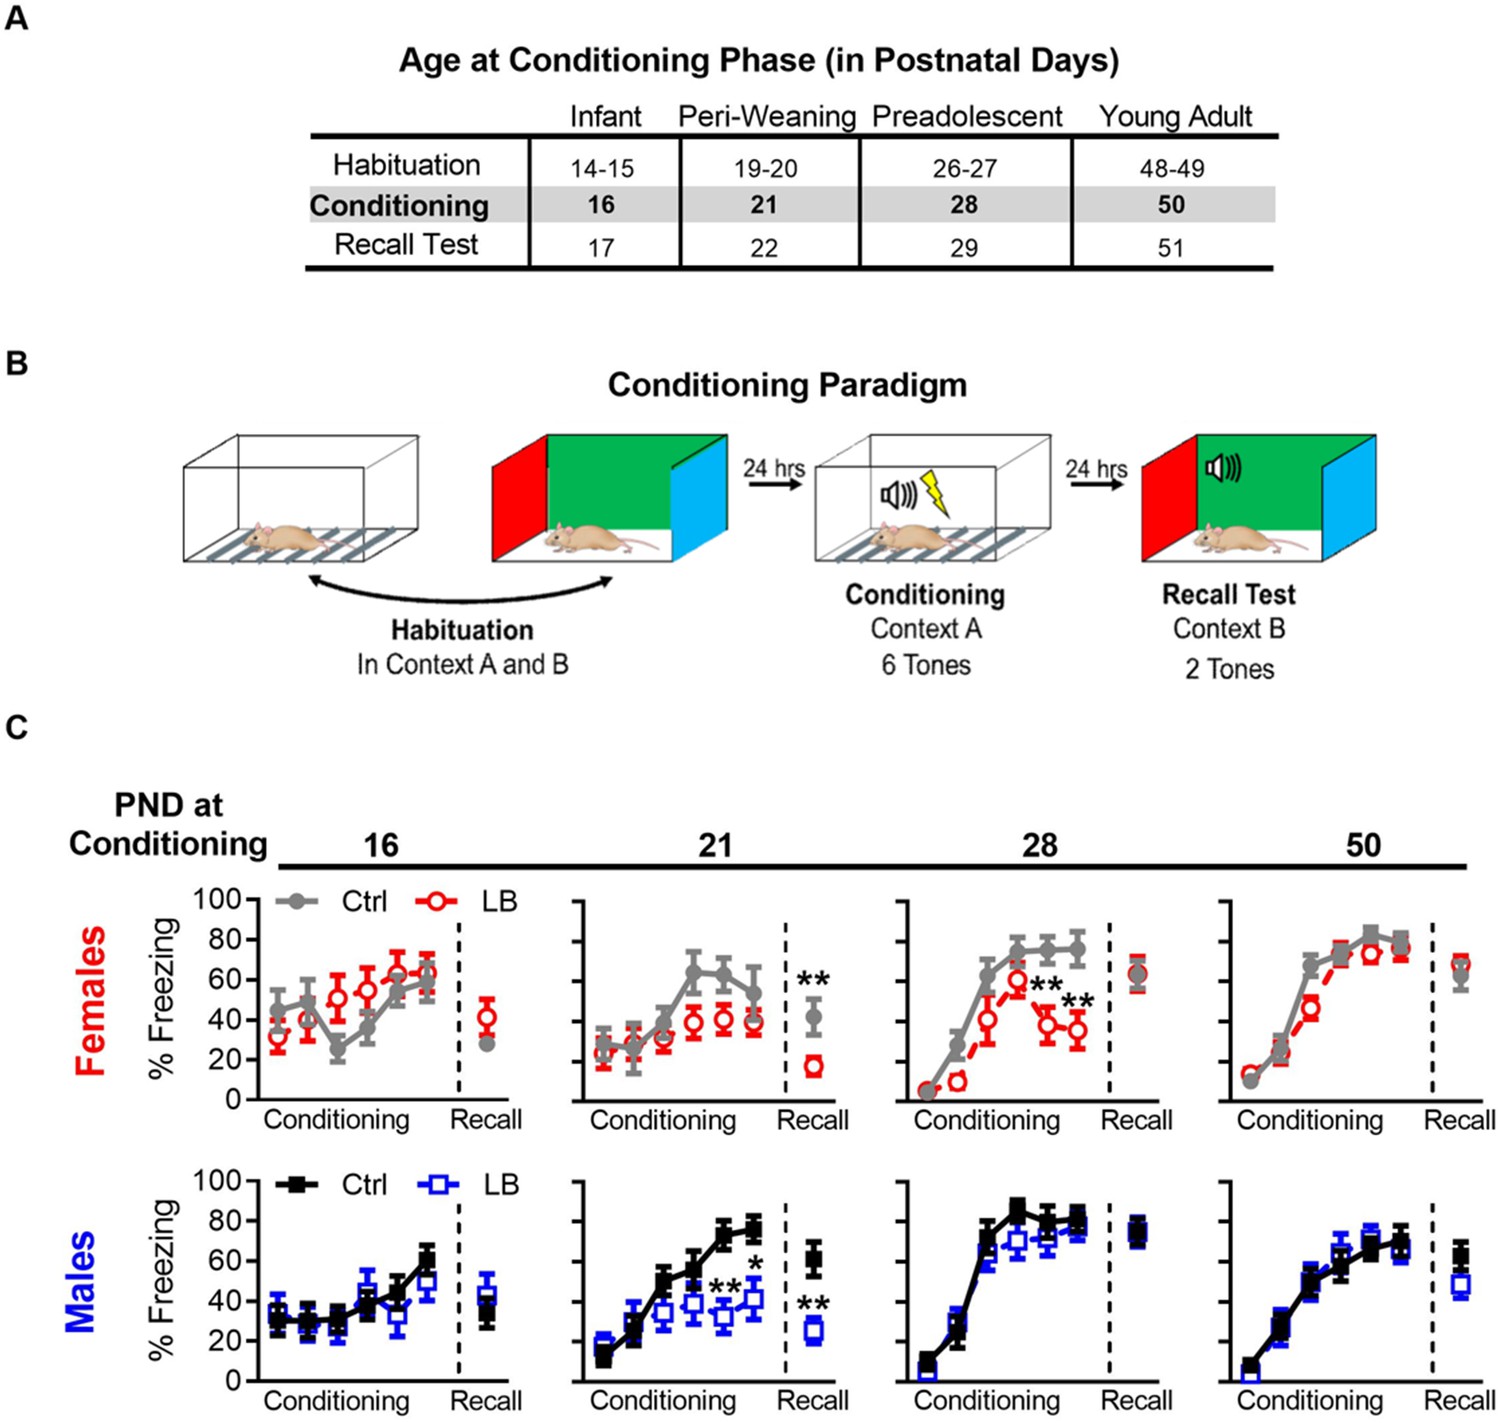
LB affects the short-term expression of fear during early development.
(A) Table of the postnatal day at which each cohort underwent different phases of auditory cue conditioning. Different cohorts were used for each age group. (B) Schematic of auditory fear conditioning protocol. (C) Graphs of the percent time female (top) and male (bottom) mice spent freezing (immobile) during the conditioning and recall test. LB female (t21 = 2.79, p=0.010) and male (t20 = 3.39, p=0.0028) mice exhibited decreased fear expression at PND 22 when compared to age and sex matched controls, an effect not observed at other ages (Females: PND 17 (t20 = 1.43, p=0.16), 29 (t19 = 0.032, p=0.97), 51 (t21 = 0.73, p=0.47)) (Males: PND 17 (t24 = 0.68, p=0.50), 29 (t21 = 0.014, p=0.98), 51 (t19 = 1.42, p=0.16)). During auditory cue conditioning in females, a main effect of rearing condition was observed at PND 28 (F(1,19) = 7.70, p=0.012), but not at 16 (F(1,20) = 0.52, p=0.47), 21 (F(1,21) = 3.32, p=0.082), or 50 (F(1,21) = 1.33, p=0.26). Post-hoc analysis revealed that PND 28 LB females had significantly lower levels of freezing on the 5th (t114 = 3.50, p=0.0039) and 6th (t114 = 3.80, p=0.0014) tones. A main effect of tone during conditioning was observed in females at all ages (PND 16: F(5,100) = 2.70, p=0.024; PND 21: F(5,105) = 4.11, p=0.0019; PND 28: F(5,95) = 39.3, p<0.0001; PND 50: F(5,105) = 104.1, p<0.0001), indicating that female mice learned the tone/foot shock association at all ages tested. No interaction between tone trial and rearing condition where observed at PND 16 (F(5,100) = 1.51, p=0.19) or 21 (F(5,105) = 0.83, p=0.52); however, significant interactions where observed at PND 28 (F(5,95) = 3.79, p=0.0035) and 50 (F(5,105) = 2.45, p=0.037). During auditory cue conditioning in males, no main effect of rearing condition was observed at any age tested (PND 16: F(1,24) = 0.15, p=0.69; PND 21: F(1,20) = 3.32, p=0.083; PND 28: F(1,21) = 0.78, p=0.38; PND 50: F(1,19) = 0.0017, p=0.96). However, a post-hoc analysis revealed that PND 21 LB males had significantly lower levels of freezing on the 5th (t120 = 3.25, p=0.0088) and 6th (t120 = 2.78, p=0.036) tones when compared to ctrl males. During conditioning in males a main effect of tone trial was observed at all ages (PND 16: F(5,120) = 3.33, p=0.0074; PND 21: F(5,100) = 12.14, p<0.0001; PND 28: F(5,105) = 54.63, p<0.0001; PND 50: F(5,95) = 62.84, p<0.0001), indicating that male mice learned the tone/foot shock association at all ages tested. No interaction between tone trial and rearing condition where observed in male conditioning at PND 16 (F(5,120) = 0.42, p=0.83), 28 (F(5,105) = 0.59, p=0.70), or 50 (F(5,95) = 0.49, p=0.77); however, a significant interaction was observed at PND 21 (F(5,100) = 4.05, p=0.0022). (Females: Ctrl n = 11, 8, 12, 11; LB n = 11, 15, 9, 12) (Males: Ctrl n = 16, 9, 12, 12; LB n = 10, 13, 11, 12). For effects on memory recall, following matching for conditioning curves see Figure 3—figure supplement 4. Additional tests for somatosensation were conducted to ensure that differences in freezing were not due to differences in foot-shock sensitivity, see Figure 2—figure supplement 2. Bars represent group means + / - SEM. Two-way repeated measure ANOVA followed by a Sidak’s multiple comparison analysis was used to analyze the conditioning curves. Unpaired two-tailed student t-tests were used to analyze differences in recall tests. *=p < 0.05, **=p < 0.01, ***=p < 0.001.
Figure 2—figure supplement 1
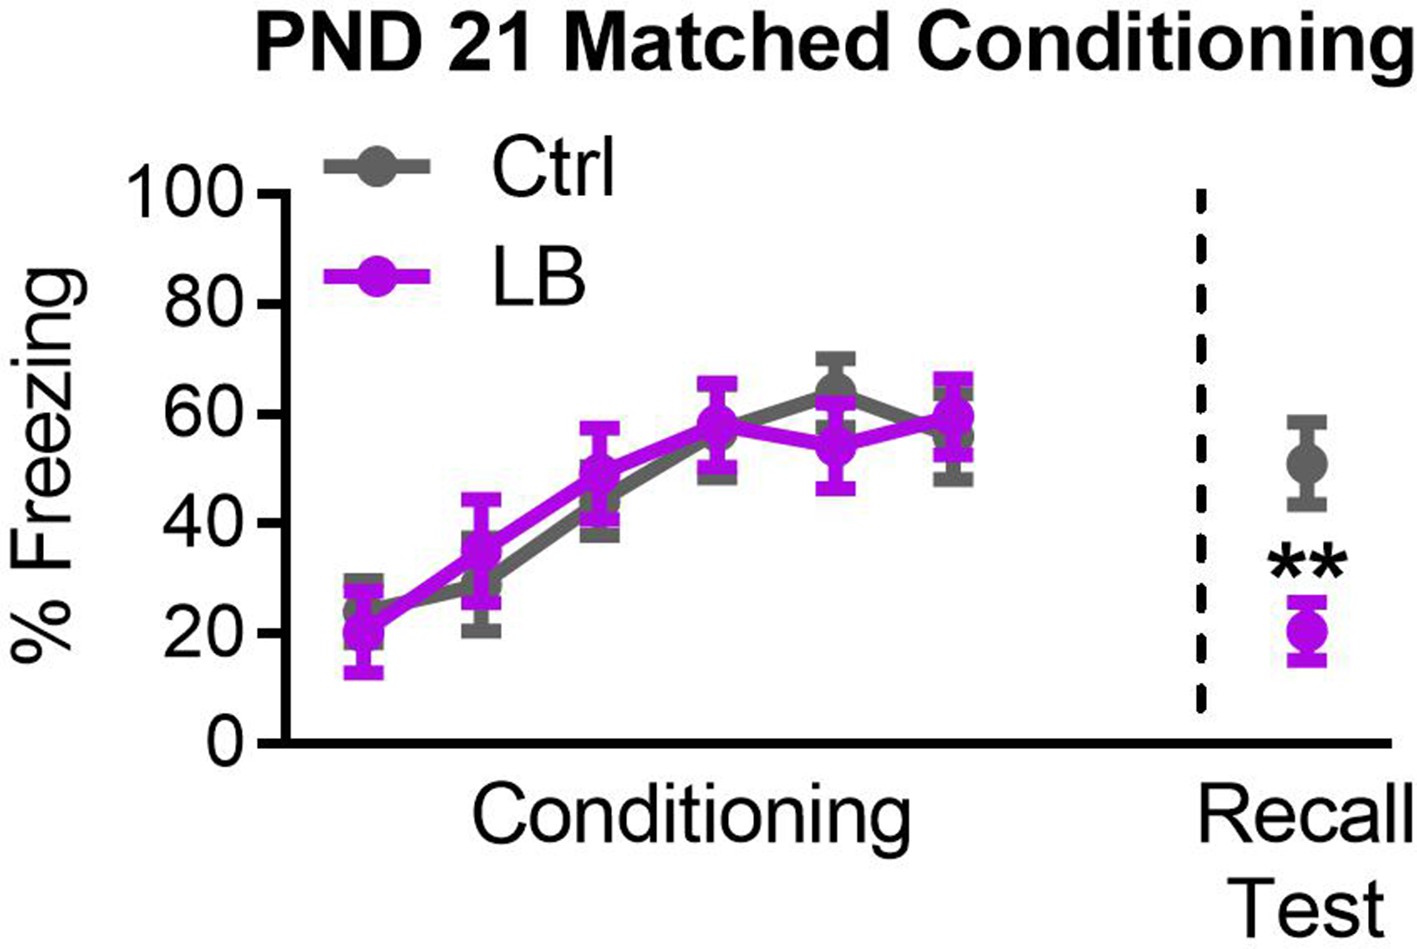
Effects on recall at PND 21 are not a consequence of conditioning deficits.
Graph of subgroup of mixed sex mice matched for levels of freezing during conditioning. A repeated measure ANOVA revealed a main effect of tone presentation (F(5,125) = 10.59, p<0.0001), but no significant main effects of rearing condition (F(1,25) = 0.0038, p=0.95), or effect of interaction between tone presentation and rearing condition (F(5,125) = 0.39, p=0.85). Matching for conditioning did not alter effects on recall (t25 = 3.36, p=0.0025), with deficits in freezing expression in LB reared PND21 mice. For Ctrl n = 13, for LB n = 14. A repeated measure two-way ANOVA was used to test for differences in fear conditioning. A two-tailed paired student t-test was used to test for differences in the recall test. *=p < 0.05, **=p < 0.01, ***=p < 0.001.
Figure 3 with 4 supplements
LB affects the short-term expression of fear during early development.
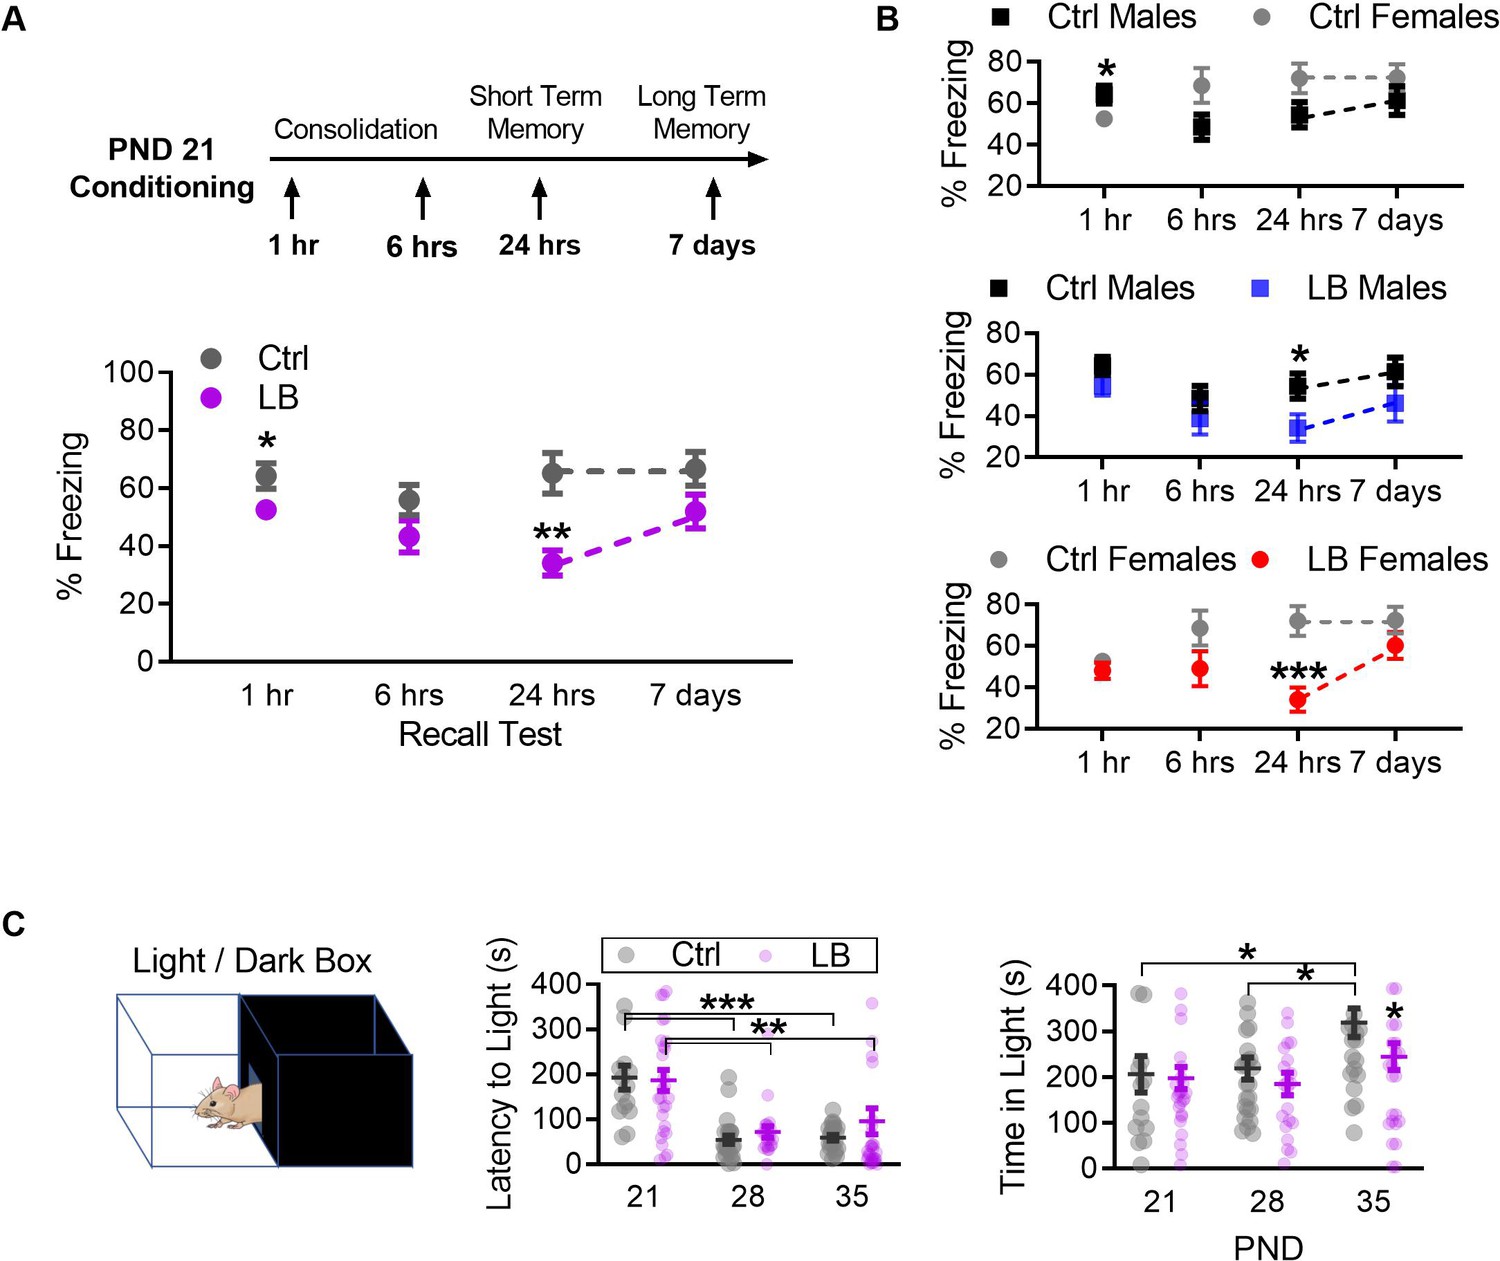
(A) Schematic of experimental protocol (top). A mix of male and female mice were conditioned at PND 21 and tested at only one time point: 1 hr, 6 hr, 7 hr, or 7 days post-conditioning. Graph depicting changes in freezing levels of distinct cohorts of mice during recall tests at varying delays (bottom). LB mice had decreased freezing at 1 hr (t74 = 2.11, p=0.037), 24 hr (t48 = 3.41, p=0.0012) but not 6 hr (t55 = 1.66, p=0.10) or 7 days (t46 = 1.76, p=0.085) post-conditioning. (Ctrl n = 34, 30, 29, 27; LB n = 42, 27, 21, 21). (B) Re-analysis of data presented in panel A to reveal sex differences within the data. When compared to Ctrl males, Ctrl females had decreased freezing at 1 hr (t32 = 2.11, p=0.042), but not at 6 hr (t28 = 1.95, p=0.060), 24 hr (t27 = 1.89, p=0.069) or 7 days (t25 = 1.17, p=0.25) post-conditioning. LB males (t25 = 2.21, p=0.036) and LB females (t21 = 3.94, p=0.0007) had decreased freezing 24 hr post-conditioning when compared to sex matched controls. No other significant differences were observed between Ctrl males and LB males (1 hr: t42 = 1.32, p=0.19; 6 hr: t32 = 0.99, p=0.32; 7 days: t23 = 1.37, p=0.18), or between Ctrl females and LB females (1 hr: t30 = 0.85, p=0.39; 6 hr: t21 = 1.64, p=0.11; 7 days: t21 = 1.31, p=0.20). (Ctrl males n = 15, 19, 16, 14; Ctrl females n = 19, 11, 13, 13; LB males n = 29, 15, 11, 11; LB females n = 13, 12, 10, 10). (C) Depiction of the light/dark box used to assess anxiety-like behavior (top). A mix of male and female mice were placed in the dark side of the box, the latency to light (center) and the total time spent in the light side of the box (bottom) are shown. Total time spent in the light/dark box was 420 s. Age (F(2,135) = 19.2, p<0.0001), but not rearing condition (F(1,135) = 0.50, p=0.47) or age x rearing interaction (F(2,135) = 0.72, p=0.48), significantly affected the latency to exit the dark side of the box (center). PND 21 mice of both LB and control reared conditions took more time to enter the light side of the box when compared to mice from the same rearing condition at PND 28 (LB t135 = 3.63, p=0.0012; Ctrl t135 = 4.05, p=0.0003) and PND 35 (LB t135 = 3.09, p=0.0073; Ctrl t135 = 3.89, p=0.0005). However, a main effect of rearing condition on the total time mice spent in the light side of the light/dark box (F(2,135) = 3.91, p=0.022) was observed (bottom). A post-hoc analysis revealed that significant differences in rearing condition were only observed at PND 35 (t135 = 2.60, p=0.030). Furthermore, a significant main effect of age on the time spent in the light side (F(1,135) = 4.01, p=0.047) was observed. Specifically, control PND 35 mice spent significantly more time in the light side when compared to control reared mice aged PND 21 (t135 = 2.46, p=0.043) and PND 28 (t135 = 2.56, p=0.033). No interaction between age and rearing condition was observed (F(2,135) = 1.23, p=0.29). (Ctrl n = 14, 24, 23; LB n = 27, 22, 31). For effects of rearing condition by sex see Figure 3—figure supplement 1. Bars represent group means + / - SEM. Dots in panel (C) represent individual data points. Unpaired two-tailed student t-tests were used in (A) and (B). For (C) a two-way ANOVA followed by a Sidak’s multiple comparison analysis was used. *=p < 0.05, **=p < 0.01, ***=p < 0.001.
Figure 3—figure supplement 1
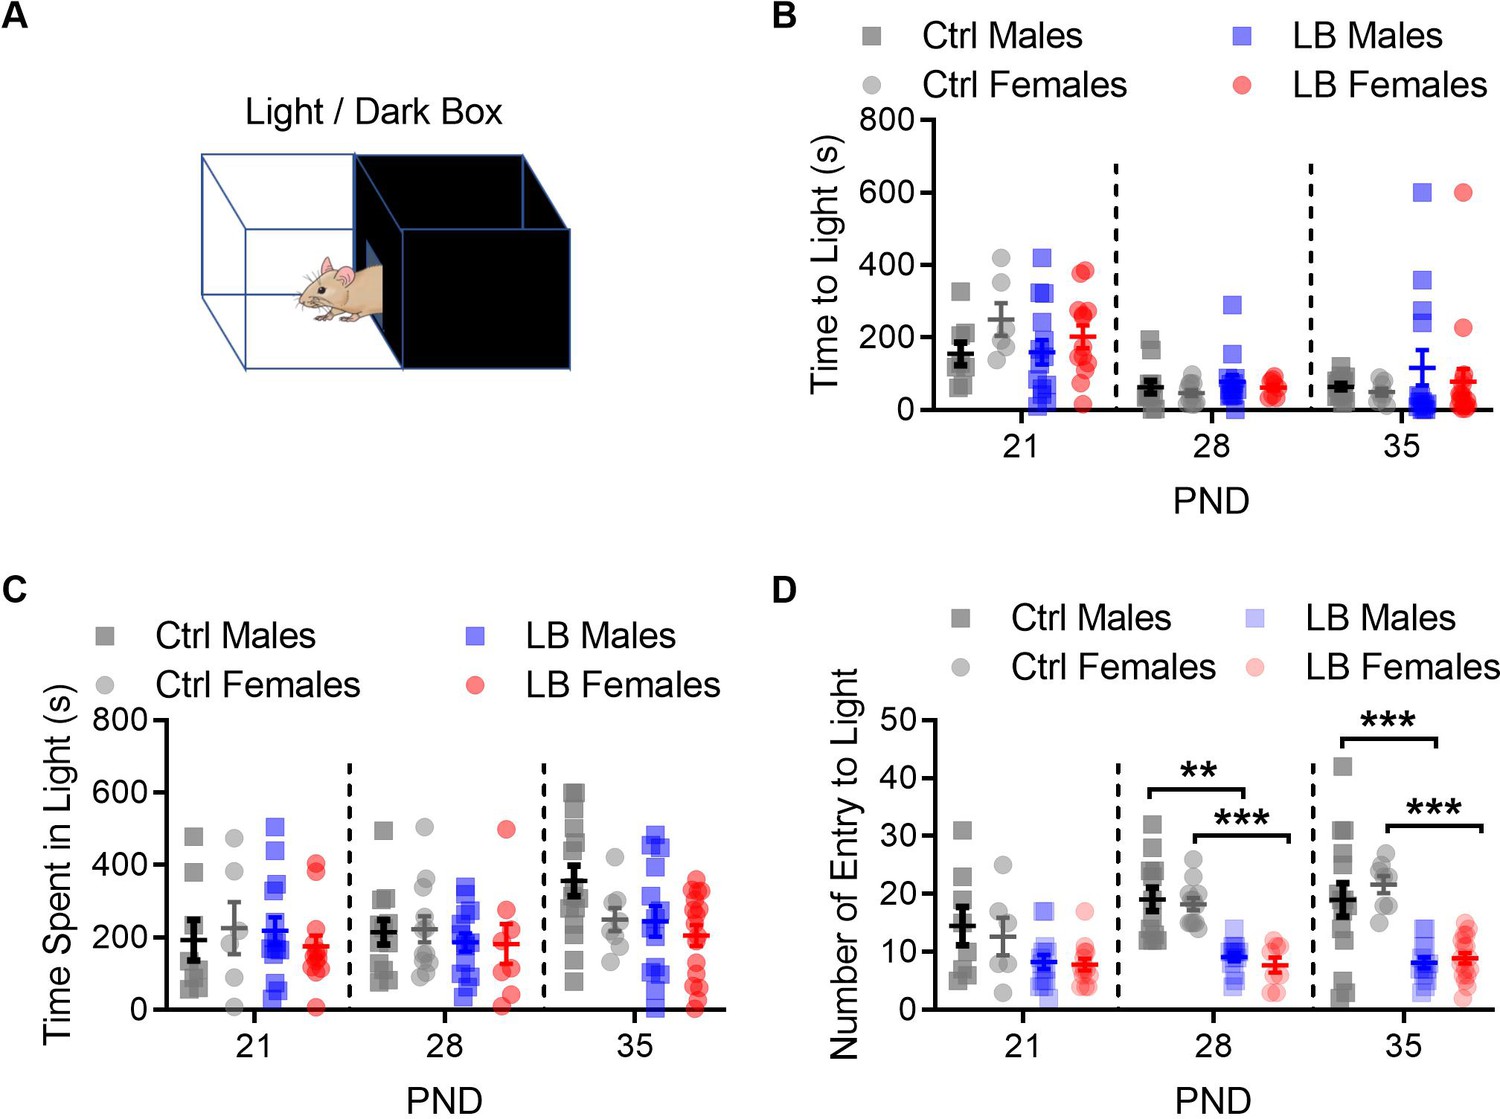
LB did not affect anxiety like behavior at PND 21.
(A) Drawing of the light/dark box behavioral apparatus. (B) Graph showing the time in seconds that it took mice to exit the dark side of the box and enter the light side. A three-way ANOVA revealed a main effect of age (F(2,129) = 18.22, p<0.0001) but not of sex (F(1,129) = 0.21, p=0.64) or rearing condition (F(1,129) = 0.39, p=0.53). No significant interactions between age, sex and rearing condition were revealed. A follow-up Sidak multiple comparison analysis revealed that, in general, mice took longer to exit the dark side of the box and enter the light side of the box at PND 21 when compared to PND 28 (t129 = 5.57, p<0.0001) or PND 35 (t129 = 5.05, p<0.0001). (C) Graph showing the total amount of time mice spent in the light side of the box. A three-way ANOVA for sex, rearing condition, and age revealed significant main effect of age (F(2,129) = 3.23, p=0.042) but not of rearing condition (F(1,129) = 3.08, p=0.081) or sex (F(1,129) = 1.12, p=0.29). No significant interactions were observed. (D) When using a three-way ANOVA to assess global effects of mouse entries into the light side of the light dark box, we found a main effect of age (F(2,129) = 4.13, p=0.018), rearing condition (F(1,129) = 78.08, p<0.0001), but not sex (F(1,129) = 0.029, p=0.86). For males, a follow-up two-way ANOVA between Ctrl and LB revealed a significant effect of rearing condition (F(1,71) = 31.31, p<0.0001), but not of age (F(2,71) = 0.96, p=0.38) or age by rearing condition (F(2,71) = 0.72, p=0.48). Follow-up analysis in males revealed significant differences between ctrl and LB mice at PND 28 (t71 = 3.66, p=0.0014) and 35 (t71 = 4.23, p=0.0002), but not at 21 (t71 = 2.03, p=0.13). For females, a two-way ANOVA between Ctrl and LB revealed a significant effect of rearing condition (F(1,58) = 67.27, p<0.0001), age (F(2,58) = 6.45, p=0.0029), and age by rearing condition (F(2,58) = 4.06, p=0.022). Follow-up analysis in females revealed significant differences between ctrl and LB mice at PND 28 (t58 = 5.37, p<0.0001) and 35 (t58 = 6.90, p<0.0001), but not at 21 (t58 = 2.28, p=0.076). Ctrl males n = 8, 12, 15; Ctrl females n = 6, 12, 8; LB males n = 14, 14, 14; LB females n = 13, 8, 17. Dots represent individual data points. For all graphs the mean and SEM are presented. A three-way ANOVA was used to test for main effects of sex, age, and rearing condition. A two-way ANOVA followed by Sidak’s multiple comparison analysis was used to test for difference in rearing condition across age within a given sex. *=p < 0.05, **=p < 0.01, ***=p < 0.001.
Figure 3—figure supplement 2
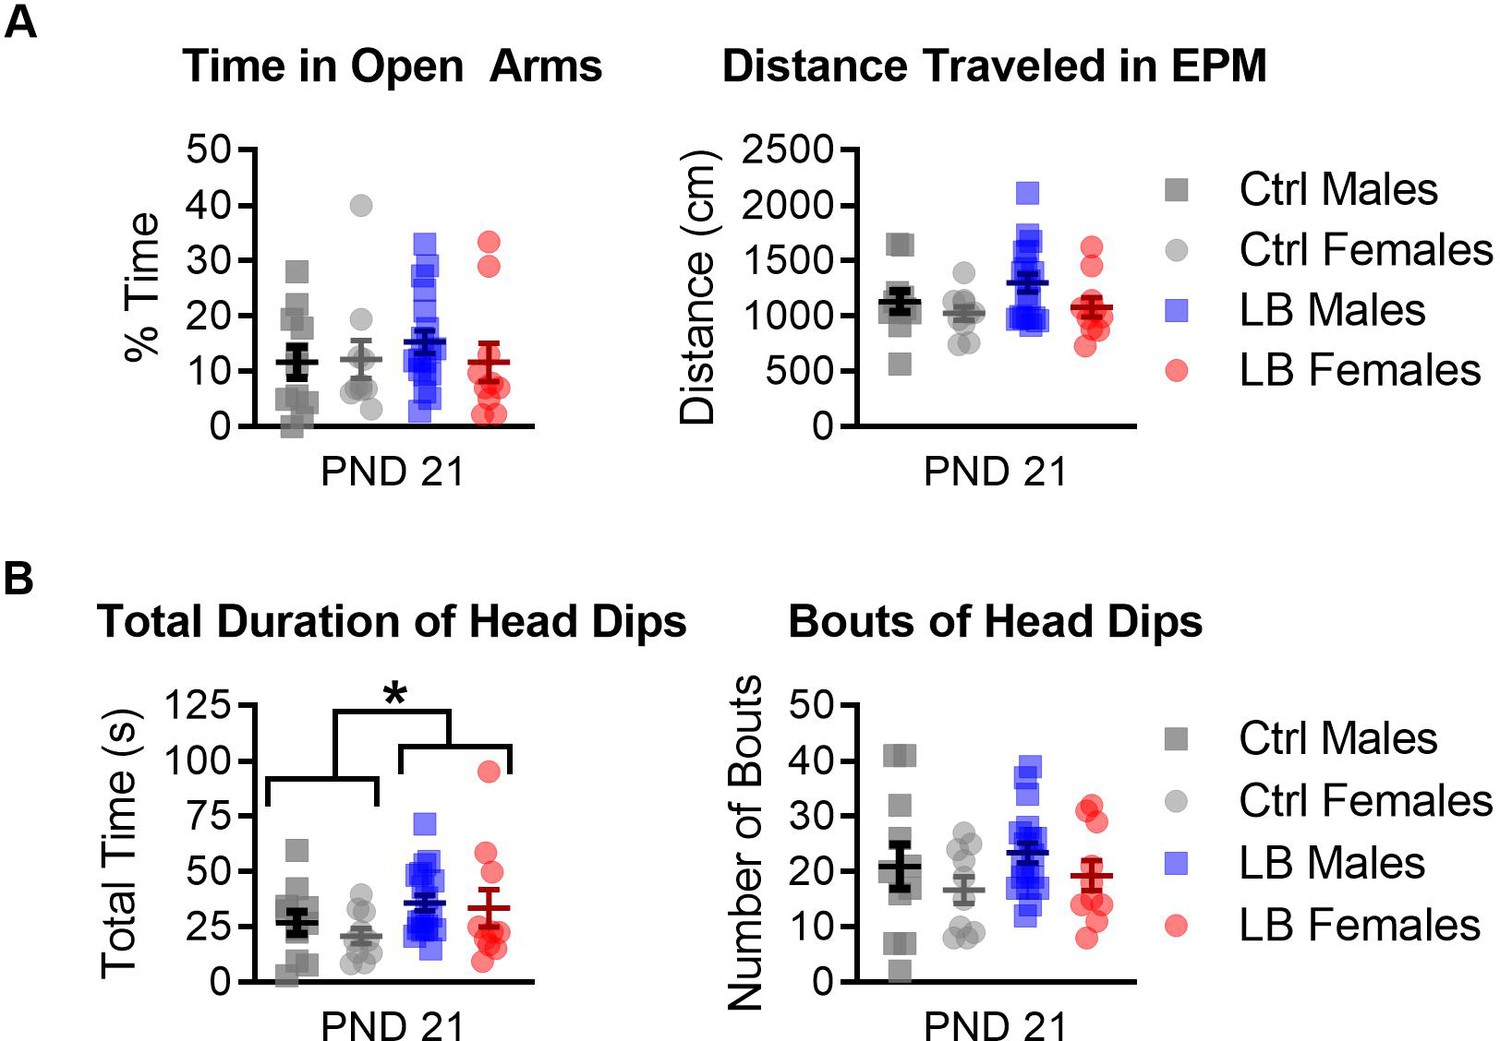
LB mice spent more time performing head dips in the elevated plus maze (EPM) at PND 21.
(A) Ctrl and LB mice spent a similar percentage of their time in the open arms of the EPM (F(1,45) = 0.30, p=0.58). No sex difference (F(1,45) = 0.31, p=0.57) or sex by rearing condition interactions (F(1,45) = 0.53, p=0.46) were observed for the percent time mice spent in the open arms. Further, no main effects were observed for the total distance traveled on the EPM (sex: F(1,45) = 3.52, p=0.067; rearing condition: F(1,45) = 1.64, p=0.20; sex x condition interaction: F(1,45) = 0.41, p=0.52). (B) When analyzing the time and number of times that the mouse looked over the edge of the open arms of the EPM (head dipping), we found that LB mice spent more time head dipping (F(1,45) = 4.30, p=0.043), but did not engage in more bouts (F(1,45) = 0.85, p=0.35). No main effect of sex or interaction was observed for the total amount of time mice spent head dipping (sex: F(1,45) = 0.63, p=0.42; sex x rearing condition: F(1,45) = 0.12, p=0.72), or for the total number of head dips (sex: F(1,45) = 2.28, p=0.13; sex by rearing condition: F(1,45) = 0.00047, p=0.98). Ctrl males n = 11; Ctrl females n = 10; LB males n = 18; LB females n = 10. Dots represent individual data points. For all graphs, the mean and SEM are presented. A two-way ANOVA was used to test differences between sexes and rearing conditions. *=p < 0.05, **=p < 0.01, ***=p < 0.001.
Figure 3—figure supplement 3
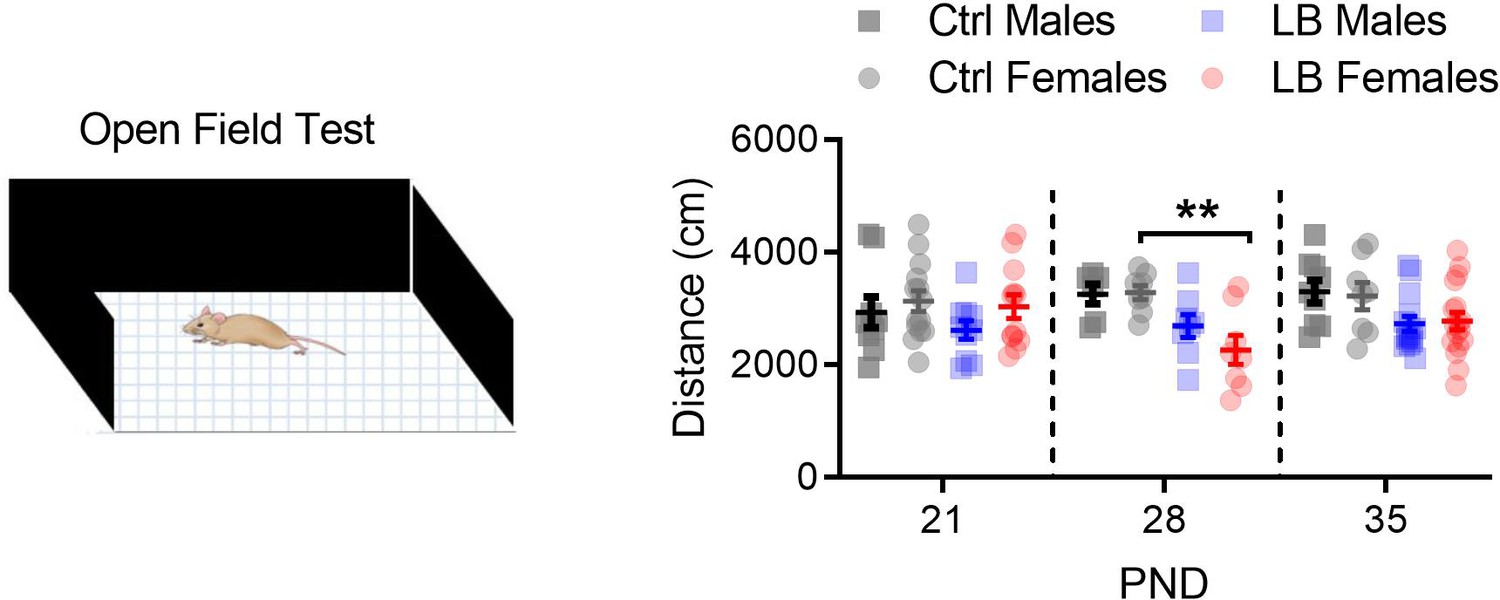
LB did not affect locomotion at PND 21.
We used a three-way ANOVA to assess global effects of rearing condition on locomotion in an open-field assay. We found a main effect rearing condition (F(1,111) = 18.08, p<0.0001), but not of age (F(2,111) = 0.42, p=0.65) or sex (F(1,111) = 0.063, p=0.80). For males, a follow-up two-way ANOVA between Ctrl and LB revealed a significant effect of rearing condition (F(1,50) = 8.97, p=0.0042), but not age (F(2,50) = 0.92, p=0.40) or age by rearing condition (F(2,50) = 0.29, p=0.74). Follow-up analysis in males revealed no significant simple effects between ctrl and LB mice at any of the ages tested (PND 21: t50 = 1.17, p=0.57; PND 28: t50 = 1.79, p=0.22; PND 35: t50 = 2.28, p=0.078). For females, a two-way ANOVA between Ctrl and LB revealed a significant effect of rearing condition (F(1,61) = 9.48, p=0.0031), but not age (F(2,61) = 1.08, p=0.34) or age by rearing condition (F(2,61) = 2.41, p=0.097). Follow-up analysis in females revealed significant differences between ctrl and LB mice at PND 28 (t61 = 3.09, p=0.0090), but not at 21 (t61 = 0.37, p=0.97) or 35 (t61 = 1.56, p=0.32). Ctrl males n = 9, 6, 9; Ctrl females n = 14, 8, 8; LB males n = 10, 8, 14; LB females n = 12, 8, 17. Dots represent individual data points. For all graphs, the mean and SEM are presented. A three-way ANOVA was used to test for main effects of sex, age, and rearing condition. A two-way ANOVA followed by Sidak’s multiple comparison analysis was used to test for difference in rearing condition across age within a given sex. *=p < 0.05, **=p < 0.01, ***=p < 0.001.
Figure 3—figure supplement 4
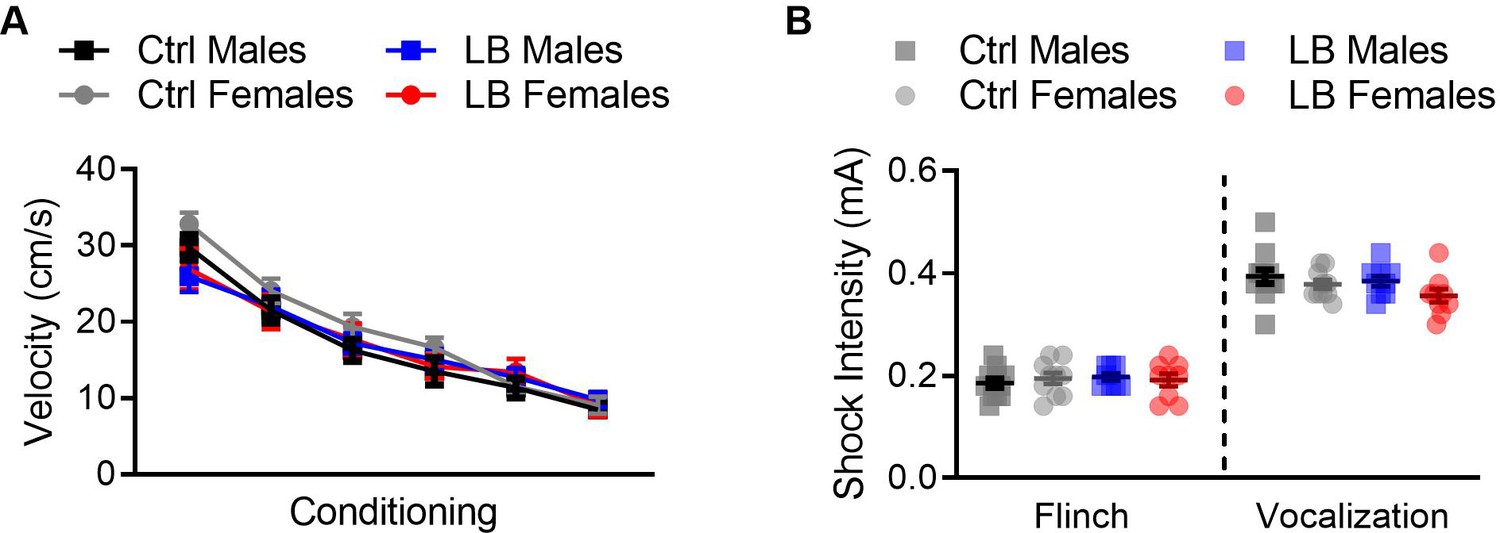
LB did not affect somatosensation at PND 21.
(A) To assess if LB affected the response of mice to the conditioning foot-shocks at PND 21, we plotted the mean velocity of mice during the one second foot-shock. A three-way repeated measures ANOVA did not reveal effects of rearing condition (F(1,142) = 0.70, p=0.40), sex (F(1,142) = 1.32, p=0.25), tone trial x sex (F(5,710) = 0.30, p=0.91), rearing condition x sex (F(1,142) = 1.41, p=0.23), tone x rearing condition x sex (F(5,710) = 0.29, p=0.91). However, we did find that a significant effect of tone trial (F(4.436,629.9) = 95.78, p<0.0001), showing that the velocity of the mice decreased as tone trials progressed, and a significant effect of tone by rearing condition (F(5,710) = 2.28, p=0.044). (Ctrl males n = 39, LB males n = 38, Ctrl females n = 39, LB females n = 30). (B) At PND 21, no main effects were observed for the minimum foot-shock intensity required for mice to flinch (sex: F(1,35) = 0.017, p=0.89; rearing condition: F(1,35) = 0.23, p=0.62; interaction: F(1,35) = 0.60, p=0.44) or audibly vocalize (sex: F(1,36) = 3.42, p=0.072; rearing condition: F(1,36) = 1.72, p=0.19; interaction: F(1,36) = 0.32, p=0.57). For flinch: Ctrl males = 12, females = 10; LB males = 8, females = 9. For audible vocalization: Ctrl males = 12, females = 10; LB males = 9, females = 9. For all graphs the mean and SEM are presented. A three-way repeated measure ANOVA was used to assess differences in shock reactivity during conditioning. A two-way ANOVA followed by Sidak’s multiple comparison analysis was used to assess differences in flinching and vocalization. *=p < 0.05, **=p < 0.01, ***=p < 0.001.
Figure 4 with 1 supplement
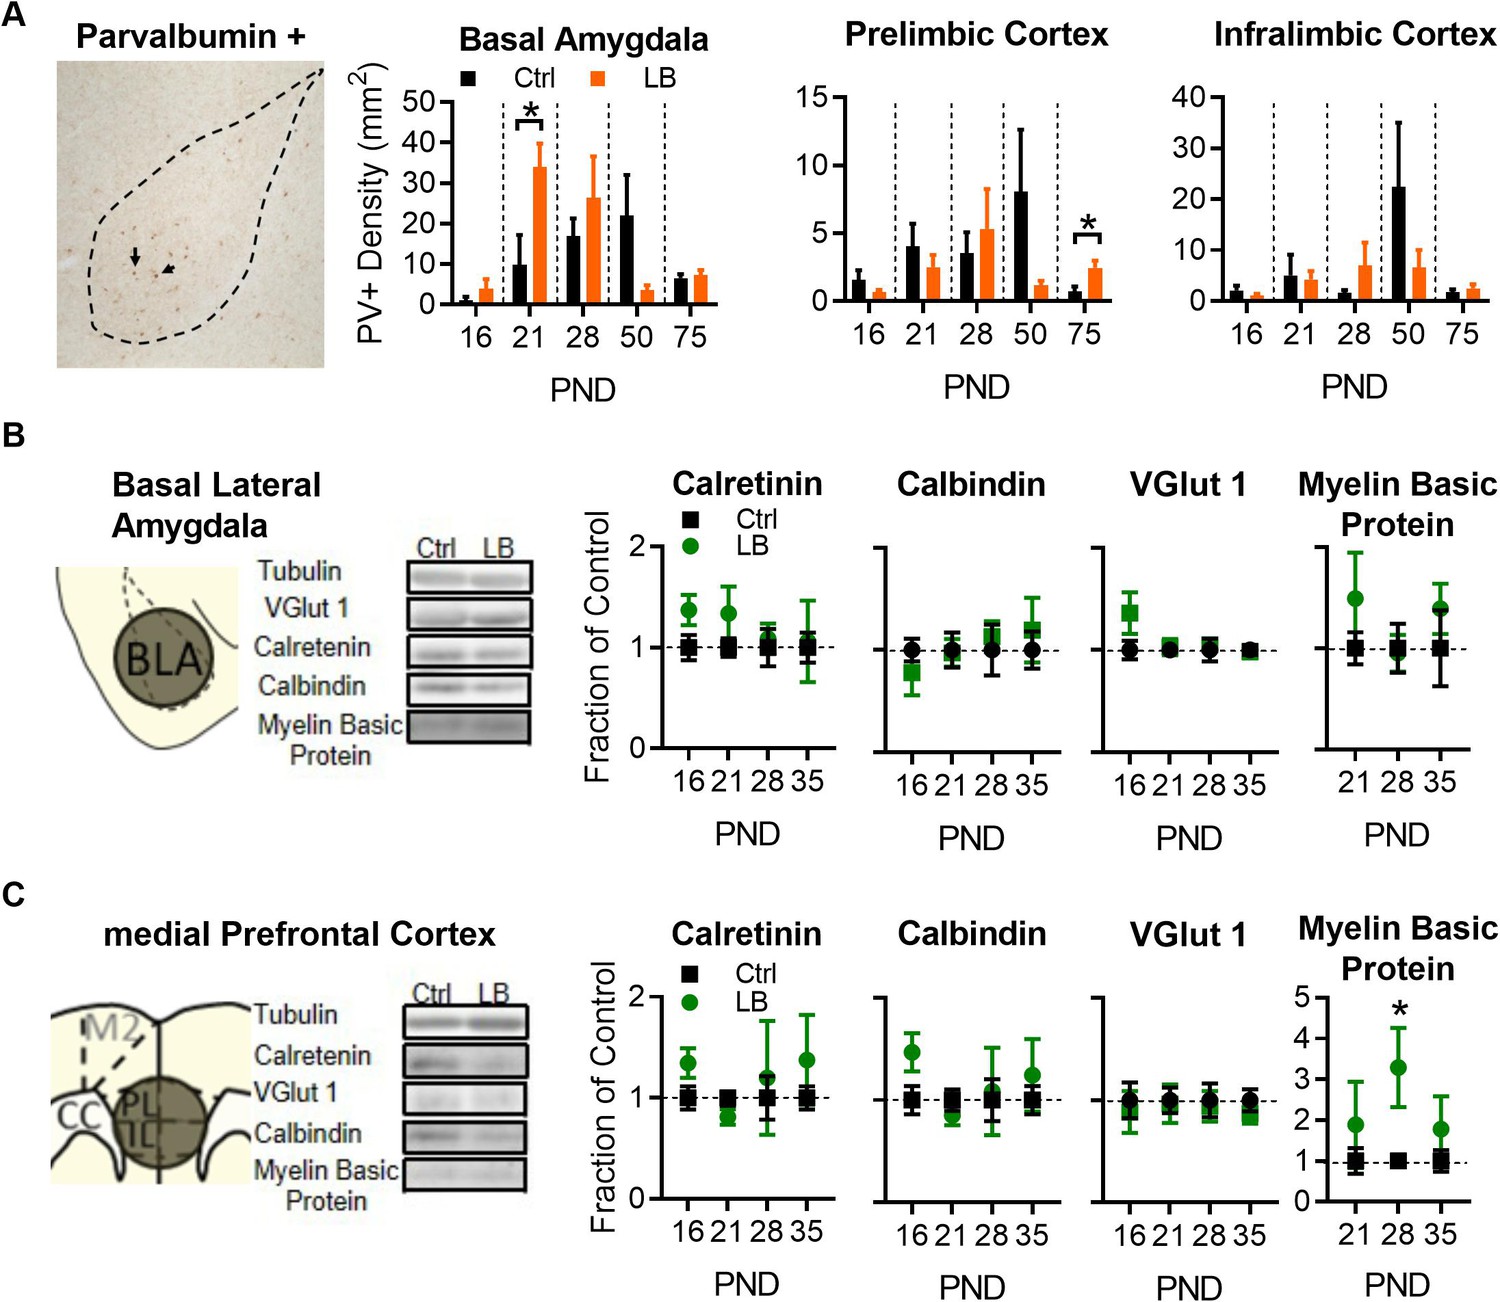
LB alters select markers for neuronal populations in mPFC and BLA.
(A) Representative image of immunohistochemical labeling in the BLA of an LB PND 21 mouse (left). From left to right, graphs showing the density of PV-positive cells in the BLA, PL, and IL of male mice at different ages. Immunohistochemical analysis revealed that LB significantly increased Parvalbumin positive (PV+) neurons at PND 21 in BLA (t10 = 2.40, p=0.037) but not in PL (t10 = 0.83, p=0.42) or IL (t10 = 0.17, p=0.86). Except for PL at PND 75 (t9 = 2.85, p=0.018), no differences were observed at PND 16, 28, 50 or 75 respectively for BLA (t8 = 1.07, p=0.31; t8 = 0.85, p=0.41; t9 = 1.65, p=0.13; t9 = 0.48, p=0.63), PL (t8 = 1.26, p=0.24; t10 = 0.54, p=0.59; t11 = 1.40, p=0.18; t9 = 2.85, p=0.018), or IL (t8 = 1.03, p=0.33; t10 = 1.15, p=0.27; t11 = 1.12, p=0.28; t9 = 0.81, p=0.43). For BLA (Ctrl n = 5, 7, 5, 6, 6; LB n = 5, 5, 5, 5, 5). For PL and IL (Ctrl n = 5, 6,6,7,6; LB n = 5, 6, 6, 6, 5). (B) Western blot analysis of BLA tissue. Diagram and sample blots of PND 35 mice are shown. Graphs showing differing protein levels of mice from infancy into adolescence. No differences between LB and control mice were observed in BLA for calretinin (t11 = 1.90, p=0.083; t11 = 1.28, p=0.22; t11 = 0.37, p=0.71; t12 = 0.14, p=0.88), calbindin (t11 = 0.94, p=0.36; t11 = 0.12, p=0.90; t11 = 0.46, p=0.65; t12 = 0.53, p=0.60), VGLUT1 (t11 = 1.53, p=0.15; t12 = 0.26, p=0.79; t12 = 0.41, p=0.68; t12 = 0.18, p=0.85), or myelin basic protein (t11 = 1.08, p=0.30; t11 = 0.16, p=0.87; t12 = 0.86, p=0.40) levels. For calbindin, calretinin, and myelin basic protein (Ctrl n = 7, 7, 6, 7; LB n = 6, 6, 7, 7). For VGLUT1 (Ctrl n = 6, 7, 7, 7; LB n = 7, 7, 7, 7). (C) Western blot analysis of mPFC tissue. Diagram and sample blots of PND 35 mice are shown. Graphs showing differing protein levels of male mice from infancy into adolescence. No differences between LB and control mice were observed in mPFC for calretinin (t10 = 1.84, p=0.095, t12 = 1.71, p=0.11, t9 = 0.35, p=0.73, t11 = 0.88, p=0.39), calbindin (t10 = 2.01, p=0.071; t12 = 1.02, p=0.32; t9 = 0.19, p=0.85; t11 = 0.67, p=0.51), or VGLUT1 (t10 = 0.42, p=0.68; t12 = 0.15, p=0.88; t12 = 0.26, p=0.79; t12 = 0.85, p=0.41) levels. An increase in mPFC Myelin Basic Protein was observed exclusively at PND 28 (t9 = 2.54, p=0.031), but not at PND 21 (t12 = 0.80, p=0.43) or 35 (t11 = 0.97, p=0.35). For calbindin, calretinin, and myelin basic protein (Ctrl n = 6, 7, 6, 7; LB n = 6, 7, 5, 6). No effects of VGLUT1 were observed in the mPFC. For VGLUT1 (Ctrl n = 6, 7, 7, 7; LB n = 6, 7, 7, 7). Bars represent group means + / - SEM. Unpaired two-tailed t-tests between control and LB of a given age were used for A, B and C. *=p < 0.05, **=p < 0.01, ***=p < 0.001.
Figure 4—figure supplement 1
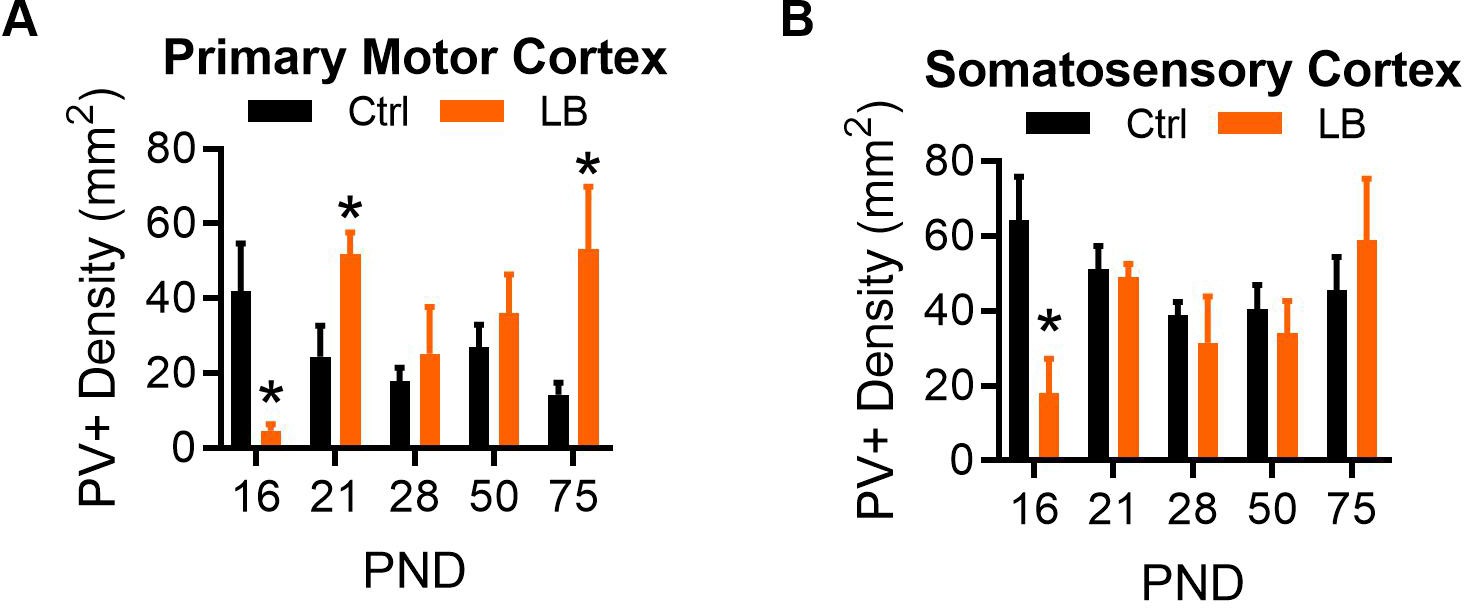
Density of Immunohistochemically stained parvalbumin-positive cells (PV+) in the rostral primary motor cortex and the rostral primary somatosensory cortex of male mice.
(A) LB mice had a significantly lower density of PV-positive cells compared to Ctrl at PND 16 (t9 = 3.21, p=0.010). By PND 21 LB cell density increased significantly above Ctrl levels (t9 = 2.76, p=0.022). No difference in PV+ cells were detected at PND 28 (t11 = 0.60, p=0.56) or 50 (t9 = 0.78, p=0.45). A significantly higher density of PV-positive cells was observed in LB relative to control mice at PND 75 (t9 = 2.49, p=0.033). (B) In somatosensory cortex, LB mice had a significantly lower density of PV-positive cells compared to Ctrl at PND 16 (t9 = 3.17, p=0.011), which was resolved by PND 21, with no significant differences being observed at PND 21 (t9 = 0.31, p=0.75), 28 (t11 = 0.60, p=0.55), 50 (t9 = 0.61, p=0.55), or 75 (t9 = 0.73, p=0.47). For both panels Ctrl n = 5, 5, 7, 6, 6; LB n = 6, 6, 6, 5, 5. For all graphs the mean and SEM are presented. A two-tailed paired student t-test was used to test between group differences. *=p < 0.05, **=p < 0.01, ***=p < 0.001.
Figure 5 with 2 supplements
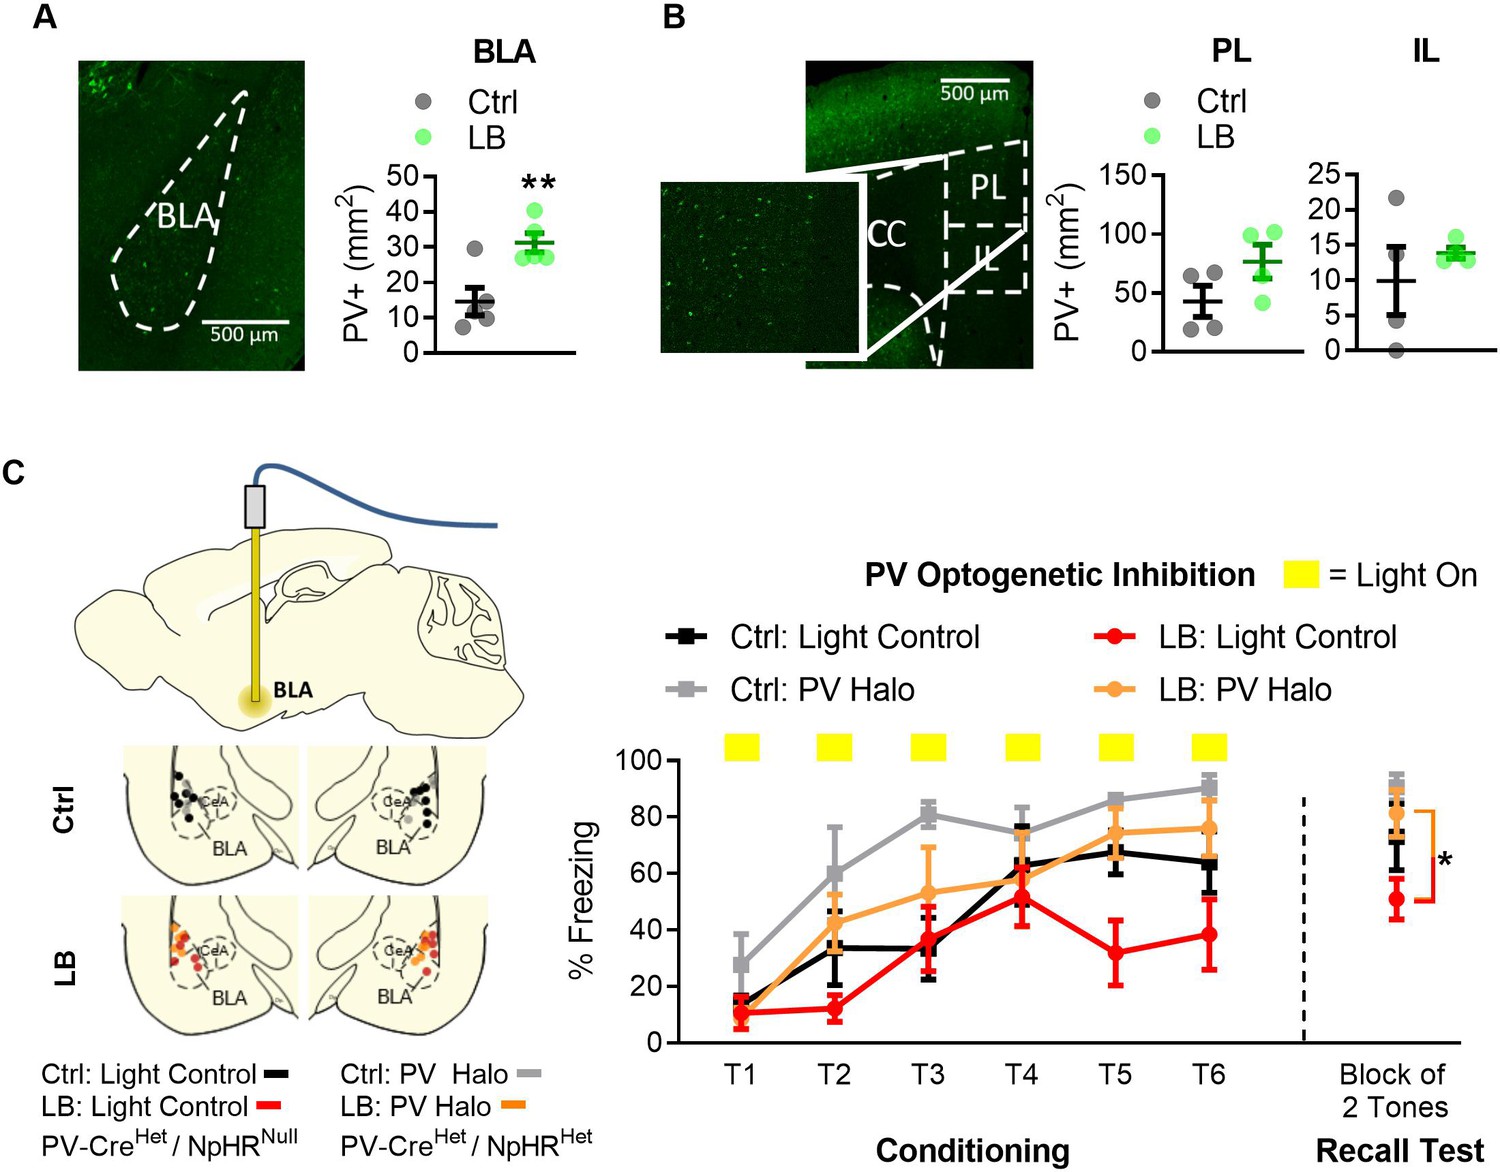
Optogenetic inactivation of parvalbumin-positive (PV+) cells was sufficient to increase fear expression at PND 22 in LB mice.
(A) Representative image of PV-positive cells in BLA of Het PV-Cre/Het floxed halo (‘PV Halo’) mouse line (left). LB increased the density of PV-positive cells in the BLA (t8 = 3.49, p=0.0081; n = 5 per group). (B) Representative image of PV+ cells in the mPFC of a PV Halo (left). LB did not affect the density of PV-positive cells in PL (t6 = 1.72, p=0.13) or IL (t6 = 0.80, p=0.45) compared with control reared mice (n = 4 per group). (C) Graph showing conditioning and recall test. Optogenetic inhibition occurred during the conditioning tones. Ctrl and LB reared Light control (Het PV-Cre/null floxed Halo) and PV Halo (Het PV-Cre/Het floxed Halo) mice were bilaterally implanted with an optical fiber into BLA, optic fiber placements are shown (left). To assess effects of optogenetic inhibition of PV cells in LB reared mice we compared LB light controls versus LB PV Halo mice. When analyzing PV inhibition in LB mice, a main effect of tone presentation (F(5,45) = 6.97, p<0.0001) was observed, indicating mice had learned the tone/foot shock association. Optogenetic inactivation of PV positive cells in LB reared mice increased freezing during conditioning (F(1,9) = 6.21, p=0.034), and resulted in an increase in freezing on the recall test 24 hr later (t9 = 2.69, p=0.024). No interaction between tone presentation and experimental condition was observed (F(5,45) = 1.55, p=0.19) between LB light control and LB PV Halo mice. For LB: light control n = 5, for LB: PV Halo n = 6. When assessing the effects of PV-positive cell inhibition between Ctrl: Light control and Ctrl: PV Halo mice, a repeated measure ANOVA revealed a main effect of tone presentation (F(5,45) = 9.08, p<0.0001), and optogenetic inactivation (F(1,9) = 9.5, p=0.013). No main effect of tone by optogenetic inactivation (F(5,45) = 0.96, p=0.44) was observed. No differences in memory retrieval were observed between the Ctrl: light control and the Ctrl: PV Halo mice (t9 = 1.29, p=0.22). For additional locomotion controls and cFos analysis of inhibition see Figure 4—figure supplement 1. A repeat measure two-way ANOVA was used to assess differences in fear conditioning, for all other analysis two-tailed unpaired student t-tests were used. Bars represent group means + / - SEM. *=p < 0.05, **=p < 0.01, ***=p < 0.001.
Figure 5—figure supplement 1
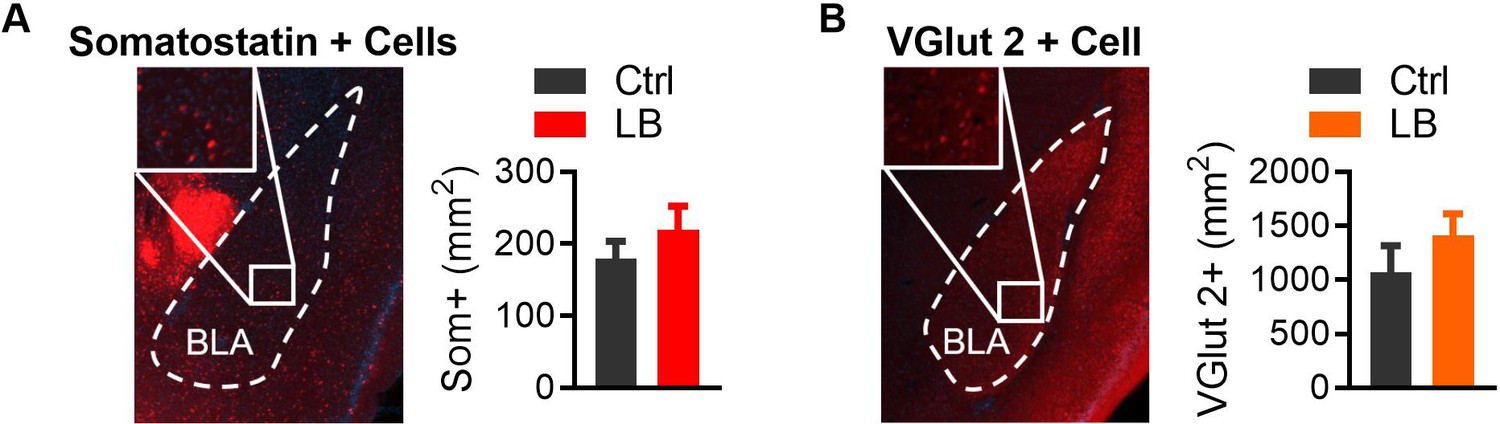
LB does not affect Somatostatin or VGlut2-positive cell densities in the BLA at PND 21.
(A) Genetic labeling of somatostatin-positive cells (left), derived from Sst-Cre mice crossed with an Ai14 (Td-Tomato) reporter mouse. No significant differences were observed between Ctrl and LB male mice (t7 = 0.91, p=0.39). Ctrl n = 4; LB n = 5. (B) Genetic labeling of slc17a6 ‘VGlut2’-positive cells (left) generated by crossing a VGlut2-Cre mouse with an Ai14 (Td-Tomato) reporter mouse. No significant differences were observed between Ctrl and LB male mice (t6 = 1.06, p=0.32). Ctrl n = 4; LB n = 5. A two-tailed paired student t-test was used to test between group differences. For all graphs the mean and SEM are presented. *=p < 0.05, **=p < 0.01, ***=p < 0.001.
Figure 5—figure supplement 2
Optogenetic inhibition did not affect locomotion but did increase cFos in the BLA.
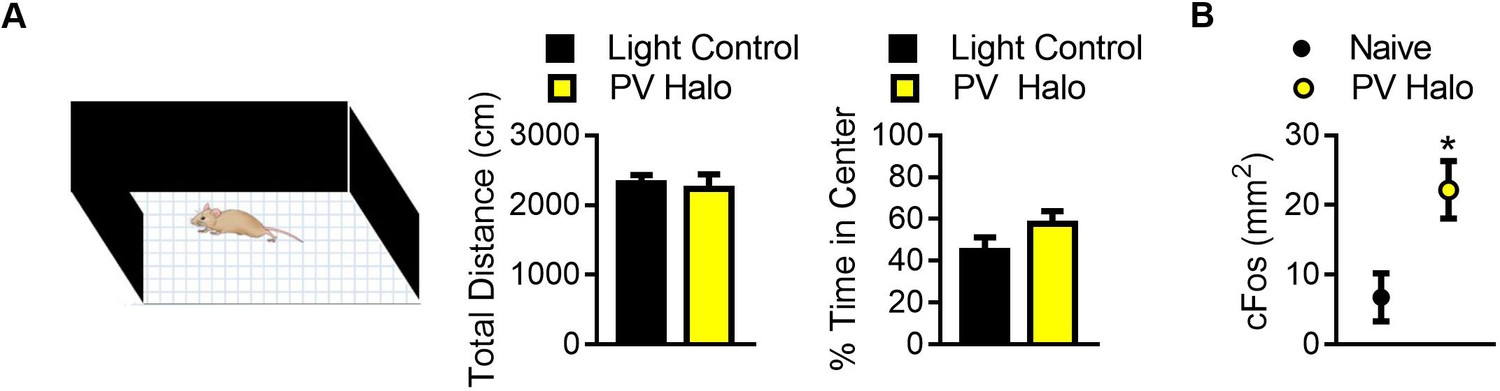
(A) Graphs showing the effect of optogenetic inhibition of PV+ cells in the BLA on locomotion (left) and anxiety-like behavior (right). Optogenetic inhibition of PV+ cells did not affect distance traveled (t11 = 0.36, p=0.72) or the time spent in the center of the open field (t11 = 1.40, p=0.18) when compared to light controls. For light control n = 7, for PV Halo n = 6. (B) Graph showing the effects of optogenetic inactivation on cFos labeling within the BLA, following 15 min of unilateral inhibition in the home cage. Immunohistochemical labeling for cFos revealed that unilateral optogenetic inactivation of PV+ cells increased cFos-positive cells in the inhibited side of the brain (t4 = 2.89, p=0.044) when compared to the uninhibited side (n = 5). Two-tailed unpaired student t-tests were used to analyze data in panel A, while a two-tailed paired student t-test was used to assess differences in cFos labeling in panel B. For all graphs, the mean and SEM are presented and represent data from a mix of male and female mice. *=p < 0.05, **=p < 0.01, ***=p < 0.001.
Figure 6 with 1 supplement
LB altered mPFC to BLA anatomical connectivity in females but not males.
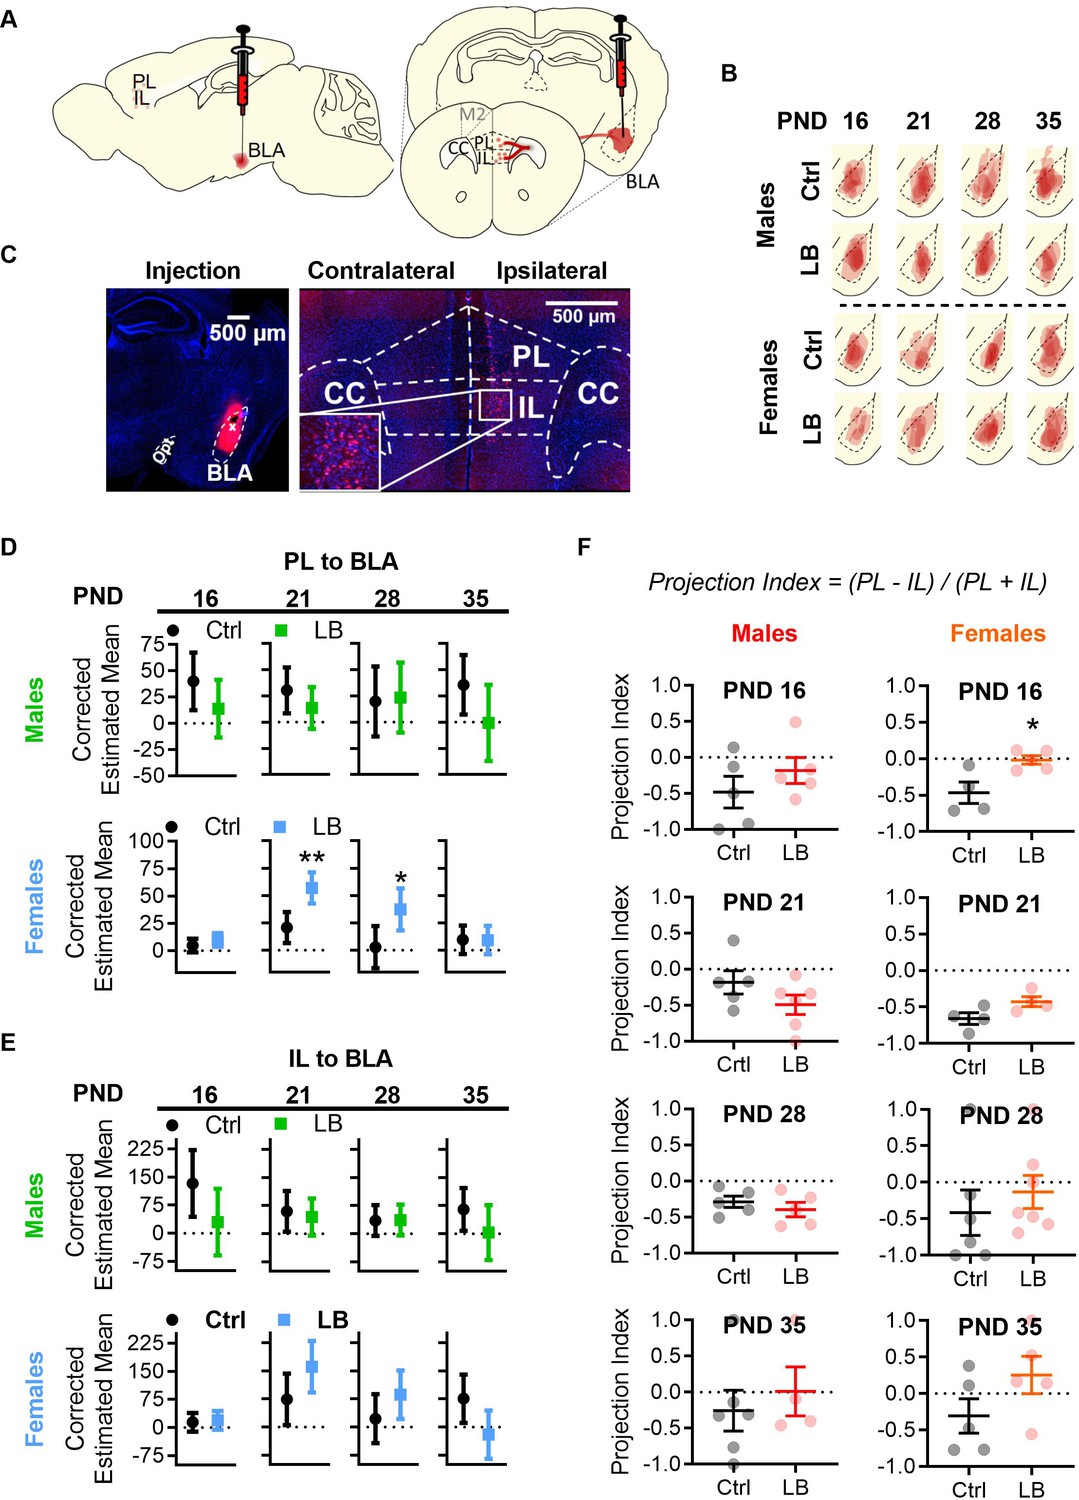
(A) Diagram of CTB 594 retrograde injection into the BLA. (B) Tracings of CTB injections into the BLA. (C) Example picture of injection in the BLA (left), and of cells labelled in mPFC (right). (D) Graphs showing the differences in PL to BLA corrected estimated mean densities with 95% confidence intervals from infancy (PND16) into adolescence (PND 35). In males, the density of PL to BLA projecting cells in LB mice did not differ at PND 16 (F(1,6) = 2.46, p=0.16), 21 (F(1,7) = 1.69, p=0.23), 28 (F(1,6) = 0.035, p=0.85) or 35 (F(1,6) = 3.08, p=0.13) when compared to control mice. In females, a significant increase in PL to BLA projecting cells density was observed in LB mice at PND 21 (F(1,4) = 21.74, p=0.010) and 28 (F(1,10) = 7.44, p=0.021) but not at PND 16 (F(1,6) = 1.47, p=0.27) or 35 (F(1,6) = 0.001, p=0.97). (E) Graphs showing the differences in IL to BLA corrected estimated mean densities with 95% confidence intervals from infancy into adolescence. LB did not affect the density of IL to BLA projections at any age for males (16: F(1,6) = 3.71, p=0.10; 21: F(1,7) = 0.22, p=0.65; 28: F(1,6) = 0.003, p=0.958; 35: F(1,6) = 2.17, p=0.19) or females (16: F(1,6) = 0.091, p=0.77; 21: F(1,4) = 5.35, p=0.082; 28: F(1,10) = 2.212, p=0.168; 35: F(1,6) = 5.10, p=0.065). For panels D and E (Ctrl male n = 5, 5, 5, 6; LB male n = 5, 6, 5, 4; Ctrl female n = 5, 4, 7, 5; LB female n = 5, 4, 7, 5). (F) Graphs showing the differences in projection index from infancy into adolescence. LB altered the balance of PL and IL projections to BLA at PND 16 in females (t7 = 3.09, p=0.0175). No other significant differences were observed in the projection index for males (16: t8 = 1.05, p=0.32; 21: t9 = 1.47, p=0.17; 28: t8 = 0.83, p=0.42; 35: t8 = 0.60, p=0.56) or females (21: t6 = 2.22, p=0.068; 28: t11 = 0.75, p=0.46; 35: t8 = 1.61, p=0.14). (Ctrl male n = 5, 5, 5, 6; LB male n = 5, 6, 5, 4; Ctrl female n = 4, 4, 6, 5; LB female n = 5, 4, 7, 5). For D and E dots represent estimated group means with 95% confidence intervals. Estimated means were derived from ANCOVA analysis using two covariates: 1) the area of the CTB injection and 2) the area of BLA where the injection occurred. An ANCOVA was run per age per sex. Statistical significance was determined through post ANCOVA univariate comparison. For panel F, dots represent individual values, bars represent group mean + / - SEM. Unpaired two-way student t-tests were used to assess statistical significance between control and LB mice per age per sex in panel F. *=p < 0.05, **=p < 0.01, ***=p < 0.001.
Figure 6—figure supplement 1
Sex differences in mPFC to BLA projections in control reared mice.
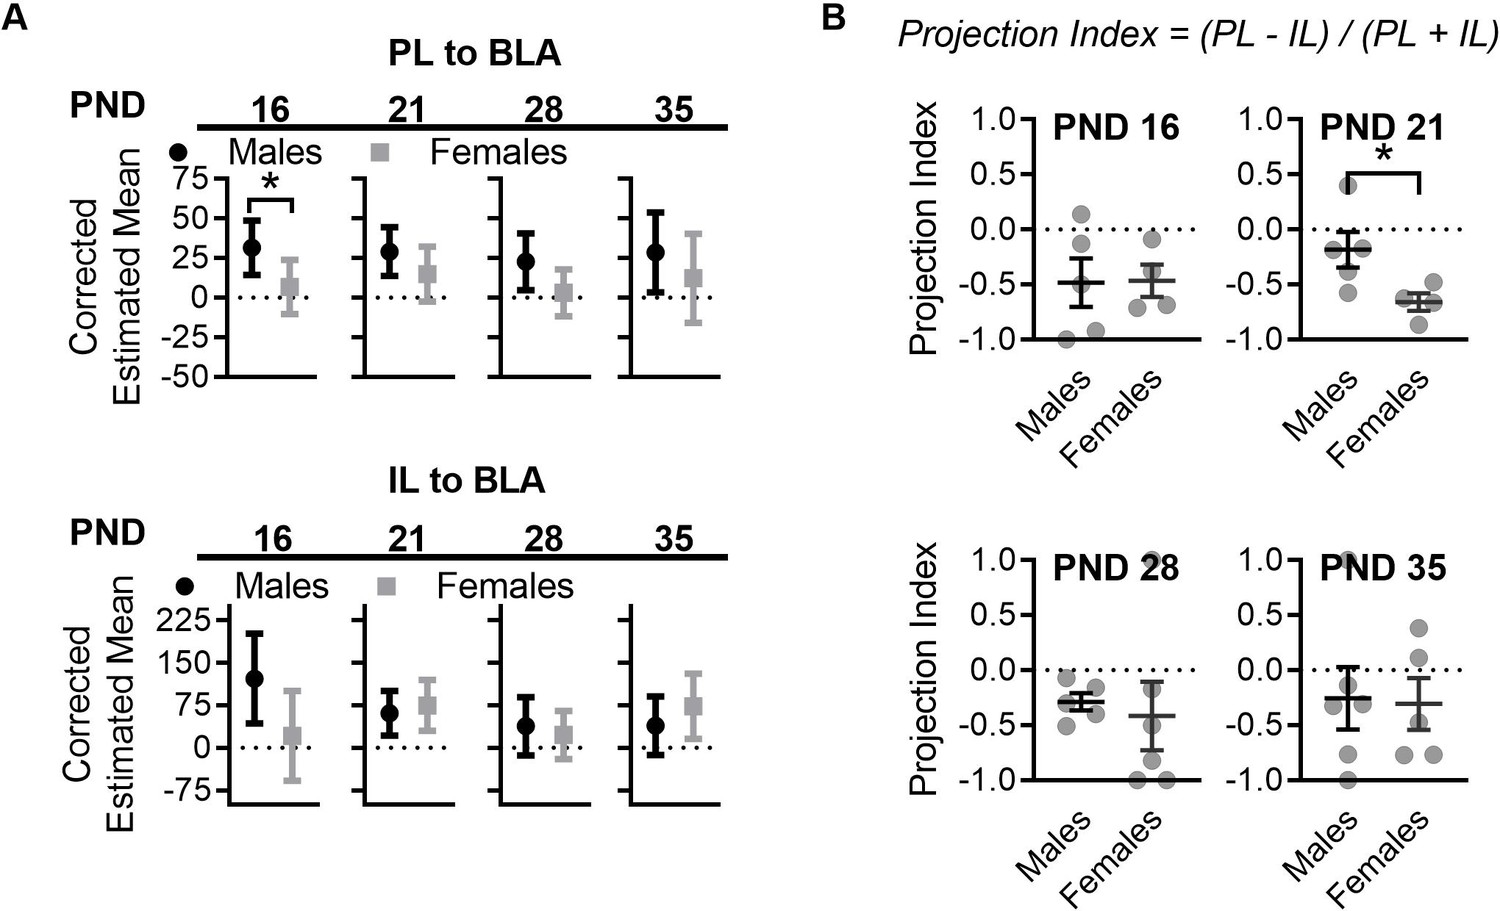
(A) Control females and males had significantly different corrected estimated mean densities of cells projecting from PL to BLA at PND 16 (F(1,6) = 6.18, p=0.047). Sex differences were no longer significant at PND 21(F(1,5) = 2.23, p=0.19), 28 (F(1,8) = 3.19, p=0.11), or 35 (F(1,7) = 0.90, p=0.37). No sex differences were observed between control reared females and males at any of the ages tested for IL to BLA projections (16: F(1,6) = 4.86, p=0.069; 21: F(1,5) = 0.31, p=0.59; 28: F(1,8) = 0.25, p=0.62; 35: F(1,7) = 0.97, p=0.35). (Ctrl males n = 5, 5, 5, 6; Ctrl females n = 5, 4, 7, 5). (B) Comparison of projection index between control reared male and female mice revealed a significant difference only at PND 21 (t7 = 2.40, p=0.047) but not at any of the other ages tested (16: t7 = 0.056, p=0.95; 28: t9 = 0.36, p=0.72; 35: t9 = 0.12, p=0.90). (Ctrl males n = 5, 5, 5, 6; Ctrl females n = 4, 4, 6, 5). For panel A, corrected estimated means and the 95% confidence intervals are shown. The corrected mean 95% confidence intervals were obtained through ANCOVA analysis run per brain region per age. Statistical significance was determined through post ANCOVA univariate comparison. For panel B, dots represent individual values, bars represent group mean + / - SEM. Unpaired two-way student t-tests were used to assess statistical significance between control and LB mice per age per sex in panel F. *=p < 0.05, **=p < 0.01, ***=p < 0.001.
Tables
Key resources table
| Reagent type (species) or resource | Designation | Source or reference | Identifiers | Additional information |
|---|---|---|---|---|
| Strain, strain background | pvalbtm1(cre)Arbr‘PV-Cre’ | The Jackson Laboratory | RRID:IMSR_JAX:008069 | |
| Strain, strain background | Gt(ROSA)26Sortm39(CAG-hop/EYFP)/HZE ‘floxed Halo’ | The Jackson Laboratory | RRID:IMSR_JAX:014539 | |
| Strain, strain background | Ssttm2.1(cre)Zjh ‘somatostatin-Cre’ | The Jackson Laboratory | RRID:IMSR_JAX:013044 | |
| Strain, strain background | Slc17a6tm2(cre)Lowl‘vGlut2-Cre’ | The Jackson Laboratory | RRID:IMSR_JAX:016963 | |
| Strain, strain background | Gt(ROSA)26Sortm14(CAG-tdTomato)Hze mice ‘Ai14’ | The Jackson Laboratory | RRID:IMSR_JAX:007908 | |
| Antibody | Anti-Parvalbumin (rabbit polyclonal) | Millipore Sigma | RRID:AB_838238 | (1:1,000) |
| Antibody | Anti-c-Fos (rabbit polyclonal) | Millipore Sigma | RRID:AB_2631318 | (1:20,000) |
| Antibody | Anti- β-Tubulin (mouse monoclonal) | Cell Signaling | RRID:AB_2715541 | (1:2,000) |
| Antibody | Anti-GAPDH (rabbit monoclonal) | Cell Signaling | RRID:AB_561053 | (1:2,000) |
| Antibody | Anti-Calretinin (mouse monoclonal) | Swant | RRID:AB_10000320 | (1:500) |
| Antibody | Anti-Calbindin (mouse monoclonal) | Swant | RRID:AB_10000347 | (1:500) |
| Antibody | Anti-Myelin Basic Protein (rabbit polyclonal) | Abcam | RRID:AB_1141521 | (1:1000) |
| Antibody | Anti-VGLUT1 (rabbit polyclonal) | Millipore Sigma | RRID:AB_2814811 | (1:1000) |
| Antibody | Anti-Mouse IgG (H+L) (donkey polyclonal) | Jackson ImmunoResearch | RRID:AB_2340770 | (1:2000) |
| Antibody | Anti-Rabbit IgG (H+L) (donkey polyclonal) | Jackson ImmunoResearch | RRID:AB_10015282 | (1:2000) |
| Chemical compound, drug | Cholera Toxin Subunit B (Recombinant), Alexa Fluor 594 Conjugate | Fisher Scientific | C22842 | 1.0 mg/ml |
| Software, algorithm | Noldus Ethovision XT | Noldus | RRID:SCR_000441 | Version 11 |
| Software, algorithm | SPSS | SPSS | RRID:SCR_002865 | Version 26 |
| Software, algorithm | GraphPad Prism | GraphPad | RRID:SCR_002798 | Version 8 |
Additional files
Download links
A two-part list of links to download the article, or parts of the article, in various formats.
Downloads (link to download the article as PDF)
Open citations (links to open the citations from this article in various online reference manager services)
Cite this article (links to download the citations from this article in formats compatible with various reference manager tools)
Early life adversity decreases pre-adolescent fear expression by accelerating amygdala PV cell development
eLife 9:e55263.
https://doi.org/10.7554/eLife.55263


