Temporal selectivity declines in the aging human auditory cortex
- Department of Psychology, University of Lübeck, Germany
Figures
Figure 1 with 2 supplements
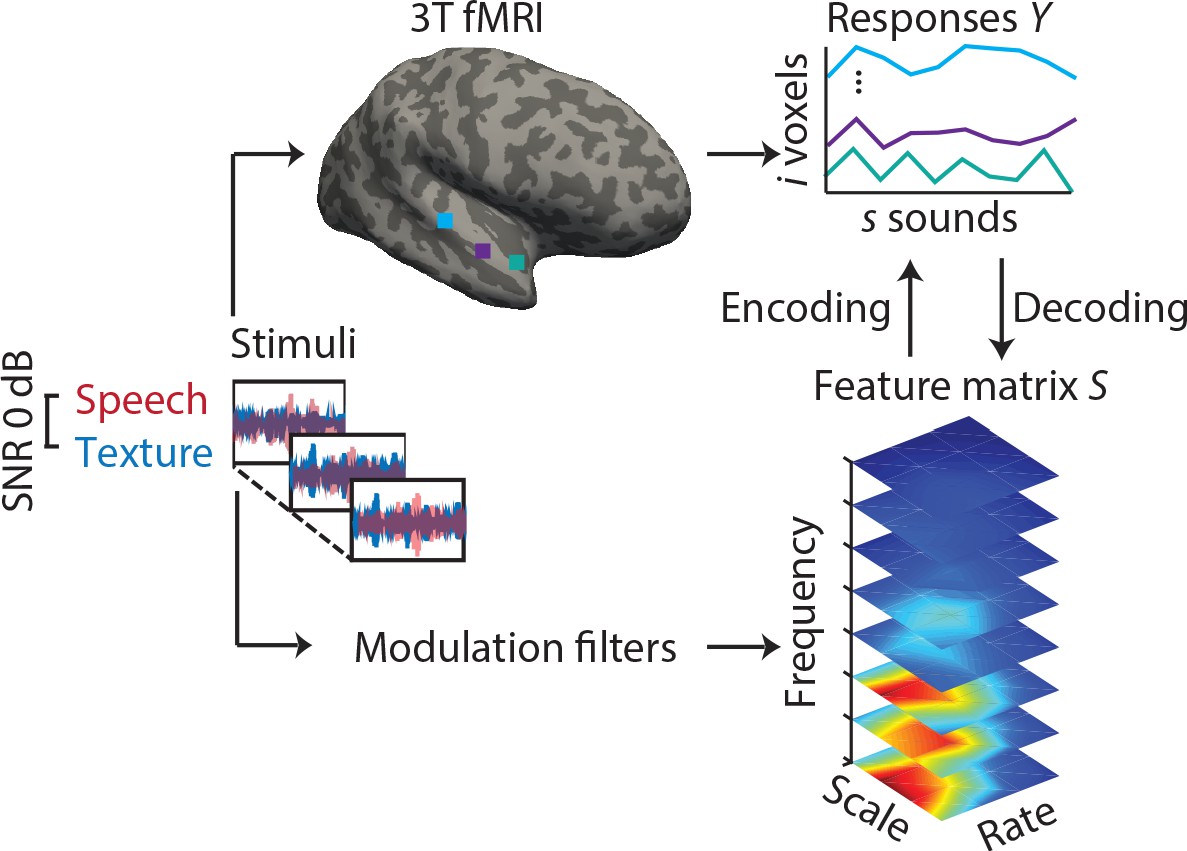
Experimental design and analysis pipeline.
Participants listened to a story embedded in sound textures at a signal-to-noise ratio(SNR) of 0 dB while we acquired 3T-fMRI data. For audiograms of the participants see Figure 1—figure supplement 1). The sounds were decomposed into their modulation spectrum (Chi et al., 2005; for modulation spectra of the sounds see Figure 1—figure supplement 2). In a first univariate encoding approach, we calculated a modulation transfer function (MTF) for each individual voxel. In a second multivariate decoding approach, linear decoders were trained on the response patterns in auditory cortex for each feature of the modulation representation. Predictions were then tested on a left-out testing data set.
Figure 1—figure supplement 1

Pure-tone audiometry and behavioural results.
(a) Audiograms for older participants (averaged over left and right ear). (b) Average behavioural performance (mean ± SEM) in the scanner in a four-choice task (three questions on the story content after each run) for young (green) and older participants (violet). Chance level was 0.25 [proportion correct]. Young participants performed significantly better than older participants (mean proportion correct difference = 0.1, p=0.009 [permutation test], Cohen’s d = 0.65).
Figure 1—figure supplement 2

Modulation spectra of the stimuli.
(a) Average of the marginalized modulation spectra for the stimulus streams separately and their mixture. (b) Standard deviation (SD) of the marginalized modulation spectra. (c) Pairwise correlations (Pearson’s r) between the different streams in the modulation representation. While speech and texture are mostly uncorrelated over time, the speech–texture mixture is highly correlated with the speech stream in the low frequency range and with textures in the high frequency range. Note that the left plot has a different scaling than the middle and right plot.
Figure 2

Sound identification accuracies for the different encoding models.
(a) Accuracies for sound mixture, texture (background stream) and speech (foreground stream), for young (left, green) and older participants (right, violet). Bars indicate the mean (± standard error of the mean, SEM) of all participants per age group. Accuracies are normalized between 0 and 1; zero denotes that the predicted activity pattern for a given stimulus was least similar to the measured one among all test stimuli; one denotes correct identification; chance level is 0.5. *p<0.05, **p<0.01, ***p<0.005, exact permutation test. (b) Identification accuracies for sound mixture were uncorrelated with chronological age within each age group.
Figure 3
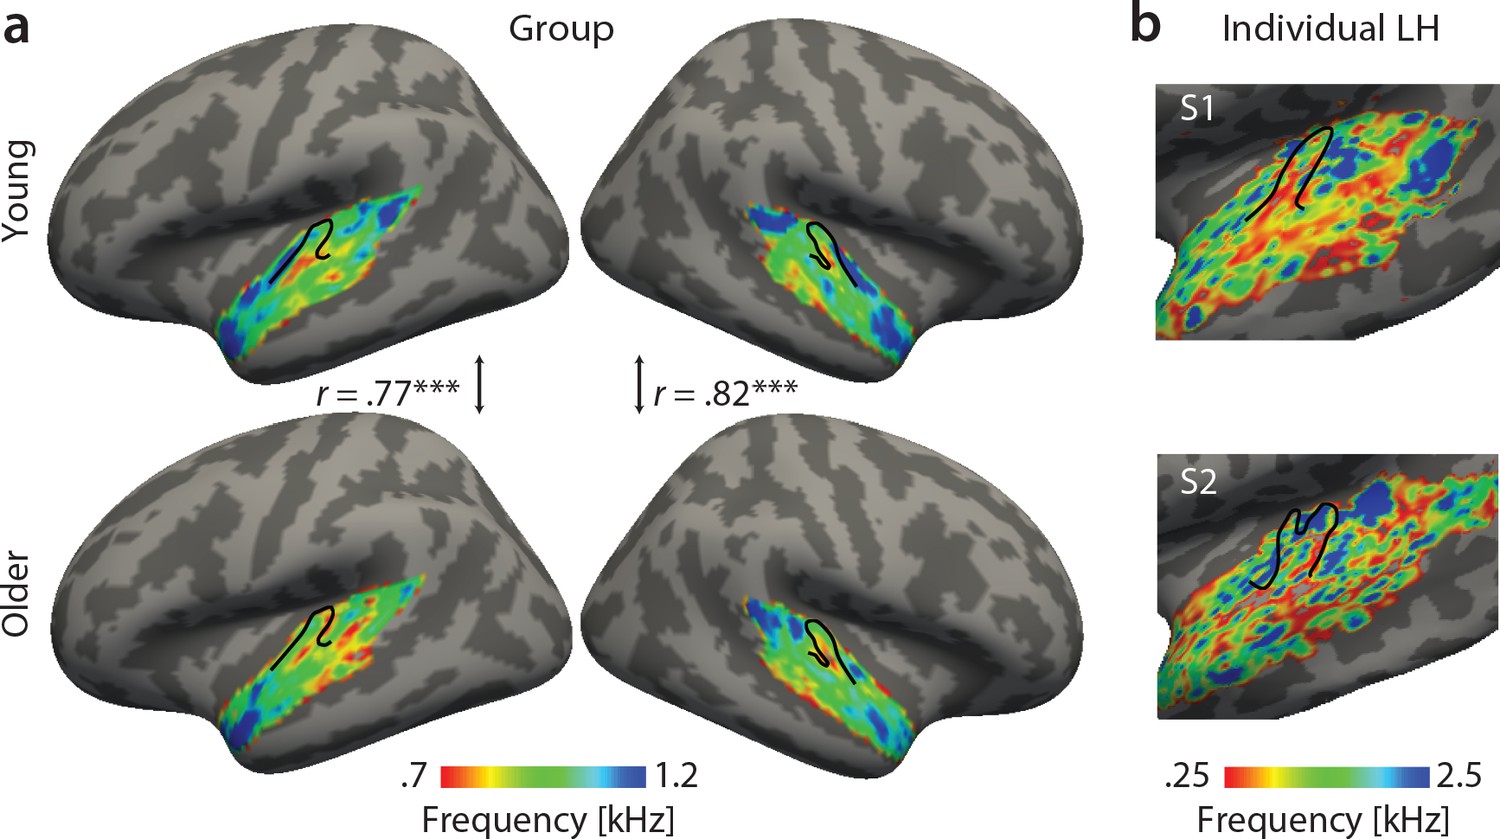
Tonotopic maps. Best frequency maps were derived by marginalizing modulation transfer functions (MTFs) for frequency and assigning the feature with the maximal response to a given voxel.
(a) Group maps were obtained as median across subjects and are shown on FreeSurfer’s fsaverage5 template. Tonotopic maps in the young (upper panel) and older group (bottom panel) are correlated in both the right and left hemisphere. (b) Exemplary individual tonotopic maps for the left hemisphere (LH) of a young (upper panel) and older participant (bottom panel) are displayed on individual surfaces. Black outlines indicate Heschl’s gyrus. ***p<0.005.
Figure 4
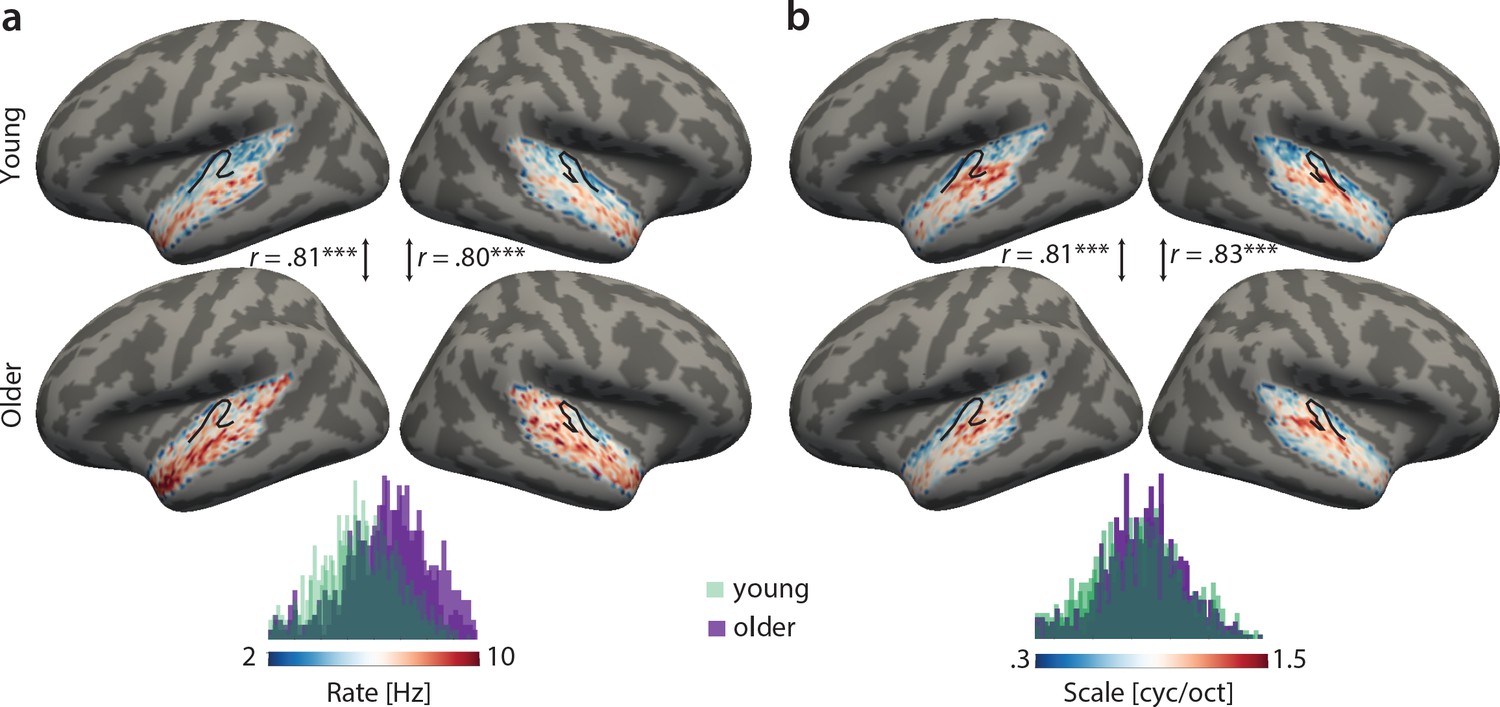
Group best-feature maps for temporal rate (a) and spectral scale (b).
Group maps were obtained as median across subjects and shown on FreeSurfer’s fsaverage5 template. Black outlines indicate Heschl’s gyrus. Topographic organization in the young (upper panel) and older group (bottom panel) is significantly correlated (Pearson’s correlation coefficient) for best temporal rate (a) and best spectral scale (b). Histograms of best feature values are shown for the young (green) and older group (violet) above the colour bars. Note the shift of the distribution in older relative to young adults for temporal rate (a) but not spectral scale (b), indicating that older adults’ voxel-wise preferred temporal rates are shifted towards higher modulation rates. ***p<0.005.
Figure 5 with 1 supplement
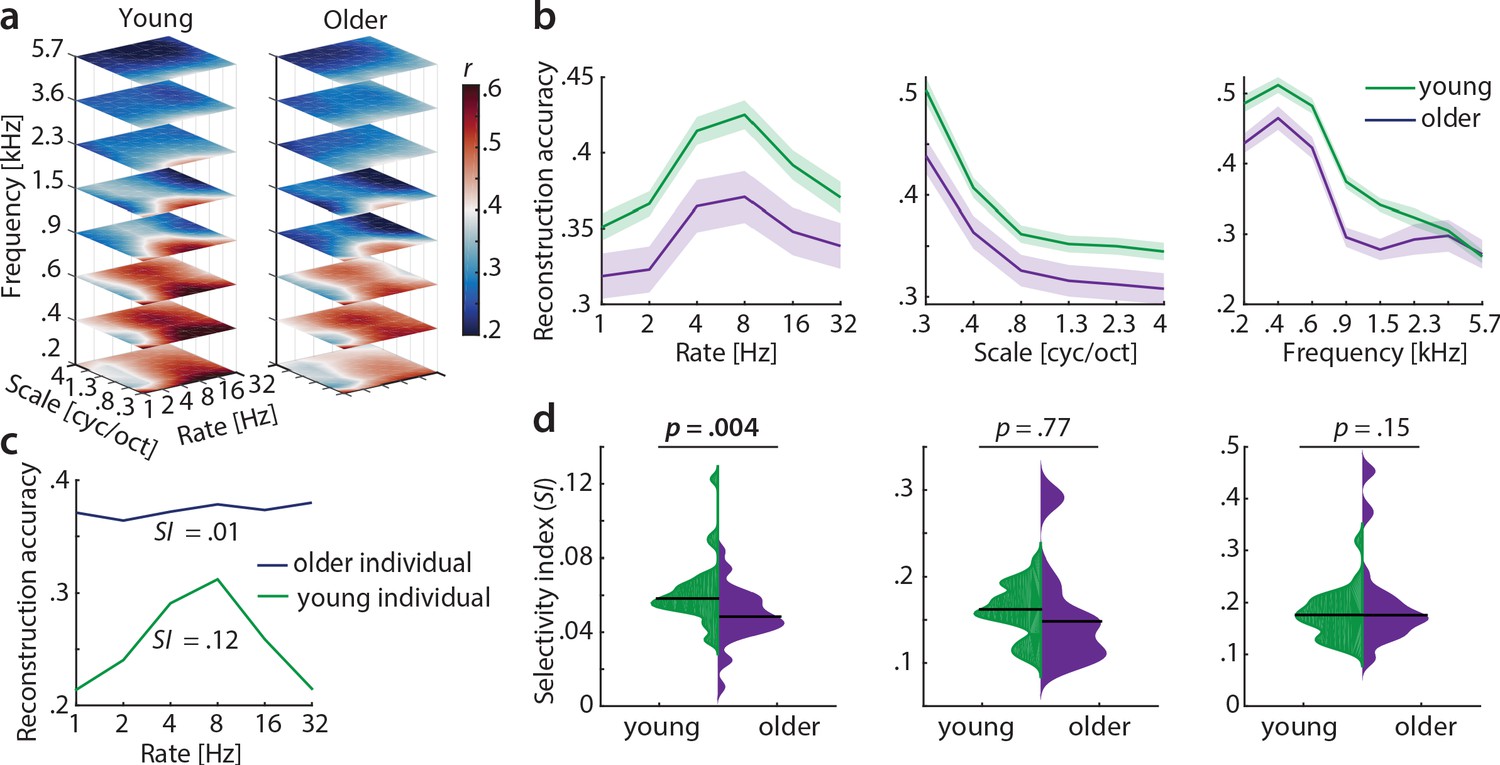
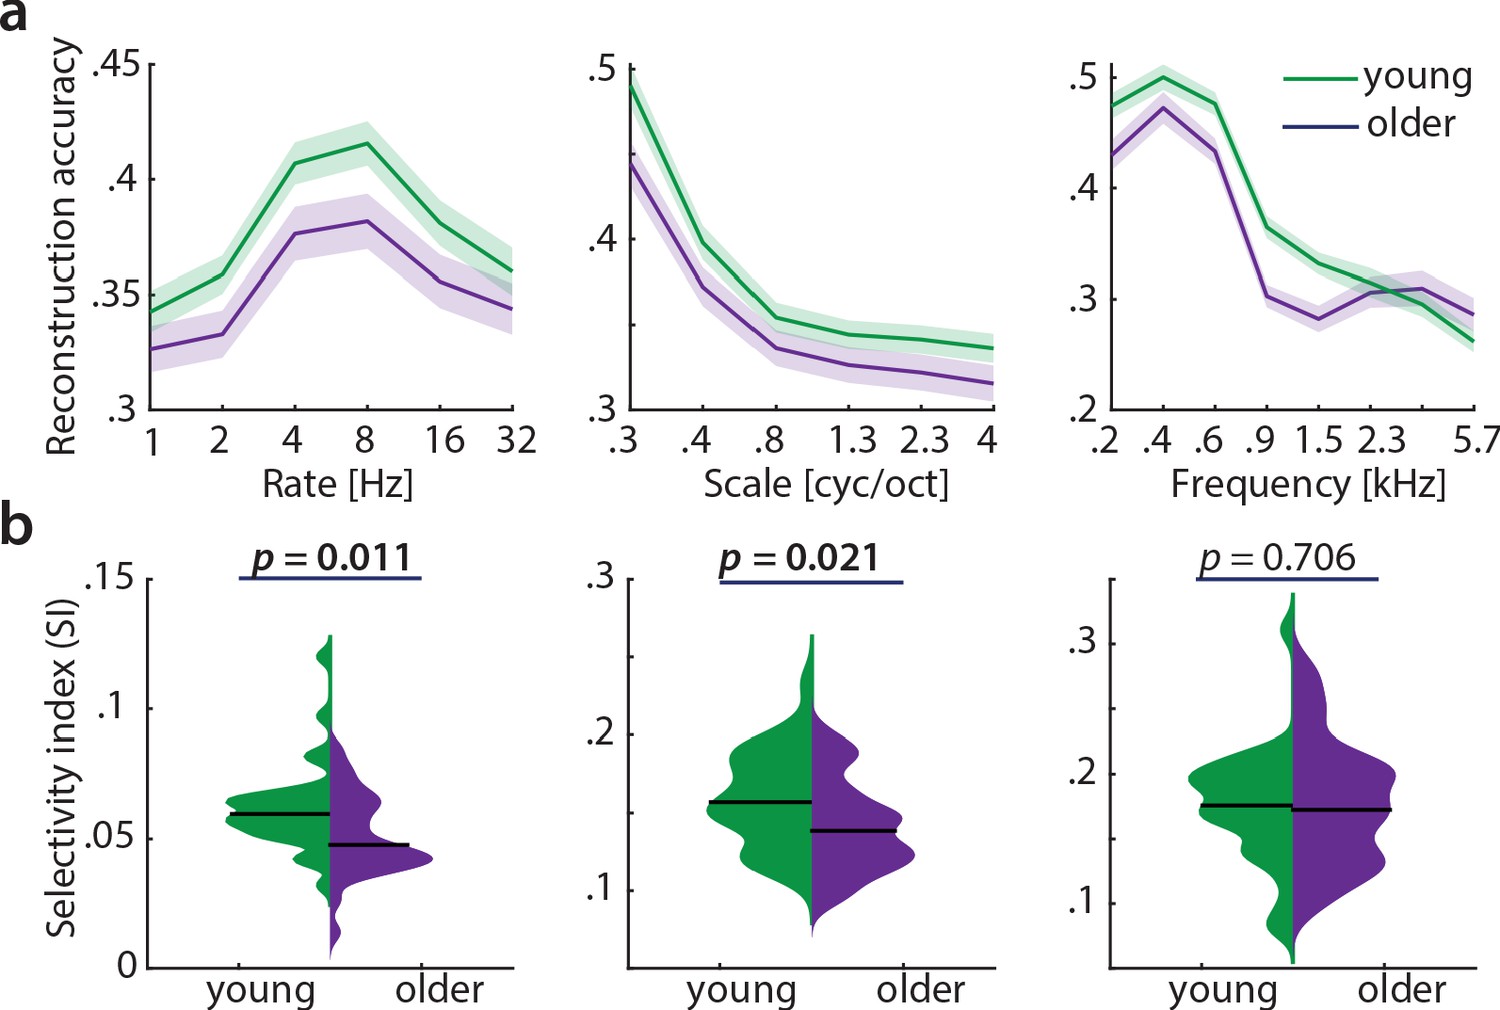
Decoding from auditory cortex.
(a) Auditory cortical modulation transfer functions (MTFs) for the young and older group quantified by reconstruction accuracies (Pearson’s r between predicted an actual acoustic features). (b) Mean ± SEM of the MTFs’ marginal profiles for rate, scale and frequency for young (green) and older (violet) participants separately. (c) We quantified tuning selectivity by the selectivity index (SI; see Equation 7). For illustration purposes, we show the marginal profiles for rate in a young (green) and older individual (violet) with extreme SI values. (d) SI was compared for each acoustic dimension (rate, scale, frequency) between age groups using an exact permutation test. Black line indicates the median SI. Black line indicates the median SI. Note that when removing the extreme case in the young group (exceeding the grand average by ±2 SD) for rate SI, the mean age-group difference remains significant (p=0.026). Removing the two extreme cases in the older group for scale SI leads to a significant age-group difference (p=0.024). Note the different scaling of the plots. See Figure 5—figure supplement 1 for decoding from auditory cortex with ICA (AROMA)-cleaned data.
Figure 5—figure supplement 1
Decoding from auditory cortex with ICA(AROMA)-cleaned data.
(a) Mean ± SEM of the MTFs’ marginal profiles for rate, scale and frequency for young (green) and older (violet) participants separately. (b) The selectivity index SI (see Equation 7) was compared per acoustic dimension between age groups using an exact permutation test. Note that irrespective of preprocessing (with or without ICA-cleaning, Figure 5), reconstruction accuracies peak at temporal rates of 4–8 Hz. Likewise, for AROMA-cleaned data SI for temporal rates is higher in young compared to older participants. Removing the young-subject outlier for rate SI (exceeding the grand average by ±2 SD) does not alter the SI mean age difference qualitatively (p=0.027).
Figure 6

Variance along reconstruction accuracy profiles as alternative measure for cortical tuning selectivity.
(a) Variance of the MTFs’ marginal profiles compared between age groups. P-values are based on an exact permutation test. (b) Amongst the older group, the variance of the rate profiles (‘rate variance’) correlates with the SI for rate (left panel) and chronological age (middle panel), but not with hearing loss (right panel; Spearman’s correlation coefficient). MTF: modulation transfer function, SI: selectivity index, PTA: pure tone average.
Figure 7 with 3 supplements
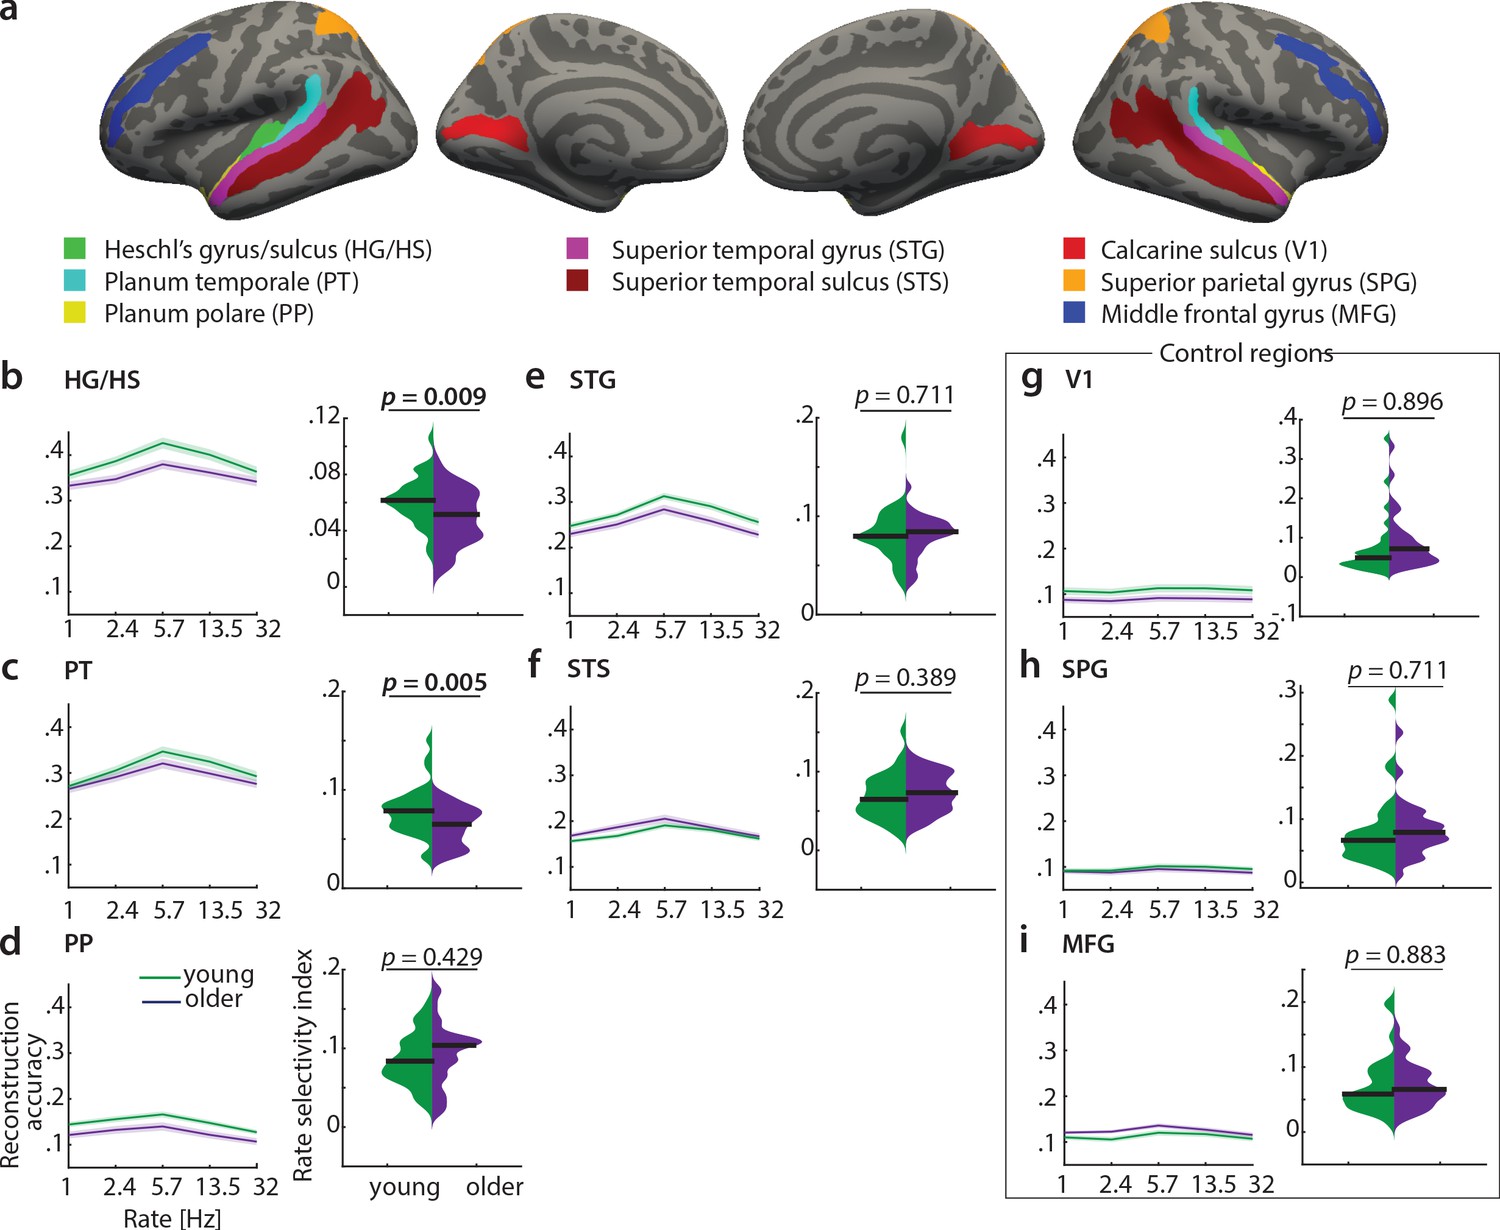
Decoding of temporal rate from regions of interest (ROIs).
(a) ROIs derived from the FreeSurfer atlas (Destrieux et al., 2010) are displayed on FreeSurfer’s fsaverage template. Mean (± SEM) reconstruction accuracy profiles (left) and selectivity index (right) per age group for temporal rate in (b) Heschl’s gyrus and sulcus, (c) planum temporale, (d) planum polare, (e) superior temporal gyrus, (f) superior temporal sulcus and the control regions (g) calcarine sulcus, (h) superior parietal gyrus, (i) middle frontal gyrus. The selectivity index (SI) was compared per ROI between age groups using an exact permutation test. When removing the young-subject SI exceeding the grand average by ±2 SD, the SI age difference remains significant in HG/HS (p=0.008), and in PT (p=0.04). Consistently, our alternative measure of selectivity, variance across rate bins, was significantly higher in young than older adults in HG/HS (p=0.0004) and PT (p=0.0003). See Figure 7—figure supplement 1 for the reconstruction accuracies z-scored with respect to the empirical null distribution in an exemplary region HG/HS. See Figure 7—figure supplement 2 for group maps of the rate selectivity index obtained from encoding models. See Figure 7—figure supplement 3 for decoding of spectral scale and frequency from ROIs.
Figure 7—figure supplement 1
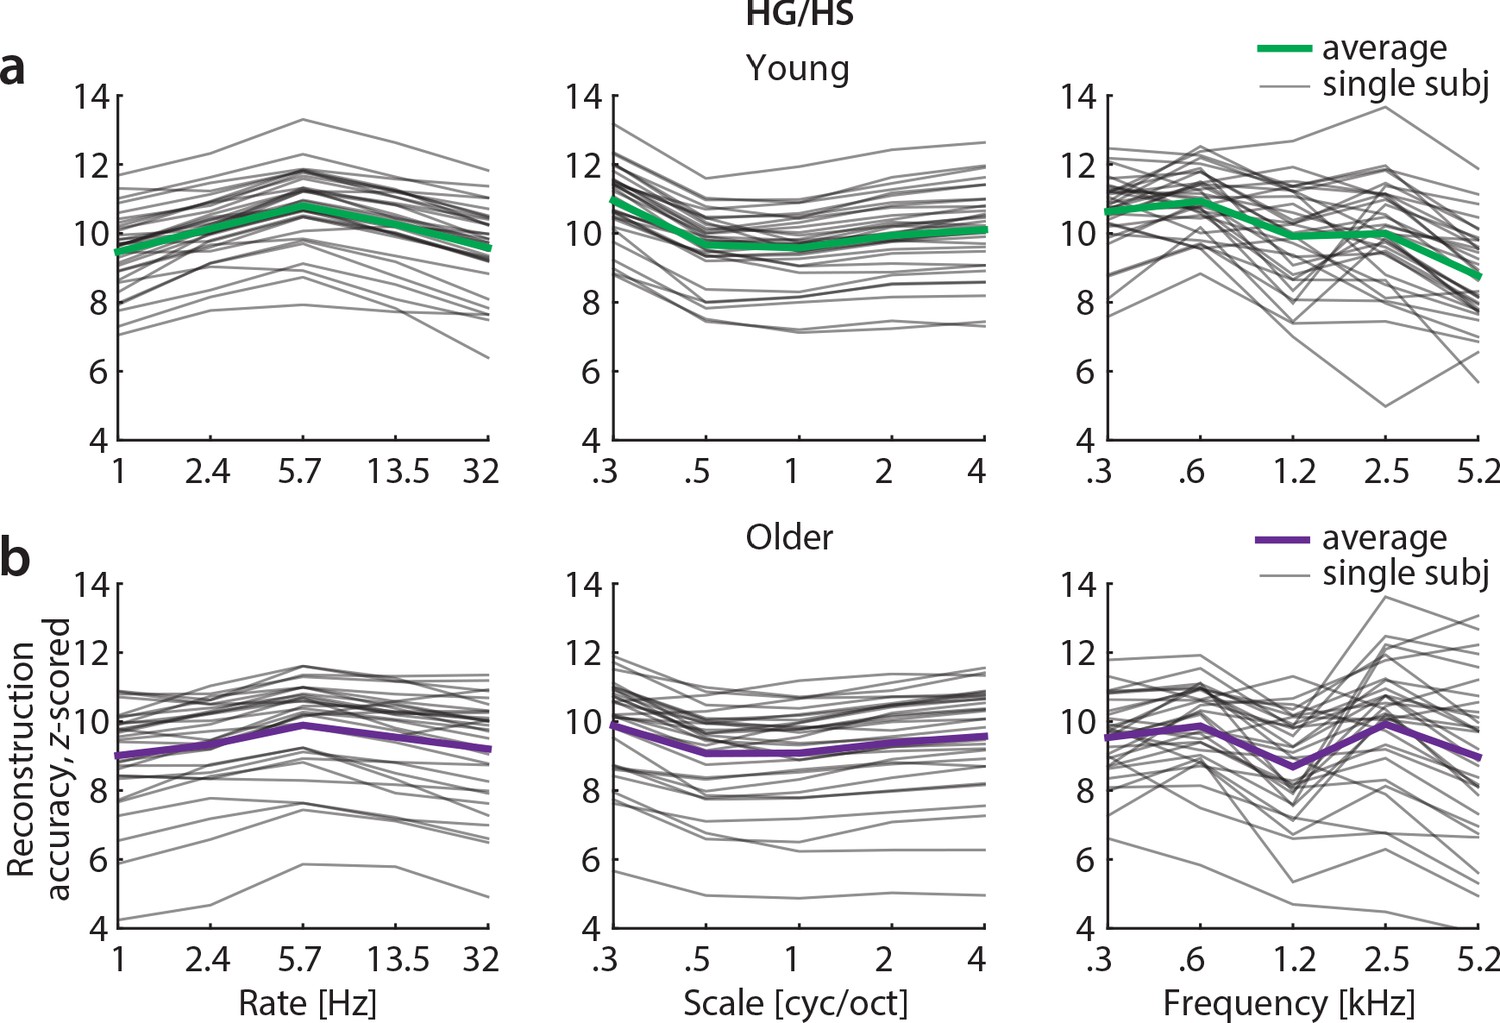
Z-scored reconstruction accuracies from Heschl’s gyrus/sulcus.
Single subject and median reconstruction accuracy profiles for temporal rate, spectral scale and frequency z-scored with respect to the empirical null distribution for young (a) and older (b) participants. Note that all z-values exceed 1.96 and are thus significant at p<0.05.
Figure 7—figure supplement 2

Topographic maps for the rate selectivity index.
Maps were derived by calculating the SI across the rate profile for a given voxel and averaged in the young group (upper panel) and older group (bottom panel). Higher SI (red) indicates higher selectivity. Black outlines indicate Heschl’s gyrus.
Figure 7—figure supplement 3

Decoding of spectral scale and frequency in ROIs.
Mean (± SE) reconstruction accuracy profiles (left) and selectivity index (right) per age group for spectral scale and frequency in (a) Heschl’s gyrus and sulcus (HG/HS), (b) planum temporale (PT), (c) planum polare (PP), (d) superior temporal gyrus (STG), (e) superior temporal sulcus (STS) and the control regions (f) calcarine sulcus (V1), (g) superior parietal gyrus (SPG) and (h) middle frontal gyrus (MFG). Selectivity index was compared per ROI between age groups using exact permutation test. Black line indicates the median SI. Note that removing the young outlier participant (>2 SD away from the mean) for scale in PT reduces the mean age difference to a still significant SI difference = 0.015, p=0.026.
Author response image 1
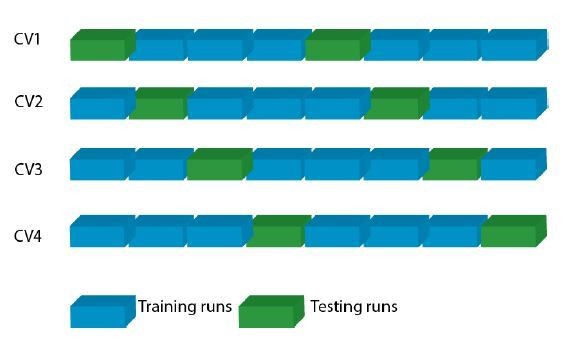
Cross-validation scheme per subject.
In a four-fold cross-validation (CV), the eight fMRI runs of each subject were split into six training and two testing runs, such that each run served once as testing run.Legend.
Additional files
Download links
A two-part list of links to download the article, or parts of the article, in various formats.
Downloads (link to download the article as PDF)
Open citations (links to open the citations from this article in various online reference manager services)
Cite this article (links to download the citations from this article in formats compatible with various reference manager tools)
Temporal selectivity declines in the aging human auditory cortex
eLife 9:e55300.
https://doi.org/10.7554/eLife.55300


