Parallel CRISPR-Cas9 screens clarify impacts of p53 on screen performance
- Wellcome/Cancer Research UK Gurdon Institute, University of Cambridge, United Kingdom
Figures
Figure 1 with 1 supplement
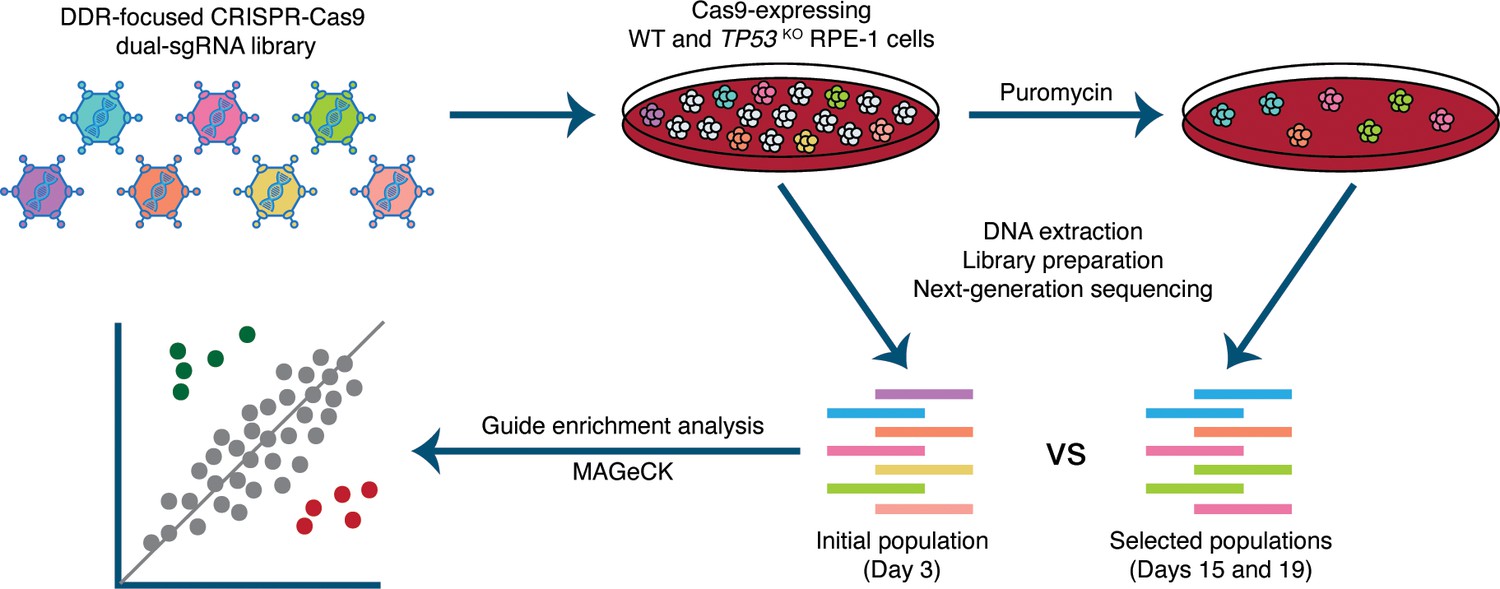
Experimental set-up of parallel CRISPR-Cas9 screens in wild-type (WT) and TP53 knockout(TP53KO) RPE-1 cells.
Cells were infected at a low multiplicity of infection (MOI=0.3). An initial sample was harvested 48 hours after infection. Subsequently, transduced cells were selected with puromycin and harvested at days 15 and 19. Guide RNA (gRNA) representations were evaluated by extraction of genomic DNA from surviving cells, PCR amplification of barcodes, and next-generation sequencing. MAGeCK (Li et al., 2014) was used to determine the relative depletion and enrichment of genes in later samples compared to the 48-hour samples.
Figure 1—figure supplement 1
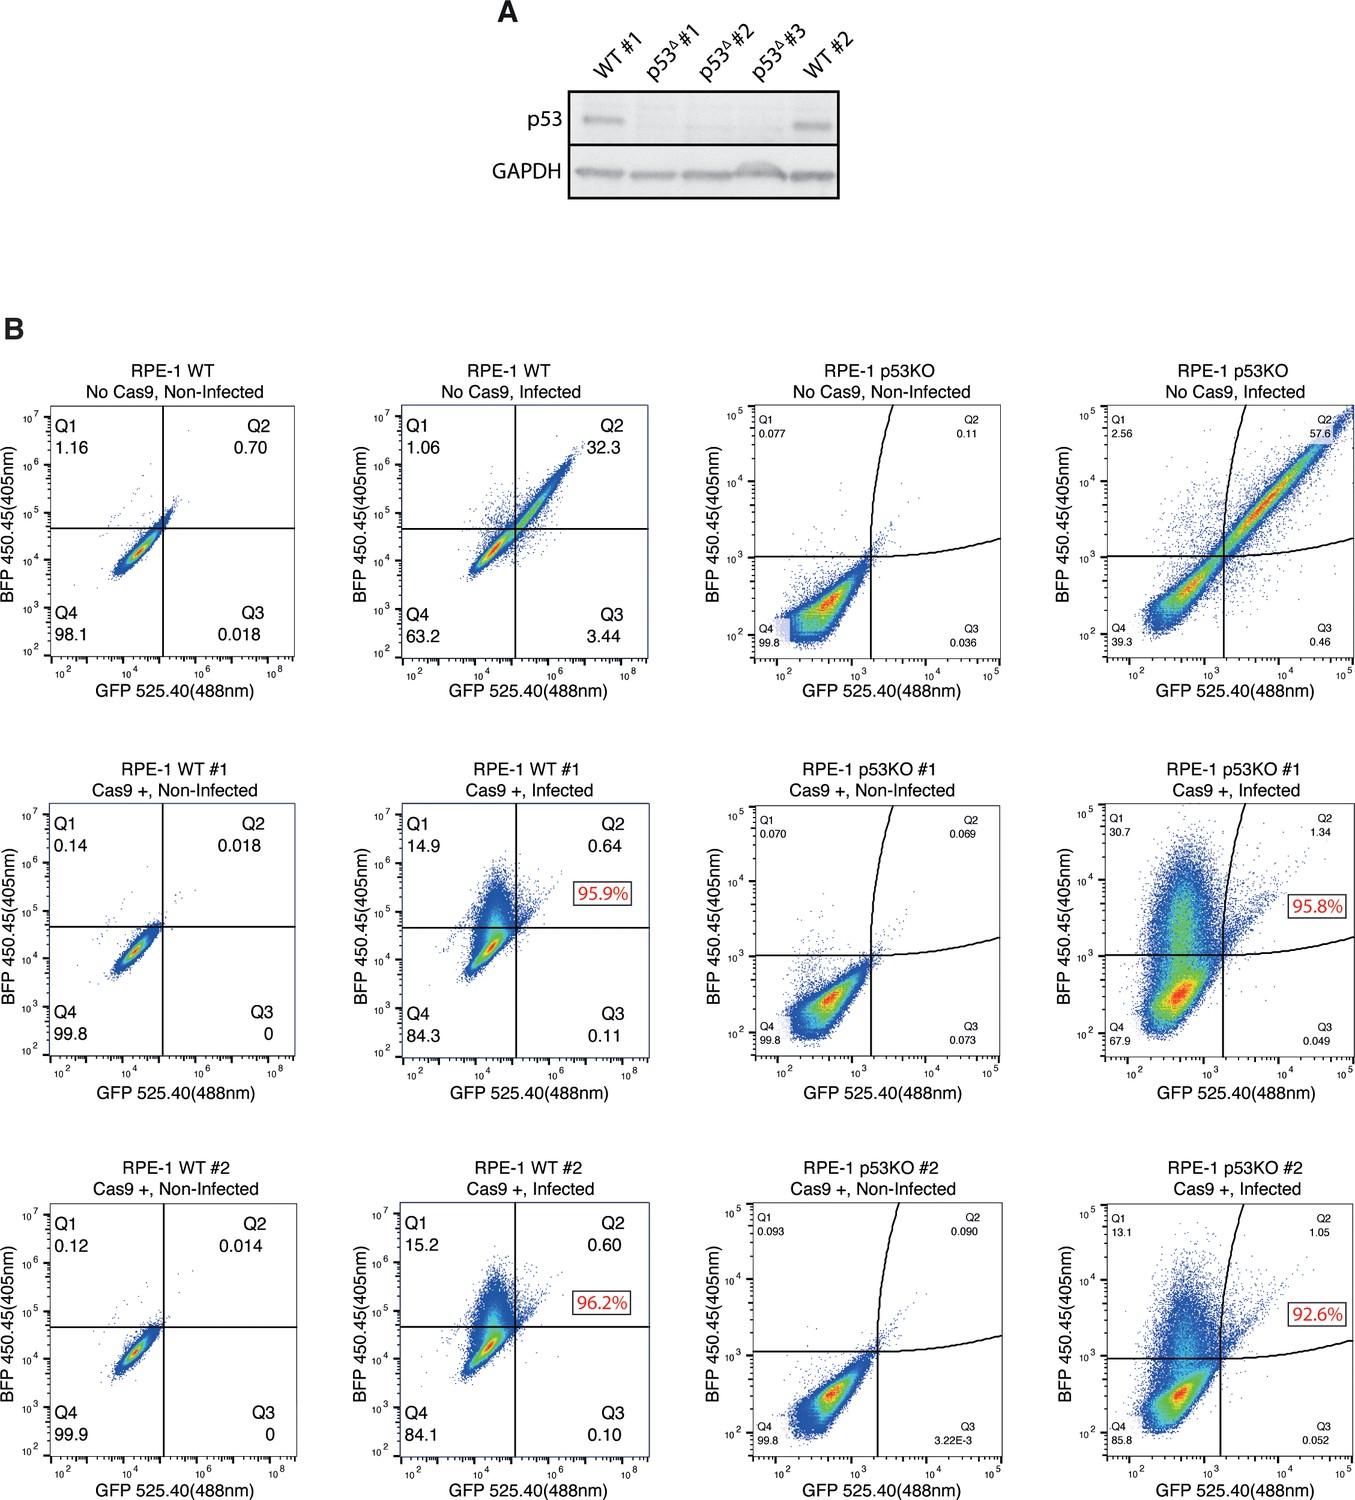
Validation of RPE-1 clones used in the screens.
(A) Western Blot of p53 and GAPDH with the RPE-1 wild-type and TP53KO clones used in the screens. (B) Cas9 editing efficiency assayed by FACS. Non-infected samples were used for gating purposes. Cells with no Cas9 expression were used as negative controls. Editing efficiency of Cas9-expressing clones was calculated by comparing the percentage of BFP+ (i.e. edited) cells to the GFP/BFP+ (i.e. total transduced population) using FlowJo. Editing efficiencies of Cas9-expressing clones are displayed in red.
Figure 2 with 2 supplements
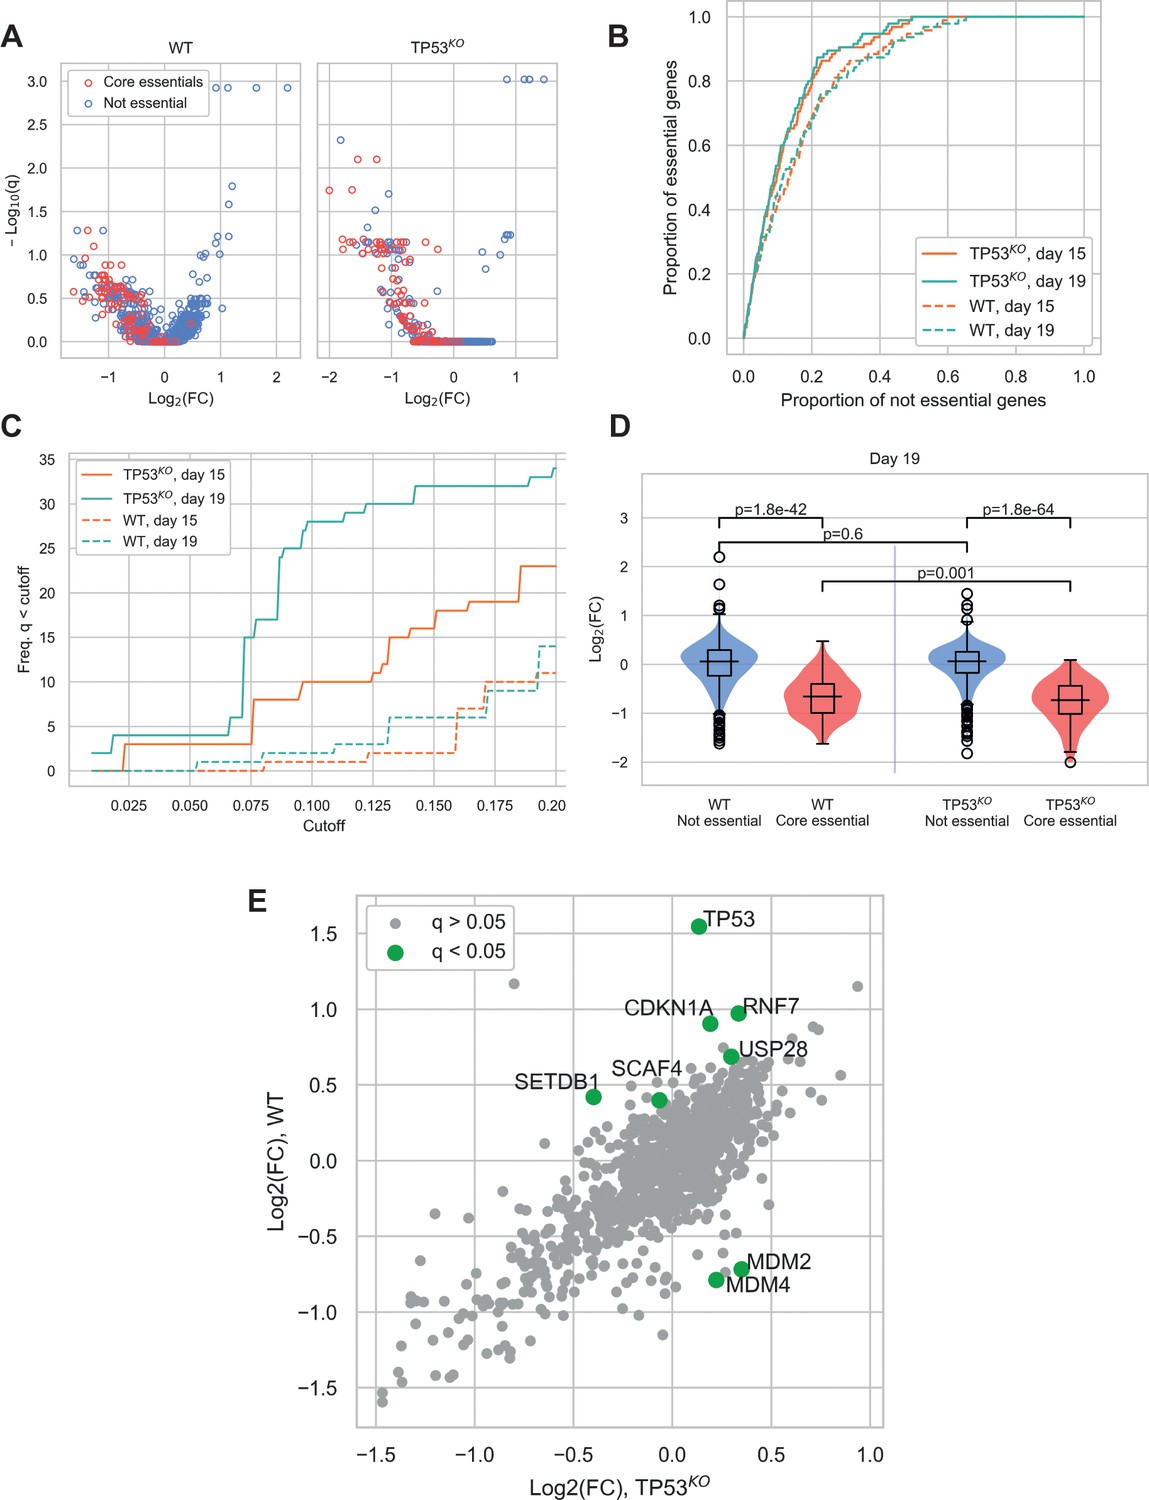
Comparison of CRISPR-Cas9 screens in wild-type (WT) and TP53 knockout(TP53KO) RPE-1 cells demonstrates the impact of p53 on screen performance.
(A) Mean log2 fold change (LFC) in guide abundance per gene, and significance of this change, from day 3 to day 19 of the experiment. The q-values are false discovery rates (FDR) given by MAGeCK. (B) Receiver operating characteristic curves of MAGeCK p-values, discriminating between genes classified as core essential by Hart et al. (2017) and other genes. (C) Number of core essential genes with q-value less than the range of values given on the x-axis. (D) Mean LFC of guides targeting core essential and not core essential genes (Day 19 samples). Paired t-tests were used to test core essential or not essential genes between cell lines, unpaired t-tests were used within a cell line. (E) Mean LFC of guides targeting core essential and not core essential genes (Day 19 samples).
Figure 2—figure supplement 1
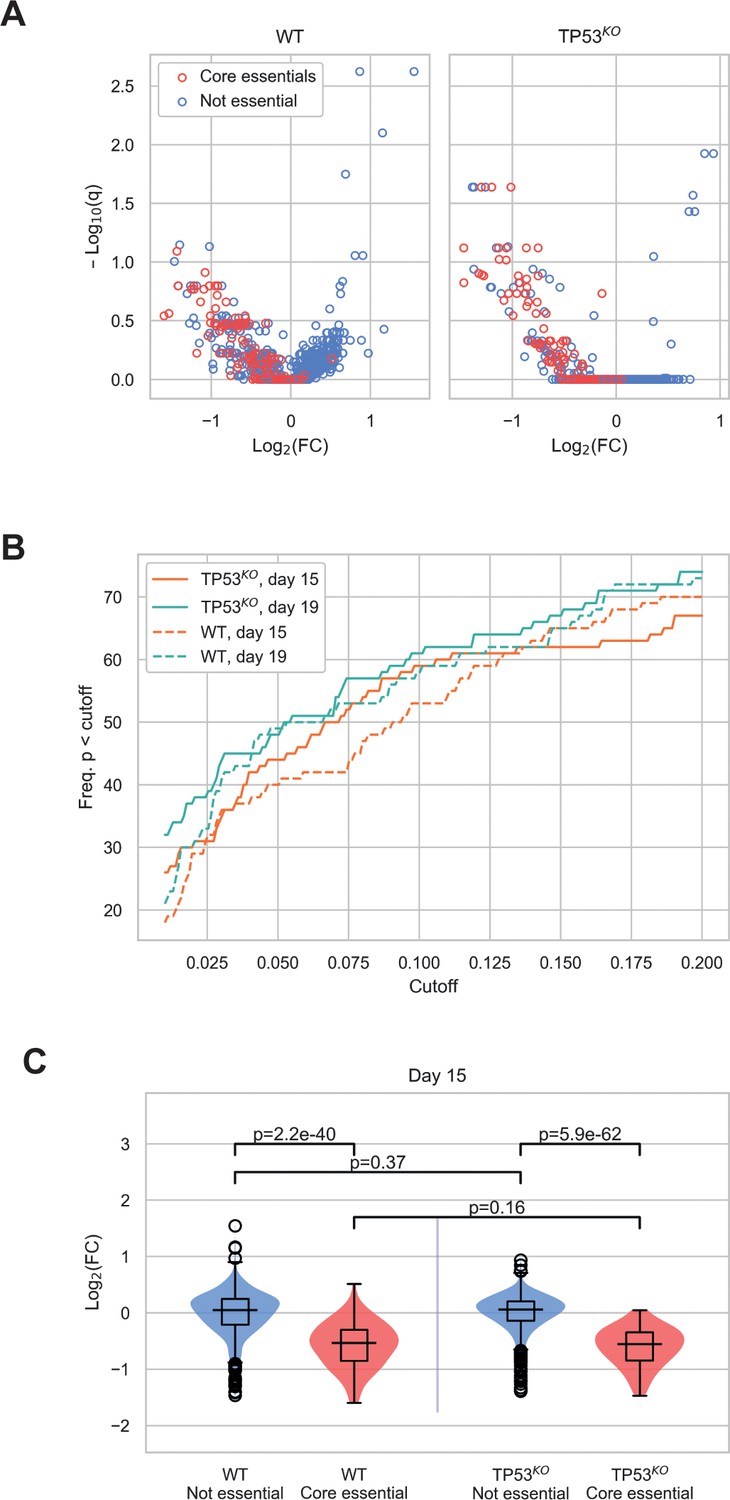
Additional comparisons between wild-type and TP53KO CRISPR-Cas9 screens.
(A) Mean log2 fold change (LFC) in guide abundance per gene, and significance of this change, from day 3 to day 15 of the experiment. The q-values were calculated using MAGeCK. (B) Number of core essential genes with p-value less than the range of values given on the x-axis. (C) Mean LFC of guides targeting core essential and not core essential genes (day 15 samples). Paired t-tests were used to test core essential or not essential genes between cell lines, unpaired t-tests were used within a cell line.
Figure 2—figure supplement 2
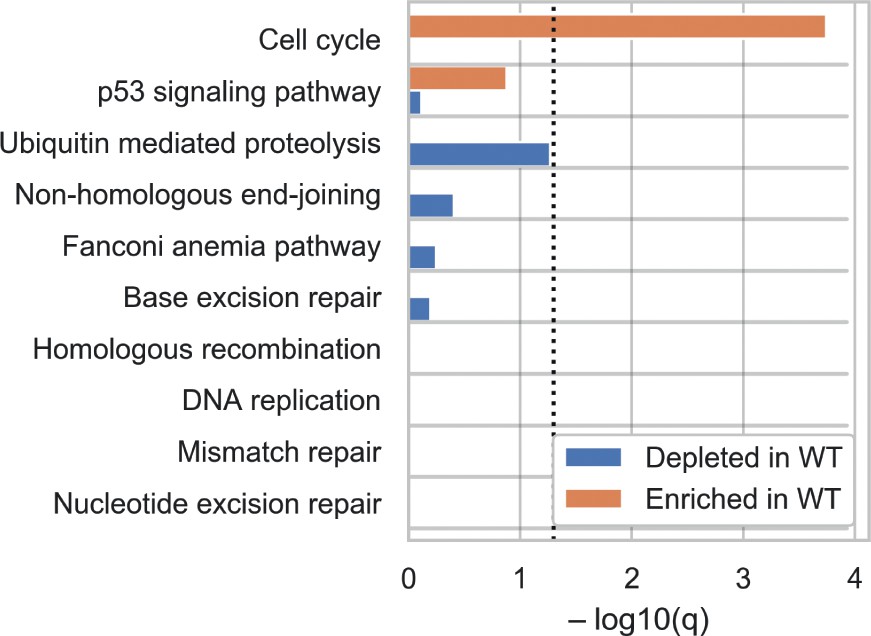
Biological pathway analysis identifies cell-cycle and p53 signalling as the pathways showing enrichment in the wild-type (WT) compared to TP53KO screens.
Genes were categorised according to KEGG pathways and significance of enrichment and depletion values were determined by Fisher’s exact test.
Figure 3 with 2 supplements
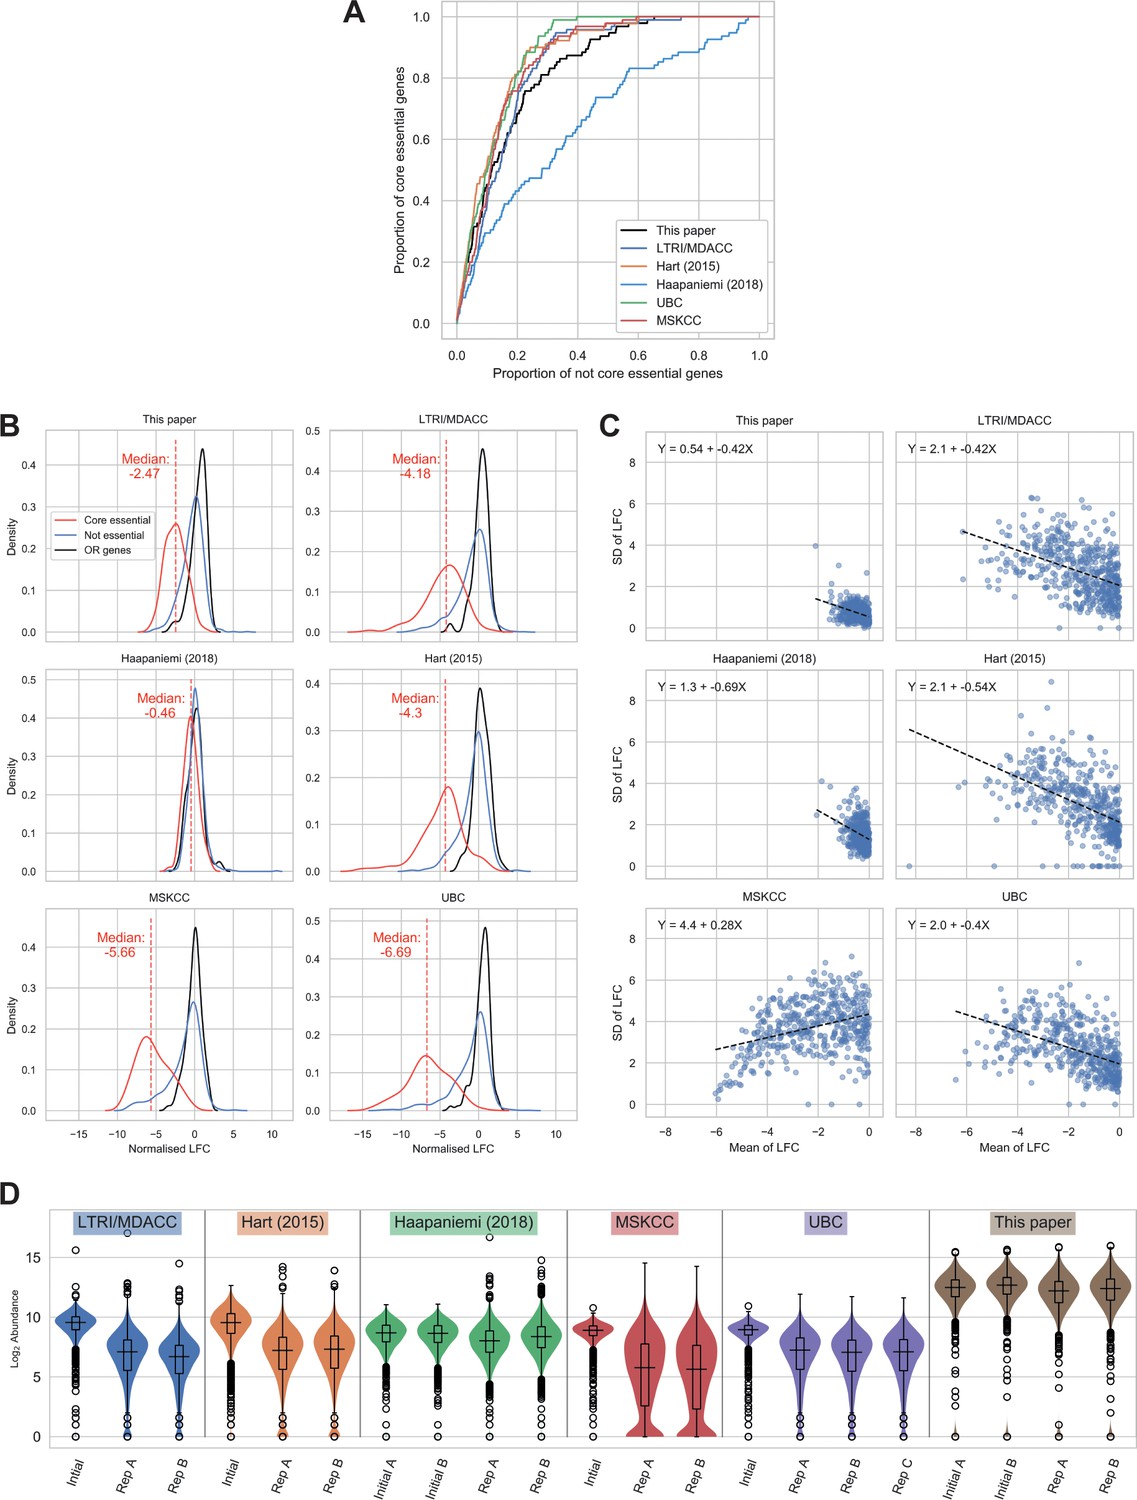
Comparison of wild-type (WT) RPE-1 CRISPR-Cas9 screens highlights important factors in screen design.
(A) Receiver operating characteristic curves of MAGeCK p-values, discriminating between core essential and not core essential genes in TP53 WT cells. (B) Distribution of normalised log2 fold changes (LFCs). The solid lines give kernel density estimates for each distribution, and the dashed line shows the median LFC of the core essential genes. (C) Mean LFC vs standard deviation (SD) per gene for genes with mean LFC < 0. As the SD is expected to scale with mean LFC, and the LFC distributions vary between experiments, ordinary least squares regressions were performed to determine the size of the variance across the range of LFCs. The dashed line shows the line of best fit and the equation for each line is given in the chart. (D) Log2 guide abundance across all screens. Box plots give median and quartile values.
Figure 3—figure supplement 1

Reduced variance at higher Log Fold Change is attributable to decreased sequencing reads across multiple guides.
Mean and standard deviation (SD) of LFC per gene in the MSKCC data are shown. Points are coloured by the number of guides targeting a gene that have abundance equal to zero in both end point replicates.
Figure 3—figure supplement 2

The effect on detection of core essential genes at different sequencing read depths in our screens.
The read abundances of our screens were resampled to different levels and analysed with MAGeCK. Cumulative proportion of core essential genes with depletion -log10(p) greater than values given on the y-axis. The mean proportions across 5-replicate sampling are given.
Author response image 1
Additional files
-
Supplementary file 1
CRISPR library.
A comma separated values table (CSV). Rows contain information about CRISPR plasmids used in screens performed for this paper. For each plasmid, columns give the barcode DNA identifying the plasmid, guide name, symbol of the targeted gene, and the two genomic sequences targeted by the guide RNAs expressed by the plasmid.
- https://cdn.elifesciences.org/articles/55325/elife-55325-supp1-v1.csv
-
Supplementary file 2
Guide Abundances.
A tab separated values table (TSV). Numerical values give the number of reads that mapped to barcode sequences given in Supplementary file 1 after sequencing DNA. Column headers give information about the samples, the first two characters indicate TP53 wild-type (WT) or knock out (KO), and the last part of the header specifies the number of days after which the sample was harvested.
- https://cdn.elifesciences.org/articles/55325/elife-55325-supp2-v1.tsv
-
Supplementary file 3
MAGeCK Statistics.
Results of all analyses performed with MAGeCK. An Excel workbook with results divided by screen. The worksheet names match the screen names used in the paper. Columns in each worksheet give the log2 fold change (‘lfc’), false discovery rate (‘fdr’), -log10 FDR (‘fdr_log10’), p-value for enrichment (‘pos_p’) and p-value for depletion (‘neg_p’).
- https://cdn.elifesciences.org/articles/55325/elife-55325-supp3-v1.xlsx
-
Supplementary file 4
Enrichment of KEGG and GO Terms.
A CSV that gives results of Fisher's exact test for enrichment of selected GO and KEGG terms. Each row gives the results for a particular term. Genes that are present in the CRISPR library that match terms are listed in the ‘intersection’ column. Significance statistics for genes enriched or depleted in the screen are presented.
- https://cdn.elifesciences.org/articles/55325/elife-55325-supp4-v1.csv
-
Supplementary file 5
Data Sources.
A TSV that maps the screen names used in this publication to the identity of the original performers of the screen.
- https://cdn.elifesciences.org/articles/55325/elife-55325-supp5-v1.txt
-
Transparent reporting form
- https://cdn.elifesciences.org/articles/55325/elife-55325-transrepform-v1.docx
Download links
A two-part list of links to download the article, or parts of the article, in various formats.
Downloads (link to download the article as PDF)
Open citations (links to open the citations from this article in various online reference manager services)
Cite this article (links to download the citations from this article in formats compatible with various reference manager tools)
Parallel CRISPR-Cas9 screens clarify impacts of p53 on screen performance
eLife 9:e55325.
https://doi.org/10.7554/eLife.55325


