Hippocampal and cortical mechanisms at retrieval explain variability in episodic remembering in older adults
- Department of Psychology, Stanford University, United States
- Department of Neurology & Neurological Sciences, Stanford University, United States
- Department of Radiology & Radiological Sciences, Stanford University, United States
Figures
Figure 1

Experimental paradigm.
Concurrent with fMRI, participants intentionally encoded word-picture pairs and completed an associative cued recall test. At test, they were presented with studied words intermixed with novel words, and instructed to recall the associate paired with each word, if old. Participants responded ‘Face’ or ‘Place’ if they could recollect the associated image; ‘Old’ if they recognized the word but could not recollect the associate; ‘New’ if they believed the word was novel. A post-scan cued recall test (not shown, visually identical to the ‘Test Phase’) further probed memory for the specific associate paired with each studied word (see Materials and methods).
Figure 2
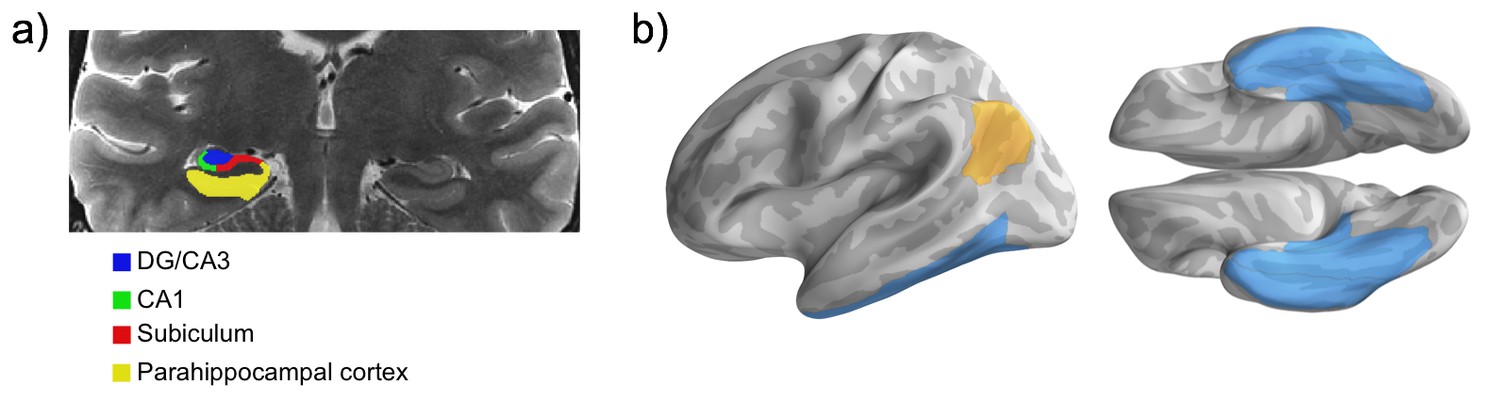
Regions of interest.
(a) Sample MTL subfield demarcations. The whole hippocampus ROI reflects the summation of all subfields (delineated only in the hippocampal body, shown), as well as the hippocampal head and tail (not pictured). (b) Parahippocampal cortex combined with fusiform gyrus and inferior temporal cortex forms the ventral temporal cortex ROI. Ventral temporal cortex (blue) and angular gyrus (gold) masks projected on the fsaverage surface.
Figure 3
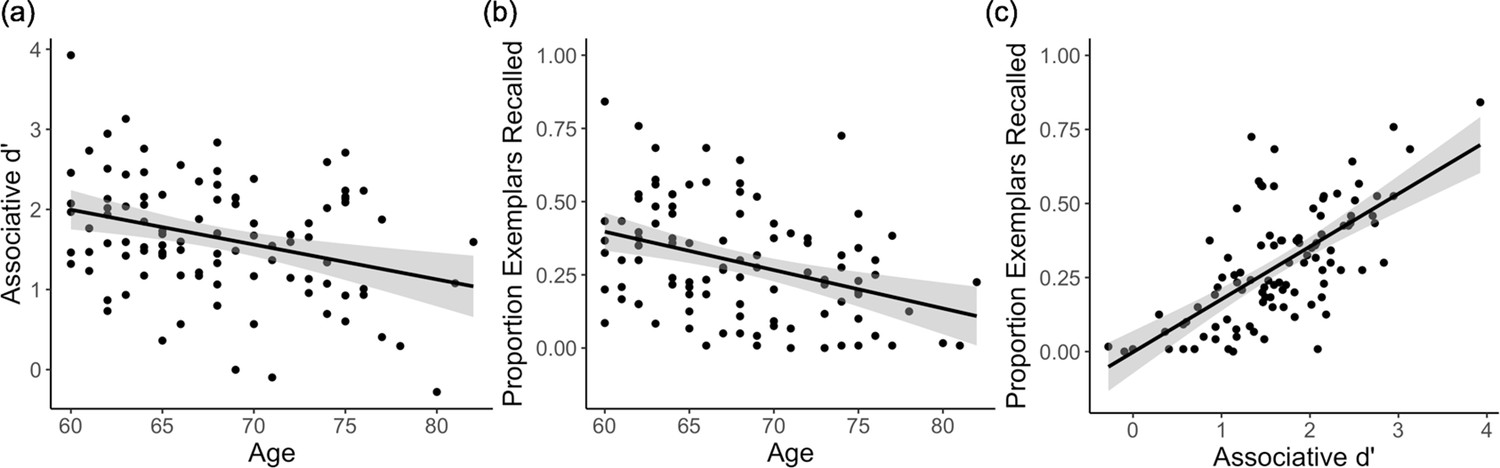
Associative memory behavioural results.
(a) In-scanner associative d’ and (b) post-scan exemplar-specific associative recall decline with age. (c) Associative d’ is strongly correlated with post-scan exemplar-specific associative recall, controlling for the effect of age. Each data point represents a participant; plots show linear model predictions (black line) and 95% confidence intervals (shaded area).
-
Figure 3—source data 1
Demographic information and behavioural data depicted in Figure 3a–c.
- https://cdn.elifesciences.org/articles/55335/elife-55335-fig3-data1-v1.csv
Figure 4 with 6 supplements
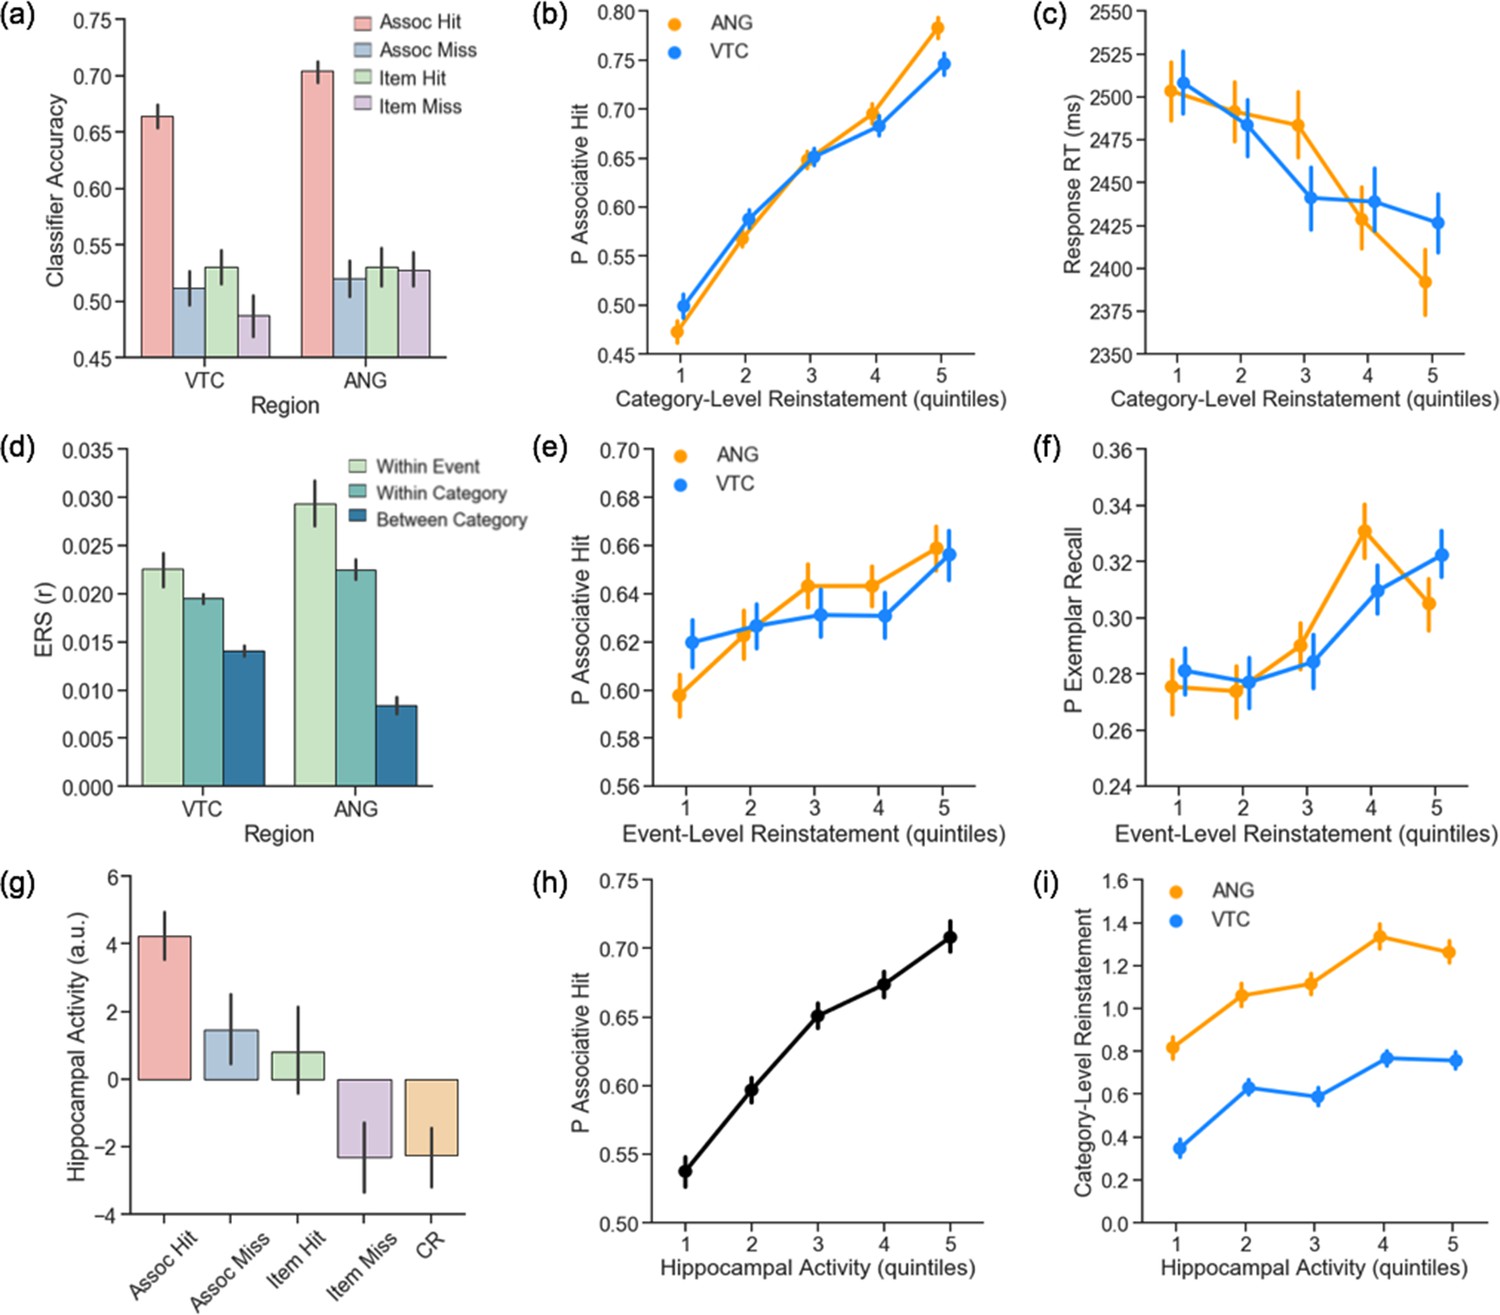
Cortical and hippocampal metrics of pattern completion during retrieval.
(a) Classifier accuracy is above chance in VTC and ANG during successful, but not unsuccessful, associative retrieval. (b) Trial-wise category-level reinstatement strength (logits) in VTC and ANG is related to an increased probability of an associative hit and (c) faster decision RT on associative hit trials. (d) Event-level reinstatement (within-event ERS > within-category ERS) is observed during associative hits in VTC and ANG. (e) Trial-wise event-level reinstatement (within-event ERS) significantly varies with the probability of an associative hit and (f) exemplar-specific hit. (g) Hippocampal activity shows a graded response across retrieval conditions. (h) Trial-wise hippocampal activity is related to an increased probability of an associative hit and (i) greater category-level reinstatement strength (logits) in VTC and ANG. For visualization, data for each participant are binned into quintiles based on category-level reinstatement strength (b,c), event-level reinstatement strength (e,f) and hippocampal activity (h,i). Statistics were conducted on trial-wise data, z-scored within participant. Error bars represent standard error of the mean. VTC = ventral temporal cortex; ANG = angular gyrus; RT = reaction time; ERS = Encoding Retrieval Similarity.
-
Figure 4—source data 1
Classifier accuracy in VTC and ANG by trial type, depicted in Figure 4a.
- https://cdn.elifesciences.org/articles/55335/elife-55335-fig4-data1-v1.csv
-
Figure 4—source data 2
Trial-wise cortical reinstatement (logits), hippocampal activity, and behavioural data used to generate Figure 4b–c,h–i and Figure 4—figure supplements 3, 5 and 6.
- https://cdn.elifesciences.org/articles/55335/elife-55335-fig4-data2-v1.csv
-
Figure 4—source data 3
Encoding-retrieval similarity in VTC and ANG by trial type, depicted in Figure 4d and Figure 4—figure supplement 2a.
- https://cdn.elifesciences.org/articles/55335/elife-55335-fig4-data3-v1.csv
-
Figure 4—source data 4
Trial-wise encoding-retrieval similarity, hippocampal activity, and behavioural data used to generate Figure 4e–f and Figure 4—figure supplements 2b–c and 4.
- https://cdn.elifesciences.org/articles/55335/elife-55335-fig4-data4-v1.csv
-
Figure 4—source data 5
Hippocampal activity by trial type, depicted in Figure 4g.
- https://cdn.elifesciences.org/articles/55335/elife-55335-fig4-data5-v1.csv
Figure 4—figure supplement 1

Time course of cortical reinstatement during associative hits.
Category-level reinstatement effects emerge at approximately 4–6 s post-stimulus onset in both VTC and ANG. Error bars represent standard error of the mean. VTC = ventral temporal cortex; ANG = angular gyrus.
Figure 4—figure supplement 2
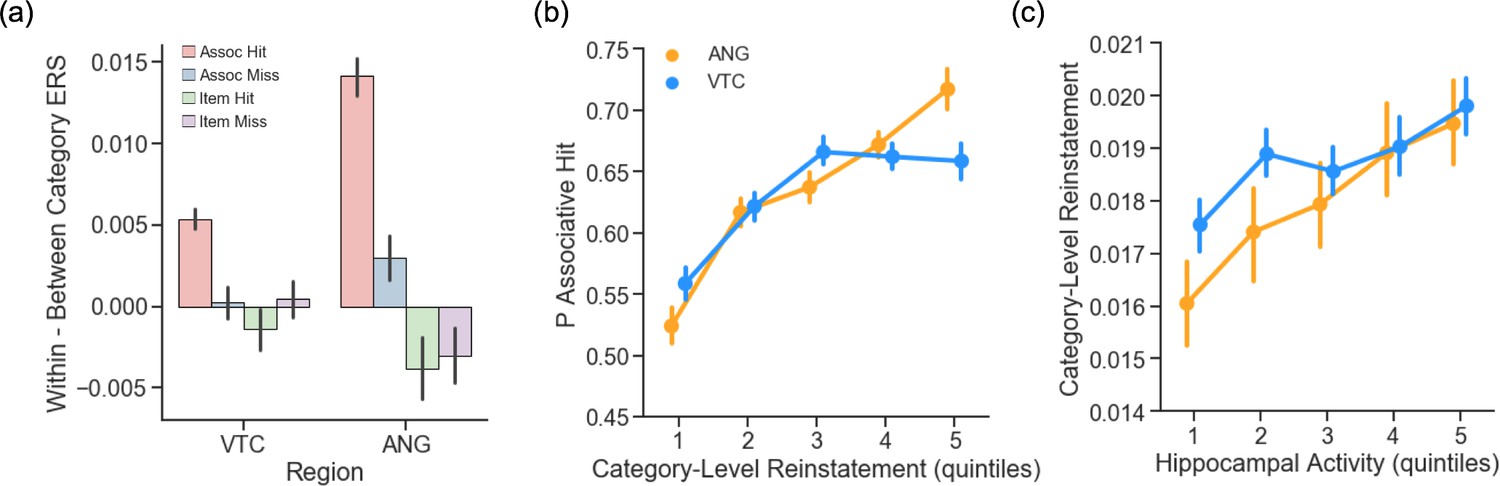
Replication of category-level reinstatement effects computed via encoding-retrieval similarity.
(a) Within-category ERS (Pearson r) is greater than between-category ERS during successful associative retrieval (VTC: t(99) = 8.84, p < 10−14; ANG: t(99) = 12.15, p < 10−16), but not unsuccessful associative retrieval (associative misses: VTC: p = 0.97; ANG: p = 0.19; item only hits: VTC: t(51) = −1.22, p = 0.23; ANG: t(51) = −1.92, p = 0.06; item misses: VTC: p = 0.69; ANG: t(83) = −1.89, p = 0.06). (b) Trial-wise within-category reinstatement strength in VTC and ANG is related to the probability of an associative hit (VTC: χ2(1) = 18.91, p < 10−5; ANG: χ2(1) = 53.05, p < 10−13). (c) Trial-wise hippocampal activity is related to within-category reinstatement strength in VTC (χ2(1) = 8.65, p = 0.003) and ANG (χ2(1) = 9.22, p = 0.002). For visualization, data for each participant are binned into quintiles based on (b) ERS and (c) hippocampal activity. Statistics were conducted on trial-wise data, z-scored within participant. Error bars represent standard error of the mean. ERS = Encoding Retrieval Similarity. VTC = ventral temporal cortex; ANG = angular gyrus.
Figure 4—figure supplement 3
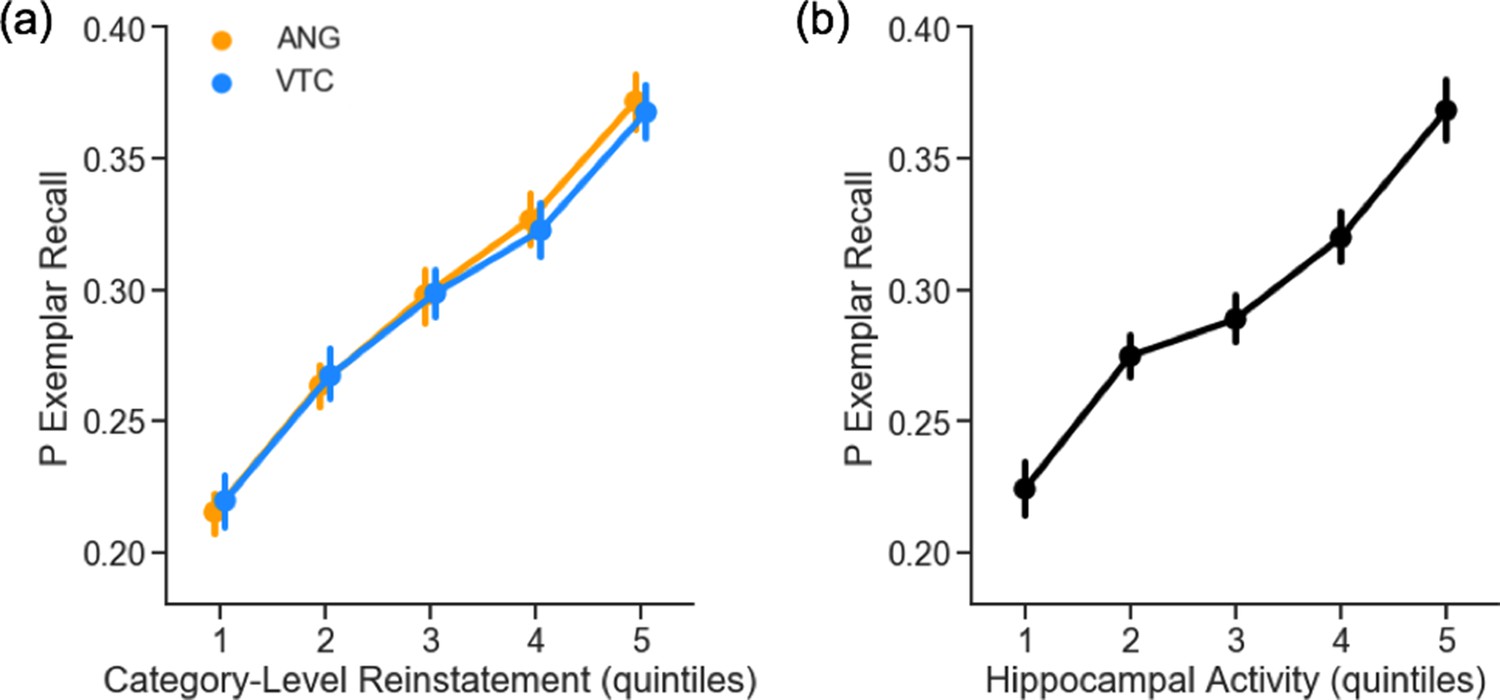
In-scanner pattern completion metrics are related to post-scan exemplar-specific recall.
Trial-wise estimates of (a) category-level reinstatement (logits) and (b) hippocampal activity are related to an increased probability of exemplar-specific recall in the post-scan memory test. For visualization, data for each participant are binned into quintiles based on (a) category-level reinstatement or (b) hippocampal activity. Statistics were conducted on trial-wise data, z-scored within participant. Error bars represent standard error of the mean. VTC = ventral temporal cortex; ANG = angular gyrus.
Figure 4—figure supplement 4
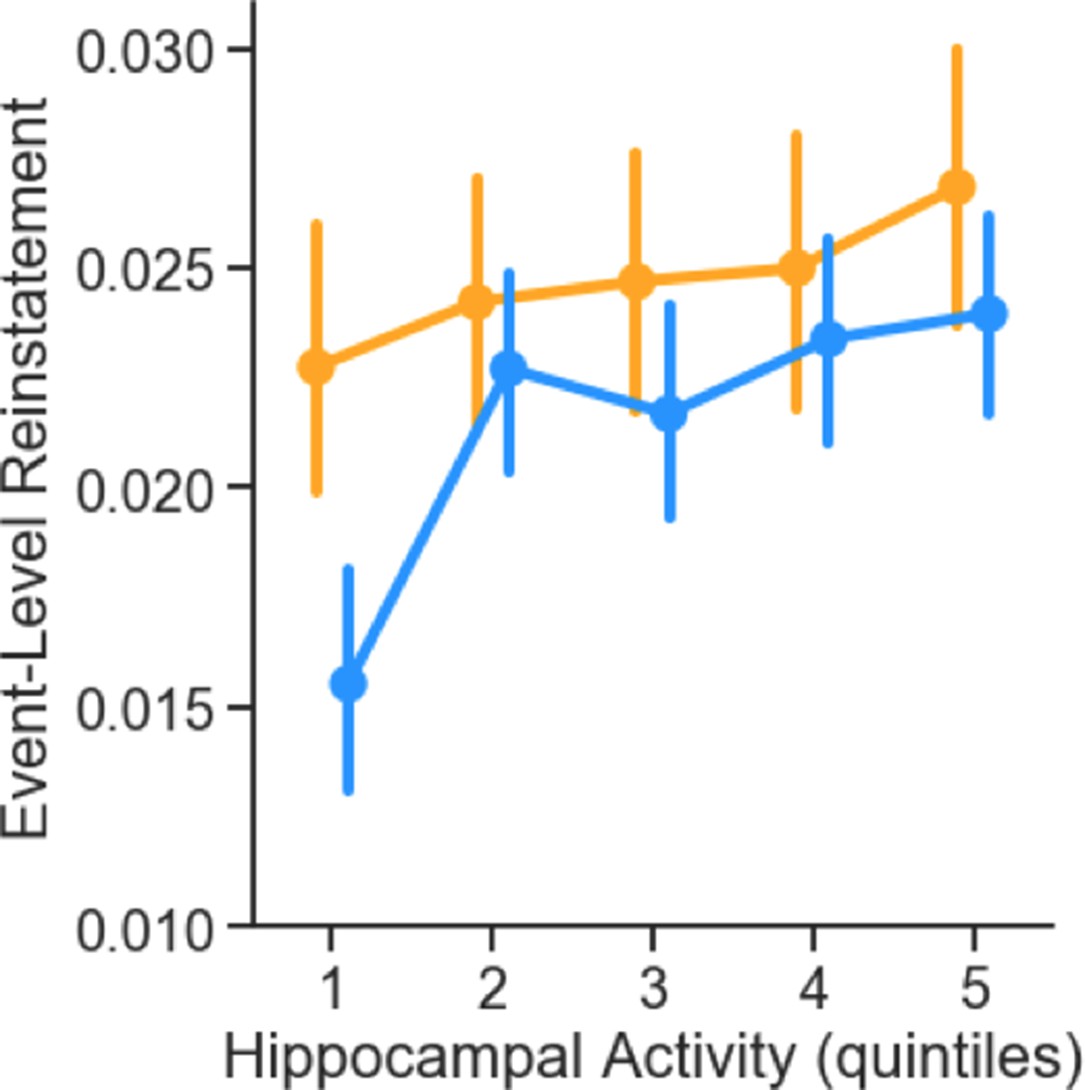
Trial-wise hippocampal activity is related to within-event ERS in VTC.
For visualization, data for each participant are binned into quintiles based on hippocampal activity. Statistics were conducted on trial-wise data, z-scored within participant. Error bars represent standard error of the mean.
VTC = ventral temporal cortex; ANG = angular gyrus. ERS = Encoding Retrieval Similarity.
Figure 4—figure supplement 5
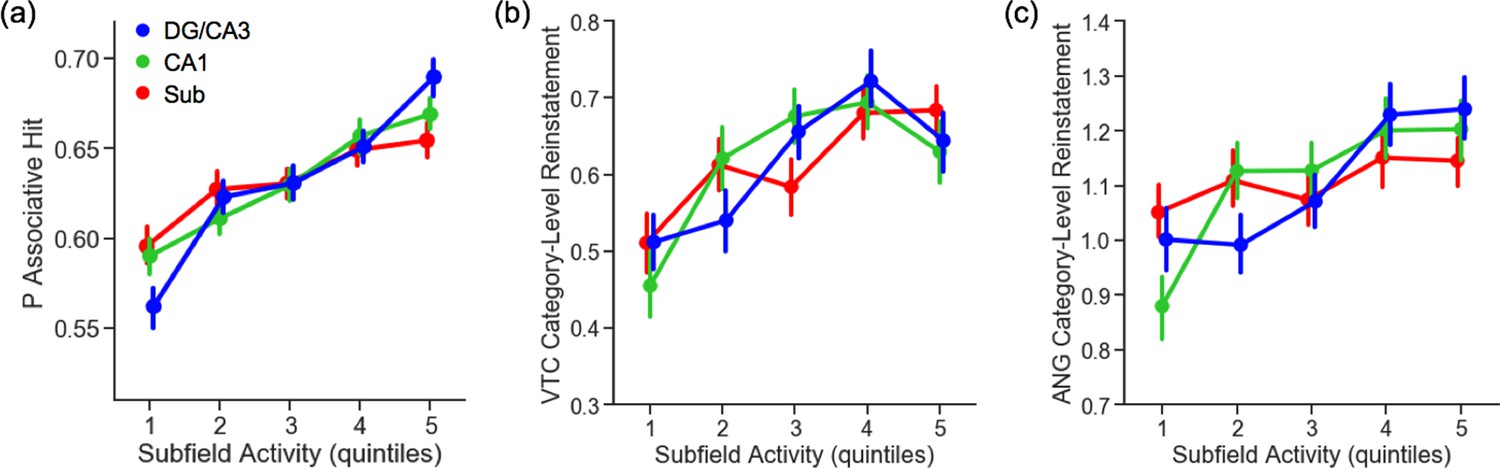
Hippocampal subfield activity during associative retrieval.
(a) Retrieval activity in DG/CA3 (χ2(1) = 37.03, p < 10−9), CA1 (χ2(1) = 23.16, p < 10−6), and Sub (χ2(1) = 15.29, p < 10−5) is a significant predictor of associative retrieval success. This relationship varies in strength across subfields (χ2(1) = 12.99, p < 0.001), with DG/CA3 activity being a significantly stronger predictor than CA1 (z = 2.31, p < 0.05) or Sub (z = 3.55, p < 0.001), whereas CA1 and Sub do not significantly differ (z = 1.24, p > 0.21). (b) Category-level reinstatement strength in VTC is related to activity in all subfields (DG/CA3: χ2(1) = 12.25, p < 0.001; CA1: χ2(1) = 15.40, p < 10−5; Sub: χ2(1) = 13.38, p < 0.001; interaction: p = 0.703). Subfield activity is no longer a significant predictor of VTC category-level reinstatement when considering associative hit trials only (DG/CA3: p = 0.748; CA1: p = 0.175; Sub: p = 0.504). (c) Category-level reinstatement strength in ANG is related to activity in DG/CA3 (χ2(1) = 7.89, p = 0.005) and CA1 (χ2(1) = 10.49, p = 0.001), but not Sub (p = 0.458); DG/CA3 and CA1 effects do not differ (p = 0.988). When considering associative hit trials, only DG/CA3 remains marginally significant (χ2(1) = 2.86, p = 0.091; CA1: p = 0.437; Sub: p = 0.572). For visualization, data for each participant are binned into quintiles based on hippocampal subfield activity. Statistics were conducted on trial-wise data, z-scored within participant. Error bars represent standard error of the mean. VTC = ventral temporal cortex; ANG = angular gyrus; DG = Dentate Gyrus; Sub = Subiculum.
Figure 4—figure supplement 6
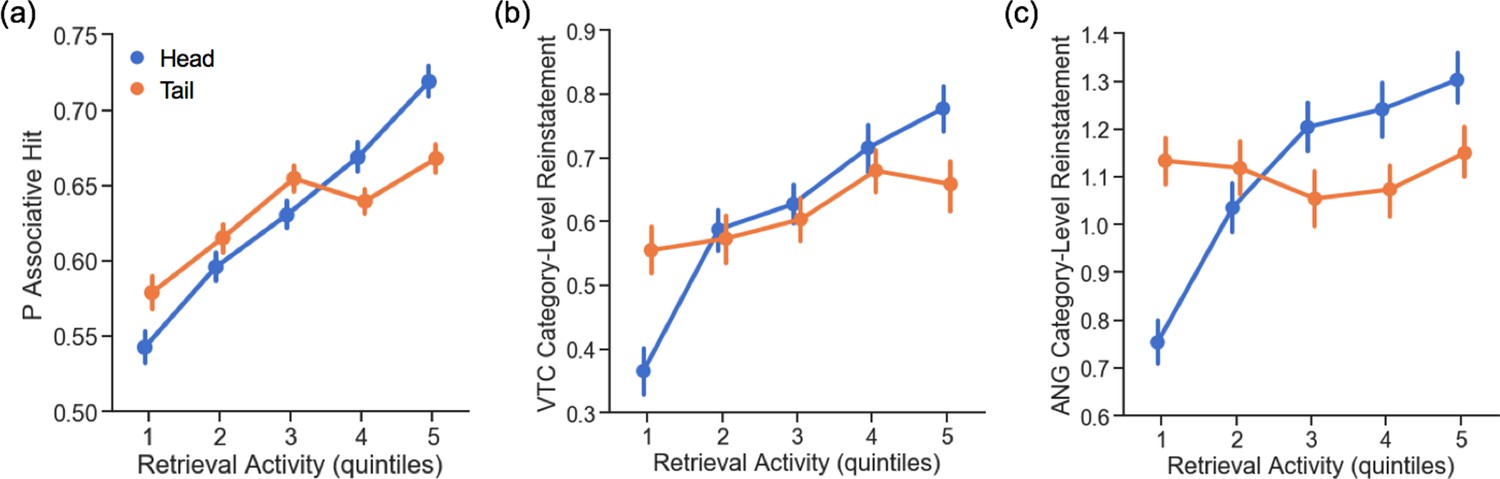
Hippocampal head and tail activity during associative retrieval.
(a) The relationship between retrieval activity and associative retrieval success varies by subregion (χ2(1) = 31.44, p < 10−8), being stronger in the hippocampal head (χ2(1) = 65.76, p < 10−16) than hippocampal tail (χ2(1) = 24.08, p < 10−7). (b–c) The relationship between retrieval activity and category-level reinstatement strength in VTC and ANG varies by subregion (VTC: χ2(1) = 14.86, p < 0.001; ANG: χ2(1) = 24.77, p < 10−8), reflecting a stronger relationship between univariate activity and reinstatement strength in the hippocampal head (VTC: χ2(1) = 44.97, p < 10−11; ANG: χ2(1) = 46.76, p < 10−12) than tail (VTC: χ2(1) = 44.97, p = 0.021; ANG: p = 0.743). When considering associative hit trials only, only activity in the hippocampal head remains significant (VTC: χ2(1) = 11.70, p < 0.001; ANG: χ2(1) = 20.35, p < 10−6; tail: VTC: p = 0.762; ANG: p > 0.358). For visualization, data for each participant are binned into quintiles based on hippocampal subfield activity. Statistics were conducted on trial-wise data, z-scored within participant. Error bars represent standard error of the mean. VTC = ventral temporal cortex; ANG = angular gyrus.
Figure 5 with 5 supplements
Individual differences in pattern completion assays.
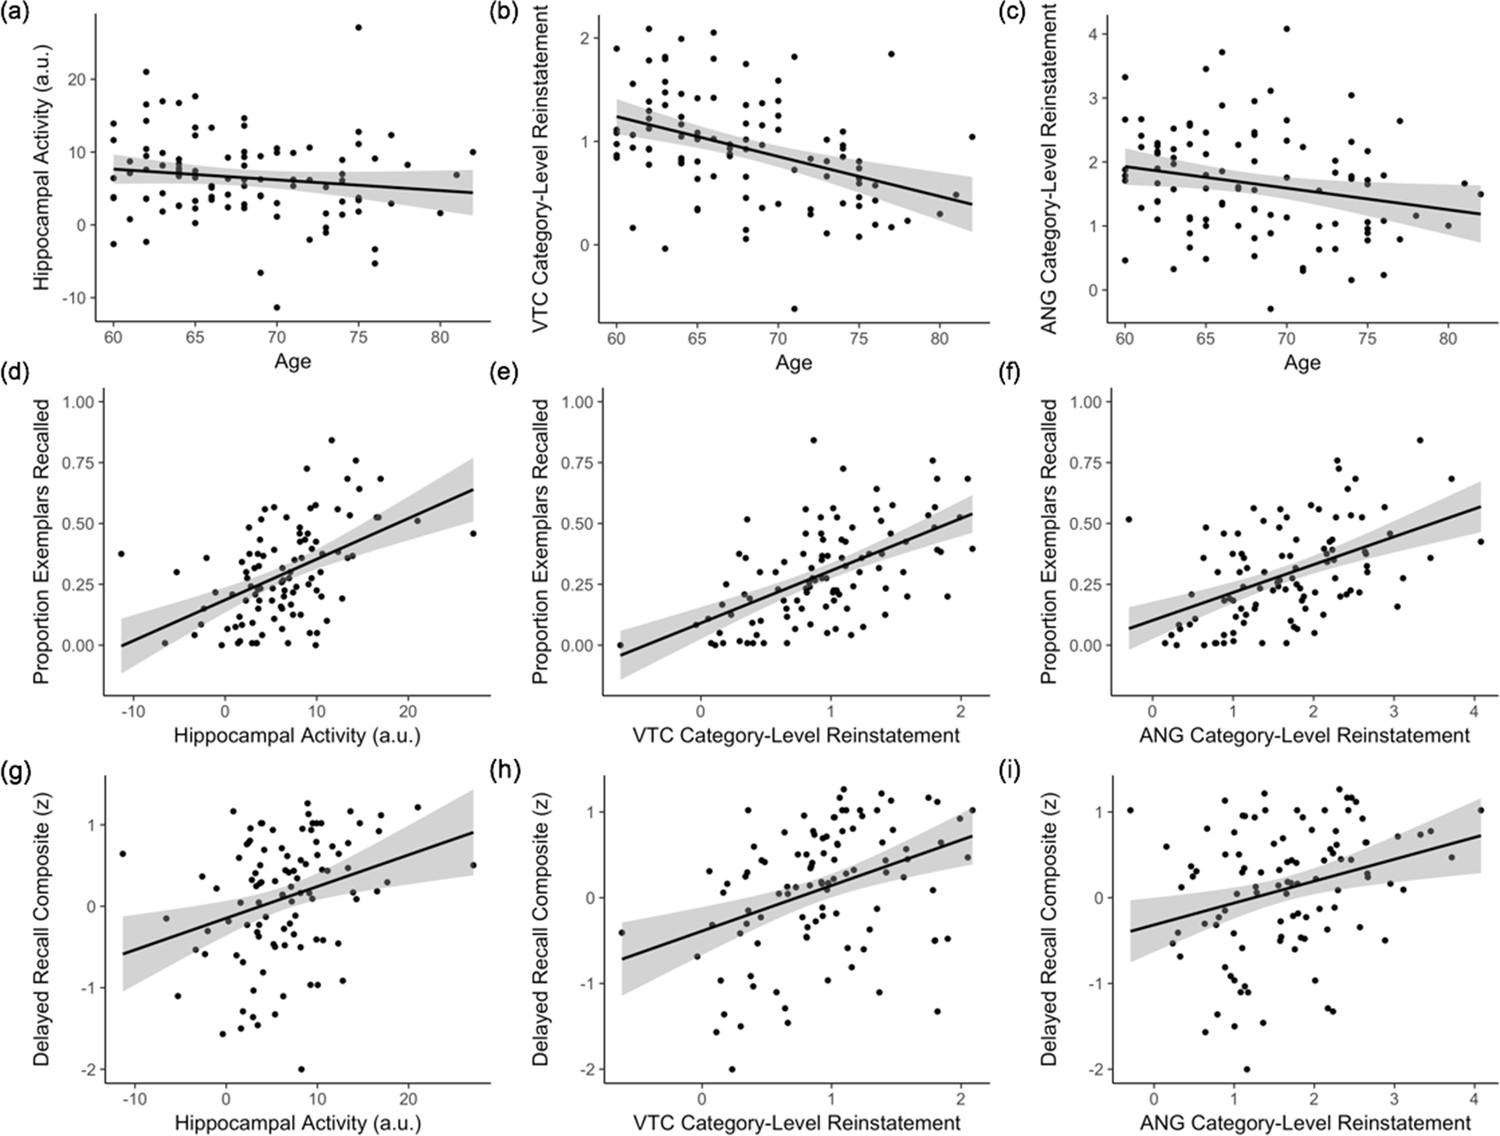
(a–c) Effects of age on hippocampal activity (associative hit – correct rejection) and category-level reinstatement strength (mean logits) in VTC and ANG during associative hits. (d–f) Independent of age, individual differences in hippocampal activity and category-level reinstatement strength in VTC and ANG during associative hits explain significant variance in exemplar-specific recall. (g–i) Independent of age, individual differences in hippocampal activity and VTC category-level reinstatement strength also explain significant variance in standardized delayed recall performance; the relation with ANG category-level reinstatement did not reach significance. Scatterplots reflect raw values for each measure. See Figure 5—figure supplement 1 for partial plots controlling for nuisance variables. Each point represents an individual participant. Plots also show linear model predictions (black line) and 95% confidence intervals (shaded area). VTC = ventral temporal cortex; ANG = angular gyrus.
-
Figure 5—source data 1
Behavioural and neural measures used in individual differences analyses, depicted in Figure 5a–i and Figure 5—figure supplements 1–5.
- https://cdn.elifesciences.org/articles/55335/elife-55335-fig5-data1-v1.csv
Figure 5—figure supplement 1
Partial plots of individual differences in pattern completion assays.
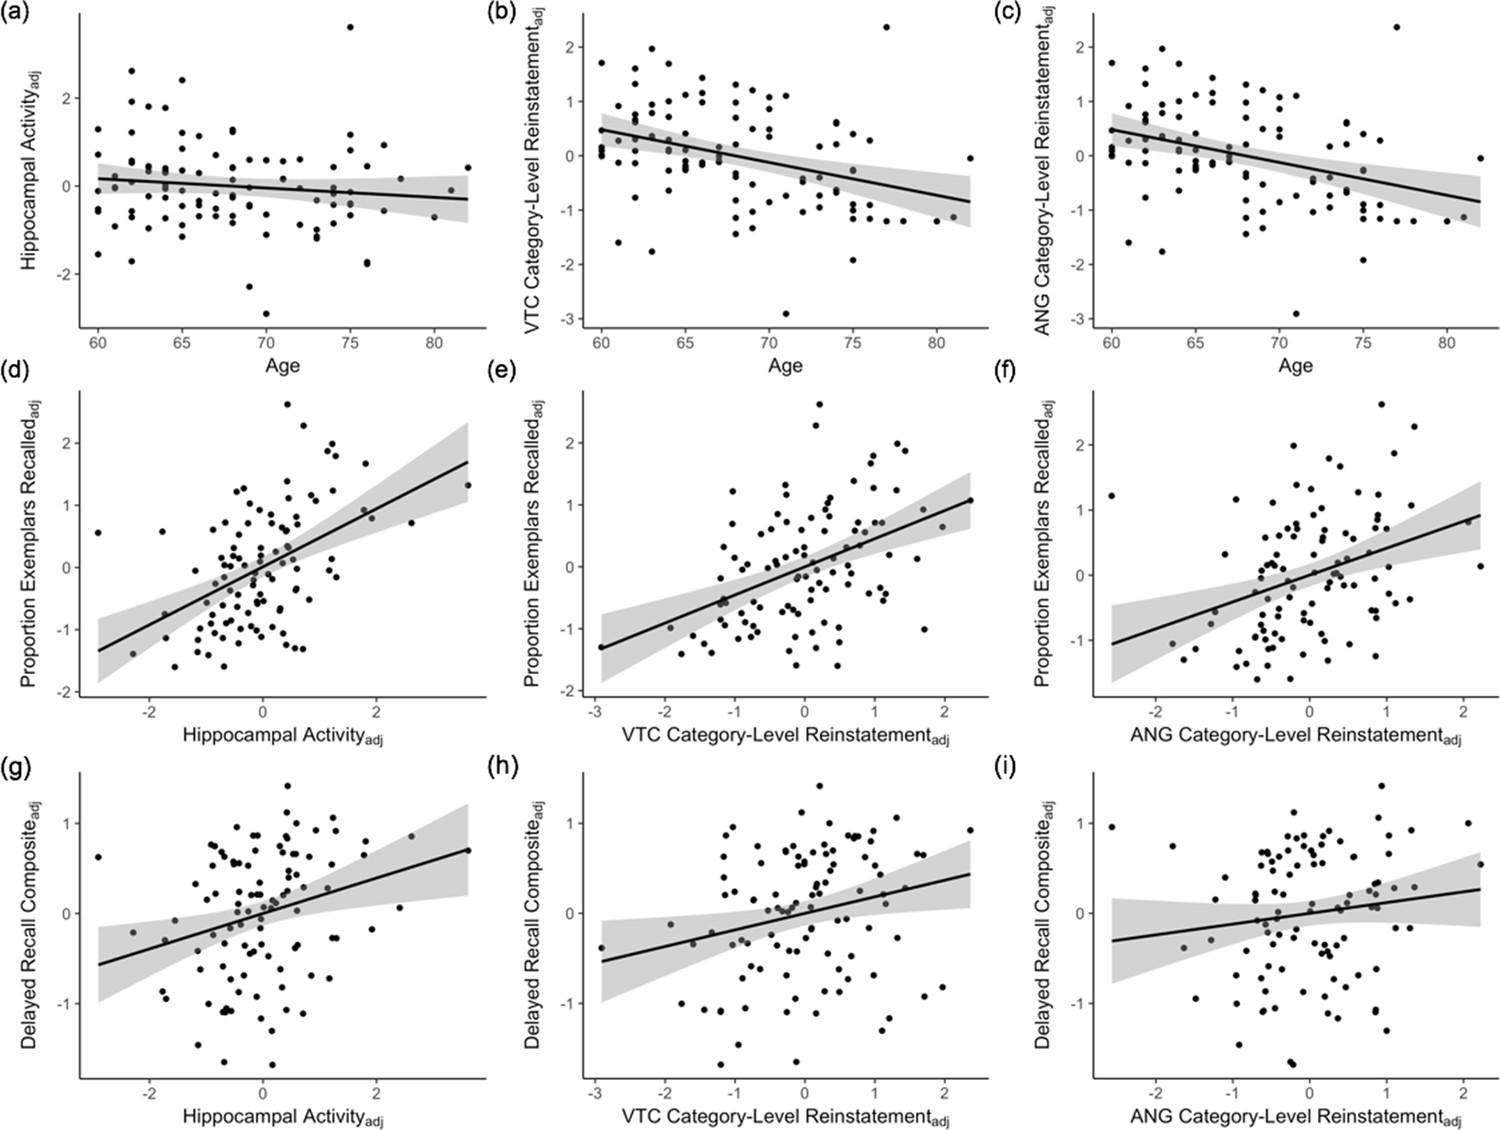
(a–c) Effects of age on hippocampal activity (associative hits – correct rejections) and category-level reinstatement strength (mean logits) in VTC and ANG during associative hits. (d–f) Independent of age, individual differences in hippocampal activity and category-level reinstatement strength in VTC and ANG during associative hits explain significant variance in exemplar-specific recall. (g–i) Independent of age, individual differences in hippocampal activity and VTC category-level reinstatement strength also explain significant variance in standardized delayed recall performance; the relation with ANG category-level reinstatement did not reach significance. Scatterplots reflect partial plots controlling for nuisance variables. Each point represents an individual participant. Plots also show linear model predictions (black line) and 95% confidence intervals (shaded area). VTC = ventral temporal cortex; ANG = angular gyrus.
Figure 5—figure supplement 2
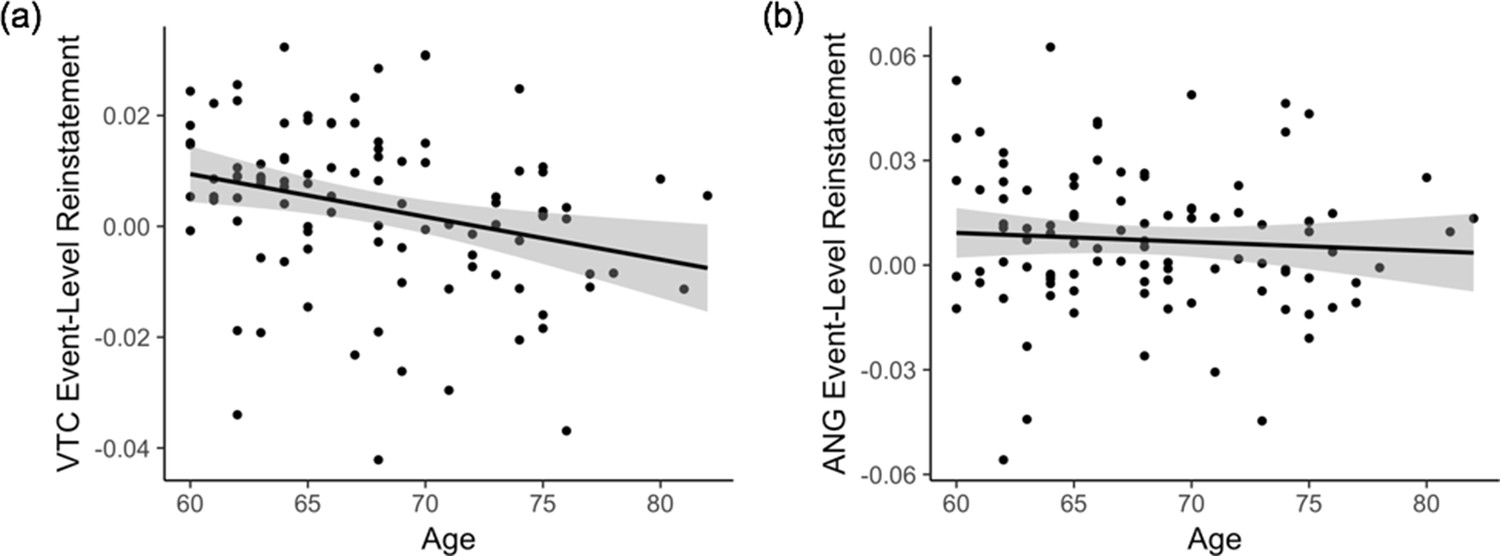
Event-Level reinstatement strength (within-event – within-category ERS) during associative hits declines with age in (a) VTC, but not (b) ANG.
Each point on the scatterplot represents an individual subject. Plots also show the linear model predictions (black line) and 95% confidence interval (shaded area). VTC = ventral temporal cortex; ANG = angular gyrus.
Figure 5—figure supplement 3
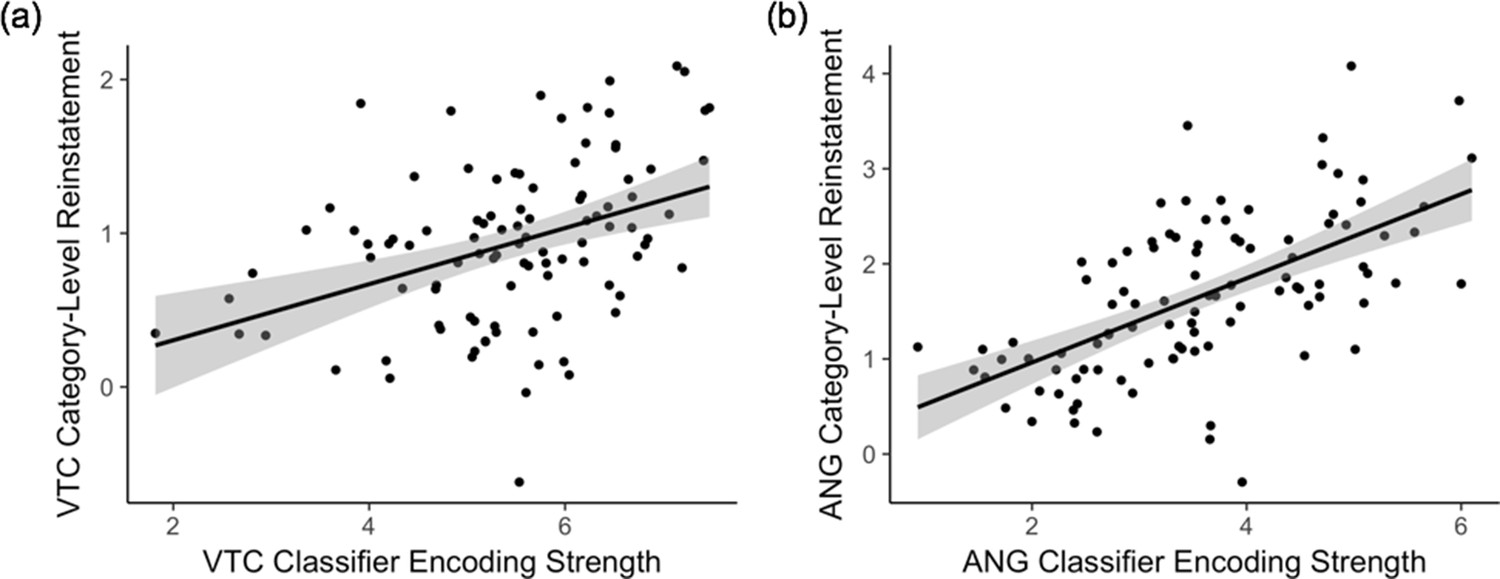
Relationship between Encoding Strength and Category-Level Reinstatement Strength in (a) VTC and (b) ANG.
In both regions, encoding strength (mean logits across leave-one-run-out-n-fold cross validation) is a significant predictor of category-level reinstatement strength (mean logits) during associative hits (VTC: β = 0.45, p < 10−5; ANG: β = 0.62, p < 10−11). Each point on the scatterplot represents an individual subject. Plots also show the linear model predictions (black line) and 95% confidence interval (shaded area). VTC = ventral temporal cortex; ANG = angular gyrus.
Figure 5—figure supplement 4
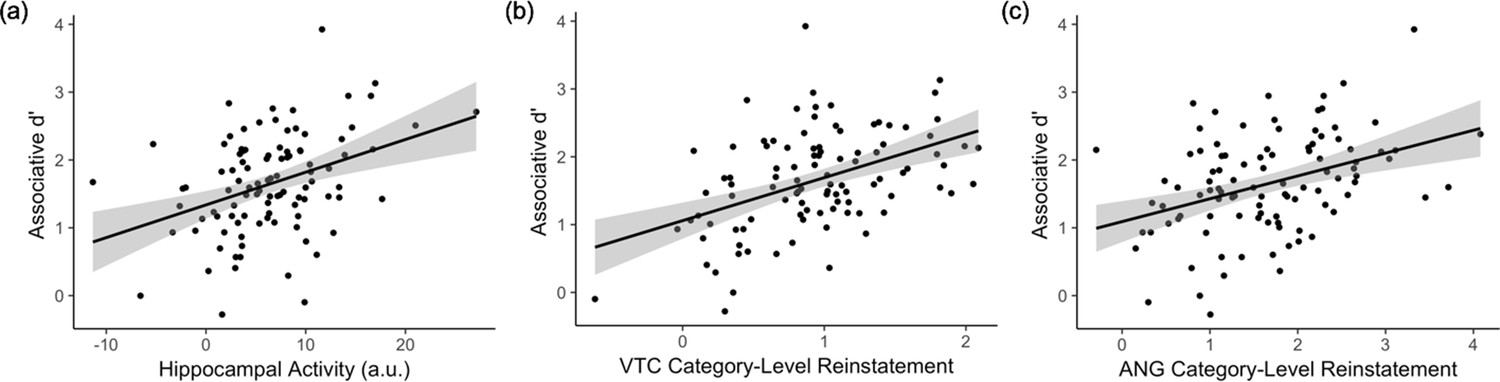
Individual differences in pattern completion assays predict associative d’.
Independent of age, individual differences in associative d’ are explained by (a) hippocampal activity (associative hits – correct rejections; β = 0.34, p < 0.001) and category-level reinstatement strength (logits) in (b) VTC (β = 0.38, p < 0.001) and (c) ANG (β = 0.39, p < 0.001) during associative hits (see Supplementary file 1 for model parameters). Each point on the scatterplot represents an individual subject. Plots also show the linear model predictions (black line) and 95% confidence interval (shaded area). VTC = ventral temporal cortex; ANG = angular gyrus.
Figure 5—figure supplement 5
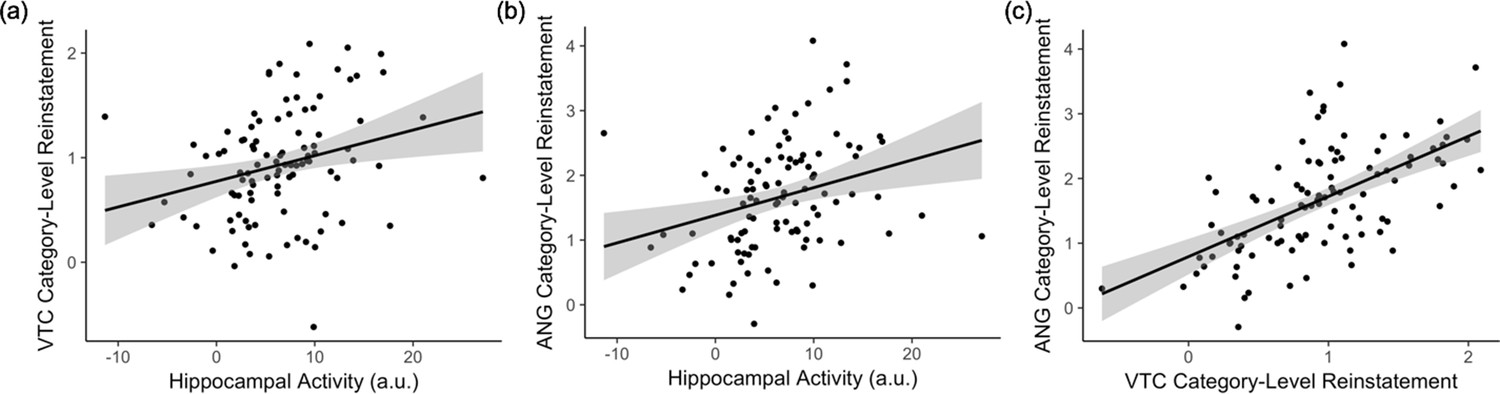
Pattern Completion Metrics Covary across Participants.
(a) Hippocampal activity during associative hits (associative hits – correct rejections) is related to category-level reinstatement strength (logits) in VTC (β = 0.19, p < 0.05) and (b) ANG (β = 0.21, p < 0.01) during associative hits. (c) Category-level reinstatement strength (logits) in VTC and ANG during associative hits are related (β = 0.44, p < 10−7). Each point on the scatterplot represents an individual subject. Plots also show the linear model predictions (black line) and 95% confidence interval (shaded area). VTC = ventral temporal cortex; ANG = angular gyrus.
Tables
Table 1
Demographics and neuropsychological test performance.
| Measure | Mean (SD) | Range |
|---|---|---|
| Gender | 61 F; 39 M | -- |
| Age (yrs) | 67.96 (5.47) | 60–82 |
| Education (yrs) | 16.84 (1.94) | 12–20 |
| MMSE | 29.10 (.90) | 26–30 |
| CDR | 0 | -- |
| Logical Memory Delayed Recall (/50) | 32.04 (6.16) | 18–44 |
| HVLT-R Delayed Recall (/12) | 10.49 (1.68) | 5–12 |
| BVMT-R Delayed Recall (/12) | 9.80 (2.16) | 5–12 |
| Old/New d’ | 2.26 (0.68) | 0.86–4.78 |
| Associative d’ | 1.64 (0.73) | −0.27–3.92 |
| Exemplar-Specific Recall (proportion correct, post-scan) | 0.29 (0.19) | 0.00–0.84 |
-
BVMT-R = Brief Visuospatial Memory Test-Revised; CDR = Clinical Dementia Rating; HVLT-R = Hopkins Verbal Learning Test-Revised; MMSE = Mini Mental State Examination. See Supplementary file 1 for summary of full neuropsychological test battery scores, and Supplementary file 1 for a summary of retrieval reaction time data and trial counts by memory outcome.
-
Table 1—source data 1
Demographic information and behavioural data presented in Table 1.
- https://cdn.elifesciences.org/articles/55335/elife-55335-table1-data1-v1.csv
Table 2
Summary of regression analysis predicting post-test exemplar-specific recall.
| Variable | β | SE | p | Adjusted R2 | |
|---|---|---|---|---|---|
| Step 1 | Age | −0.366 | 0.094 | 0.001*** | 0.126 |
| Step 2 | Age | −0.317 | 0.083 | 0.001*** | 0.325 |
| Hippocampal Activitya | 0.472 | 0.087 | 0.001*** | ||
| Step 3a | Age | −0.184 | 0.080 | 0.023* | 0.449 |
| Hippocampal Activitya | 0.388 | 0.080 | 0.001*** | ||
| VTC Reinstatementab | 0.428 | 0.089 | 0.001*** | ||
| Step 3b | Age | −0.281 | 0.082 | 0.001*** | |
| Hippocampal Activitya | 0.407 | 0.088 | 0.001**** | 0.365 | |
| ANG Reinstatementab | 0.289 | 0.108 | 0.009** | ||
| Step 4 | Age | −0.184 | 0.080 | 0.023*** | 0.448 |
| Hippocampal Activitya | 0.374 | 0.082 | 0.001*** | ||
| VTC Reinstatementab | 0.391 | 0.100 | 0.001*** | ||
| ANG Reinstatementab | 0.093 | 0.113 | 0.412 | ||
| Step 5 | Age | −0.137 | 0.079 | 0.087~ | 0.485 |
| Hippocampal Activitya | 0.335 | 0.080 | 0.001**** | ||
| VTC Reinstatementab | 0.377 | 0.089 | 0.001**** | ||
| Delayed Recall | 0.299 | 0.110 | 0.008** |
-
Note. a = adjusted by motion; b = adjusted by encoding strength (mean logits across leave-one-run-out-n-fold cross validation); Reinstatement = category level reinstatement (mean logits across associative hits); SE = standard error; VTC = ventral temporal cortex; ANG = angular gyrus;~p < 0.1, *p<0.05, **p<0.01, ***p<0.001 ****p<10−5.
Additional files
-
Supplementary file 1
Supplementary tables.
Supplementary file 1a. Neuropsychological test battery performance. Supplementary file 1b. Reaction time (ms) and trial counts as a function of trial type. Supplementary file 1c. Summary of model parameters for mixed effects models. Supplementary file 1d. Summary of linear and logistic mixed effects model results when item miss trials are excluded. Supplementary file 1e. Summary of linear and logistic mixed effects models examining effects of stimulus category (face, place) on relationships between neural variables and behavioural variables. Supplementary file 1f. Summary of linear mixed effects models examining effects of stimulus category (face, place) on relationships between hippocampal activity and cortical reinstatement. Supplementary file 1g. Analysis of head motion and its effects on key dependent variables of interest. Supplementary file 1h. Summary of hierarchical regression analysis predicting associative d’. Supplementary file 1i. Summary of regression analyses examining the relationship between hippocampal subfield activity during associative retrieval (associative hit - CR) and associative memory.
- https://cdn.elifesciences.org/articles/55335/elife-55335-supp1-v1.docx
-
Transparent reporting form
- https://cdn.elifesciences.org/articles/55335/elife-55335-transrepform-v1.docx
Download links
A two-part list of links to download the article, or parts of the article, in various formats.
Downloads (link to download the article as PDF)
Open citations (links to open the citations from this article in various online reference manager services)
Cite this article (links to download the citations from this article in formats compatible with various reference manager tools)
Hippocampal and cortical mechanisms at retrieval explain variability in episodic remembering in older adults
eLife 9:e55335.
https://doi.org/10.7554/eLife.55335


