Shared and specific signatures of locomotor ataxia in mutant mice
- Champalimaud Neuroscience Program, Champalimaud Center for the Unknown, Portugal
Figures
Figure 1
Intact forward motion of front paws, altered 3D paw trajectories, and impaired hindlimb control in reeler.
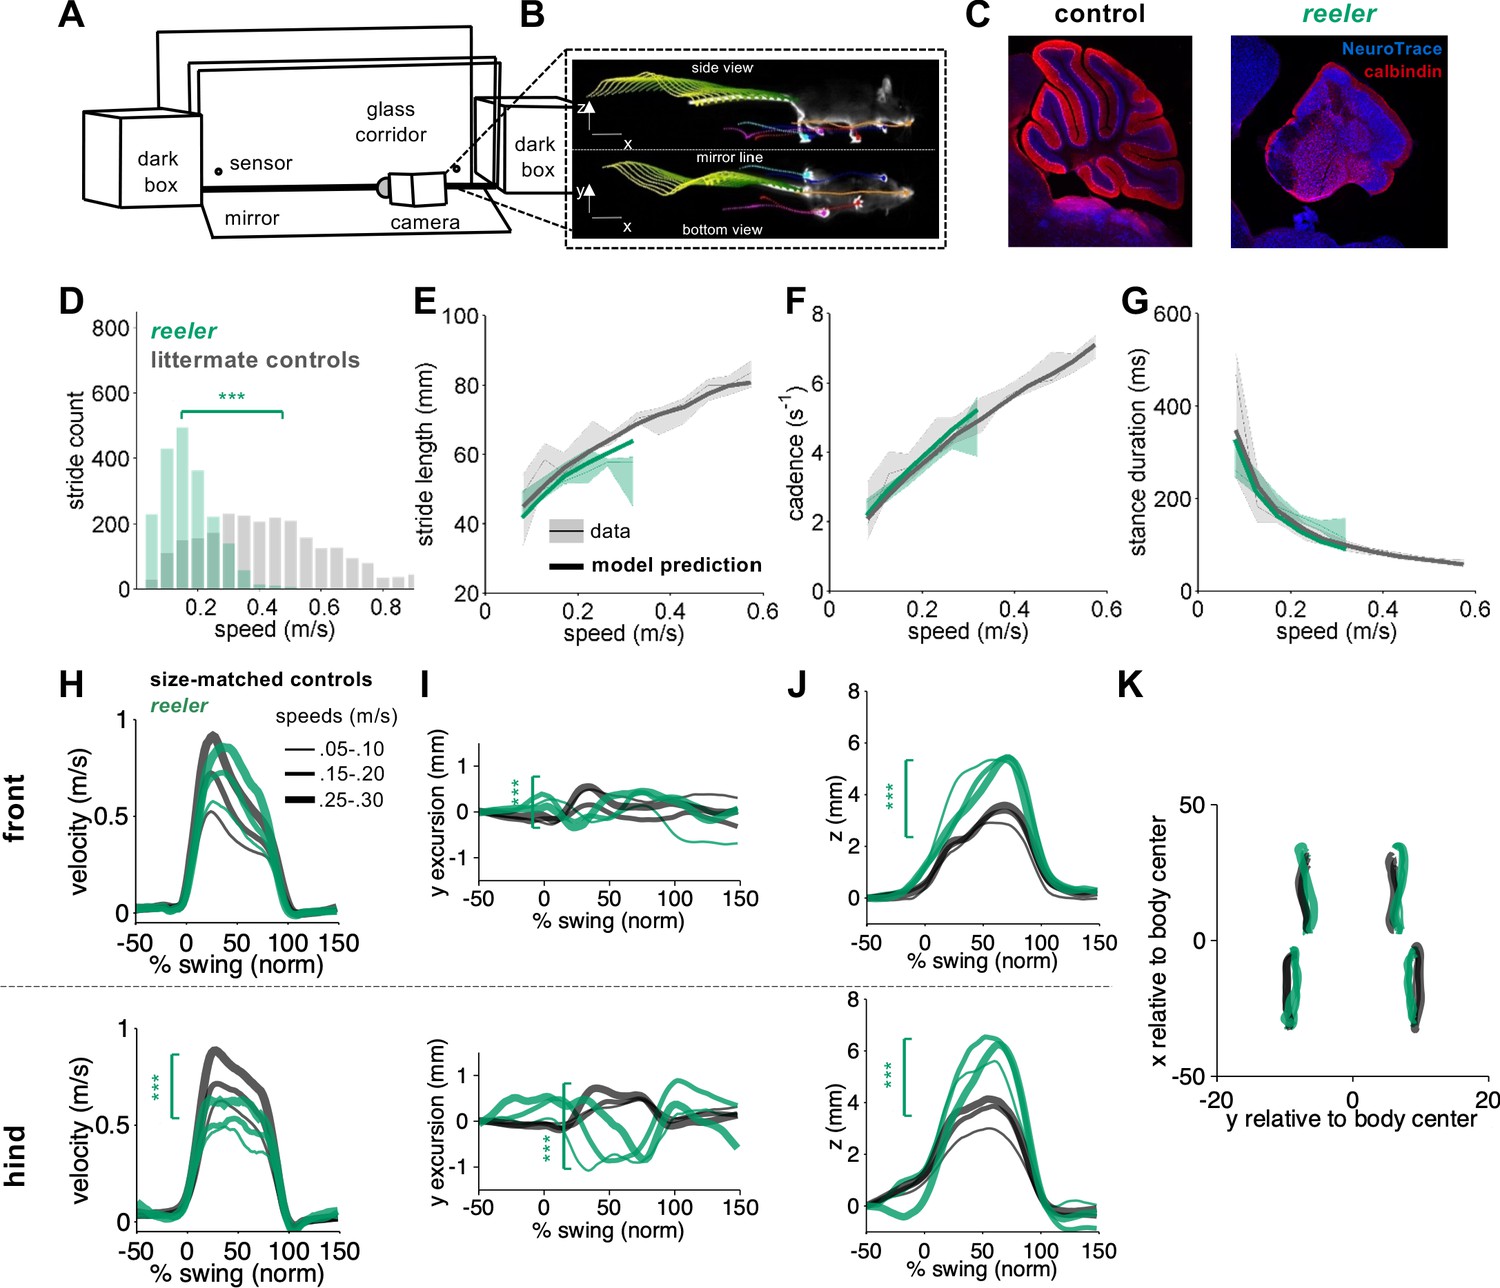
(A) Schematic of the LocoMouse setup with two dark boxes, glass corridor, motion sensors, high speed (400fps) camera, and mirror. Mice freely cross the corridor. (B) An example of side and bottom views captured in a single via mirror reflection. Continuous tracks (in x, y, z) for nose, paws and tail segments obtained from LocoMouse tracking are plotted on top of the frame. (C) Sagittal sections of mouse cerebellum from littermate control (left) and a reeler mouse (right) illustrate dramatic cerebellar reorganization in reeler. (D) Histogram of walking speeds for reeler (green N = 7 mice, n = 2439) and littermate controls (grey, N = 12, n = 2515). Walking speed distributions are significantly different, reelers mice walk slower (ind. t-test p=<0.001***). (E–G) Stride length (E), cadence (F, 1/stride duration) and stance duration (G) of the front right (FR) paw vs walking speed for reeler (green) and littermates (grey). For each parameter, thin lines with shadows represent median values ± 25th, 75th percentiles. Thick lines represent the predictions calculated using the equations previously derived from the mixed-effect models described in Machado et al., 2015. No significant difference was observed between littermate controls and reeler mice (main effects: stride length: F1,90=2.16, p=0.14; cadence: F1,90 = 0.7, p=0.4; stance duration: F1,90=2.97, p=0.09). (H) Average instantaneous forward (x) velocity of FR paw (top) and hind right (HR) paw (bottom), normalized to the swing phase. Line thickness represents increasing speed. Reeler (green), size-matched controls (black; N = 11; n = 3412). Reeler mice showed sig. higher avg. swing velocity (F1,104 = 4.59, p=0.03), but no difference in peak inst. velocity (F1,104 = 0.87, p=0.35). Hind paws showed lower peak velocity than size-matched controls (F1,103 = 14.1, p=<0.0001). (I) side-to-side (y)-excursion for FR and HR paws, relative to body midline. There are changes in peak to peak trajectories for both paws (FR: F1,96=197.4, p=<0.0001; HR: F1,103=353.9, p=<0.0001). (J) Average vertical (z) position of FR paw (top) and HR paw (bottom) relative to ground during swing. Reelers mice have larger vertical movement than size-matched controls (FR: F1,96=205.5, p=<0.0001; HR: F1,103=11.9, p=<0.0001). (K) x-y position of four paws relative to the body center during swing for reeler and size-matched controls. There was no significant difference in width of base of support (F1,101=2.4, p=0.12).
-
Figure 1—source data 1
Source data for Figure 1.
- https://cdn.elifesciences.org/articles/55356/elife-55356-fig1-data1-v1.mat
Figure 2
Comparison of Reeler and pcd mice reveals overall similarity of averaged paw trajectories, with additional hind limb impairments and increased variability in reeler.
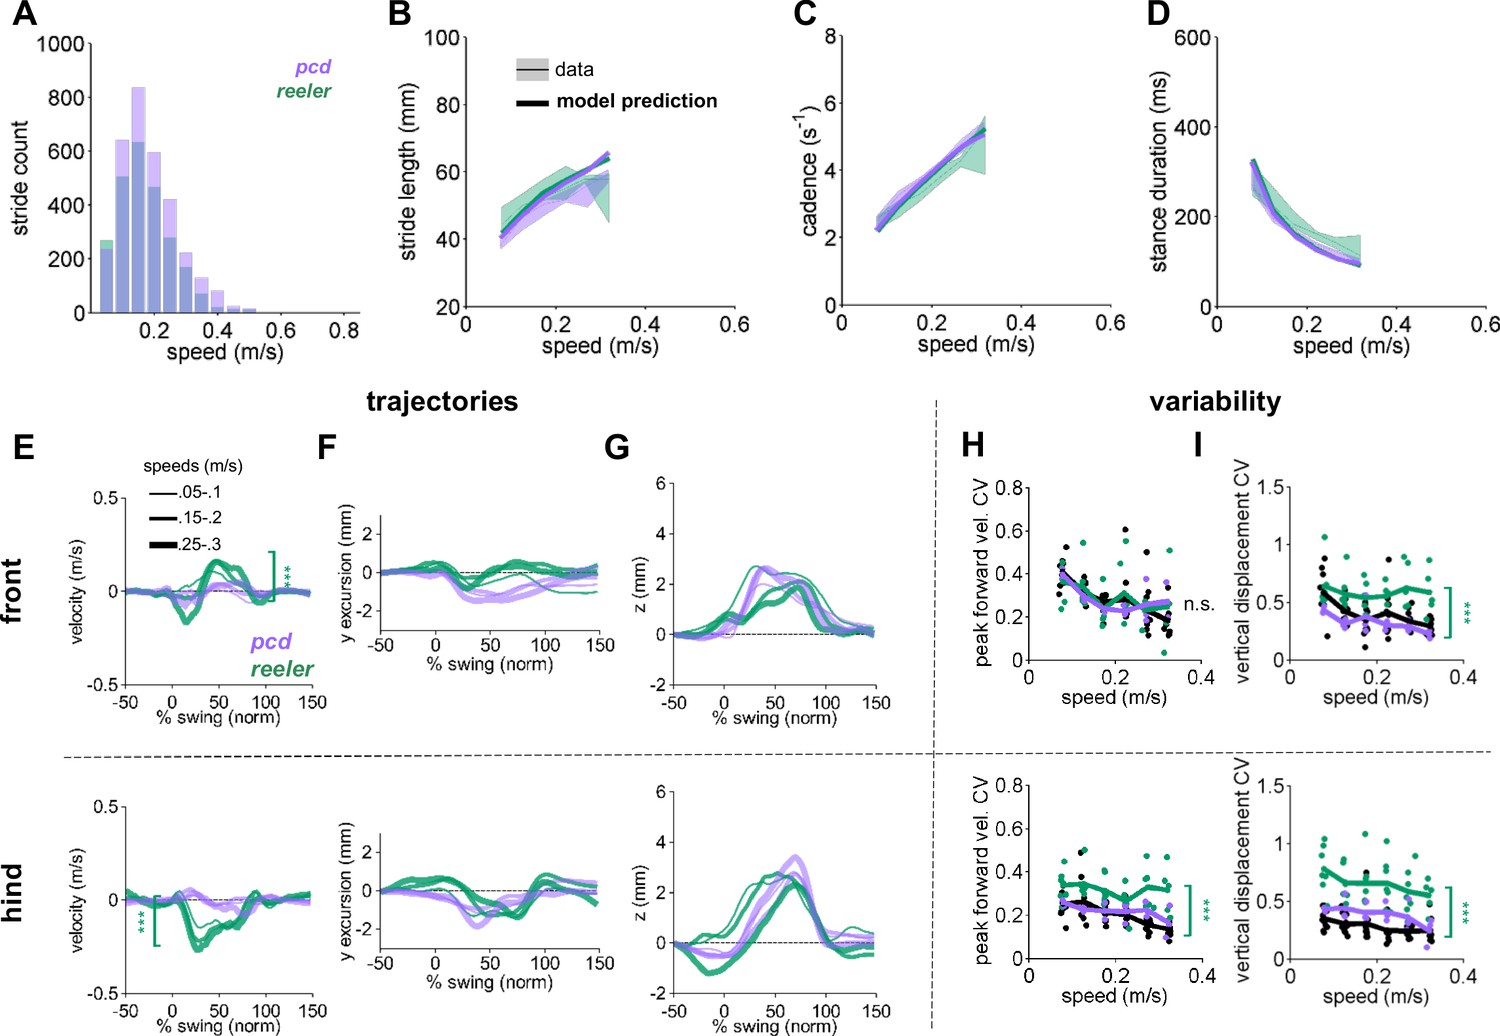
(A) Histogram of walking speeds, for reeler (green N = 7; n = 2439) and pcd (purple, N = 3; n = 3052; Machado et al., 2015). (B–D) Stride length (B), cadence (C), 1/stride duration) and stance duration (D) vs walking speed for reeler (green) and pcd (purple) mice. For each parameter, the thin lines with shadows represent median values ± 25th, 75th percentiles. Thick lines represent the predictions calculated based on the models derived in Machado et al., 2015. Reeler mice had sig. higher stride lengths (F1,52=5.23, p=0.03). No significant differences were observed between pcd and reeler in cadence: F1,55 = 0.01, p=0.92 or stance duration: F1,52=0.19, p=0.66). (E–G) The differences in averaged trajectories between each mutant size and speed-matched controls are plotted for reeler (green) and pcd (purple). Line thicknesses represent increasing walking speed. (E) The peak instantaneous forward (x) velocity of FR paws (top) was sig. higher in reeler (F1,8=50.23, p=<0.0001). Peak HR paw velocity is lower in reeler (bottom, F1,8 = 6.09, p=<0.0001). (F) Differences in side-to-side (y)-excursion for FR (top) and HR (bottom) paws during swing phase, relative to body midline. No significant difference is observed in peak excursion between pcd and reeler (FR: F1,8=4.81, p=0.06; HR: F1,8 = 0.04, p=0.84). (G) Differences in vertical (z) trajectory of FR paw (top) and HR paw (bottom) during swing phase. No significant difference in peak z was observed between pcd and reeler mice (FR: F1,8=0.91, p=0.37; HR: F1,8 = 1.98, p=0.2). (H,I) Coefficient of variation (CV) for peak forward velocity (H) and vertical displacement (I) for size-matched controls, reeler, and pcd. Hind paw velocity (H, bottom; F1,99=13, p=<0.0001) and both front (I, top; F1,101=45.1, p=<0.0001) and hind (I, bottom; F1,101=73.3, p=<0.0001) paw vertical movements were more variable in reeler.
-
Figure 2—source data 1
Source data for Figure 2.
- https://cdn.elifesciences.org/articles/55356/elife-55356-fig2-data1-v1.mat
Figure 3
Impaired front-hind limb coordination and increased front paw support patterns in reeler.
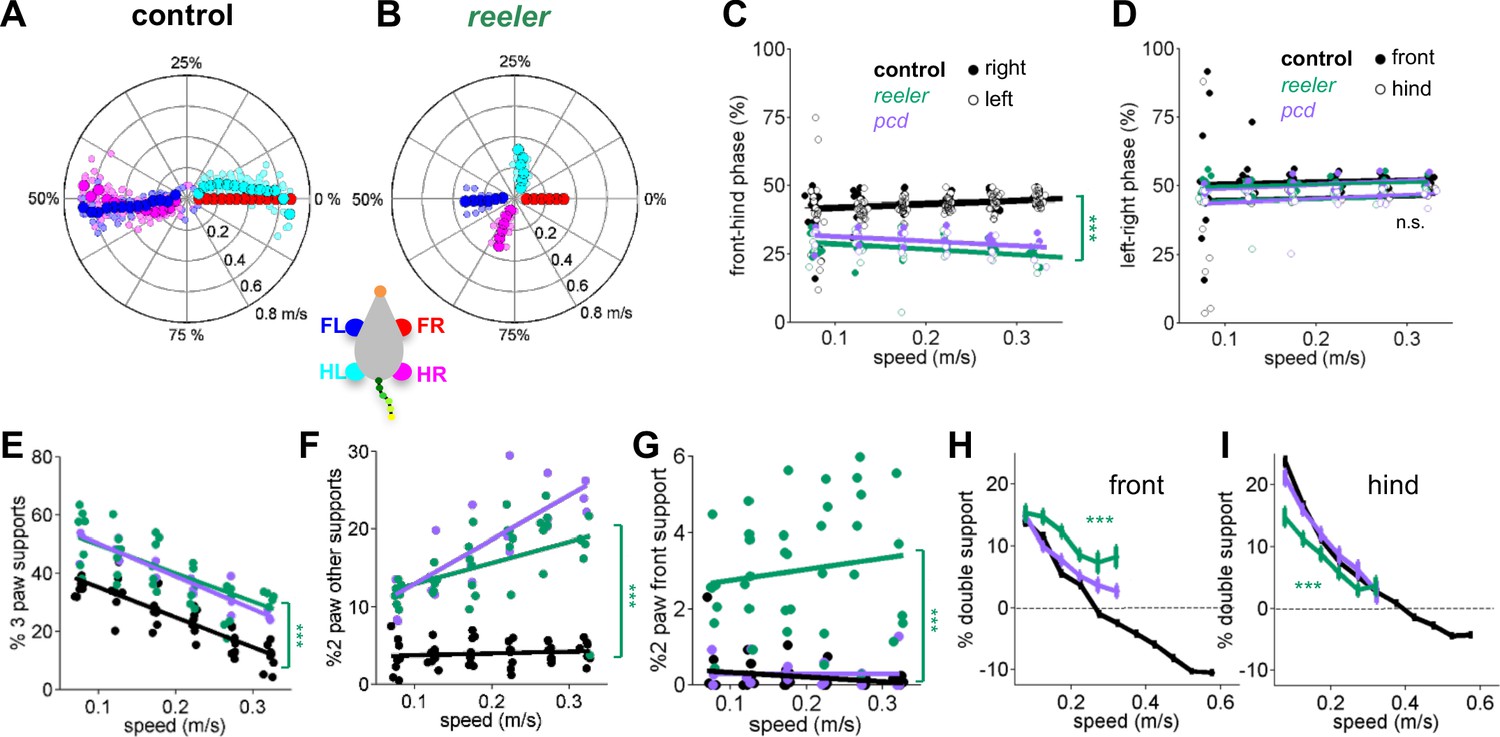
(A–B) Polar plots indicating the phase of the step cycle in which each limb enters stance, aligned to stance onset of FR paw (red). Radial axis represents walking speed. Limbs are color coded according to the inset; large symbols represent averages across animals and small symbols represent individual mice. (A) size-matched control mice (N = 11) and (B) reeler mice (N = 7). (C,D) Relative front-hind (C) and left-right (D) stance phases across walking speeds for pcd (purple), reeler (green)r hases across walking spee(black). Each circle represents one animal. Lines show fit of linear-mixed effects model for each variable. Only front-hind phase is impaired in reeler and pcd mice (front-hind phase: F1,104 = 11.7, p=<0.0001; left-right phase: F1,104 = 0.7, p=0.41). (E) Both pcd and reeler have a higher percentage of 3 paw supports at all speeds (F1,104 = 115.1, p=<0.0001). (F) Non-diagonal 2-paw support configurations are increased in both pcd and reeler (F1,104 = 28.3, p=<0.0001). (G) Only reeler mice show an increase in 2-front paw support configurations (F1,101 = 207, p=<0.0001). (H,I) Average ). n increase in 2-front paw support configurations (th s one (H) and hind (I) paws of pcd (purple), reelers (green) and size-matched controls (black). Reeler mice have a higher % of front double support and lower % of hind double support when compared with size-matched controls (front double support: F1,99 = 71,9, p=<0.0001; hind double support: F1,103 = 27.2, p=<0.0001).
-
Figure 3—source data 1
Source data for Figure 3.
- https://cdn.elifesciences.org/articles/55356/elife-55356-fig3-data1-v1.mat
Figure 4 with 1 supplement
Tail and nose movements of reeler mice can be modeled as a passive consequence of the forward movement of the front paws.
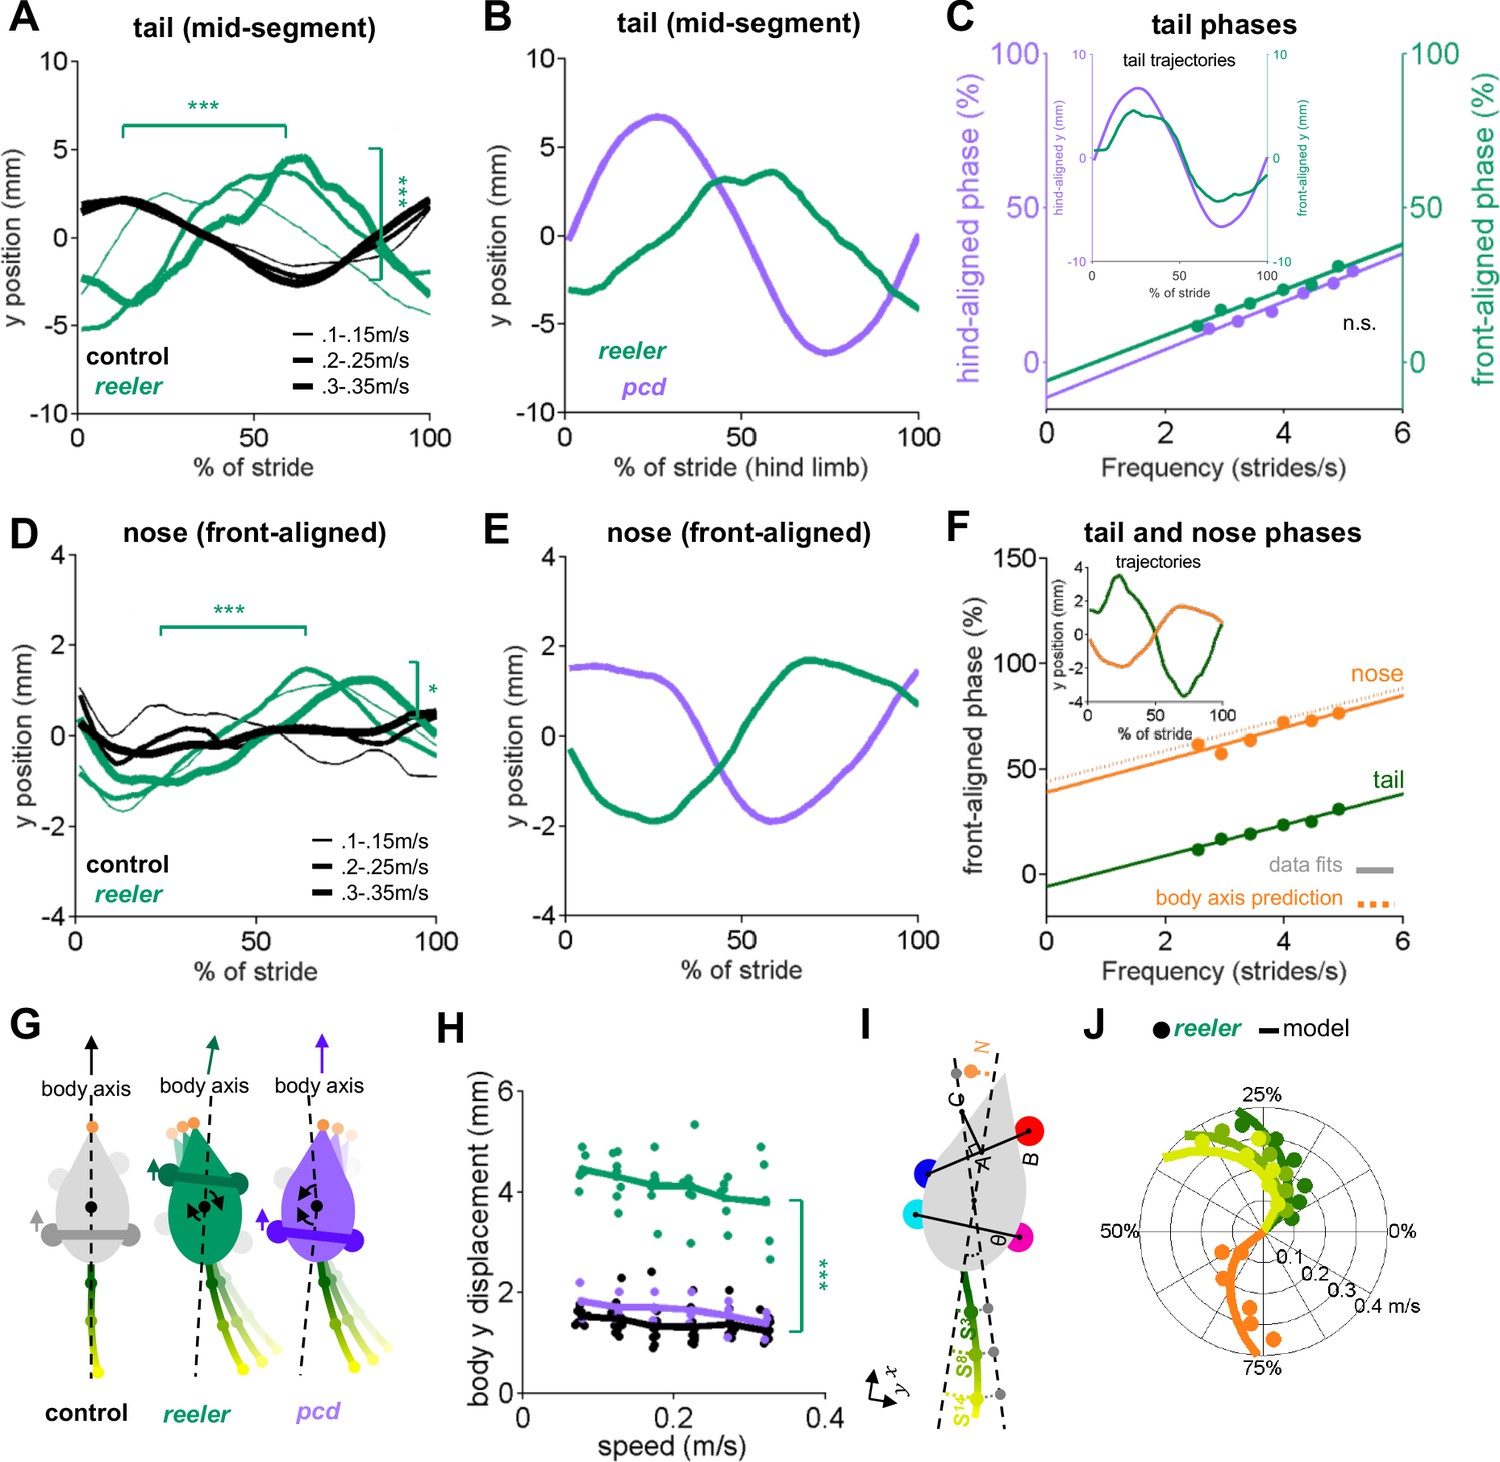
(A) Compared to controls (black), reelers (green) display larger averaged side-to-side tail oscillations, and increased phase lags with increased walking speed (from thin to thick lines) (tail amplitude: F1,103 = 24.8, p=<0.0001; tail phase: F1,104 = 59.2, p=<0.0001). (B) Different phase relationships of reeler (green) and pcd (purple) tail oscillations relative to the hind limb stride cycle (walking speed 0.25–0.3 m/s). (C) When aligned to the front limbs, reeler (green) tail phases are very close to those of pcd (purple) aligned to the hind limbs (lines show fits to the data; F1,56 = 1.3, p=0.26). Inset shows the tail trajectories of reelers aligned to the front paws (green) and pcd (purple) aligned to the hind limbs (mid-tail segment for animals walking at 0.25–0.3 m/s). (D) Reelers also show larger nose oscillations and phase-lags that increase with speed increases when compared with controls (amplitude: F1,104 = 5.1, p=0.03 ; phase:F1,104 = 42.1, p=<0.0001). (E) Different phases of reeler nose (green) and pcd (purple), aligned to front paws. (F) The reeler nose (orange) is nearly perfectly out of phase with the base of the tail (green), suggesting oscillation of a single body axis (circles represent data points, solid lines show fits to the data, dashed line shows a prediction of the nose phases with respect to the same body axis as the tail. Inset shows the trajectories of the base of the tail and nose aligned to front limbs. (G) Interpretation of tail and nose movements observed in control (left), reeler (middle) and pcd (right) mice. (H) Average side-to-side (y)-excursion of the body center during strides (F1,99=1072.5, p=<0.0001). (I) Geometric interpretation of the analytical model (see Materials and methods). The forward movement of front limbs (AB) is transformed into lateral oscillations of a body axis (AC). The lateral oscillations of tail and nose are then given by a time delay relative to the movement of the body axis. (J) Phase (relative to front limb oscillation) of nose (orange), base of the tail (dark green), mid-tail segment (intermediate green) and tip of the tail (light green), plotted as a function of walking speed. Circles represent data, lines are the predictions of the analytical model.
-
Figure 4—source data 1
Source data for Figure 4 and related supplements.
- https://cdn.elifesciences.org/articles/55356/elife-55356-fig4-data1-v1.mat
Figure 4—figure supplement 1

Real and modeled trajectories of tail and nose in reeler and pcd mice.
(A) Phase relationship of a mid-tail segment (green circles) and the nose (orange circles) of reeler mice plotted relative to front limb oscillation. Gray lines depict a gradient of time-delay models with delays of 25 ms (darker gray) to 400 ms (lighter gray) in intervals of 25 ms. Colored lines represent the best time-delay fits to the data, across walking speeds. This model successfully reproduces the trajectories of (B) tail and (C) nose aligned to the front limb stride cycle, across speeds. (D–F) Hindlimb-based models require much longer time delays and do a poorer job of fitting reeler tail phases (D) and tail and nose trajectories (E,F) across walking speeds. (G) Unlike reeler (see Figure 4F), a single-axis model in which the base of the tail and the nose are out of phase with each other cannot reproduce pcd nose movements across walking speeds (circles represent data points, solid lines show fits to the data, dashed line shows single-axis model prediction for the nose). (H,I) For pcd, hindlimb-driven (H), but not front-limb driven (I) models effectively capture tail and nose phases across walking speeds (same legend as in A).
Figure 5 with 2 supplements
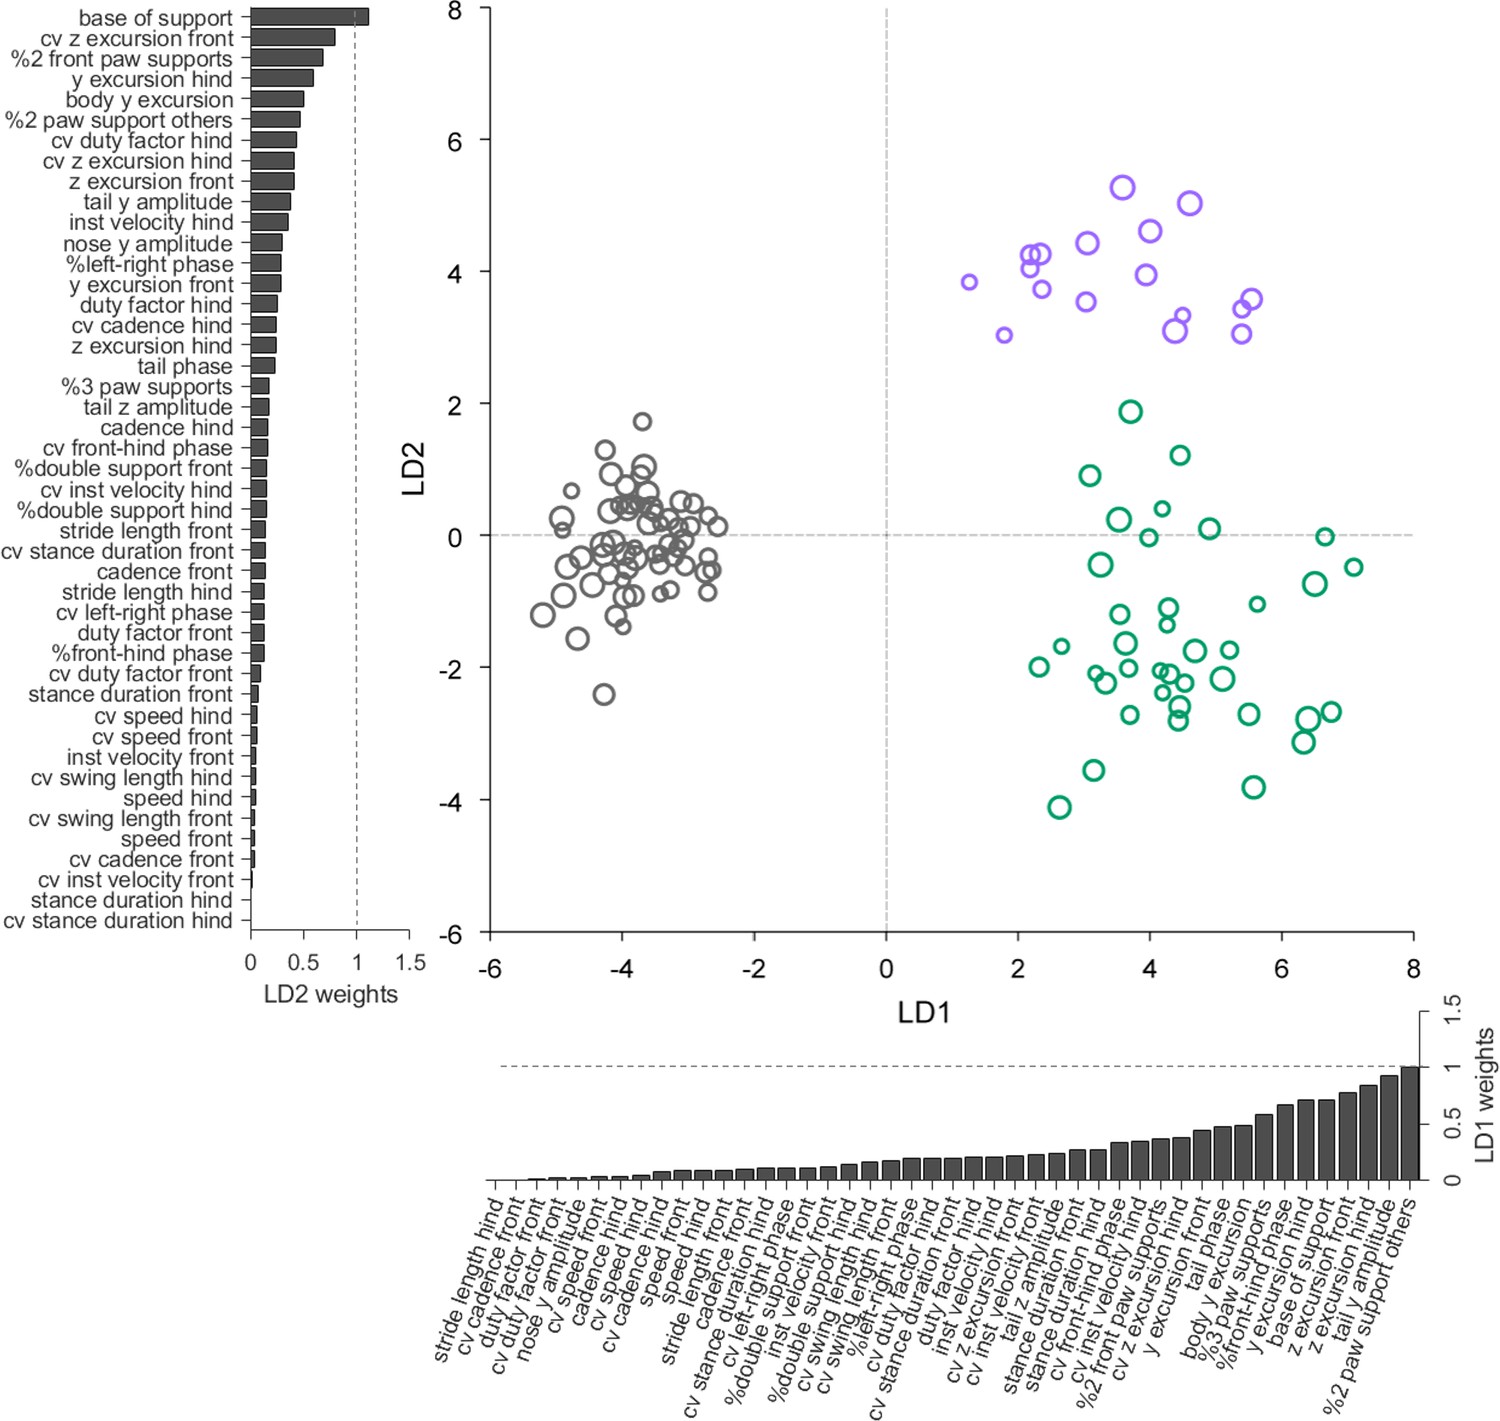
Linear discriminant analysis separates ataxic mutants and reveals shared and distinct features of gait ataxia.
Linear discriminant analysis of locomotor kinematics reveals two axes, which separate ataxic mutants from controls (LD1) and from each other (LD2). Each dot represents a single animal walking at a particular speed. Faster speeds are shown with larger marker sizes. Speeds ranged from 0.05 to 0.35 m/s and were binned with a binwidth of 0.05 m/s. Size-matched controls are in grey (N = 11 for all speed bins; n = ~ 3288), reeler in green (N = 7 for 0.05–0.15 m/s; N = 6 for 0.25–0.35 m/s; n = ~ 2387), and pcd in purple (N = 3 for all speed bins except 0.25–0.30 m/s N = 2; n = ~ 3066). The bars along each axis are ranked by the contribution scores (LD coefficients) of each variable to that axis (larger bars indicate higher contributions). Features contributing strongly to LD1 (which accounts for 84% of the total between-group variance) include interlimb and whole-body coordination, as well as off-axis paw trajectories. For LD2 (which accounts for 16% of the between-group variance), they also include variability, front paw supports, and relative phasing of tail/nose movements.
-
Figure 5—source data 1
Source data for Figure 5 and related supplements.
- https://cdn.elifesciences.org/articles/55356/elife-55356-fig5-data1-v1.mat
Figure 5—figure supplement 1
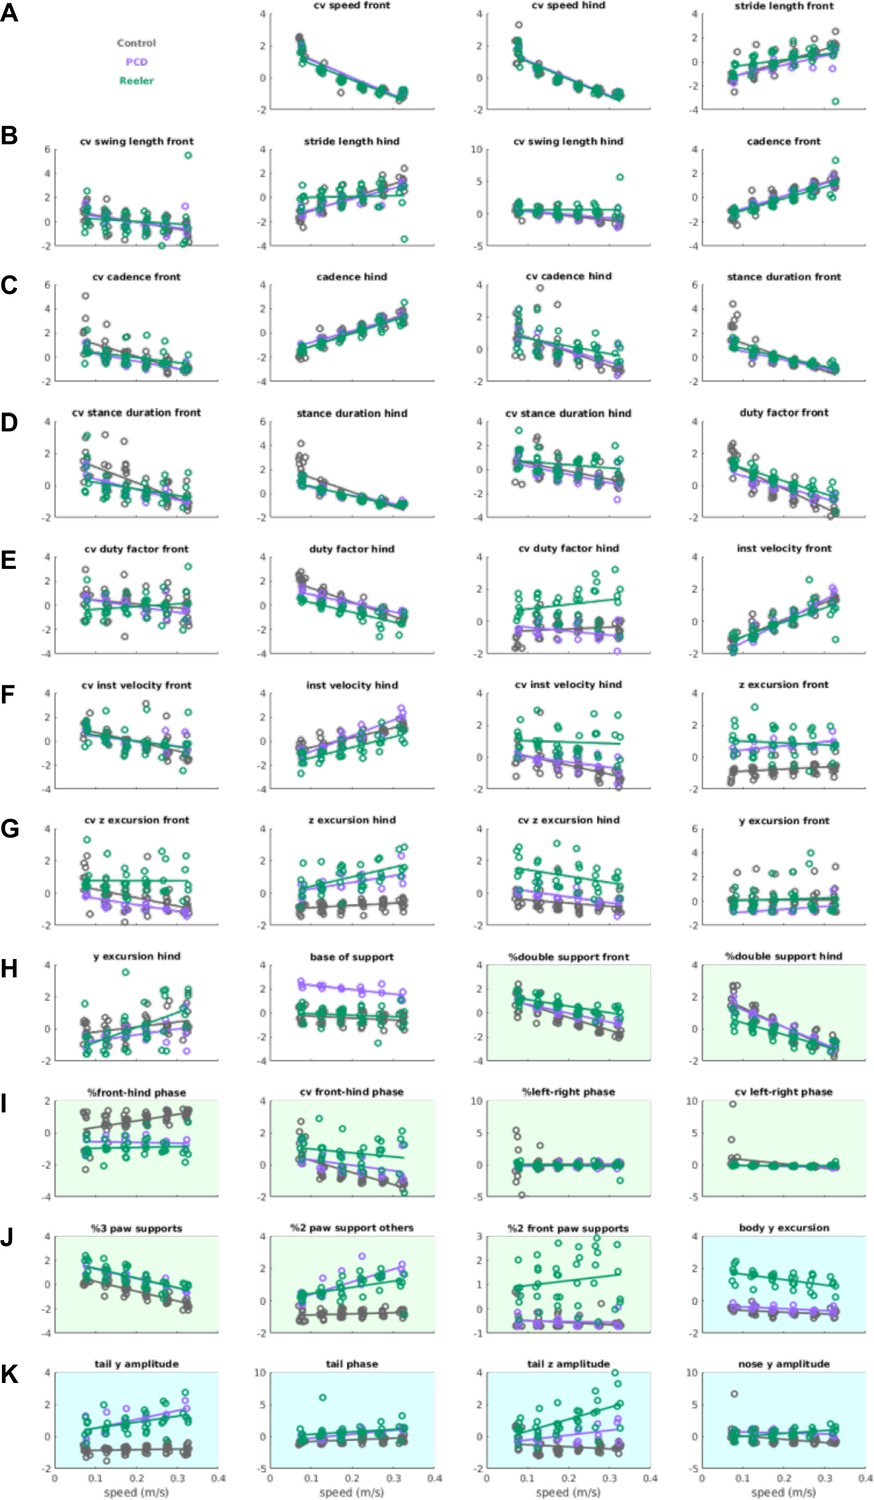
Distribution of z-scored values for the gait parameters given as input to the LDA.
istribution of z-scored values for the gait parameters given as input to the LDA. group variance) include interlimb anfits of each parameter for each genotype, across speed bins. Raw data for individual limb parameters (rows A to H, white backgrounds) can be found in Figure 1 and Figure 2. Interlimb parameters over speed (rows H to J, green backgrounds) are represented in Figure 3. Whole body gait parameters are highlighted in blue and correspond to data from Figure 4. Definitions of each parameter and method for calculating it are given in the Materials and methods section. 43 of the 45 inputs to the PCA/LDA are depicted (limb speed vs. walking speed for front and hind limbs have been removed due to redundancy).
Figure 5—figure supplement 2
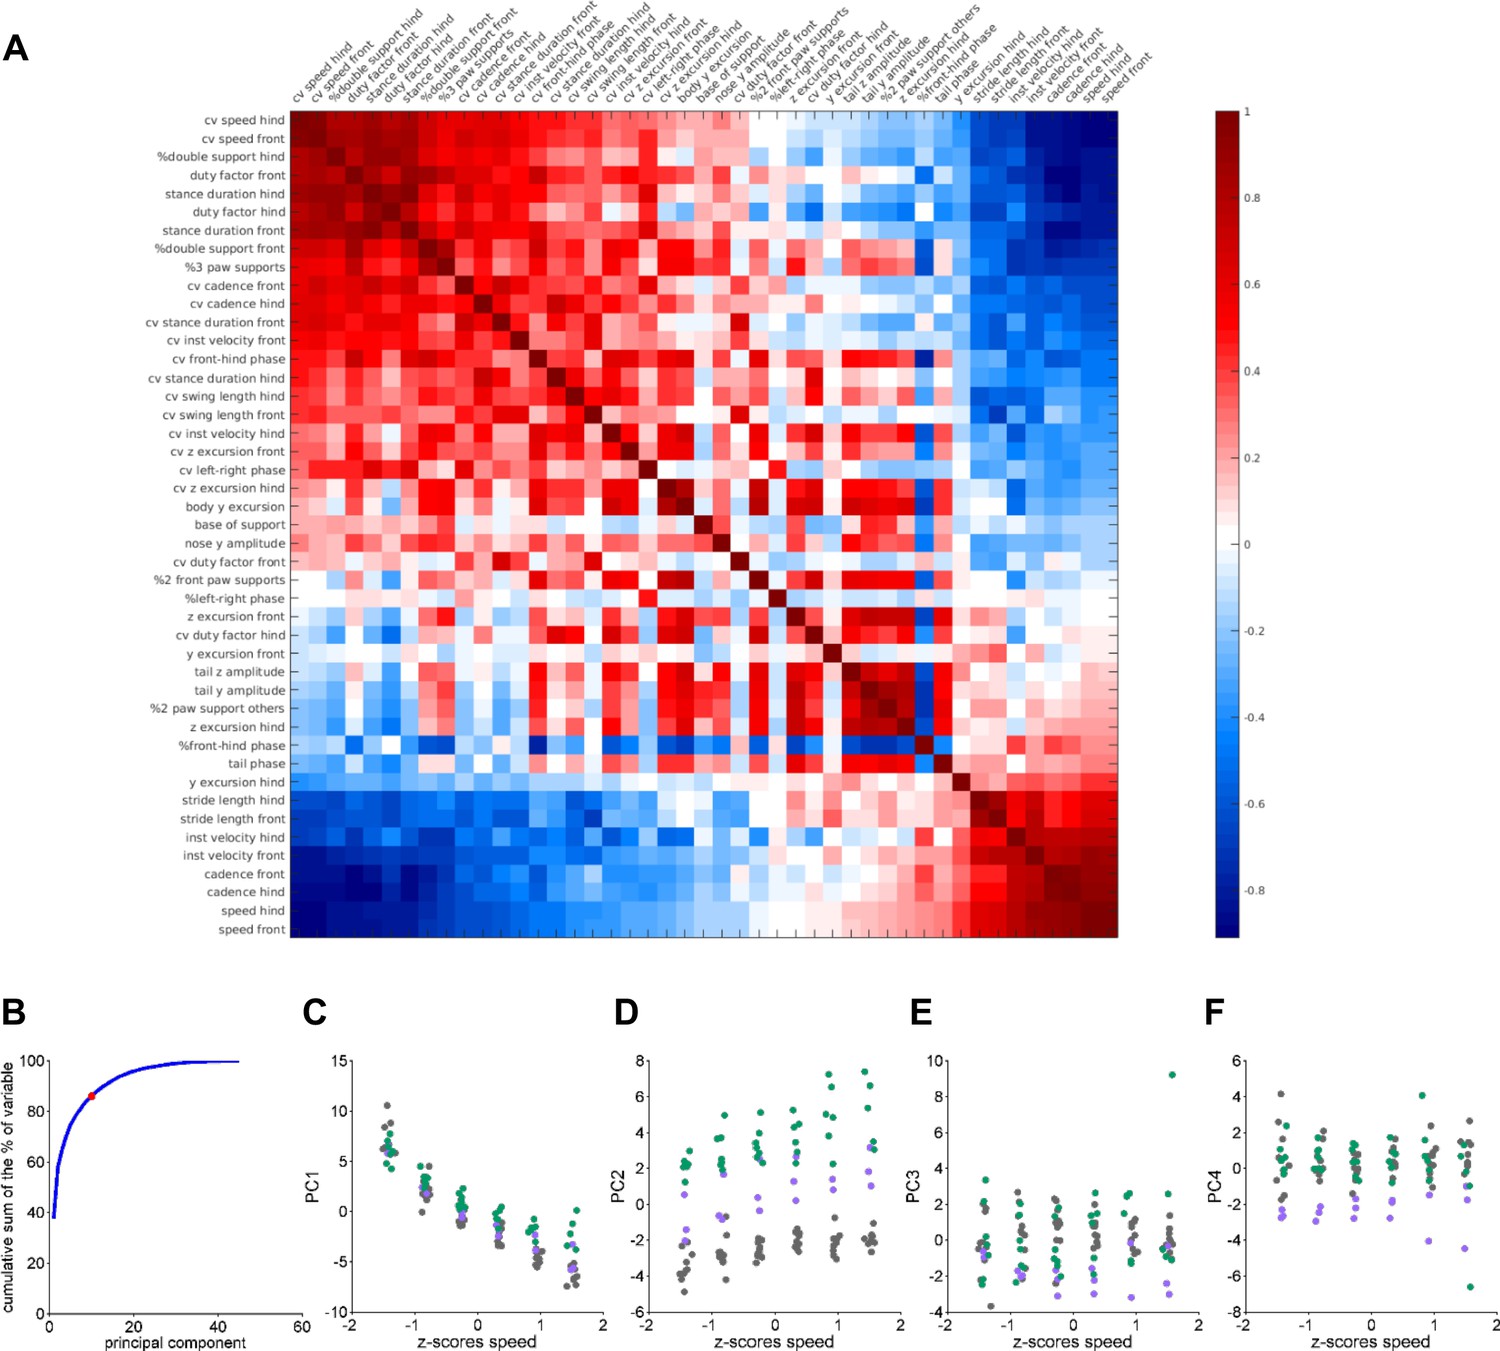
Data correlations and variance analysis for inputs to LDA.
(A) Correlation matrix: correlation coefficients between gait variables. (B) Cumulative explained variance of each principal component. Red dot indicates the selection of the first 10 principal components that explain aprox. 85% of the variance. (C–F) The first four principal component scores plotted against z-scored speed bins. Each dot represents a single animal walking at a particular speed, for controls (grey; N = 11), reeler (green; N = 7), and pcd (purple; N = 3). Speed is faithfully captured by the first principal component (C), which largely accounts for the high correlation values in (A).
Videos
Video 1
Visible gait ataxia in reeler and Purkinje cell degeneration mice walking on the LocoMouse setup.
Wild type (top), reeler (middle), and pcd (bottom) mice were recorded walking across the glass corridor of the LocoMouse setup. Side and bottom (via mirror reflection) views were captured by a single high-speed camera at 400fps and are shown here at 50 fps (slowed down 8x). Note the slower walking speeds of both mutants and the visible differences in their locomotor behavior.
Additional files
-
Supplementary file 1
To test the differences, or not, between genotypes (reelers and control) across speeds we used an independent samples t-test and mixed-effects models (Bates et al., 2013). In this table, we report F statistics from mixed ANOVAs with Satterthwaite degrees of freedom correction. Differences were considered significant at *p<0.05, **p<0.01, and ***p<0.001.
- https://cdn.elifesciences.org/articles/55356/elife-55356-supp1-v1.xlsx
-
Transparent reporting form
- https://cdn.elifesciences.org/articles/55356/elife-55356-transrepform-v1.docx
Download links
A two-part list of links to download the article, or parts of the article, in various formats.
Downloads (link to download the article as PDF)
Open citations (links to open the citations from this article in various online reference manager services)
Cite this article (links to download the citations from this article in formats compatible with various reference manager tools)
Shared and specific signatures of locomotor ataxia in mutant mice
eLife 9:e55356.
https://doi.org/10.7554/eLife.55356


