Leptin increases sympathetic nerve activity via induction of its own receptor in the paraventricular nucleus
- Department of Physiology and Pharmacology, United States
- Department of Anesthesiology and Perioperative Medicine, United States
- Department of Neurological Surgery, United States
- Department of Pediatrics, Pape Family Pediatric Research Institute, Brenden-Colson Center for Pancreatic Care Oregon Health & Science University, United States
Figures
Figure 1
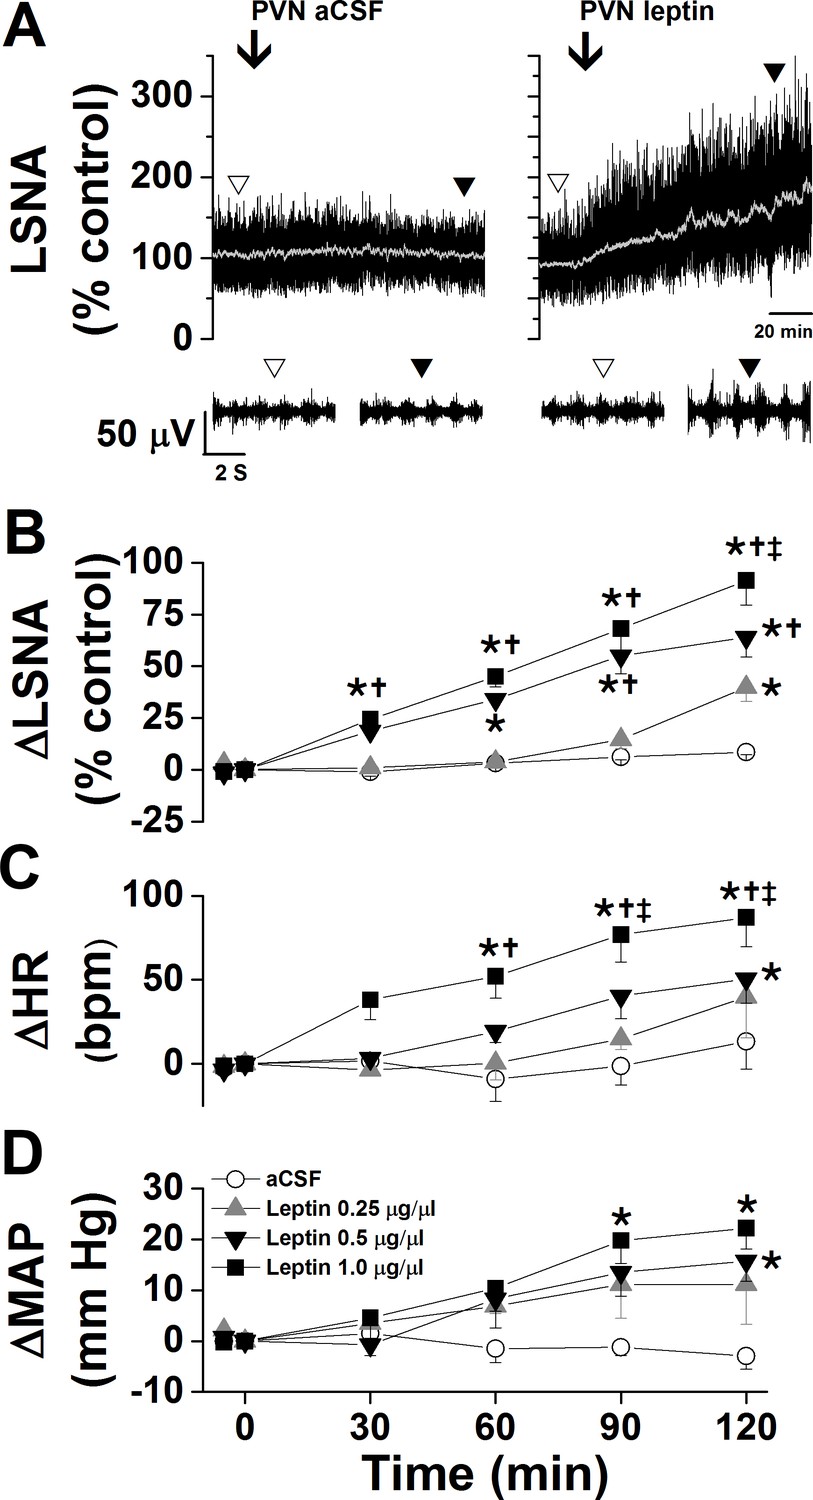
Effects of PVN leptin on LSNA, HR, and MAP.
(A) Representative experiments showing that bilateral nanoinjections (beginning at arrow) of leptin, but not aCSF, into the PVN increased LSNA. (B-D) Bilateral nanoinjections of leptin, but not aCSF, into the PVN dose dependently increased LSNA (B), HR (C), and MAP (D). Open circles, PVN aCSF (n = 4); gray triangles, PVN leptin, 15 ng (n = 4); black triangles, PVN leptin, 30 ng (n = 4); black squares, PVN leptin, 60 ng (n = 5). Baseline HR values (in bpm; no between group difference) are: PVN aCSF: 354 ± 12; PVN leptin, 15 ng: 369 ± 7; PVN leptin, 30 ng: 331 ± 12; PVN leptin, 60 ng: 311 ± 18. Baseline MAP values (in mmHg; no between group differences) are: PVN aCSF: 103 ± 7; PVN leptin, 15 ng: 103 ± 9; PVN leptin, 30 ng: 106 ± 5; PVN leptin, 60 ng: 98 ± 3. *: p<0.05, compared to baseline control values (time zero); †: p<0.05 compared to PVN leptin, 15 ng; ‡: p<0.05 compared to PVN leptin, 30 ng.
Figure 2
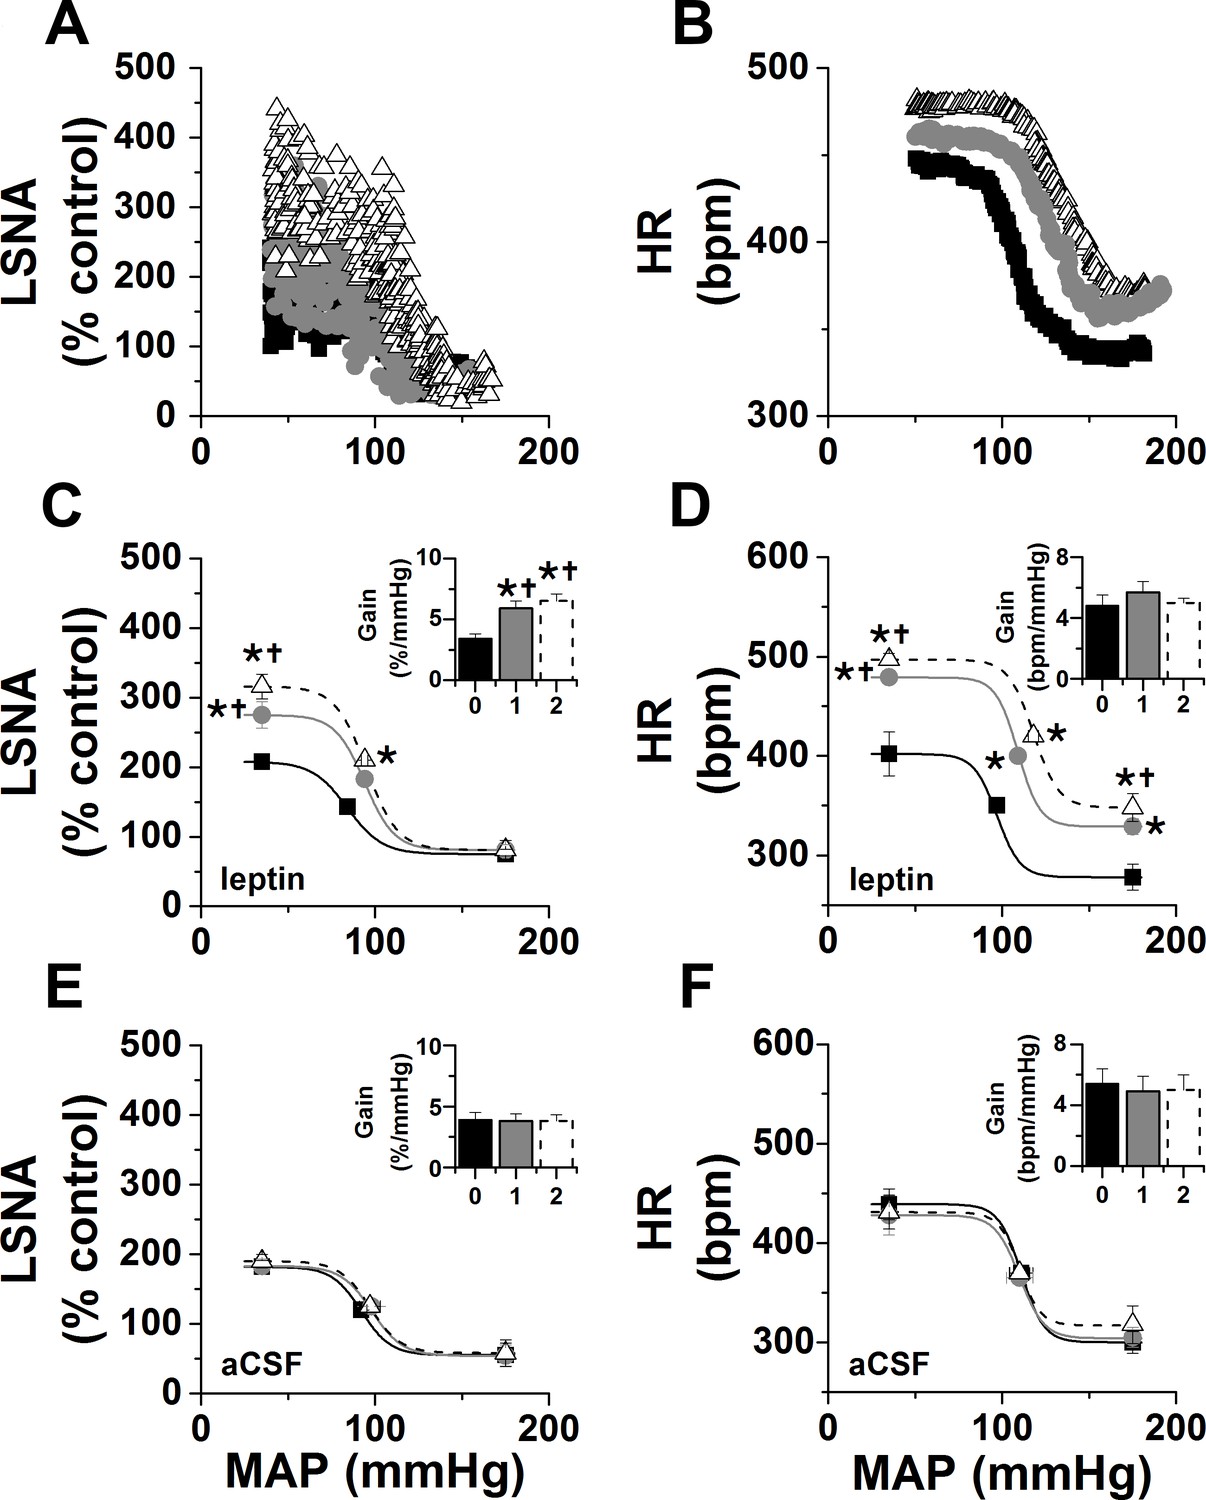
Effects of PVN leptin on baroreflex control of LSNA and HR.
(A-B) Representative experiments showing effects of PVN leptin (60 ng) on baroreflex control of LSNA (A) and HR (B). (C) Grouped LSNA data. PVN nanoinjection of leptin enhanced baroreflex control of LSNA (increased baroreflex gain, maximum, BP50). (D) Grouped HR data. PVN leptin also increased baroreflex control of HR (increased baroreflex maximum, minimum). Closed black squares, black bars, solid line: baseline; closed gray circles, gray bar, solid gray line: 1 hr after PVN leptin or aCSF; open black triangles, open dashed bar, dashed line: 2 hr after PVN leptin or aCSF. *: p<0.05, compared to baseline; †: p<0.05 compared to icv aCSF at the same time.
Figure 3

Effects of DMH and ArcN leptin on LSNA, HR, and MAP, and baroreflex control of LSNA and HR.
(A) Bilateral DMH nanoinjections of leptin (n = 4) enhanced basal LSNA and baroreflex control of LSNA (increased baroreflex gain, maximum, minimum); however, while HR gain was enhanced, basal HR and MAP and other HR baroreflex parameters were not significantly altered. *: p<0.05, compared to baseline control values. (B) Bilateral ArcN nanoinjections of leptin (n = 6) enhanced basal LSNA and baroreflex control of LSNA (increased baroreflex gain and maximum), HR and MAP; however, baroreflex control of HR was unaltered. Closed black bars, solid black squares, solid line: baseline; closed gray bars, closed gray circles, solid gray line: 1 hr after DMH/ArcN leptin; open dashed bar, open black triangle, dashed line: 2 hr after DMH/ArcN leptin. *: p<0.05, compared to baseline control values.
Figure 4
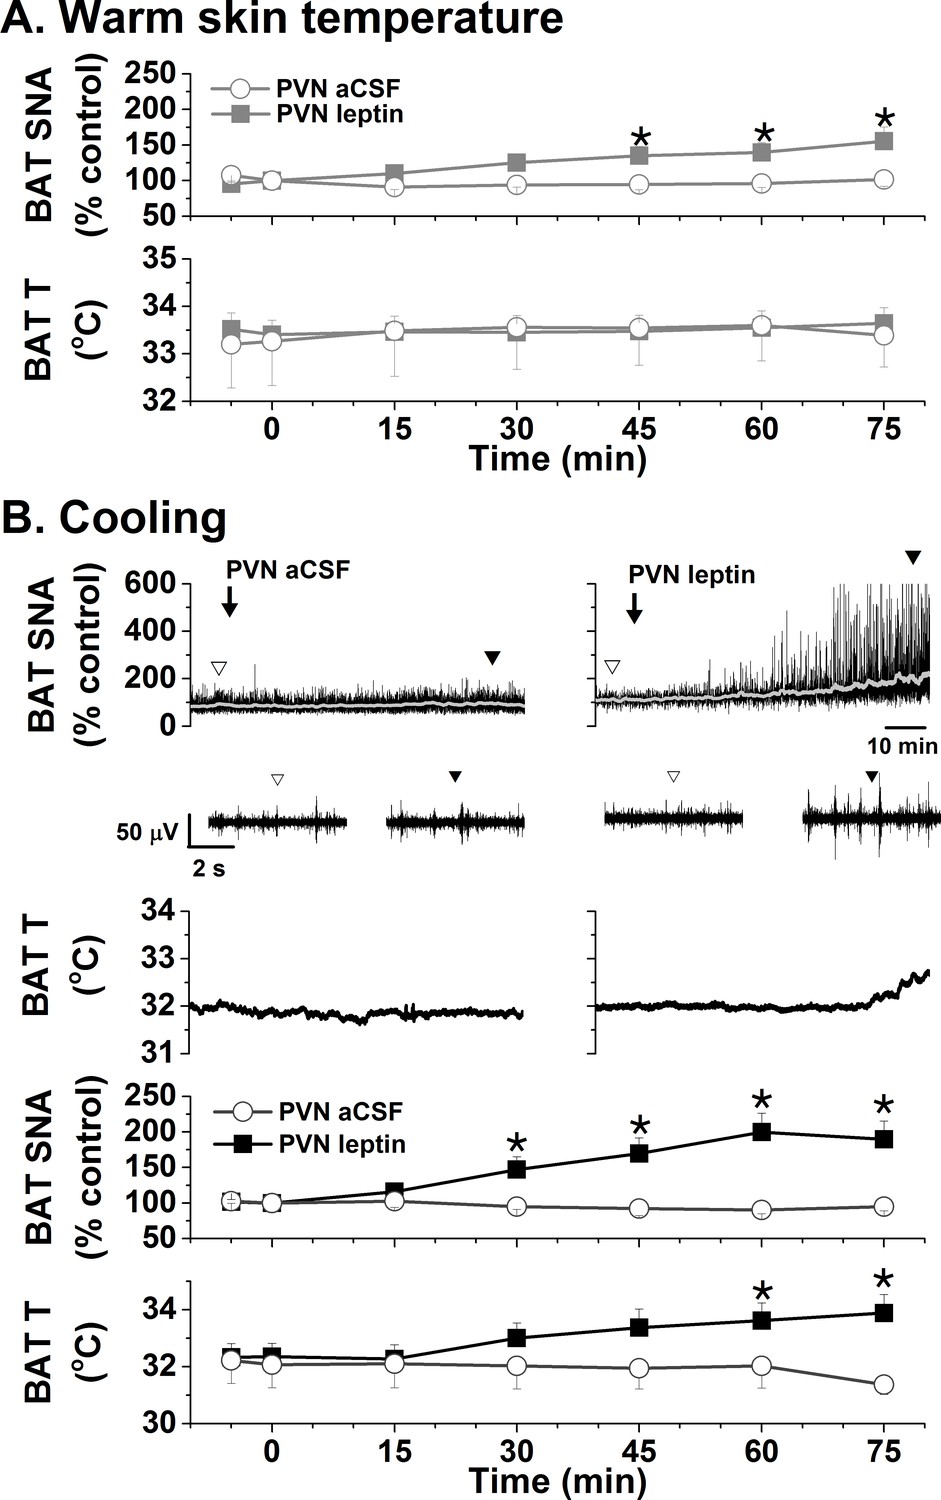
Effects of PVN leptin on BAT SNA in warm and cooled rats.
(A) In rats with warm skin temperature (37.2 ± 0.2°C), PVN leptin (n = 7) increased BAT SNA, without significantly altering BAT temperature. PVN aCSF (n = 4) did not alter these variables. (B) Top, representative experiments; bottom, grouped data. In cooled rats (35.4 ± 0.1°C skin temperature), PVN leptin (n = 6) increased BAT SNA, and BAT temperature. Again, PVN aCSF (n = 4) was without effect. *: p<0.05, compared to baseline control values.
Figure 5
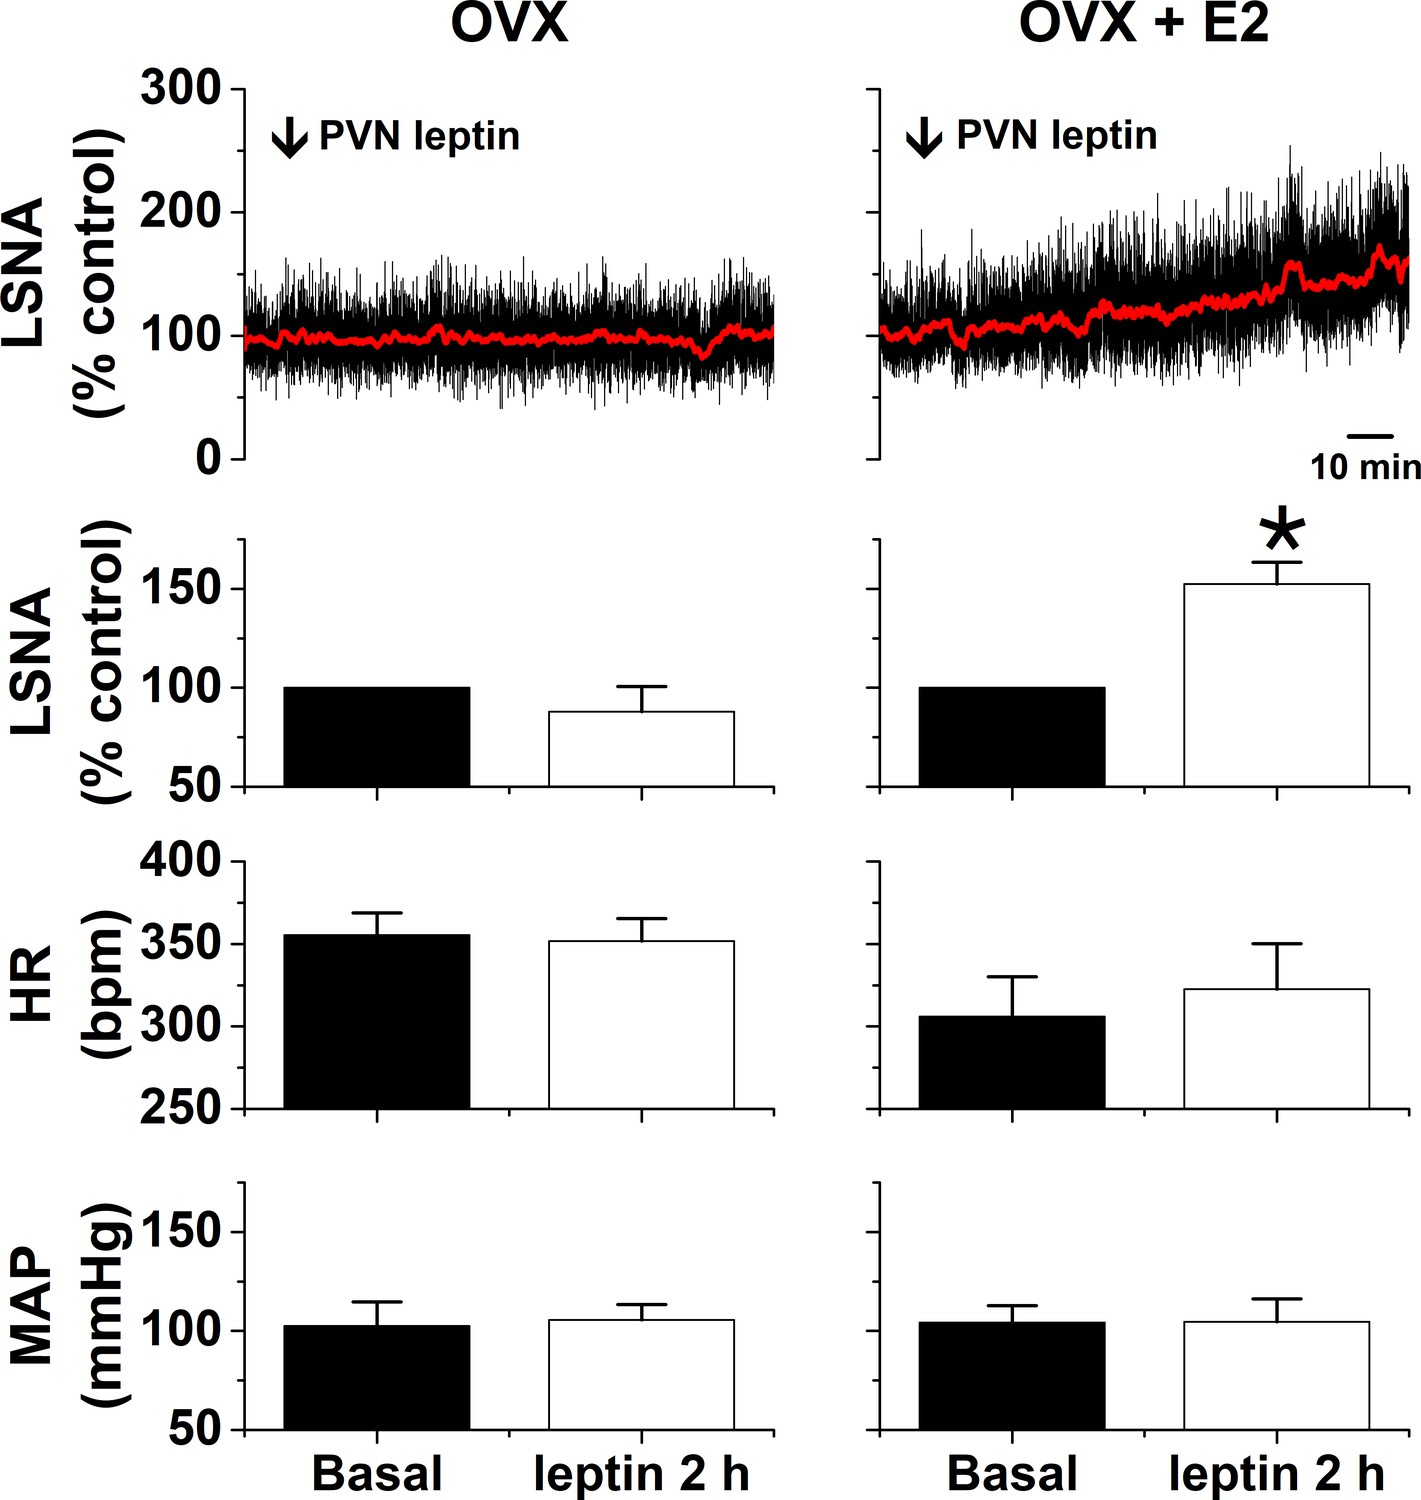
PVN leptin increases LSNA in estrogen (E2)-treated ovariectomized (OVX) female rats (n = 3), but not OVX rats (n = 3).
*: p<0.05, compared to baseline control values.
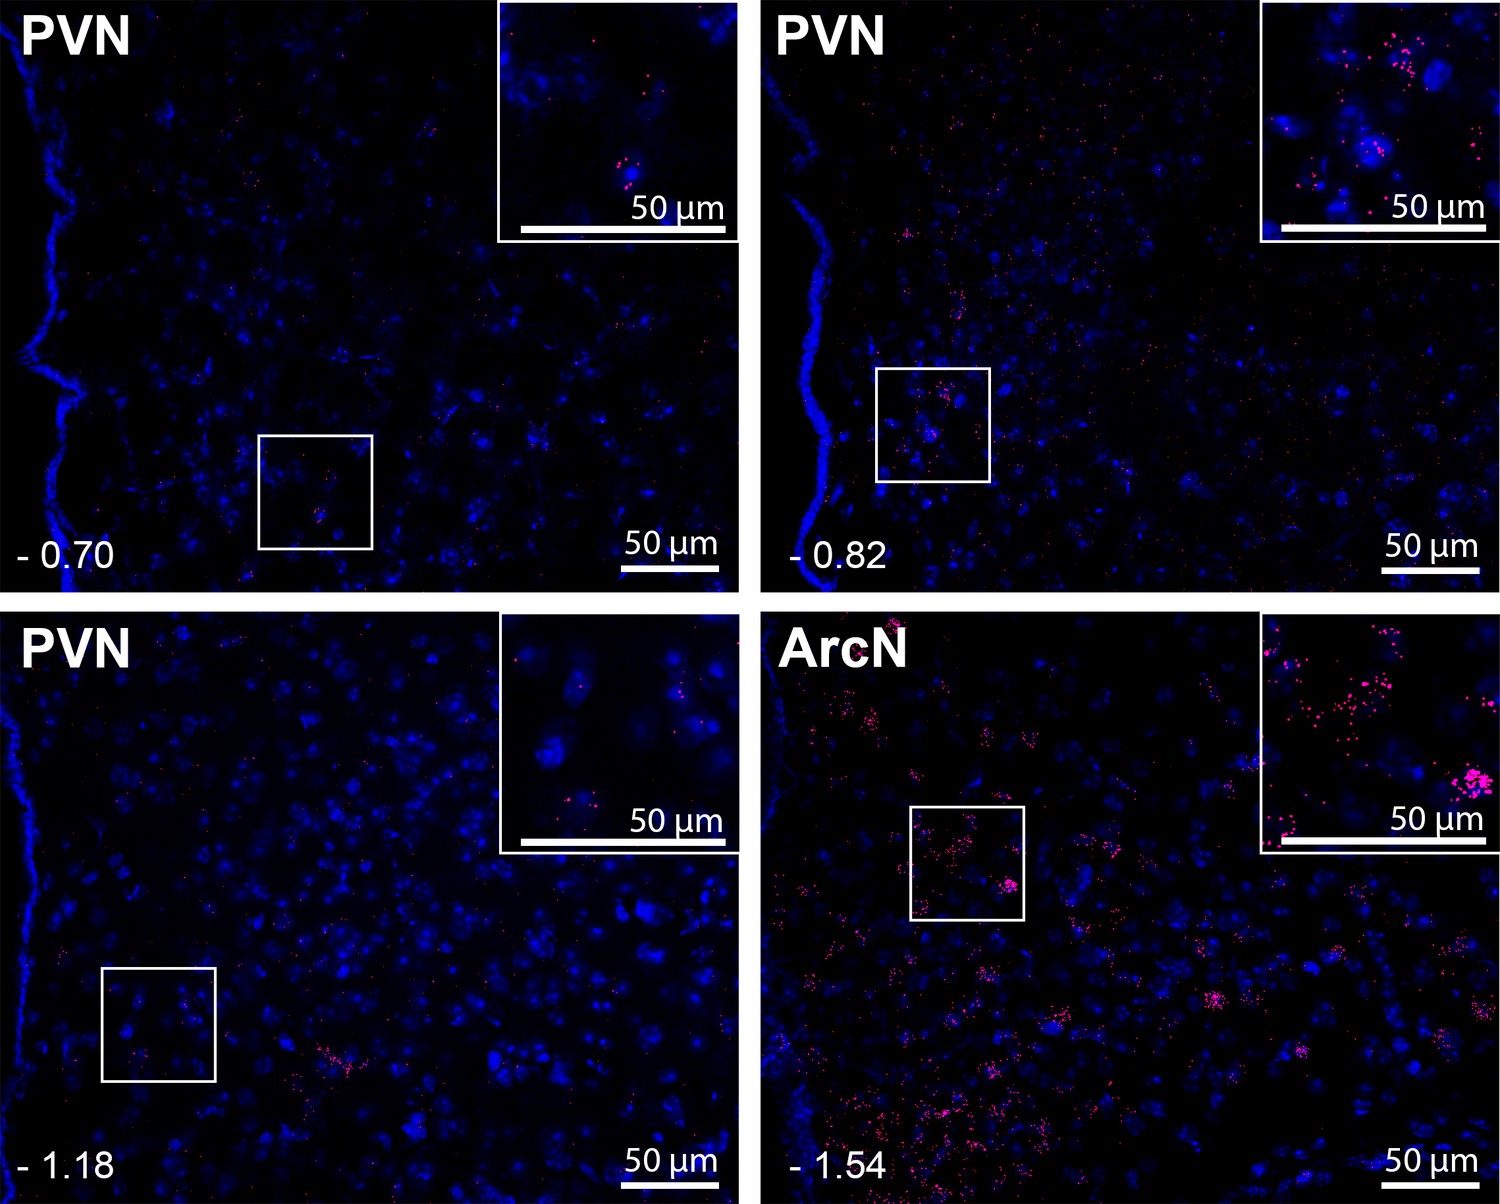
Figure 6

Leptin receptors (LepR) are expressed throughout the PVN in male rats, but at much lower levels than in the ArcN.
Images from a representative rat showing the presence and distribution of LepR in male rats (red puncta) throughout the PVN and ArcN. Individual plates illustrate the changes in LepR distribution from rostral to caudal. PVN (representative from n = 20) and ArcN (from n = 2) levels from bregma are identified in the lower right corner of each micrograph. Higher magnification images are also shown for the PVN (−1.68 mm from bregma) and ArcN (−3.12 from bregma). Given the low LepR expression level in the PVN, red puncta are viewed optimally by using the zoom feature to survey the digital image online.
Figure 7
Leptin receptors (LepR) are expressed throughout the PVN in male mice, but at much lower levels than in the ArcN.
Images are from one representative mouse (from n = 5). PVN and ArcN levels (mm from bregma) are displayed in the lower left corner of each micrograph. Magnified sections are also included as insets in each micrograph. As in the rat (Figure 6), given the low LepR expression level in the mouse PVN, red puncta are viewed best by zooming into the digital image online.
Figure 8
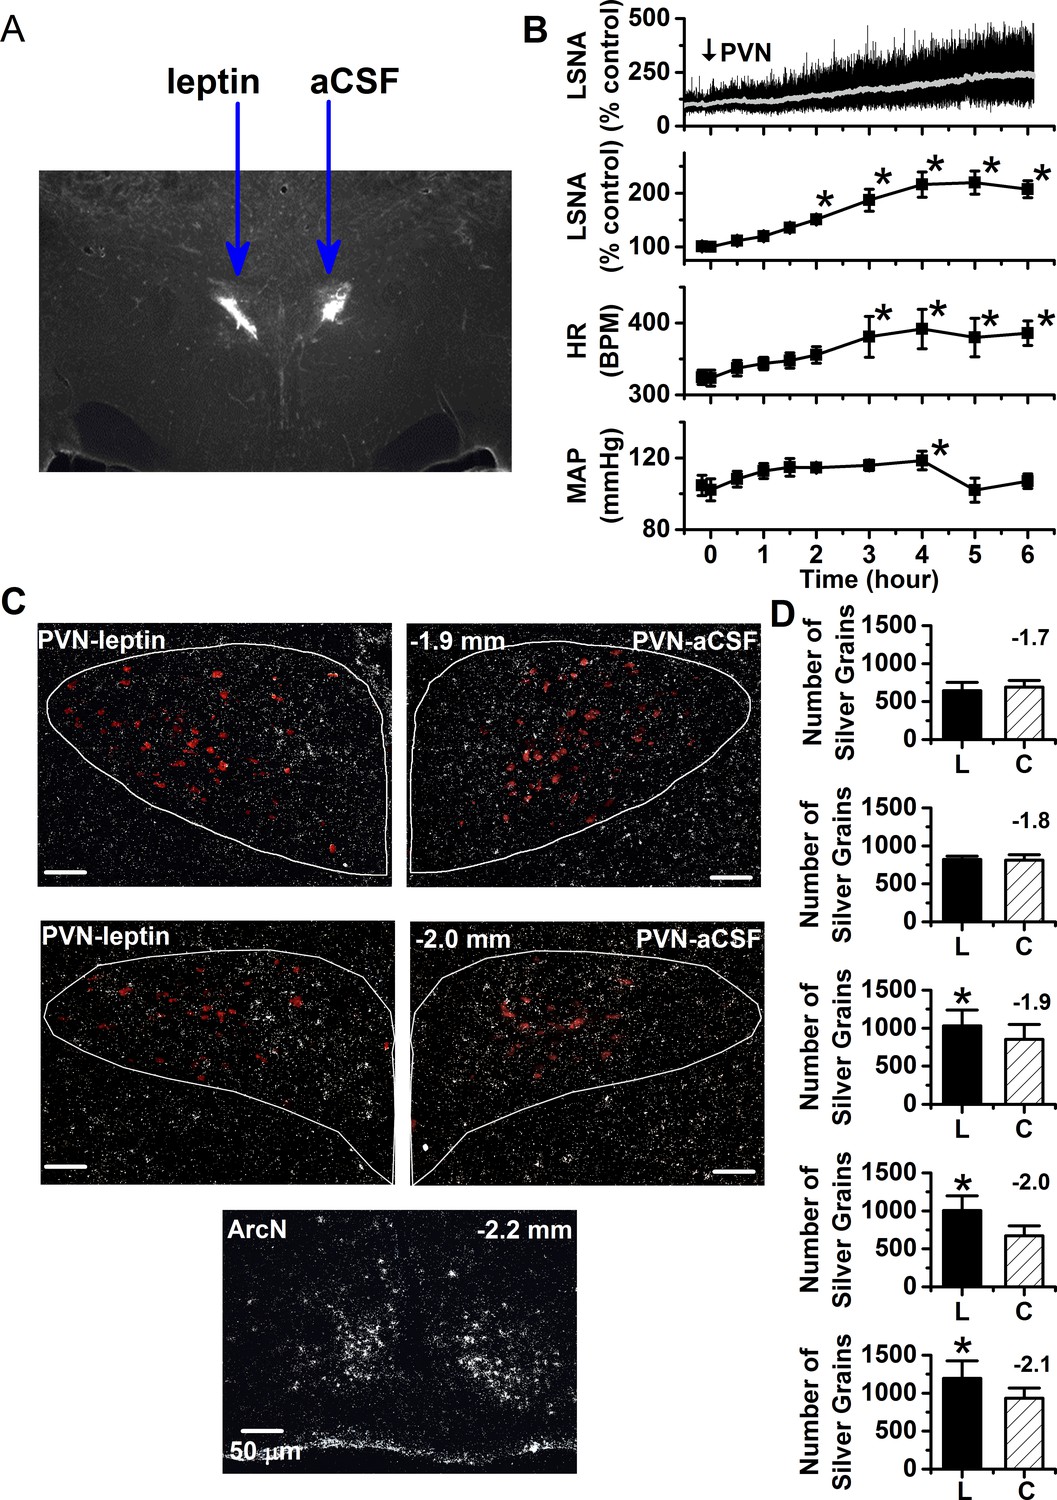
PVN leptin induces the expression of the LepR.
(A) Representative histological image showing PVN injection sites. (B) Top. Representative experiment showing that a unilateral injection of leptin slowly increases LSNA. Bottom. Grouped data (n = 6) showing that a unilateral injection of leptin into the PVN slowly increases LSNA, HR, and MAP. PVN *: p<0.05, compared to baseline control values. (C) Top. Representative ISH images from 2 PVN levels (displayed in upper left corner of the right PVN) showing that nanoinjection of leptin (left side) increases lepr mRNA compared to injection of the aCSF vehicle (right side). Bottom. ArcN lepr mRNA is markedly higher than in the PVN. Oxytocin neurons in red. (D) Grouped data (n = 5) showing that PVN leptin increases LepR ISH signal compared to the contralateral aCSF-injected side. *: p<0.05, compared to contralateral aCSF injected values.
Figure 9
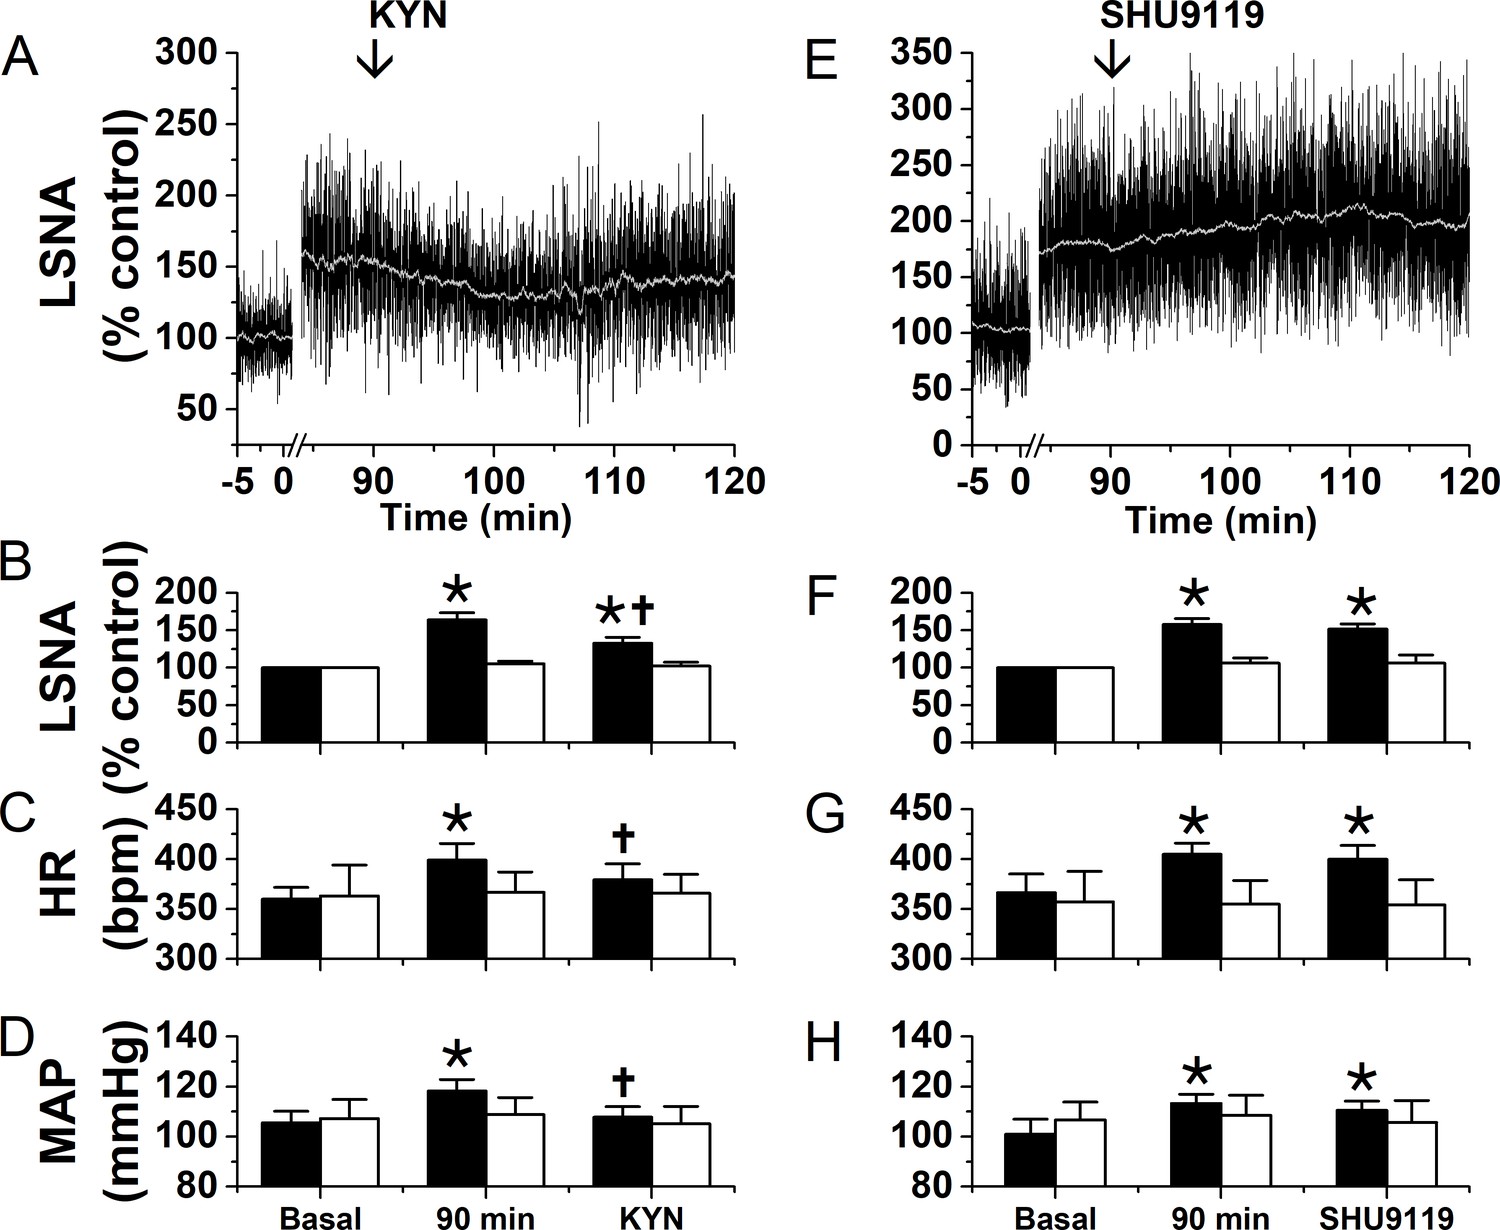
Blockade of ionotropic glutamate receptors with kynurenate (KYN), but not of MC4R with SHU9119, partially reverses the sympathexcitatory effects of PVN leptin.
Left: bilateral PVN KYN injections; Right: bilateral PVN SHU9119 injections. (A) Representative experiment showing that PVN nanoinjections of leptin significantly increased LSNA after 90 min. Subsequently, bilateral PVN nanoinjections of KYN (at arrow) decreased LSNA. Grouped data show that PVN nanoinjections of leptin (black filled bars), but not aCSF (black open bars), significantly increased LSNA (B), HR (C), and MAP (D) after 90 min. Then, bilateral PVN nanoinjections of KYN (n = 6) decreased LSNA (B), HR (C), and MAP (D). PVN injections of KYN after PVN aCSF had no effects (n = 4). (E) Representative experiment showing that PVN nanoinjections of leptin significantly increased LSNA after 90 min. Subsequent bilateral nanoinjections of SHU9119 (at arrow) did not alter LSNA. (F-H) Grouped data show that bilateral PVN nanoinjections of SHU9119 had no effects in rats pretreated with either leptin (black filled bars; n = 4) or aCSF (black open bars; n = 4).*, p<0.05, compared to basal. †, p<0.05, compared with values 90 min after PVN leptin.
Figure 10
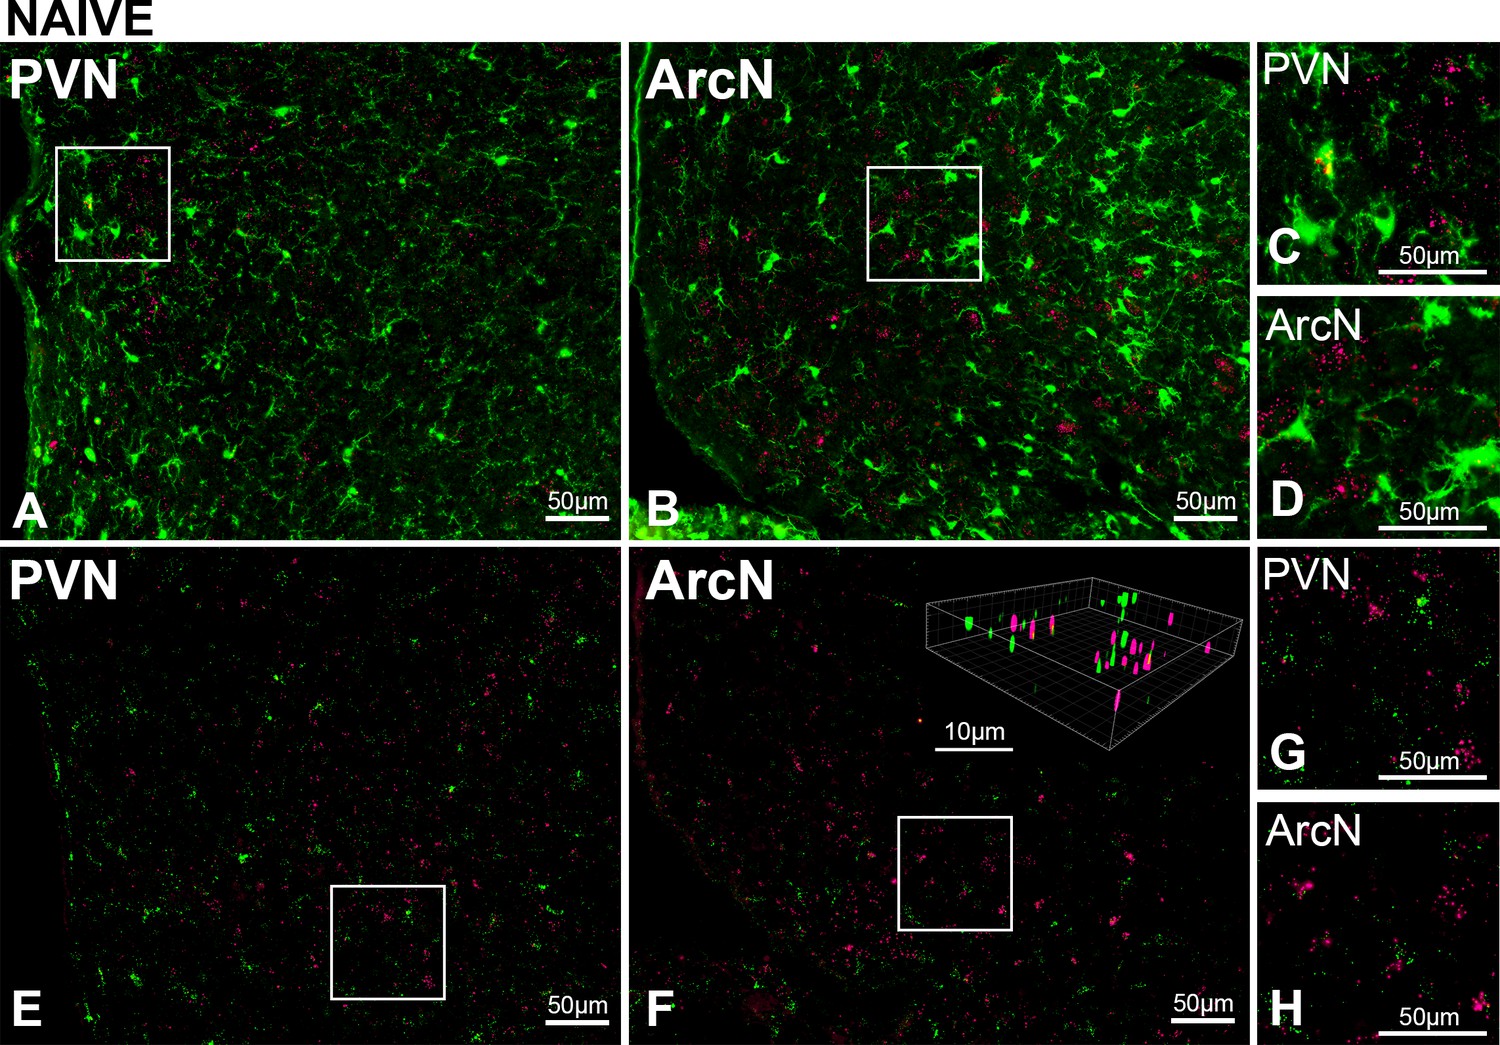
PVN LepR are rarely expressed in PVN microglia in untreated (naïve) male rats.
Top. Representative images (from n = 2) showing Iba-1 (green, ihc) and LepR (red puncta, FISH) in PVN (A) and ArcN (B); higher magnifications of boxed subsections show rare overlap of iba-1 and LepR in the PVN (C), but not ArcN (D). Bottom. Representative images (from n = 4) Iba-1 (green, FISH) and LepR (red puncta, FISH) in PVN (E) and ArcN (F); higher magnifications showing rare overlap of iba-1 and LepR in the PVN (G) and ArcN (H). Insert: 3D image in F constructed using Imaris.
Figure 11
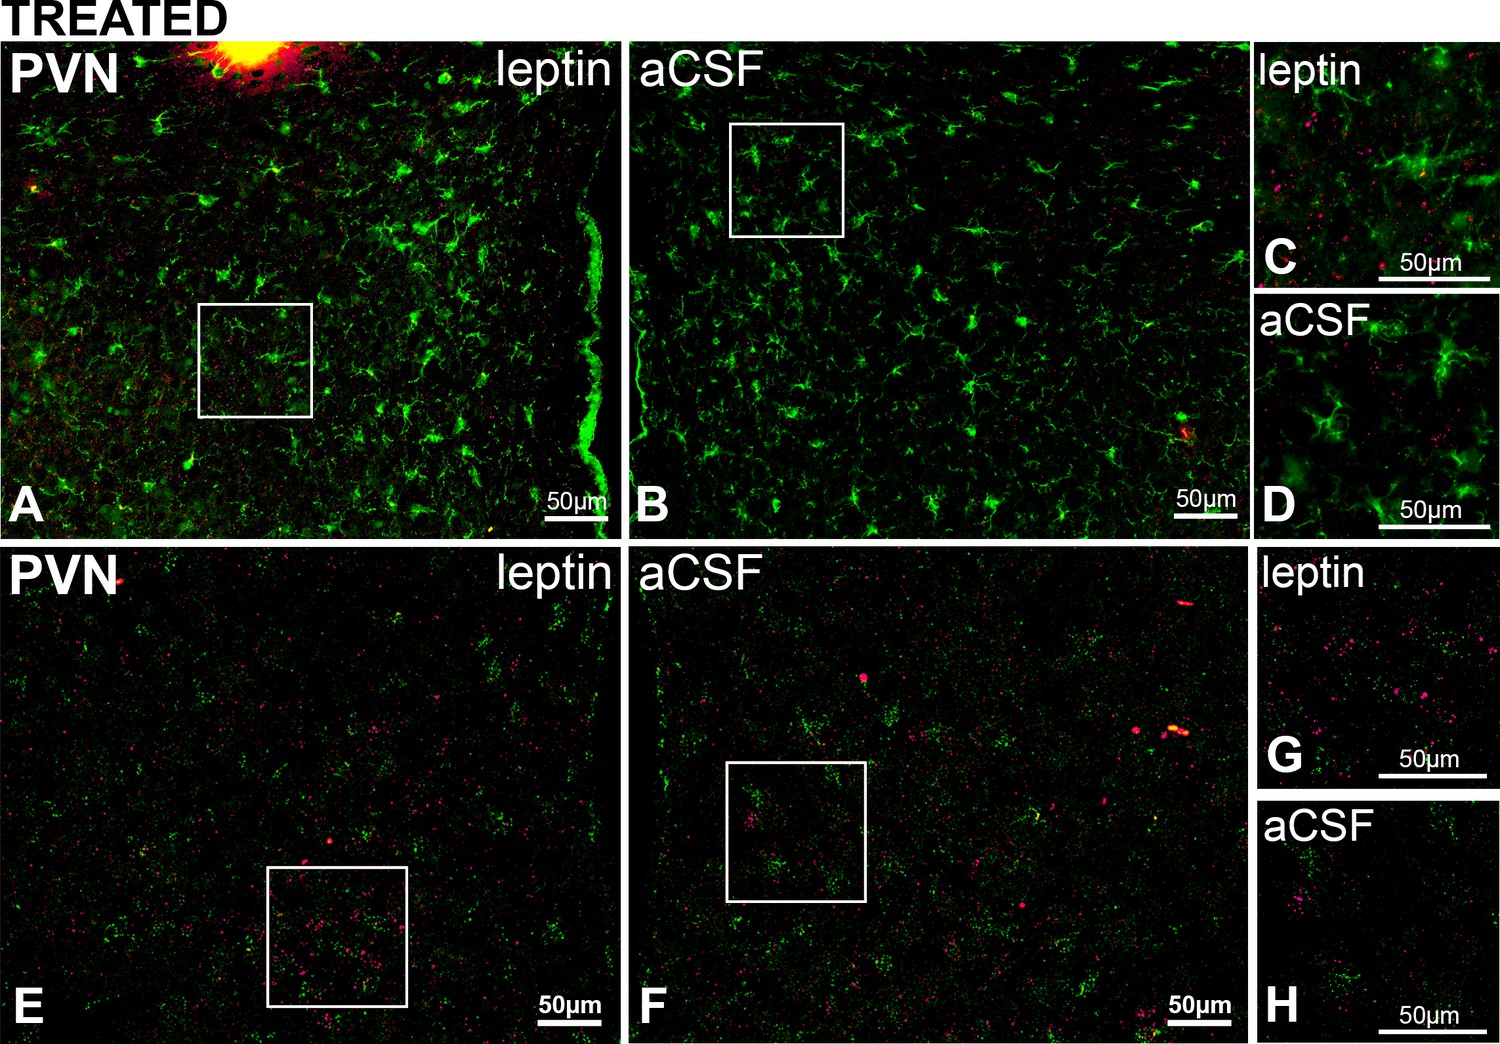
PVN LepR are rarely expressed in PVN microglia in rats treated with Leptin/aCSF.
Top. Representative images (from n = 3) showing PVN Iba-1 (green, ihc) and LepR (red puncta, FISH) in leptin-treated (A) and aCSF-treated (B) rats; right images are magnifications showing rare overlap of iba-1 and LepR from the leptin-treated (C) but not the aCSF-treated (D) sides. Bottom. Representative images (from n = 2) showing PVN Iba-1 (green, FISH) and LepR (red puncta, FISH) in leptin-treated (E) and aCSF-treated (F); G and H are higher magnifications showing limited overlap of iba-1 and LepR in the PVN.
Figure 12

PVN LepR are not expressed in astroglia in naïve or PVN leptin/aCSF treated rats.
Representative images showing GFAP (green, ihc) and LepR (red, FISH) from naïve (A-D, n = 6) or treated (E-H, n = 4) rats. In untreated rats, images from the PVN (A and C) and the ArcN (B and D), are shown. Representative images from the leptin-treated (E and G) and aCSF-treated (F and H) sides of the PVN are shown. C, D, G, and H are higher magnification views of the boxed areas in A, B, E, and F.
Figure 13

PVN leptin does not reduce the sympathoexcitatory response to PVN DHK.
Top, representative experiments; Bottom, grouped data. (A) In untreated rats, bilateral PVN DHK increased LSNA (55 ± 9%) and MAP (p<0.05; n = 6). (B) Two hours after bilateral nanoninjections of aCSF, the response to DHK (26 ± 4%) was reduced (p<0.05; n = 5). (C) After two hours, leptin significantly increased LSNA (p<0.05), but subsequent PVN DHK increased LSNA (28 ± 8%; n = 6) similarly as after PVN aCSF. (D) LSNA was increased two hours after PVN leptin, and did not increase further after PVN nanoinjections of aCSF (n = 5). *: p<0.05, compared to baseline (Pre); †: p<0.05 leptin compared to icv aCSF at the same time; ‡: p<0.05, DHK after aCSF compared to DHK after untreated (naïve).
Figure 14
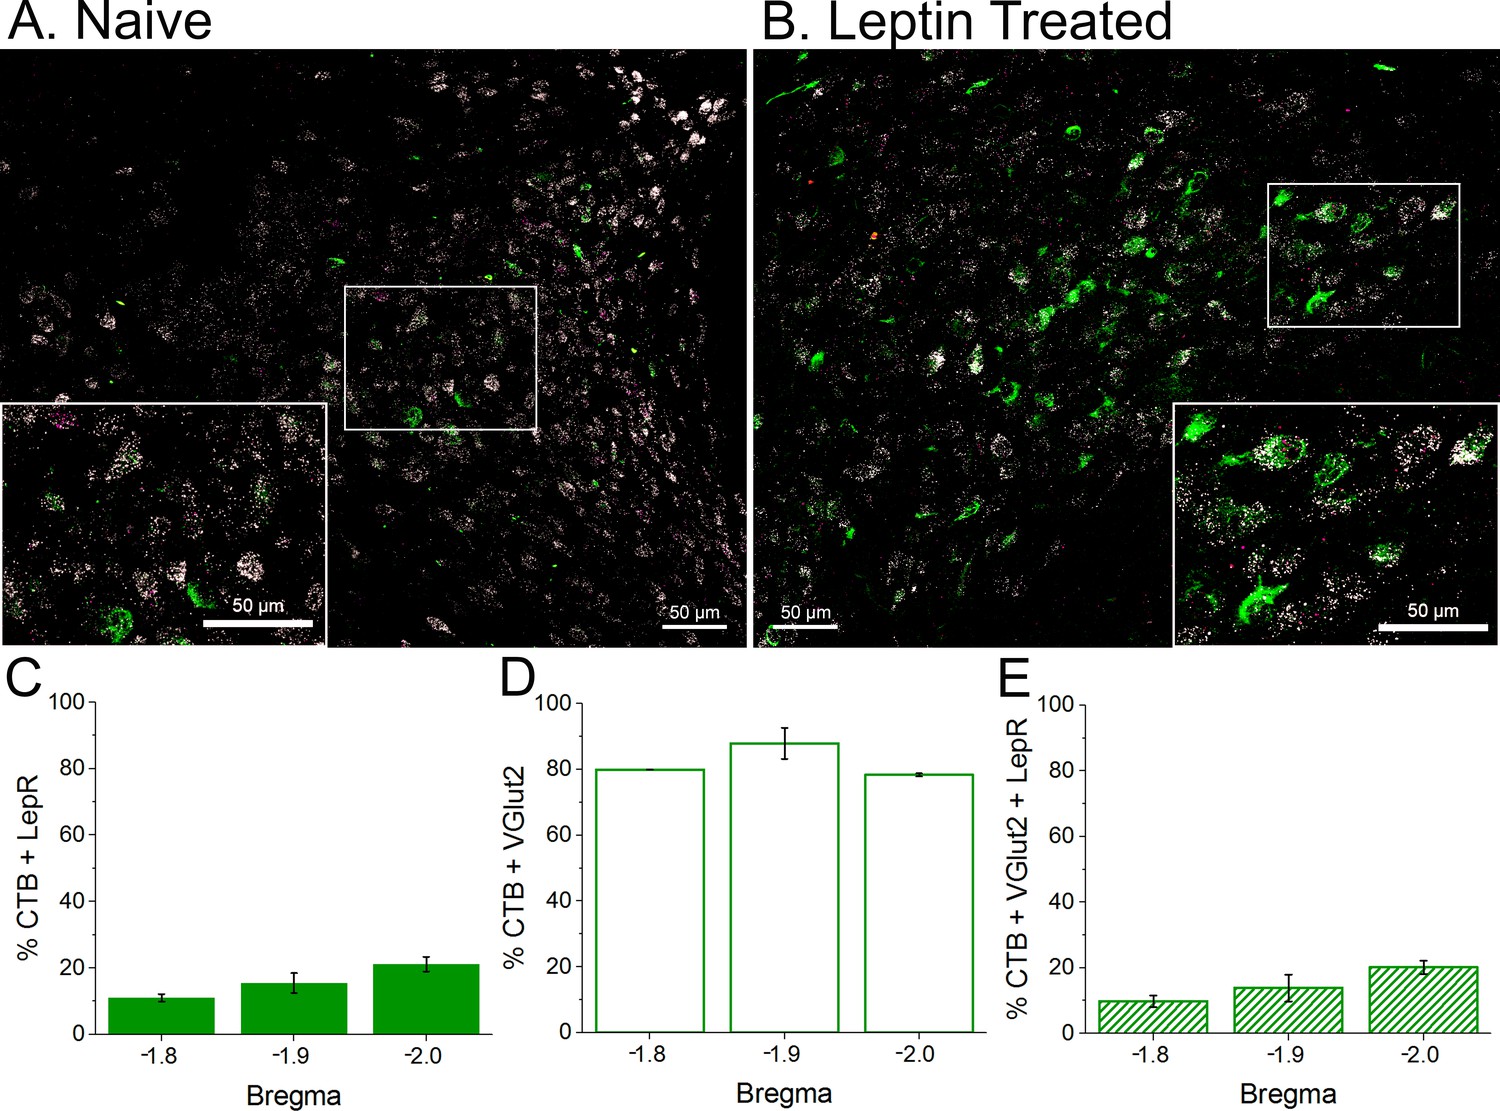
LepR are expressed in glutamatergic neurons, some of which project to the rostral ventrolateral medulla (RVLM; contain CTB).
Top. Representative sections from an untreated rat (A) and leptin-treated rat (B) showing that LepR (Red punta, FISH) are expressed in glutamateric neurons (white; FISH), some of which contain the retrograde tracer CTB (green; project to the RVLM). Bottom. Three animals were quantified (2 leptin/aCSF treated and one untreated). (C) A small fraction (10–20%) of CTB containing neurons express the LepR. (D) Most CTB containing neurons are glutamatergic. (E) A similar fraction of CTB neurons that express the LepR also express VGlut2. Therefore, essentially all neurons that contain CTB and express LepR are glutamatergic.
Figure 15
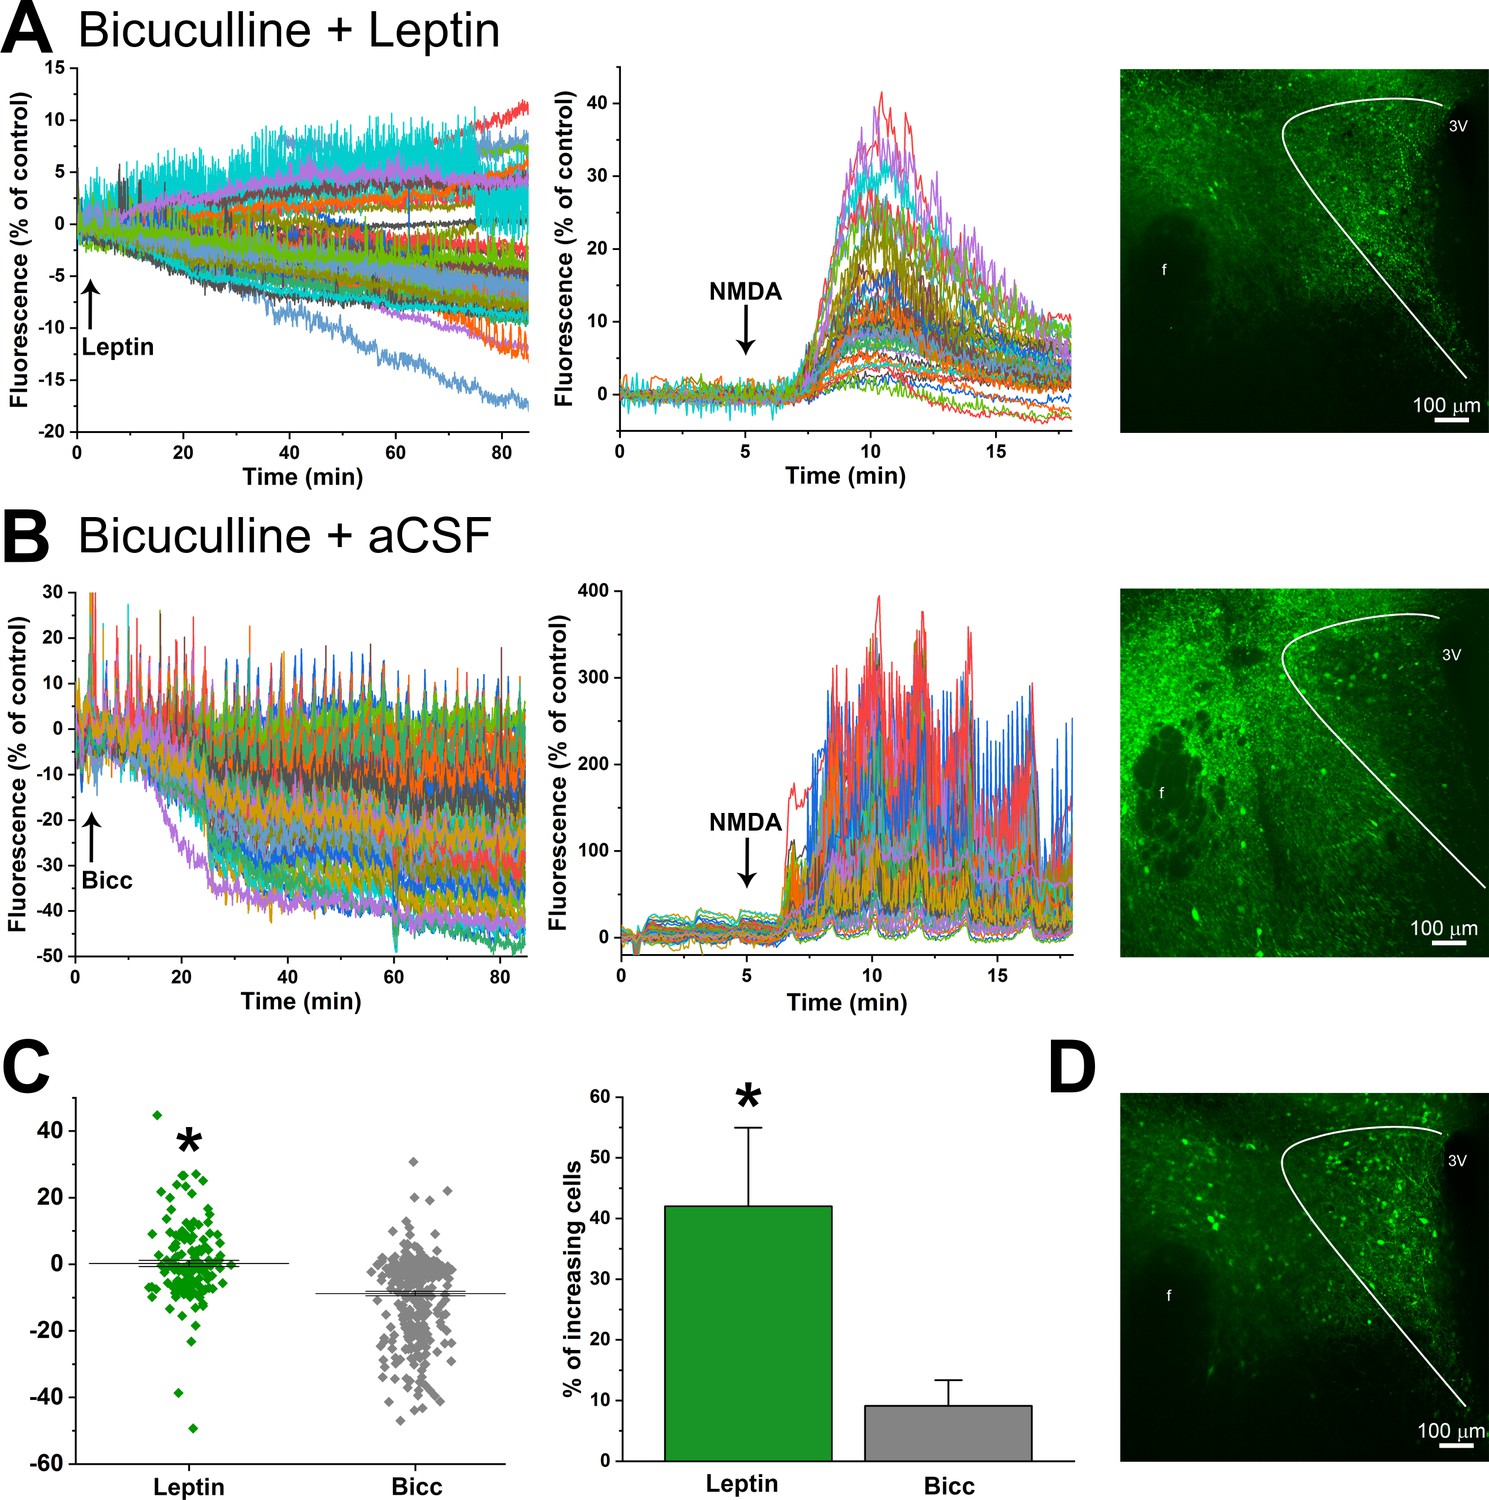
Leptin activates PVN glutamatergic neurons.
(A) Left. Representative experimental tracing showing that PVN glutamatergic neuronal activity (GCaMP-6 fluorescence) both increases and decreases following treatment of a PVN slice with leptin+bicuculline (after 15 min pretreatment with bicuculline). Middle. Same experiment showing response to NMDA. Right. Maximum projection of fluorescence after 90 min treatment with leptin. (B) Representative experimental tracing showing that PVN glutamatergic neuronal activity (GCaMP-6 fluorescence) largely decreases following treatment of a PVN slice with aCSF+bicuculline (after 15 min pretreatment with bicuculline). Middle. Same section showing response to NMDA. Right. Maximum projection of fluorescence after 105 min treatment with bicuculline. (C) Summary of neuronal responses from leptin+bicuculline (Leptin, n = 4) and aCSF+bicuculline (Bic; n = 3) treated slices. Left summarizes all neurons from all experiments. *: p<0.0001, unpaired t-test. Right shows the percentage of neurons exhibiting increased GCaMP-6 fluorescence from all experiments (n = 4 leptin; n = 3 Bic). *: p<0.05, unpaired one-tailed t-test. (D) Maximum projection of the slice in A after treatment with NMDA.
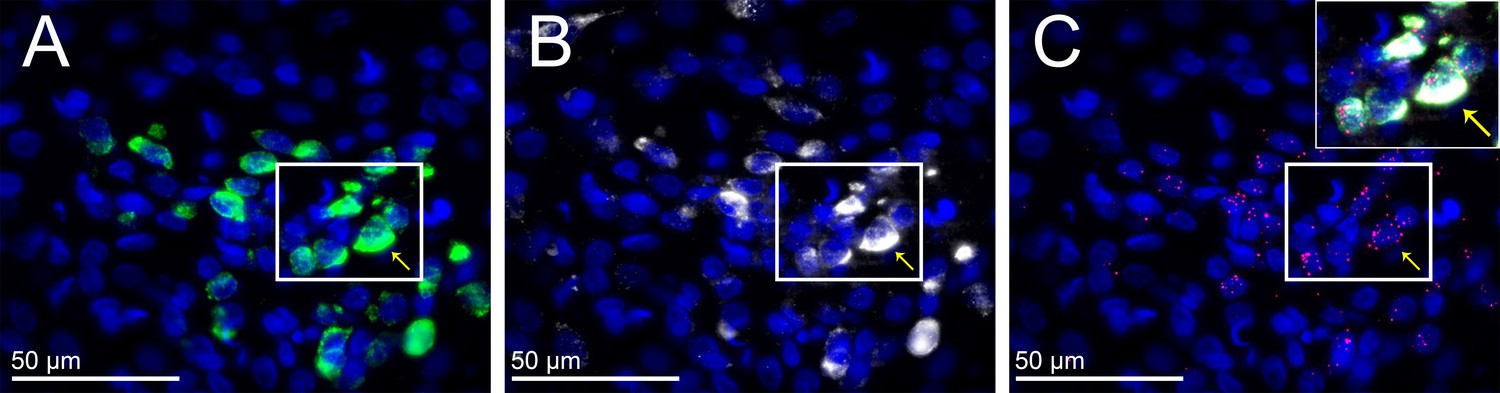
Figure 16
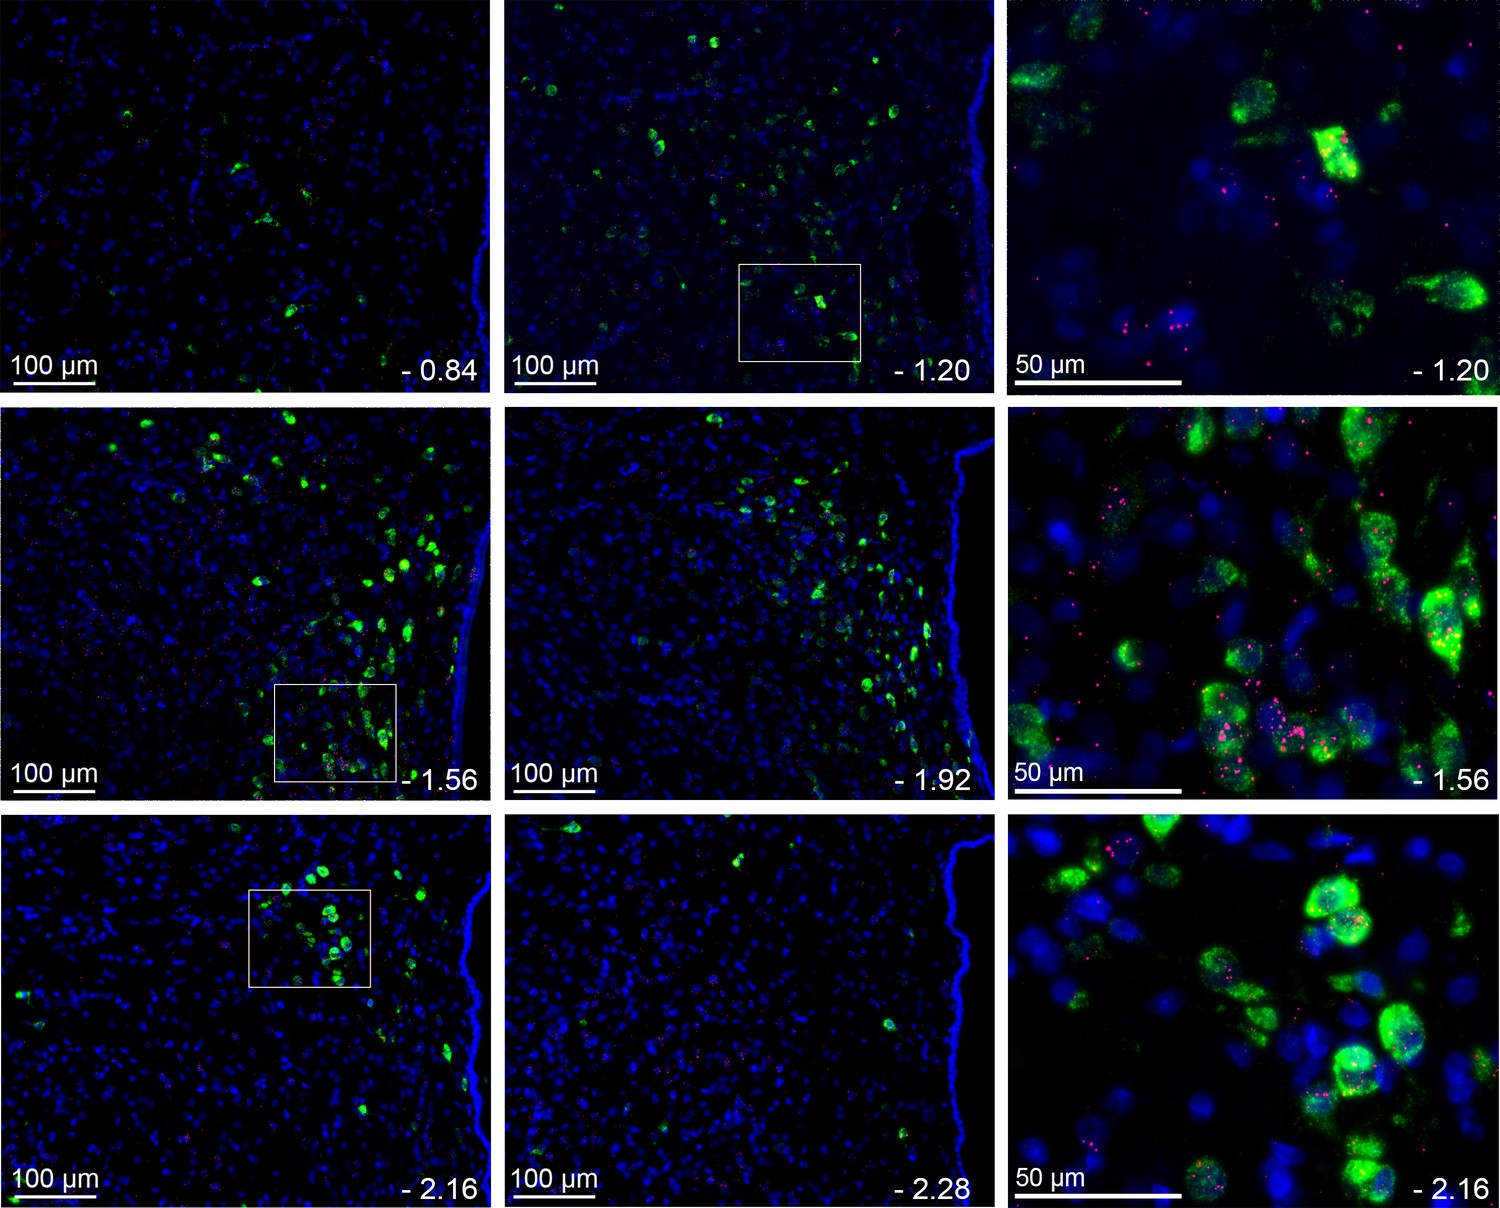
LepR are commonly, but not exclusively, found in TRH neurons.
Representative images (n = 3) from several levels of the PVN (−0.84 to −2.28 from bregma) showing the expression of LepR (red puncta) in TRH neurons (green). Blue is DAPI nuclear stain. Right panel shows higher magnification from selections indicated by white boxes to the left.
Figure 17
LepR are expressed in TRH neurons that project to the RVLM.
Representative image from one rat that received RVLM CTB showing that many CTB-containing PVN neurons (white) express TRH (green) and the LepR (red puncta), although CTB-containing but TRH negative, and TRH-containing but CTB negative, neurons were also observed. (A) TRH expression; (B) CTB-labeled neurons; (C) LepR. Insert is composite of the boxed areas in A, B, and C. Arrows point to a TRH neuron that projects to the RVLM (contains CTB) and expresses the LepR.
Figure 18
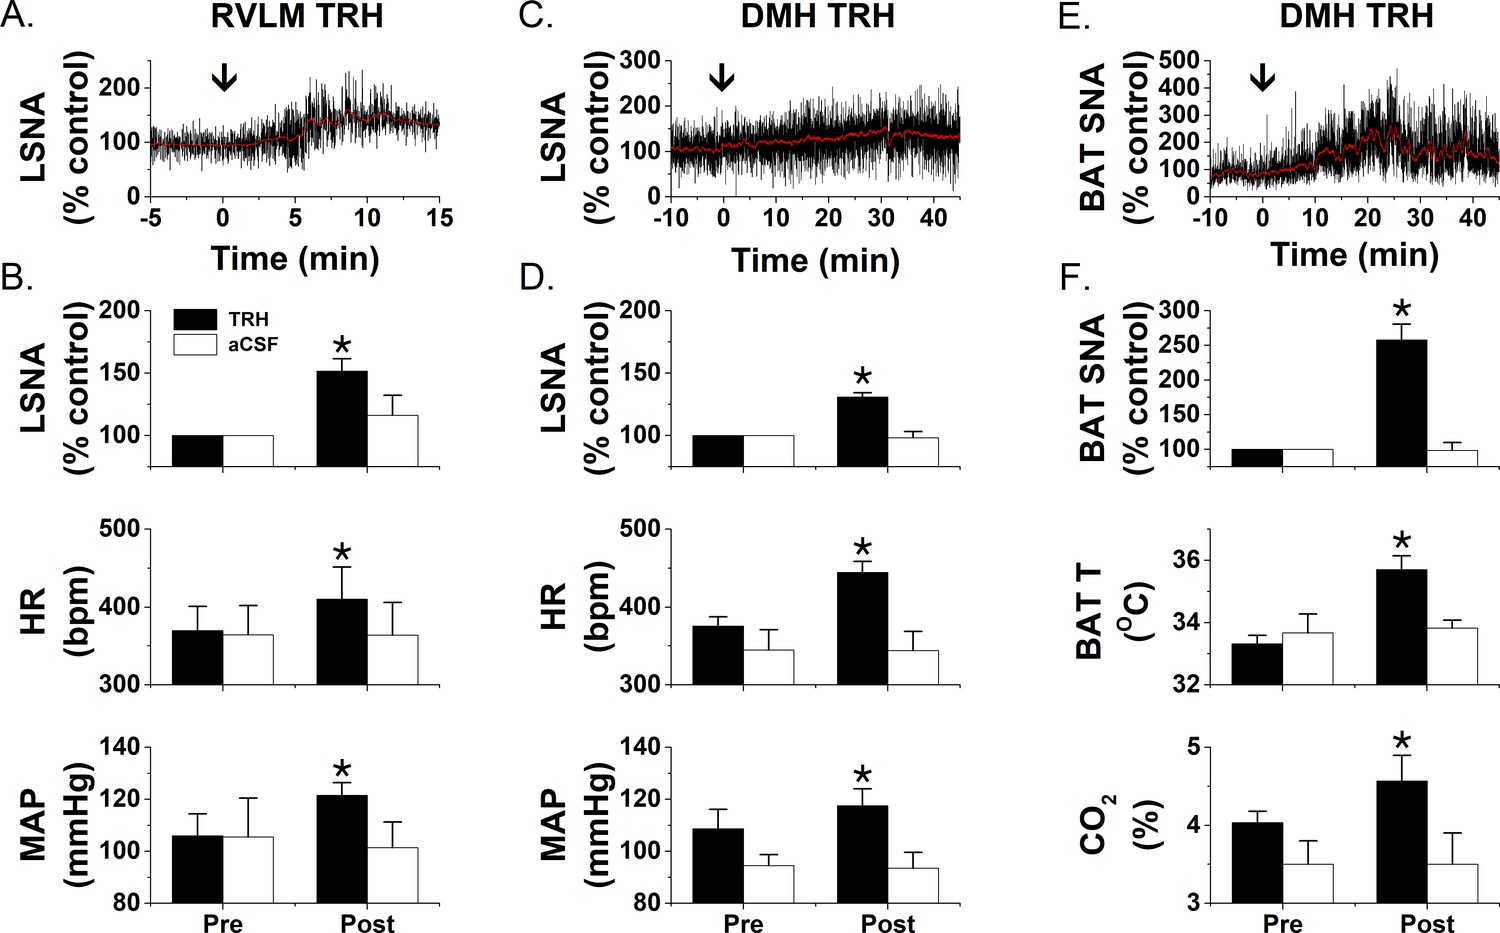
TRH increases LSNA and BAT SNA.
Nanoinjections of TRH into the RVLM (A and B; n = 5) increase LSNA, HR, and MAP, whereas RVLM injections of aCSF (B; n = 3) have no effects. Nanoinjections of TRH into the DMH increase LSNA, HR, and MAP (C and D; n = 6) as well as BATSNA, BAT temperature, and expired CO2 (E and F; n = 5). Again, DMH aCSF injections (D and F; LSNA, n = 6; BATSNA, n = 4) were without effect. *: p<0.05 compared to basal.
Figure 19

Models that summarize the results and hypothesize potential roles during fasting or obesity.
(A) Summary of findings. (B and C) Models illustrating hypothesized role of PVN LepR in the regulation of the HPT axis and LSNA and BATSNA with fasting and obesity.
See text for details.
Figure 20
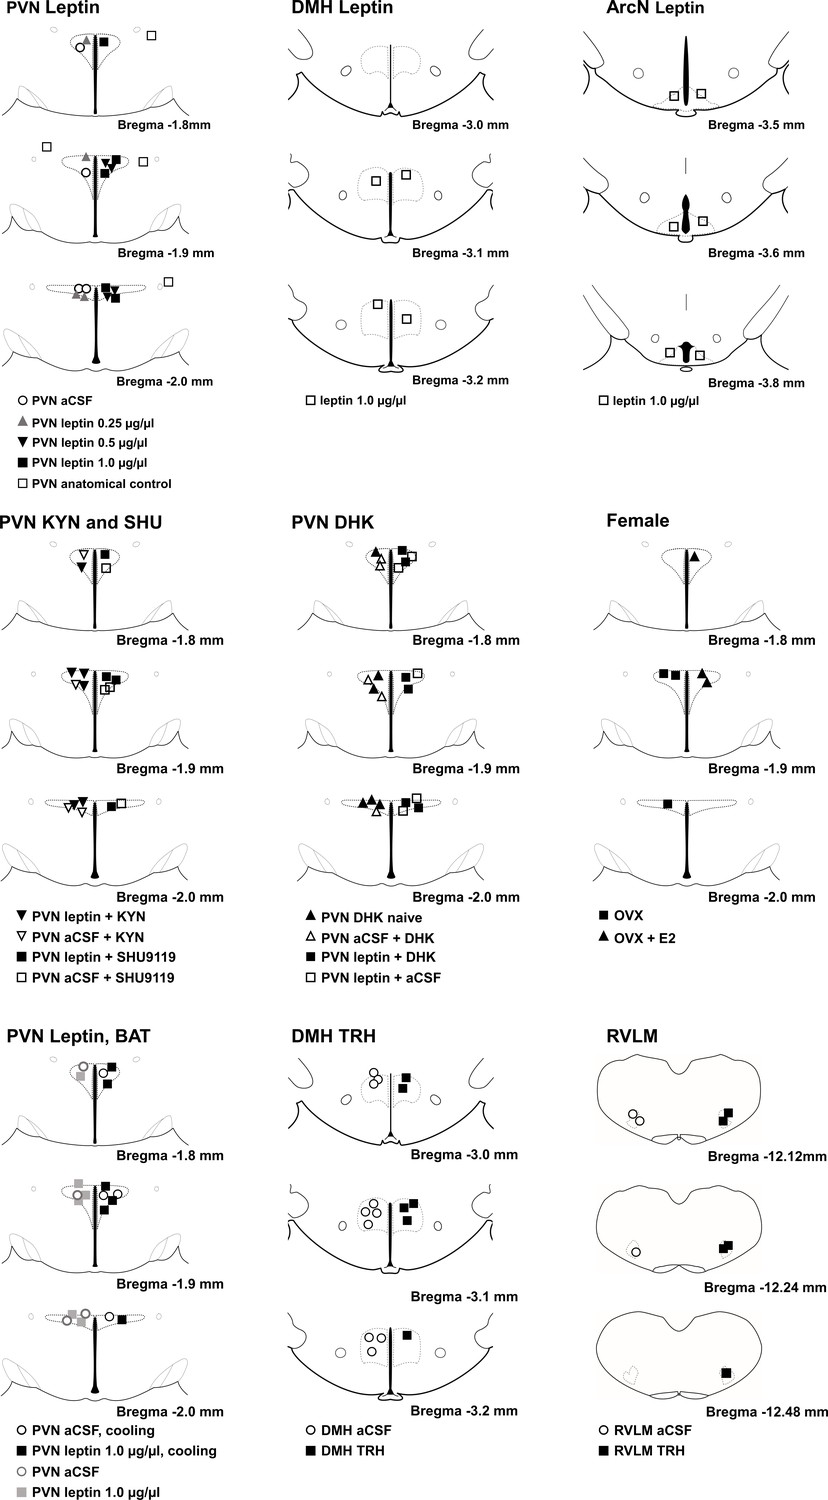
Histological maps (adapted from Paxinos and Watson, 2007) illustrating nanoinjection sites.
Tables
Key resources table
| Reagent type (species) or resource | Designation | Source or reference | Identifiers | Additional information |
|---|---|---|---|---|
| Genetic reagent (M. musculus) | VGlut2-cre; C57BL/6J Slc17a6tm2(cre)Lowl | Jackson Laboratory; reference (Vong et al., 2011) | Stock #: 016963 RRID:IMSR_JAX:016963 | |
| Antibody | Monoclonal mouse anti-GFAP | Sigma | Catalog#: G3893 RRID:AB_477010 | Ihc (1:500) |
| Antibody | Goat anti-mouse 488 | Jackson ImmunoResearch | Catalog #: 115-545-166 RRID:AB_2338852 | Ihc (1:1500) |
| Antibody | Rabbit anti-iba1 | Wako | Catalog #: 019–19741 RRID:AB_839504 | Ihc (1:250) |
| Antibody | Goat Anti-Cholera Toxin B Subunit | List Biological Laboratories, Inc | Catalog #: 703 | Ihc (1:250) |
| Antibody | Donkey Anti-Rabbit IgG (H+L) | Jackson ImmunoResearch | Catalog #: 711-545-152 RRID:AB_2313584 | Ihc (1:1000) |
| Antibody | Donkey anti goat 488 | Jackson ImmunoResearch | Catalog #: #705-545-147 RRID:AB_2336933 | Ihc (1:1000) |
| Recombinant DNA reagent | pAAV.Syn.Flex.GCaMP6s.WPRE.SV40 | Douglas Kim and GENIE project | RRID:Addgene_100845 | |
| Commercial assay or kit | RNAScope Fluorescent Multiplex Kit | ACDBio | Catalog #: 320850 |
Table 1
RNAScope probes (ACDBio).
| Target | Species | Catalog # |
|---|---|---|
| LepR | Rat (Norway) | 415951-C2 |
| Vglut2 | Rat (Norway) | 317011-C2 |
| Iba1 | Rat (Norway) | 457731-C3 |
| TRH | Rat (Norway) | 406621-C1 |
| Positive Control (Polr2a (C1) and PPIB (C2), UBC (C3) | Rat (Norway) | 320891 |
| Negative Control (DapB (of Bacillus subtilis strain) | Rat/mouse | 320871 |
| Positive Control | Mouse | 320881 |
| LepR | Mouse | 402731-C2 |
Additional files
Download links
A two-part list of links to download the article, or parts of the article, in various formats.
Downloads (link to download the article as PDF)
Open citations (links to open the citations from this article in various online reference manager services)
Cite this article (links to download the citations from this article in formats compatible with various reference manager tools)
Leptin increases sympathetic nerve activity via induction of its own receptor in the paraventricular nucleus
eLife 9:e55357.
https://doi.org/10.7554/eLife.55357


