Bi-fated tendon-to-bone attachment cells are regulated by shared enhancers and KLF transcription factors
- Department of Molecular Genetics, Weizmann Institute of Science, Israel
- Environmental Genomics and Systems Biology Division, Lawrence Berkeley National, United States
- Department for BioMedical Research (DBMR), University of Bern, Switzerland
- Life Sciences Core Facilities, Weizmann Institute of Science, Israel
- Department of Immunology, Weizmann Institute of Science, Israel
- Department of Molecular Cell Biology, Weizmann Institute of Science, Israel
- Department of Human Evolutionary Biology, Harvard University, Department of Human Evolutionary Biology, United States; Broad Institute of Harvard and MIT, United States
- U.S. Department of Energy Joint Genome Institute, Lawrence Berkeley National Laboratory, United States
- School of Natural Sciences, University of California, Merced, United States
Figures
Figure 1 with 4 supplements
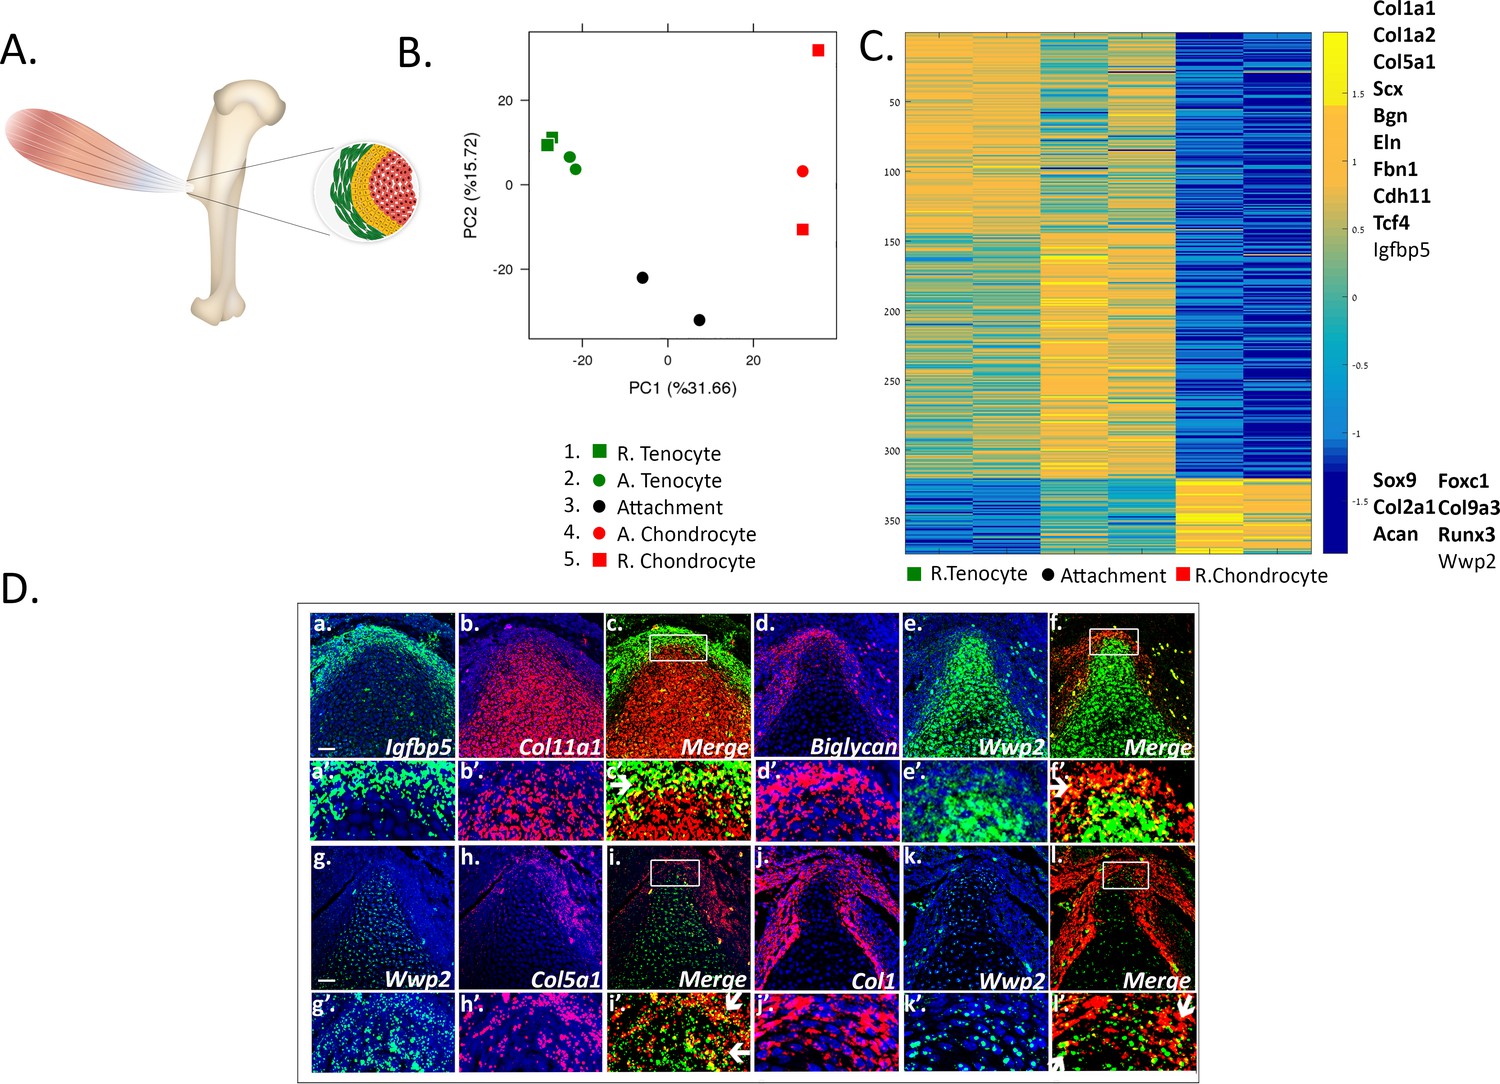
Transcriptomic analysis of tendon-to-bone attachment site domains at E14.5.
(A) A scheme of tendon-to-bone attachment site of the murine deltoid tuberosity. (B) Principal component analysis (PCA) of bulk MARS-seq data from E14.5 attachment site samples. The x-axis (PC1) shows the highest variance among the samples. Interestingly, the samples are arranged according to their anatomical locations. ‘R’ (samples 1 and 5) stands for remote and ‘A’ (samples 2 and 4) is for adjacent. The y-axis (PC2) shows that tenocytes and chondrocytes are closer to one another, while attachment cells (black circle) were found to be remote from both of them, that is with higher variance, suggesting a unique gene expression profile. (C) Heatmap of gene expression profiles at E14.5 shows 374 selected genes that exhibited differential expression between tenocytes and chondrocytes and were also expressed by attachment cells. Color bar (−1.5-0-1.5) represents the log-normalized counts standardized per gene, as yellow is higher than the mean (0) and blue is lower than the mean. Attachment cells display a gradient of gene expression profiles, reflecting their function as a transitional tissue. The upper cluster contains genes highly expressed in tenocytes (e.g. Co1a1, Col1a2, Col5a1, Scx, Bgn), whereas the lower cluster contains genes highly expressed in chondrocytes (e.g. Sox9, Col2a1, Acan). Top list on the right contains genes found to be expressed in attachment cells and in tenocytes, whereas bottom list contains genes expressed in attachment cells and chondrocytes; genes in bold type are known tenocyte or chondrocyte markers. D (a-l). Double-fluorescent ISH for mRNA of tendon (Igfbp5, biglycan, Col5a1, Col1a1) and cartilage (Col11a1 or Wwp2) genes shows that attachment cells (in yellow, shown by arrows) exhibit an in vivo gene expression profile that combines tendon and cartilage genetic programs. a-l: X20 magnification, scale bar: 50 µm; a’-l’: magnification of upper panels.
Figure 1—figure supplement 1
Analysis of the embryonic tendon-to-bone attachment site in a triple-transgenic mouse line.
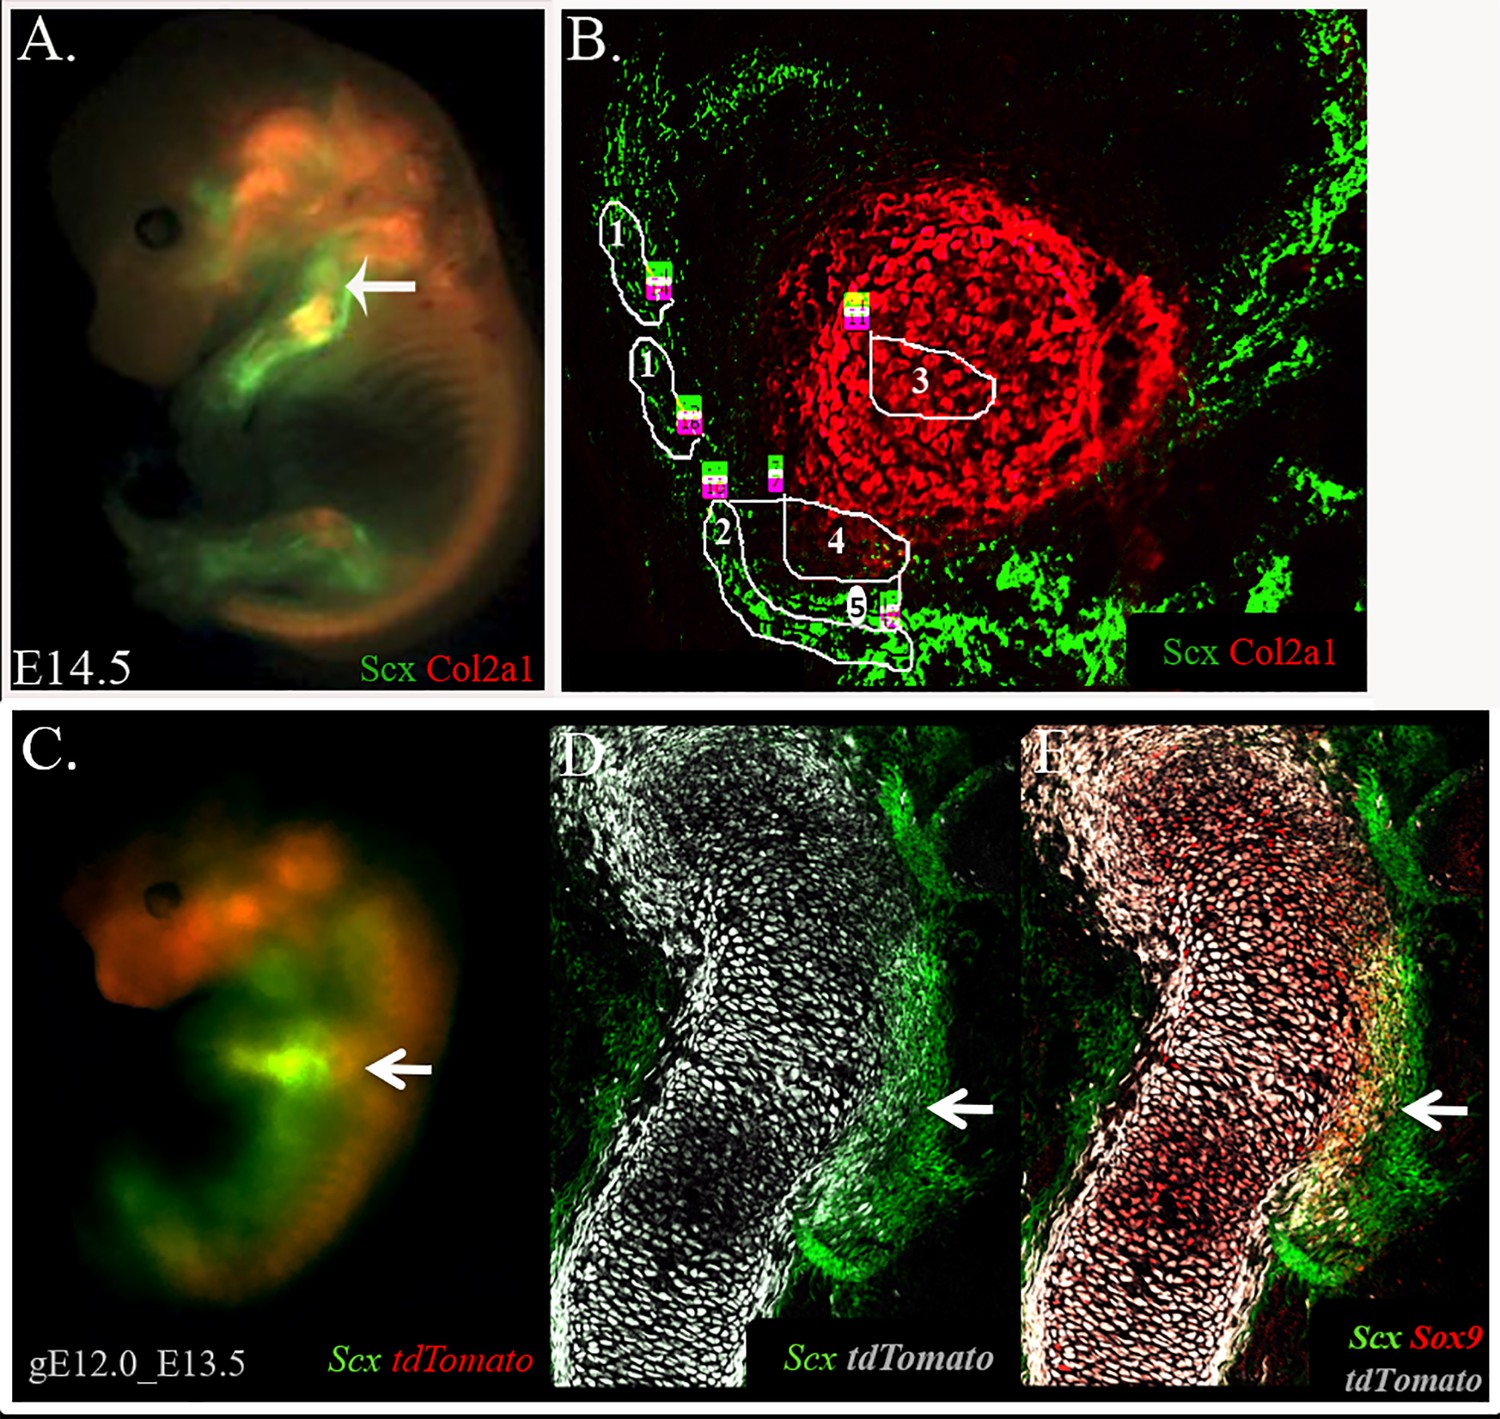
(A) The attachment site at the prominent deltoid tuberosity and greater tuberosity (arrow) of the humerus was analyzed in E14.5 Col2a1-Cre-tdTomato-Scx-GFP transgenic mice. The fluorescent reporter tdTomato labeled Col2a1-expressing chondrocytes, whereas GFP fluorescently labeled Scx-expressing tenocytes. Unexpectedly, the two reporters failed to label the attachment cells that were located in between these two populations. Nevertheless, the borders between tendon and attachment cells and between cartilage and attachment cells were clearly demarcated. (B) Cells from five distinct areas in and around the attachment site were isolated for RNA sequencing using LCM: 1, remote tenocytes; 2, adjacent tenocytes; 3, remote chondrocytes; 4, adjacent chondrocytes; 5, attachment cells. The attachment site was divided into three cellular compartments as follows: adjacent chondrocytes, defined as the bone eminence protruding from the primary cartilaginous element of the humerus and marked by Col2a1; tendon, defined as cells marked by Scx-GFP; and attachment cells, which were located between the two other compartments and were negative to both reporters. Two additional groups of cells were isolated to serve as controls, namely cells from tendon and cartilage tissues that were distant from the attachment site, referred to in the following as remote tenocytes and remote chondrocytes (part of the primary cartilaginous element of the humerus), respectively. (C–E) Attachment cells at the humeral deltoid tuberosity and greater tuberosity of E13.5 Sox9-CreER-tdTomato-Scx-GFP embryos were isolated by FACS for ATAC-seq analysis. The cells connecting tendon to bone are Scx-Sox9 double-positive. Embryos were harvested at E13.5 following tamoxifen administration at E12.0 (gE12).
Figure 1—figure supplement 2
Transcriptomic analysis of tendon-to-bone attachment site domains at E14.5.
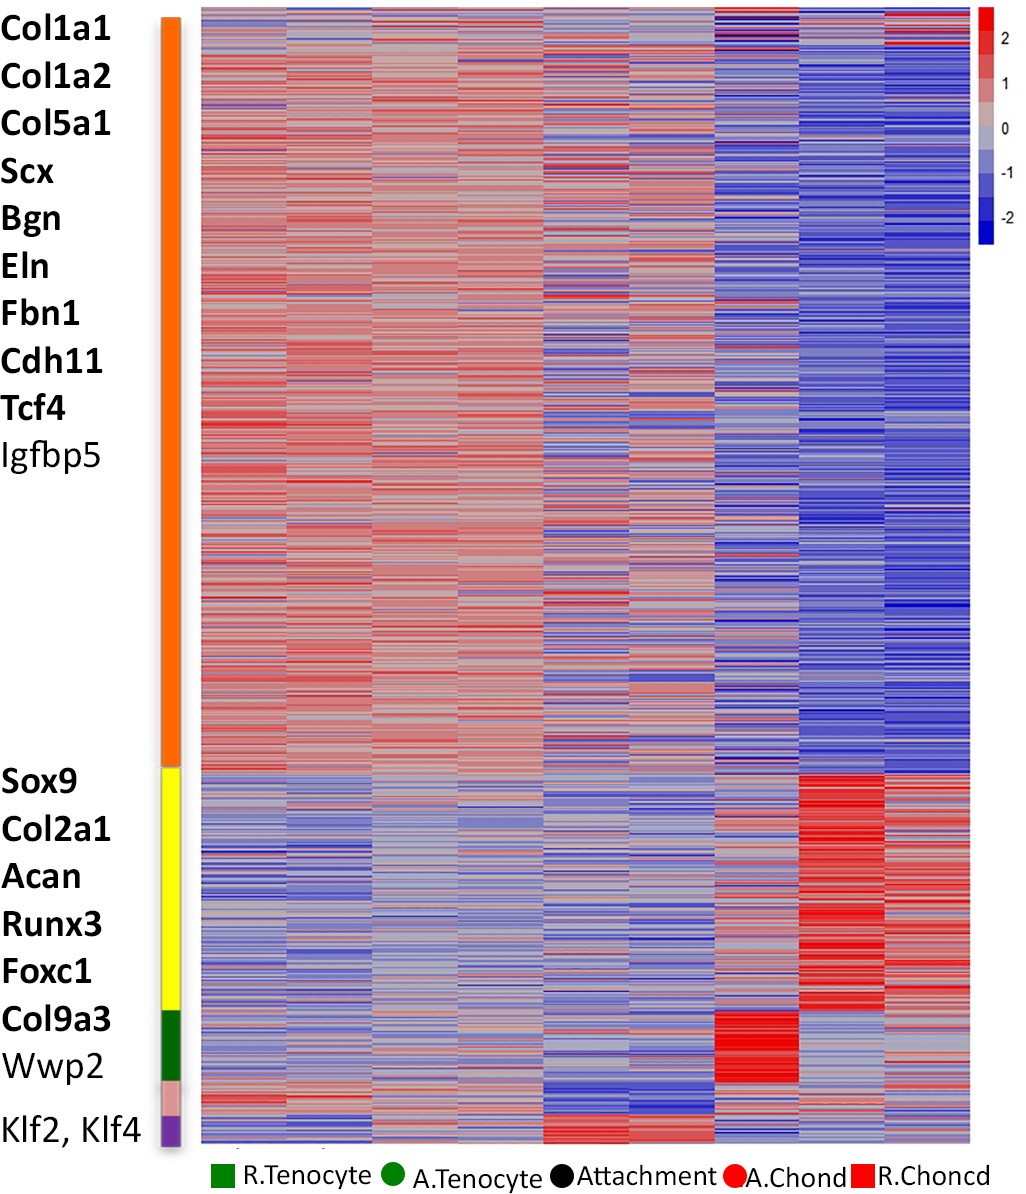
Heat map of attachment site compartments, arranged along the horizontal axis of the map according to their original anatomical positions. Using CLICK, 865 genes were grouped into five clusters by expression values, which are shown after standardization. Blue-red color bar (-2-0-2) represents the log-normalized counts standardized per gene, as red is higher than the mean (0) and blue is lower than the mean. The upper cluster contains genes highly expressed in tenocytes (e.g. Co1a1, Col1a2, Col5a1, Scx), whereas cluster 2 contains genes highly expressed in chondrocytes (e.g. Sox9, Col2a1, Acan). Cluster 3 contains genes with high expression in chondrocytes adjacent to attachment cells. Clusters 4 and 5 show genes that were low or high in attachment cells, respectively. Genes in bold were expressed in attachment cells in addition to tenocytes or chondrocytes.
Figure 1—figure supplement 3
Upregulated gene expression in attachment cells.
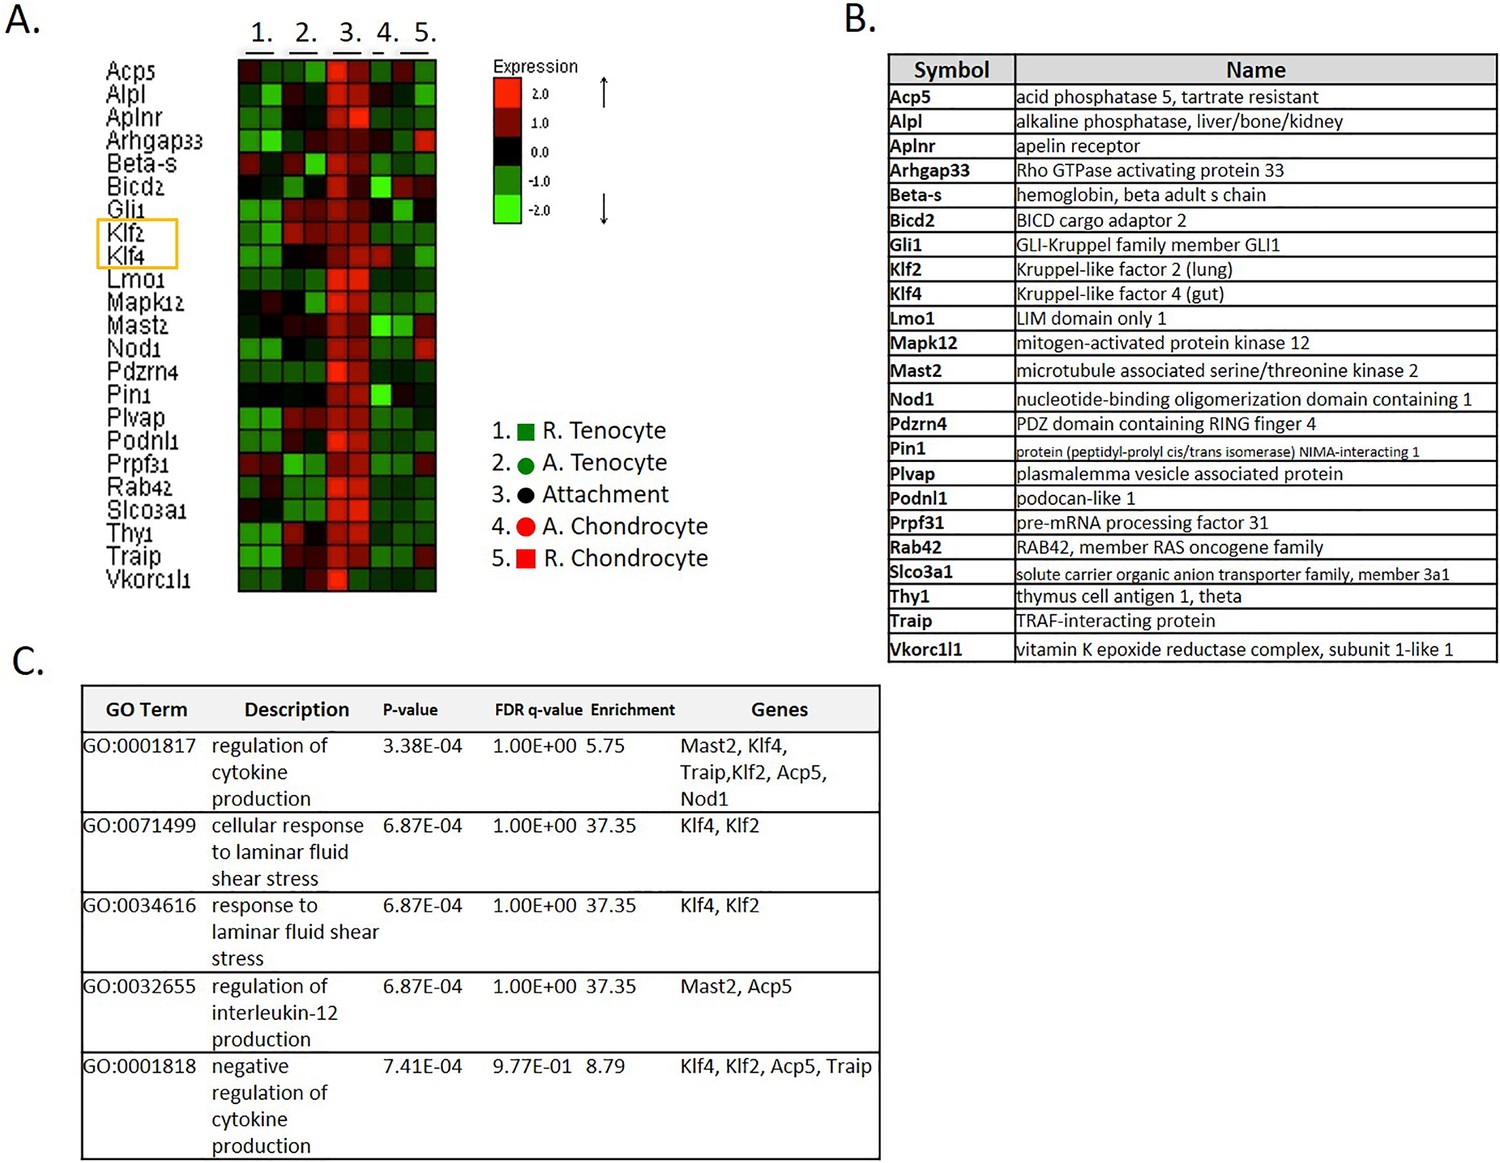
(A) Cluster 5 of the transcriptomic analysis (Figure 1—figure supplement 2) contains 23 genes that were upregulated in E14.5 attachment cells. These genes, such as Klf2 and Klf4, may act as regulators of the forming tendon-to-bone attachment site. (B) List of cluster 5 genes, including differentiation markers such as Thy1, regulators of bone for example Acp5 and Alpl, protein kinases such as Mapk12 and Mast2, and signaling molecules such as Nod, Traip, Aplnr and others. (C) GO analysis of cluster 5 genes.
Figure 1—figure supplement 4
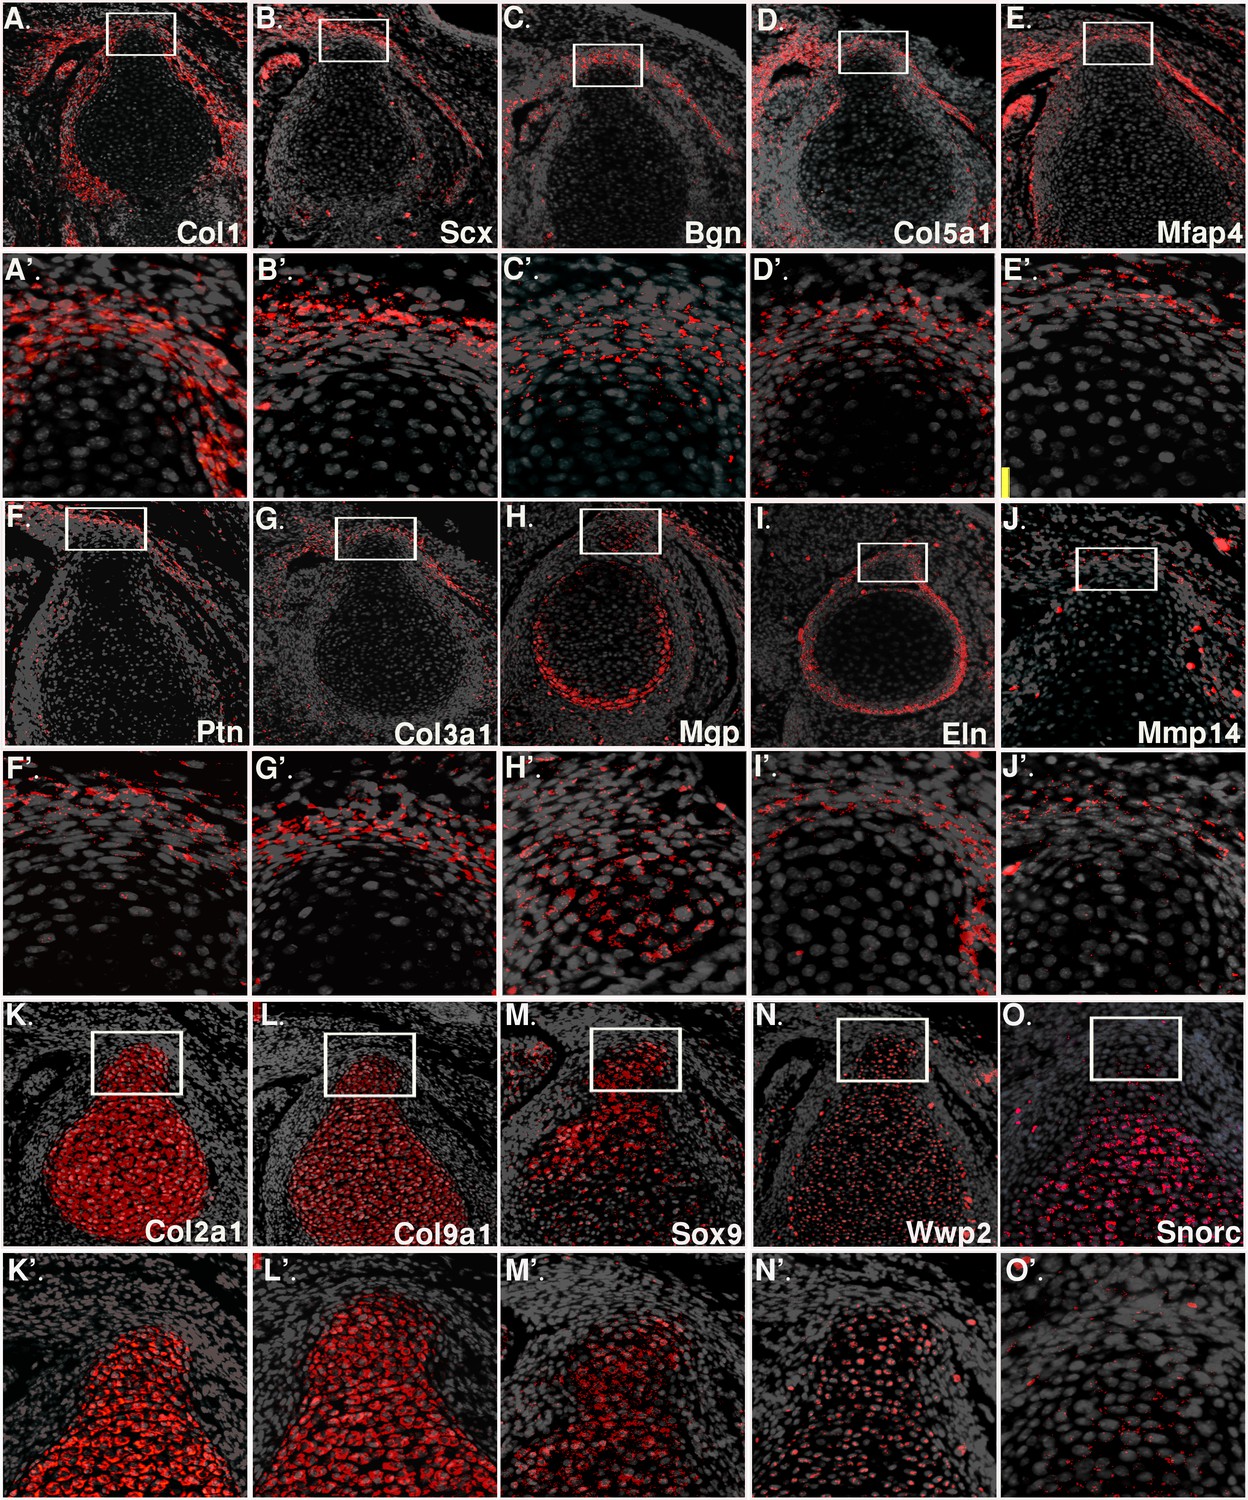
Validation of RNA sequencing results by fluorescent in situ hybridization analysis.
Fluorescent in situ hybridization for tendon (Col1a1, Scx, biglycan (bgn), Col5a1, Mfap4, Ptn, Col3a1, Mmp14), and cartilage (Col2a1, Col9a1, Sox9, Wwp2, or Snorc) genes was performed on E14.5 transverse sections of the humerus, on the background of DAPI staining (gray). In situ hybridization for ECM genes Mgp and Eln (H,I) shows high expression in the attachment site and perichondrium, as indicated by bulk MARS-seq results. A-E, F-J, K-O: X20 magnification; A’-E’, F’-J’, K’-O’: magnification of upper panels.
Figure 2 with 1 supplement

Attachment cells co-express tendon and cartilage genes at the single-cell level.
(A) scRNA-seq analysis of E13.5 Sox9+/Scx+ attachment progenitors is shown as uniform manifold approximation and projection (UMAP) embedding of jointly analyzed single-cell transcriptomes (10x Chromium platform). (B) Violin plots of distinct genes associated with tendon or cartilage. (C) Single-molecule fluorescent ISH (smFISH) of mRNA of tendon biglycan (Bgn, red) and cartilage Wwp2 (green) genes on the background of DAPI staining (blue) further validates the dFISH results. X100 magnification, scale bar: 10 µm. (D) Quantification of Bgn and Wwp2 smFISH results in cartilage, attachment, and tendon cells.
Figure 2—figure supplement 1
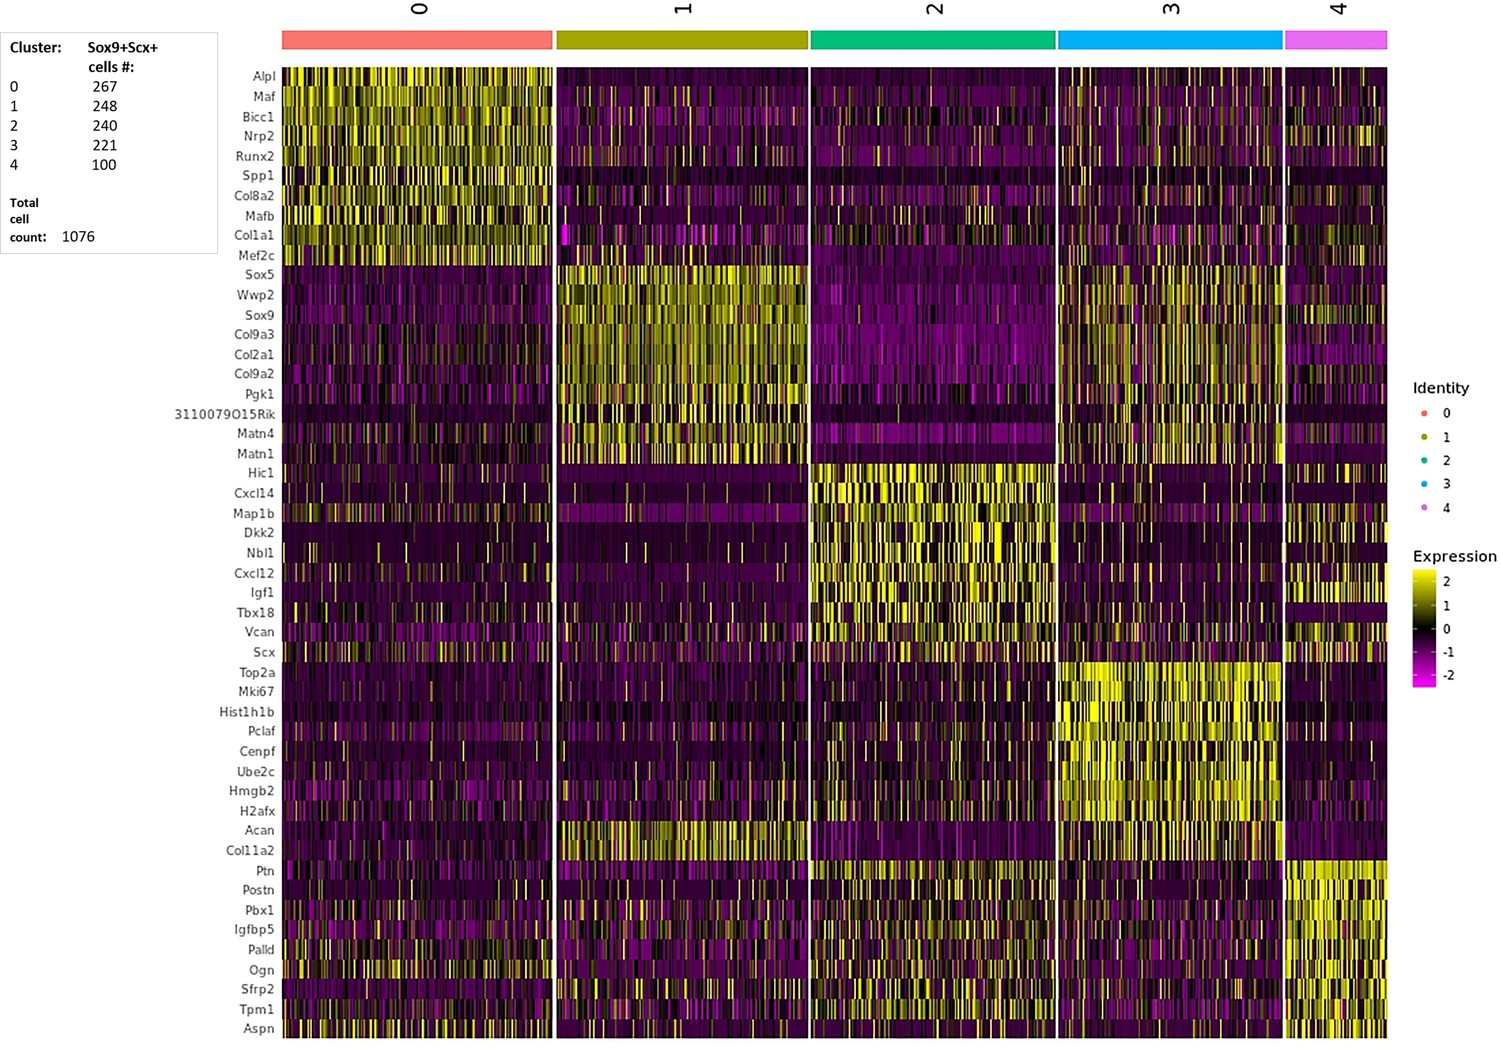
Single-cell RNA-Seq (10x Chromium platform) on E13.5 Sox9+Scx+ attachment progenitors.
Left: 1076 cells and their division to five clusters. Right: Heatmap depicting relative expression (normalized and scaled z-scored) of top-10 genes expressed per cluster.
Figure 3 with 1 supplement
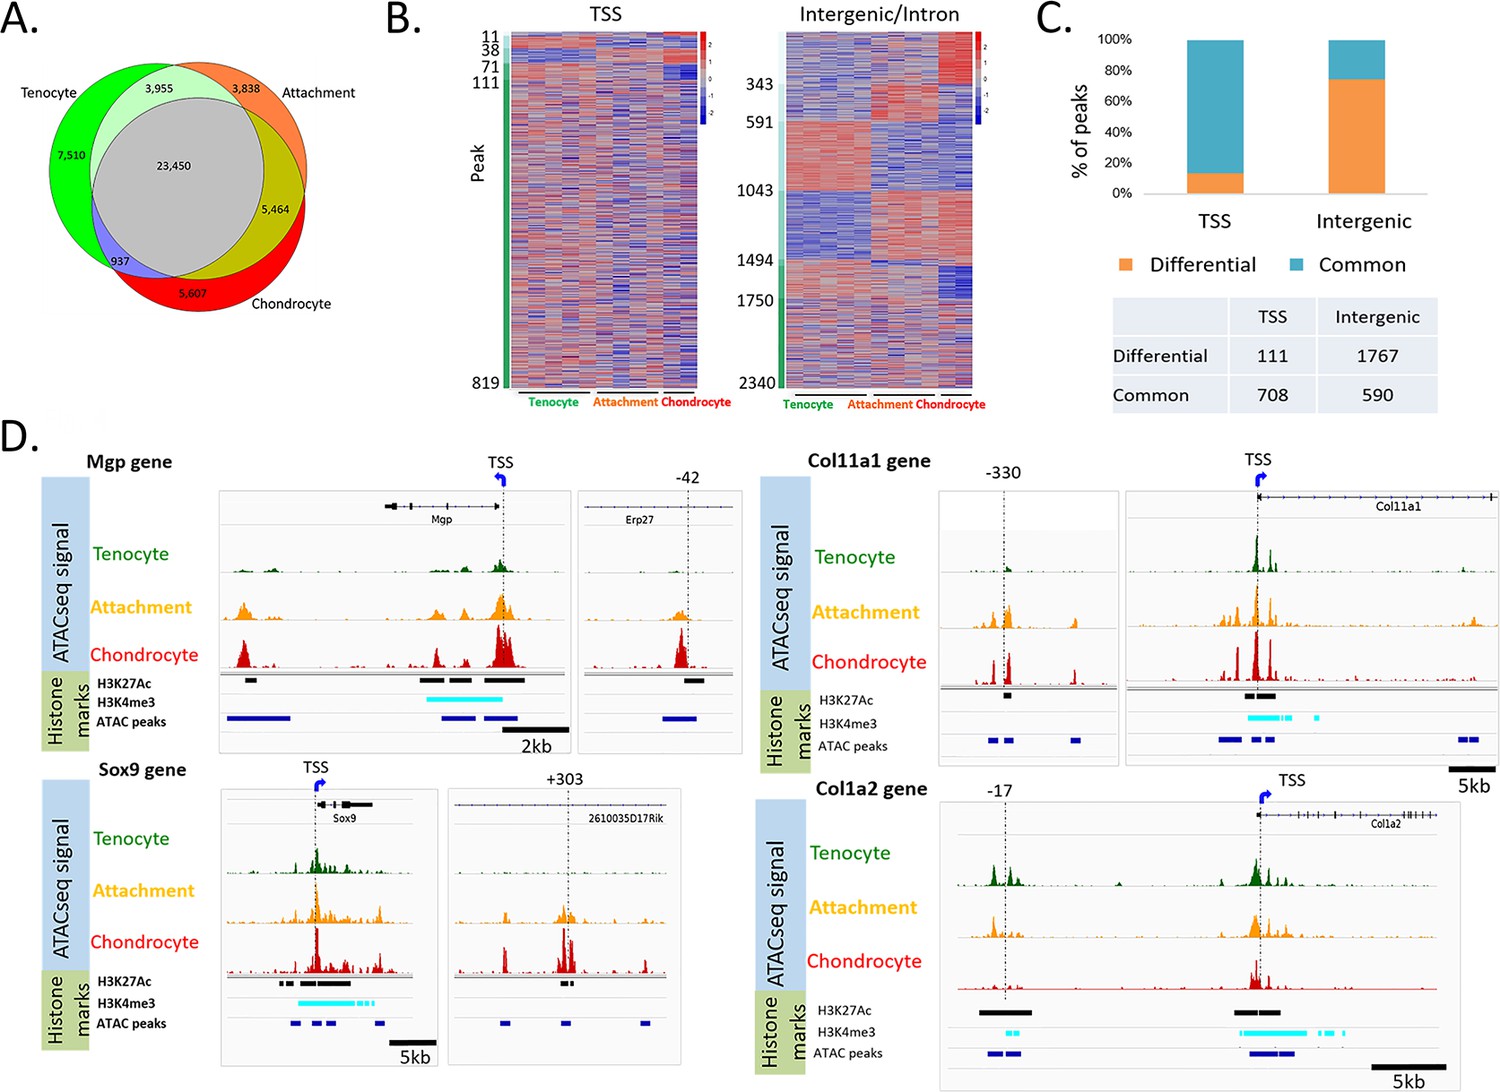
Accessible chromatin reveals an epigenetic mechanism shared by attachment cells and neighboring tenocytes or chondrocytes.
(A) Venn diagram showing cell-specific or overlapping peaks of ATAC-seq among tenocytes, chondrocytes and attachment cells. (B) Heatmap of ATAC-seq peaks associated with E14.5 differentially expressed genes. Left: TSS peaks, right: intergenic or intron peaks. The peaks are sorted according to their degree of accessibility across the three cell types. (C) Percentage of common peaks (shared by three cell types) vs. differential peaks (the chromatin is open only in one or two cell types) compared between TSS and intergenic areas (p=0, chi-square test). (D) IGV snapshots of the TSS region of Mgp, Sox9, Col11a1, and Col1a2 genes, as well as potential enhancers of these genes.
Figure 3—figure supplement 1

Accessible chromatin reveals an epigenetic mechanism of shared enhancers by attachment cells and neighboring tenocytes or chondrocytes.
(A) Principal components analysis (PCA) of accessible chromatin profiles of FACS-sorted tenocytes (green), chondrocytes (red), and attachment cells (yellow). (B) Venn diagram showing cell-specific or overlapping peaks of ATAC-seq among tenocytes, chondrocytes and attachment cells. (C) Heatmap of ATAC-seq peaks. Left: TSS peaks, right: intergenic or intron peaks. (D) Percentage of common peaks (shared by three cell types) vs. differential peaks (the chromatin is open only in one or two cell types) compared between TSS and intergenic areas.
Figure 4

In vivo analysis of enhancers identifies shared domains of activity between attachment cells and neighboring tissues.
Transgenic mouse reporter enhancer assay (lacZ) of elements positive at E14.5 (marked in light blue; for each enhancer, an E14.5 whole-mount embryo, magnification of the limb and forelimb and/or hindlimb sagittal sections are shown). Left to right: Col1a1 element (mm1995) activity is seen at the teres major insertion at the scapula (n=2/9). Klf2 element (mm1988) activity is seen in hypertrophic chondrocytes and perichondrium at the humerus and forelimb digits (n=3/3). Sox9 element (mm1989) activity is seen in hypertrophic chondrocytes of the humerus (n=4/7). Mgp element (mm1990) activity is seen in the hip, digit, and metacarpals joints in addition to the posterior distal side of the femur (n=3/3). Col11a1 element (mm1991) activity is seen in the greater tuberosity insertion and anterior distal side of the femur (n=11/11). T, tendon; C, cartilage; A, attachment; HC, hypertrophic chondrocytes.
Figure 5
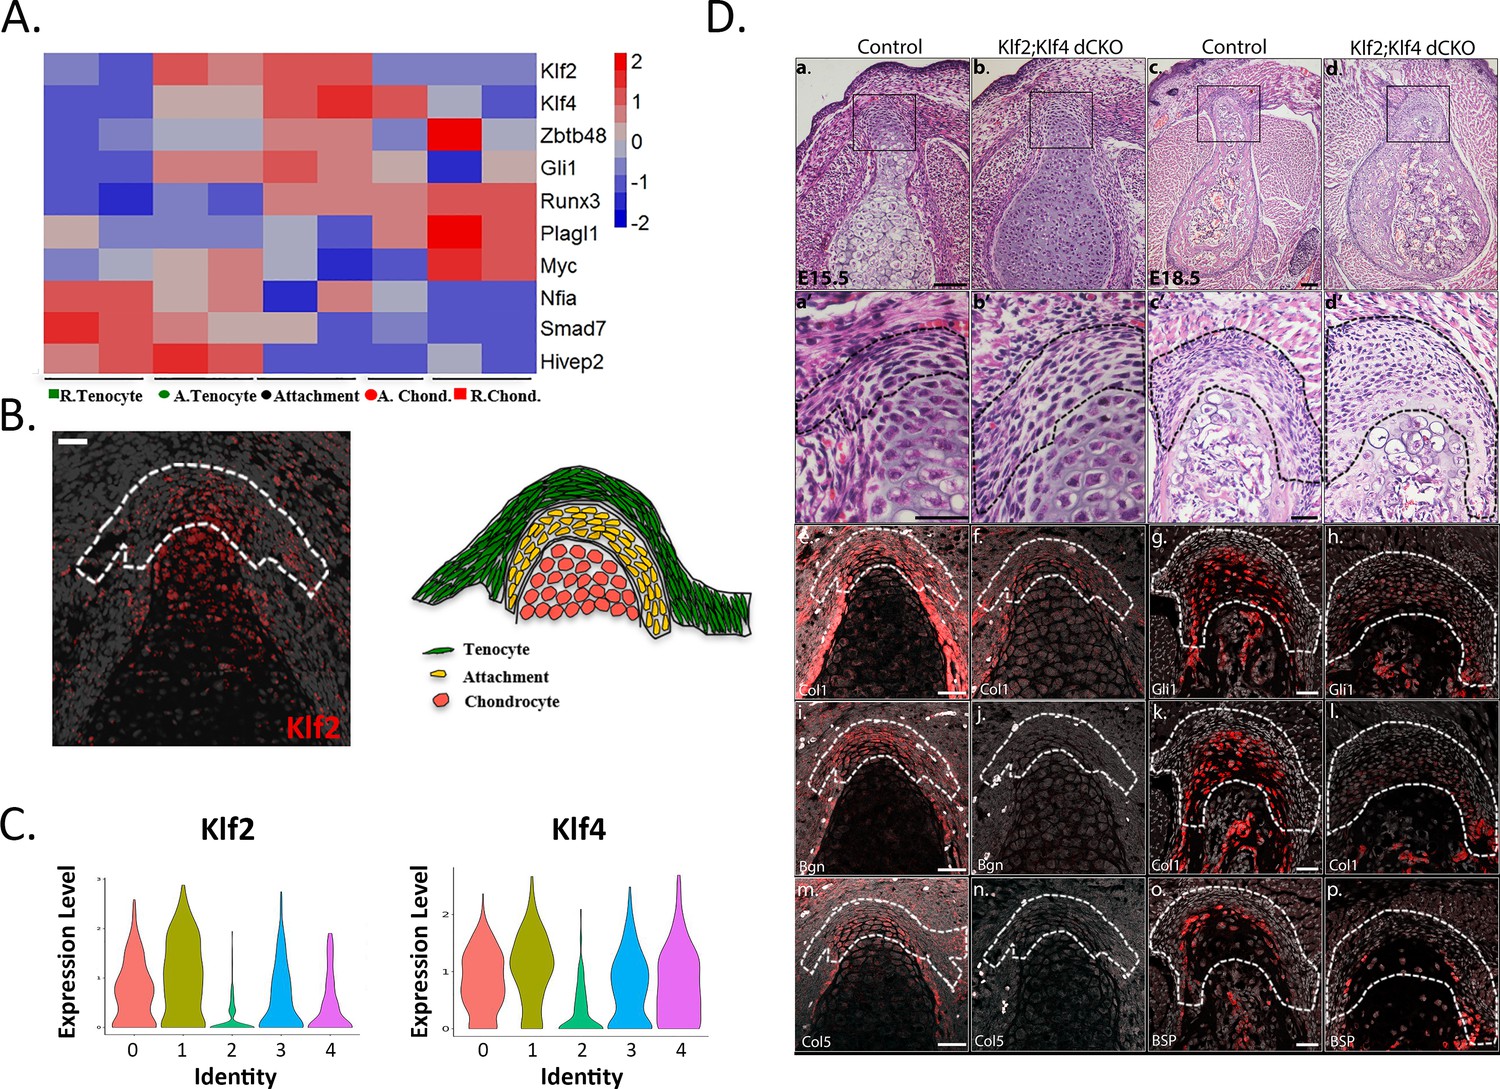
Krüppel-like factors (KLFs) are regulators of attachment cell development.
(A) Heatmap of selected transcription factors at E14.5. Transcriptome analysis shows upregulated expression of Klf2, Klf4, and Gli1 in attachment cells. (B) Left: E14.5 ISH validated these results, showing Klf2 expression in attachment cells (X20 magnification, scale bar: 25 µm). Right: Scheme of attachment site. (C) Single-cell RNA-seq analysis of E13.5 Sox9+Scx+ attachment cells shows Klf2 and Klf4 expression in the five cell populations. (D) KLF2 and KLF4 are regulators of attachment cell development. a-d. Histological transverse sections through the humeral deltoid tuberosity of E15.5 Prx1-Klf2-Klf4 and E18.5 Prx1-Klf2-Klf4 mutant and control embryos (×10 and ×5 magnification, scale bar: 100 µm). a’-d’. Higher magnification of upper panel (×40 for E15.5 and ×20 for E18.5, scale bar: 40 µm). e-p. ISH for Col1a1 and Bgn genes of E15.5 Prx1-Klf2-Klf4 mutant and control embryos. ISH for Gli1, Col1a1, and Bsp genes of E18.5 Prx1-Klf2-Klf4 mutant and control embryos (×20 magnification, scale bar: 40 µm).
Figure 6
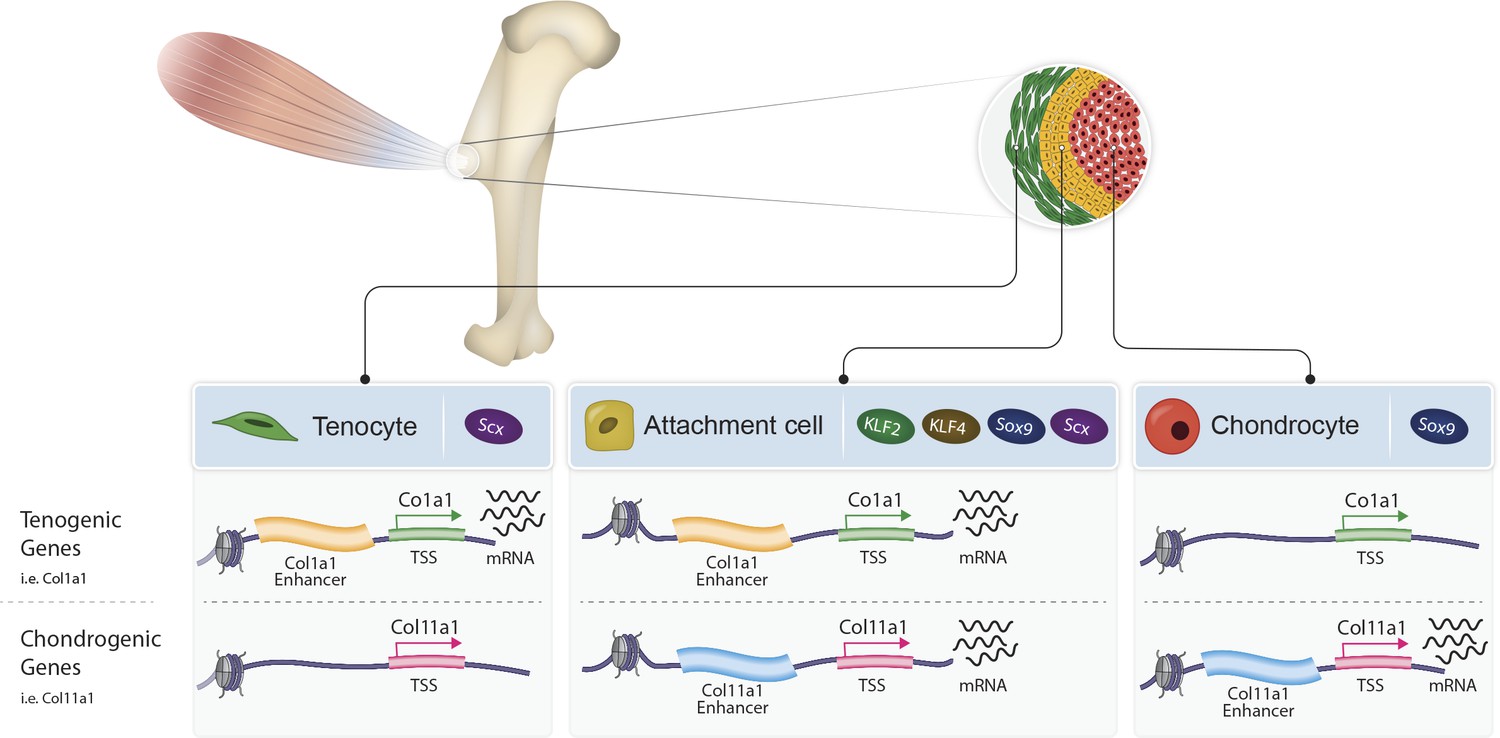
Proposed model of bi-fated tendon-to-bone attachment cells that are regulated by shared enhancers and KLF transcription factors.
Tenocytes (green, left) and chondrocytes (red, right) express tenogenic (i.e. Col1a1) or chondrogenic (i.e. Col11a1) genes, respectively, whereas attachment cells (yellow, middle) express both chondrogenic and tenogenic genes to form the attachment site. Attachment cells duality of gene expression is regulated epigenetically by intergenic chromatin areas, which are accessible in these cells and in either tenocytes or chondrocytes. Additionally, at the transcriptional level, the transcription factors KLF2/4 are expressed by attachment cells and regulate their differentiation.
Tables
Table 1
Criteria that were used to select candidates for the in vivo enhancer activity assay.
We first compared the ATAC-seq data to bulk MARS-seq transcriptome analysis and chose peaks that were assigned to genes with differential expression (using GREAT). According to the ATAC-seq results, the TSS of most of these genes was accessible in all three tissue types. Therefore, we searched for putative enhancers that could regulate the differential gene expression. We then compared the elements overlap with E13.5-E14.5 histone marks (H3K27Ac or H3K4me1 of ENCODE) and HiC results (Andrey et al., 2017), to increase the probability of in vivo verification, in addition to preliminary results of gene expression (i.e. the chosen elements were assigned to genes of interest, which were identified by RNA-seq and validated by ISH). The degree of evolutionary conservation of the core sequence was also taken into consideration while prioritizing the elements.
| mm1995 Col1a1 | mm1988 Klf2 | mm1989 Sox9 | mm1990 Mgp | mm1991 Col11a1 | mm1992, mm1994, Eln | mm1986 Igfbp5 | |
|---|---|---|---|---|---|---|---|
| Distance from TSS | −63,010 | −30,343 | 303,066 | −42,288 | −331,264 | −3,433 −43,487 | −3,605 |
| Coordinate | Chr11:94872064–94874364 | Chr8: 72287698–72291754 | Chr11:113084290–113086290 | Chr6:136917343–136918843 | Chr3: 113698476–113700076 | Chr5: 134749924–134751424 Chr5: 134790228–134791228 | Chr1: 72877526–72879452 |
| Encode H3K27ac/H3K4me1 | + | + | + | + | + | + | + |
| HiC | + | ||||||
| Core seq conservation | Opossum | Chicken | Platypus | Opossum | Lizard | Opossum | Chicken |
| Klf2 binding site | + | + | + | - | - |
Table 2
Genomatix analysis of the genomic regions of cis-regulatory elements identified by ATAC-seq.
Over-representation of transcription factor binding site (TFBS) families was identified. Crossing these results with E14.5 transcriptome revealed differentially expressed TFs from the KLF (Klf4 and Klf2), GLI (Gli11), NFI (Nfia), ZBTBs (Zbtb48), and RUNX families.
| TFBS | Gene family | Description | Zinc finger |
|---|---|---|---|
| V$E2FF | Myc | E2F-myc activator/cell cycle regulator | no |
| V$KLFS | KLF | Krüppel-like transcription factors | yes |
| V$ZF02 | Zbtb | C2H2 zinc finger transcription factors | yes |
| V$NF1F | Nfi | Nuclear factor 1 | yes |
| V$MAZF | Maz, Patz1 | Myc-associated zinc fingers | yes |
| V$GLIF | GLI | GLI zinc finger family | yes |
| V$PLAG | Plag1, Plag2, Plagl1 | Pleomorphic adenoma gene | yes |
| V$HAML | Runx | Acute myelogenous leukemia factors | no |
| V$NFKB | HIVEP | Nuclear factor kappa B/c-rel | yes |
| V$SMAD | Smad | Vertebrate SMAD family of transcription factors | no |
Table 3
Gli1 and Col5a1 genes are expressed in the attachment site and have TFBS for Krüppel-like factors (KLFs).
Search for KLF2/4 binding sites in ATAC-seq peaks that were associated with genes whose expression was reduced in the dcKO attachment site (Figure 5De-p). For Gli1, we found KLF2/4 TFBSs in peaks that reside −2.1 and −1.5 kb from its TSS (indicated as + under TFBS). For Col5a1, we found multiple binding sites for KLF2 or KLF4 (indicated as + under TFBS).
| HOMER | GREAT | ENCODE | TFBS | ||||||||||
|---|---|---|---|---|---|---|---|---|---|---|---|---|---|
| Peak | Gene | Distance to TSS | Annotation | gene1 | Distance gene 1 | gene2 | Distance gene 2 | H3K27ac | H3K4me1 | H3K4me3 | KLF2 (Genomatix) | KLF4 (Genomatix) | KLF4 (Homer) |
| chr10_127339817_127340317 | Gli1 | 1512 | Intron | Gli1 | 1522 | Arhgap9 | 16340 | + | + | + | + | + | + |
| chr10_127339170_127339670 | Gli1 | 2159 | Intron | Gli1 | 2169 | Arhgap9 | 15693 | + | + | + | + | ||
| chr10_127338776_127339276 | Gli1 | 2553 | Intron | Gli1 | 2563 | Arhgap9 | 15299 | + | + | + | |||
| chr10_127341889_127342389 | Gli1 | −560 | TSS | Gli1 | −550 | NA | NA | + | + | + | |||
| chr10_127342228_127342728 | Gli1 | −899 | TSS | Gli1 | −889 | NA | NA | + | + | + | |||
| chr2_27740165_27740665 | Rxra | 29832 | Intron | Col5a1 | −146010 | Rxra | 63214 | + | + | + | |||
| chr2_27745961_27746569 | Rxra | 35682 | Intron | Col5a1 | −140160 | Rxra | 69064 | + | + | + | |||
| chr2_27934260_27934760 | Col5a1 | 48085 | Intron | Col5a1 | 48085 | Fcnb | 150375 | + | + | + | |||
| chr2_27886819_27887319 | Col5a1 | 644 | Intron | Col5a1 | 644 | NA | NA | + | + | + | |||
| chr2_27802472_27802972 | Col5a1 | −83703 | Intergenic | Col5a1 | −83703 | Rxra | 125521 | + | + | ||||
| chr2_27848386_27848886 | Col5a1 | −37789 | Intergenic | Col5a1 | −37789 | Rxra | 171435 | + | + | + | |||
| chr2_27885904_27886561 | Col5a1 | −192 | TSS | Col5a1 | −192 | NA | NA | + | + | + | |||
| chr2_27813321_27813821 | Col5a1 | −72854 | Intergenic | Col5a1 | −72854 | Rxra | 136370 | + | + | ||||
Table 4
List of probes used for in situ hybridization.
| Probe name | Genomic position | Refseq template | Size (bp) |
|---|---|---|---|
| Igfbp5 | 792–1264 | NM_010518.2 | 502 |
| Col11a1 | 831–1224 | NM_007729.3 | 393 |
| Biglycan | 147–716 | NM_007542.4 | 569 |
| Wwp2 | 2488–3056 | NM_025830.3 | 568 |
| Col5a1 | 626–1298 | NM_015734.2 | 672 |
| Col1a1 | 4295–4475 | NM_007742.4 | 180 |
| Klf2 | 895–1512 | NM_008452.2 | 617 |
| Gli1 | 1810–2447 | NM_010296.2 | 638 |
| Bsp | 145–1058 | NM_008318.3 | 1955 |
| Scx | 273–1129 | NM_198885.3 | 856 |
| Mfap4 | 276–966 | NM_029568.2 | 690 |
| Ptn | 1247–1932 | NM_008973.2 | 685 |
| Col3a1 | 707–1388 | NM_009930.2 | 681 |
| Mgp | 69–553 | NM_008597.4 | 485 |
| Eln | 154–693 | NM_007925.4 | 540 |
| Mmp14 | 708–1283 | NM_008608.3 | 575 |
| Col2a1 | 4474–4879 | NM_001113515.2 | 406 |
| Col9a1 | 2553–3100 | NM_007740.3 | 547 |
| Sox9 | 50–797 | NM_011448.4 | 748 |
| Snorc | 32–437 | NM_028473.1 | 405 |
Appendix 1—key resources table
| Reagent type (species) or resource | Designation | Source or reference | Identifiers | Additional information |
|---|---|---|---|---|
| Strain, strain background (Mus musculus) | Sox9-CreER, C57BL/6 | DOI:10.1002/dvg.20667 | FACS | |
| Strain, strain background (M. musculus) | R26R-tdTomato, C57BL/6 | DOI:10.1038/nn.2467 | FACS | |
| Strain, strain background (M. musculus) | Scx-GFP, C57BL/6 | DOI:10.1002/dvdy.21179 | RRID:MGI:3717422 | FACS |
| Strain, strain background (M. musculus) | Col2a1-Cre, C57BL/6 and B6.129 (ICR) | PMID:10686612 | Used as mixed background (C57BL/6 and B6.129 (ICR)) for LCM | |
| Strain, strain background (M. musculus) | Col2-CreERT, C57BL/6 and B6.129 (ICR) | DOI:10.1002/dvdy.20892 | RRID:IMSR_JAX:006774 | Used as mixed background (C57BL/6 and B6.129 (ICR)) for FACS |
| Strain, strain background (M. musculus) | Floxed Klf2, C57BL/6 | Eric Sebzda | DOI:10.1016/j.devcel.2006.09.006 | |
| Strain, strain background (M. musculus) | Floxed Klf4, C57BL/6 | MMRRC* | RRID:MMRRC_029877-MU | PMID:12015290 *Mutant Mouse Regional Resource Center at UC Davis |
| Strain, strain background (M. musculus) | Prx1-Cre, C57BL/6 | DOI:10.1002/gene.10092 | ||
| Strain, strain background (M. musculus) | C57BL/6 | The Jackson Laboratory | In situ hybridization and single-molecule fluorescent in situ hybridization | |
| Strain, strain background (M. musculus) | FVB/Shh-ZRSem7Axvi (396C>T variant knock-in), FVB | DOI:10.1016/j.cell.2020.02.031 | Enhancer reporter assays in mouse embryos | |
| Strain, strain background (M. musculus) | FVB | Charles River | https://www.criver.com/ | Enhancer reporter assays in mouse embryos |
| Antibody | anti-DIG-POD (sheep polyclonal) | Roche | Cat# 11207733910 | ISH (1:300), DOI:10.1007/978-1-62703-989-5_15 |
| Antibody | anti-FITC-POD (sheep polyclonal) | Roche | Cat# 11426346910 | ISH (1:200), DOI:10.1007/978-1-62703-989-5_15 |
| Commercial assay or kit | TSA Plus Fluorescent Systems Kit | Perkin Elmer | Cat# NEL753001KT | ISH (Cy3 + fluorescein), DOI:10.1007/978-1-62703-989-5_15 |
| Antibody | Anti-SOX9 (rabbit polyclonal) | Millipore | AB5535 | (1:200) |
| Commercial assay or kit | Histogene LCM Frozen Section Staining Kit | ThermoFisher Scientific | Cat# KIT0401 | LCM |
| Commercial assay or kit | MembraneSlide 1.0 PET | Carl Zeiss Microscopy | Cat# 415190-9051-000 | LCM |
| Commercial assay or kit | AdhesiveCap 500 clear | Carl Zeiss Microscopy | Cat# 415190-9211-000 | LCM |
| Commercial assay or kit | RNeasy FFPE Kit | Qiagen | Cat# 73504 | LCM |
| Sequence-based reagent | smFISH probes | Stellaris FISH Probe Designer (Biosearch Technologies, Inc, Petaluma, CA) | See Supplementary file 2 | |
| Software, algorithm | Pipeline Pilot-designed pipeline for transSeq | INCPM | https://incpmpm.atlassian.net/wiki/spaces/PUB/pages/36405284/tranSeq+on+Pipeline-Pilot | Bulk RNA sequencing |
| Software, algorithm | HTseq-count | DOI: 10.1093/bioinformatics/btu638 | ||
| Software, algorithm | DESeq2 | DOI:10.1186/s13059-014-0550-8 | Version 1.4.5 | |
| Software, algorithm | Expander package | DOI: 10.1038/nprot.2009.230 | Version 7.1, CLICK algorithm | |
| Software, algorithm | cellranger | 10x Genomics | Version 3.0.2 | scRNA-seq bioinformatic analysis |
| Software, algorithm | DropletUtiles | DOI:10.1186/s13059-019-1662-y | Version 1.6.1 | scRNA-seq bioinformatic analysis |
| Software, algorithm | Seurat | DOI:10.1038/nbt.4096 | Version 3.1.5 | scRNA-seq bioinformatic analysis |
| Other | Bulk RNA sequencing dataset | This paper | NCBI GEO (GSE144306) | |
| Other | Single-cell RNA sequencing dataset | This paper | NCBI GEO (GSE160090) | |
| Commercial assay or kit | Hiseq 2500 SR50 cycles kit | Illumina | Bulk RNA sequencing | |
| Commercial assay or kit | 10x Genomics Chromium Single Cell 3’ Reagent Kit | 10x Genomics | User Guide v3/v3.1 Chemistry | |
| Commercial assay or kit | NEBNext Library Quant Kit for Illumina | NEB | ||
| Commercial assay or kit | SP 100 cycles reagent kit | Illumina | ||
| Other | Alexa Fluor 488 conjugated phalloidin | ThermoFisher Scientific | A12379 | smFISH |
| Other | ProLong Gold | Molecular Probes | P36934 | smFISH |
| Commercial assay or kit | NextSeq 500 High Output v2 Kit (75 cycles) | Illumina | FC-404–2005 | |
| Commercial assay or kit | Nextera Index Kit 24ind, 96smp | Illumina | FC-121–1011 | |
| Commercial assay or kit | Nextera DNA Sample Prep Kit (24 sam) | Illumina | FC-121–1030 | |
| Software, algorithm | Bowtie2 | DOI:10.1186/s13040-014-0034-0 | Version 2.3.4.1 | |
| Software, algorithm | Picard ‘MarkDuplicates’ | http://broadinstitute.github.io/picard/ | Version 1.119 | |
| Software, algorithm | MACS2 | DOI:10.1186/gb-2008-9-9-r137 | Version 2.1.1.20160309 | |
| Software, algorithm | BEDtools | DOI:10.1002/0471250953.bi1112s47 | Version 2.27.1 | |
| Software, algorithm | SAMtools | DOI:10.1093/bioinformatics/btp352 | Version 1.19 | |
| Software, algorithm | GREAT | DOI: 10.1038/nbt.1630 | Version 4.0.4 | |
| Software, algorithm | HOMER | PMID:20513432 | Version 1.9 | |
| Software, algorithm | Genomatix | |||
| Other | ATAC-seq dataset | This paper | NCBI GEO (GSE144306) | |
| Other | histone modification datasets H3K27ac, H3K4me1, H3K4me3, H3K9me3 | ENCODE Consortium and the ENCODE production laboratory | ENCSR905FFU ENCSR426EZM ENCSR416OYH ENCSR022DED | ChIP-seq |
| Other | phastConsElements60wayPlacental | UCSC site; Casper et al., 2018 |
Author response table 1
| Vista ID | N | Reproducible staining | Limb | Notes: |
|---|---|---|---|---|
| mm1986 | 3/6 | Craniofacial | Negative | |
| mm1995 | 2/9 | Limb | Positive* | * Scored as “random integration” (Kvon et al., Cell 2020). |
| mm1988 | 3/3 | Various | Positive | |
| mm1989 | 4/7 | Limb | Positive | |
| mm1990 | 3/3 | Limb | Positive | |
| mm1991 | 11/11 | Limb, other structures with less penetrance | Positive | |
| mm1992 | 0/6 | None | Negative | 2 embryos displayed non-reproducible or background LacZ staining |
| mm1994 | 0/9 | None | Negative | 5 embryos displayed non-reproducible or background LacZ staining |
Author response table 2
| Gene | Bulk MARS-Seq normalized reads (mean) |
|---|---|
| Klf2 | 203.67 |
| Klf4 | 384.75 |
| Gli1 | 349.15 |
| Col5a1 | 391.62 |
Additional files
-
Supplementary file 1
Hierarchical clustering of bulk MARS-seq data from E14.5 attachment site samples.
Ordered genes and samples were combined by complete-linkage clustering using the similarity measurement of Pearson correlation. A, remote tenocytes; B, adjacent tenocytes; C, remote chondrocytes; D, adjacent chondrocytes; E, attachment cells.
- https://cdn.elifesciences.org/articles/55361/elife-55361-supp1-v1.jpg
-
Supplementary file 2
List of probes used for single-molecule fluorescent in situ hybridization for biglycan (Bgn) and Wwp2.
- https://cdn.elifesciences.org/articles/55361/elife-55361-supp2-v1.xlsx
-
Supplementary file 3
List of intergenic regions (non-TSS).
The peaks were selected based on their enhanced ATAC-seq signal (cutoff of averaged ATAC-seq signal > 30.0) and their association with differentially expressed genes. ‘Attachment specific’ sheet lists 248 peaks that are accessible only in attachment cells. The table includes transcription factors such as Klf4, Runx3, and Nfia, in addition to ECM-associated genes such as Col11a1 and Bgn.
- https://cdn.elifesciences.org/articles/55361/elife-55361-supp3-v1.xlsx
-
Transparent reporting form
- https://cdn.elifesciences.org/articles/55361/elife-55361-transrepform-v1.docx
Download links
A two-part list of links to download the article, or parts of the article, in various formats.
Downloads (link to download the article as PDF)
Open citations (links to open the citations from this article in various online reference manager services)
Cite this article (links to download the citations from this article in formats compatible with various reference manager tools)
Bi-fated tendon-to-bone attachment cells are regulated by shared enhancers and KLF transcription factors
eLife 10:e55361.
https://doi.org/10.7554/eLife.55361


