Drosophila Synaptotagmin 7 negatively regulates synaptic vesicle release and replenishment in a dosage-dependent manner
- The Picower Institute for Learning and Memory, Department of Biology and Department of Brain and Cognitive Sciences, Massachusetts Institute of Technology, United States
Figures
Figure 1 with 1 supplement
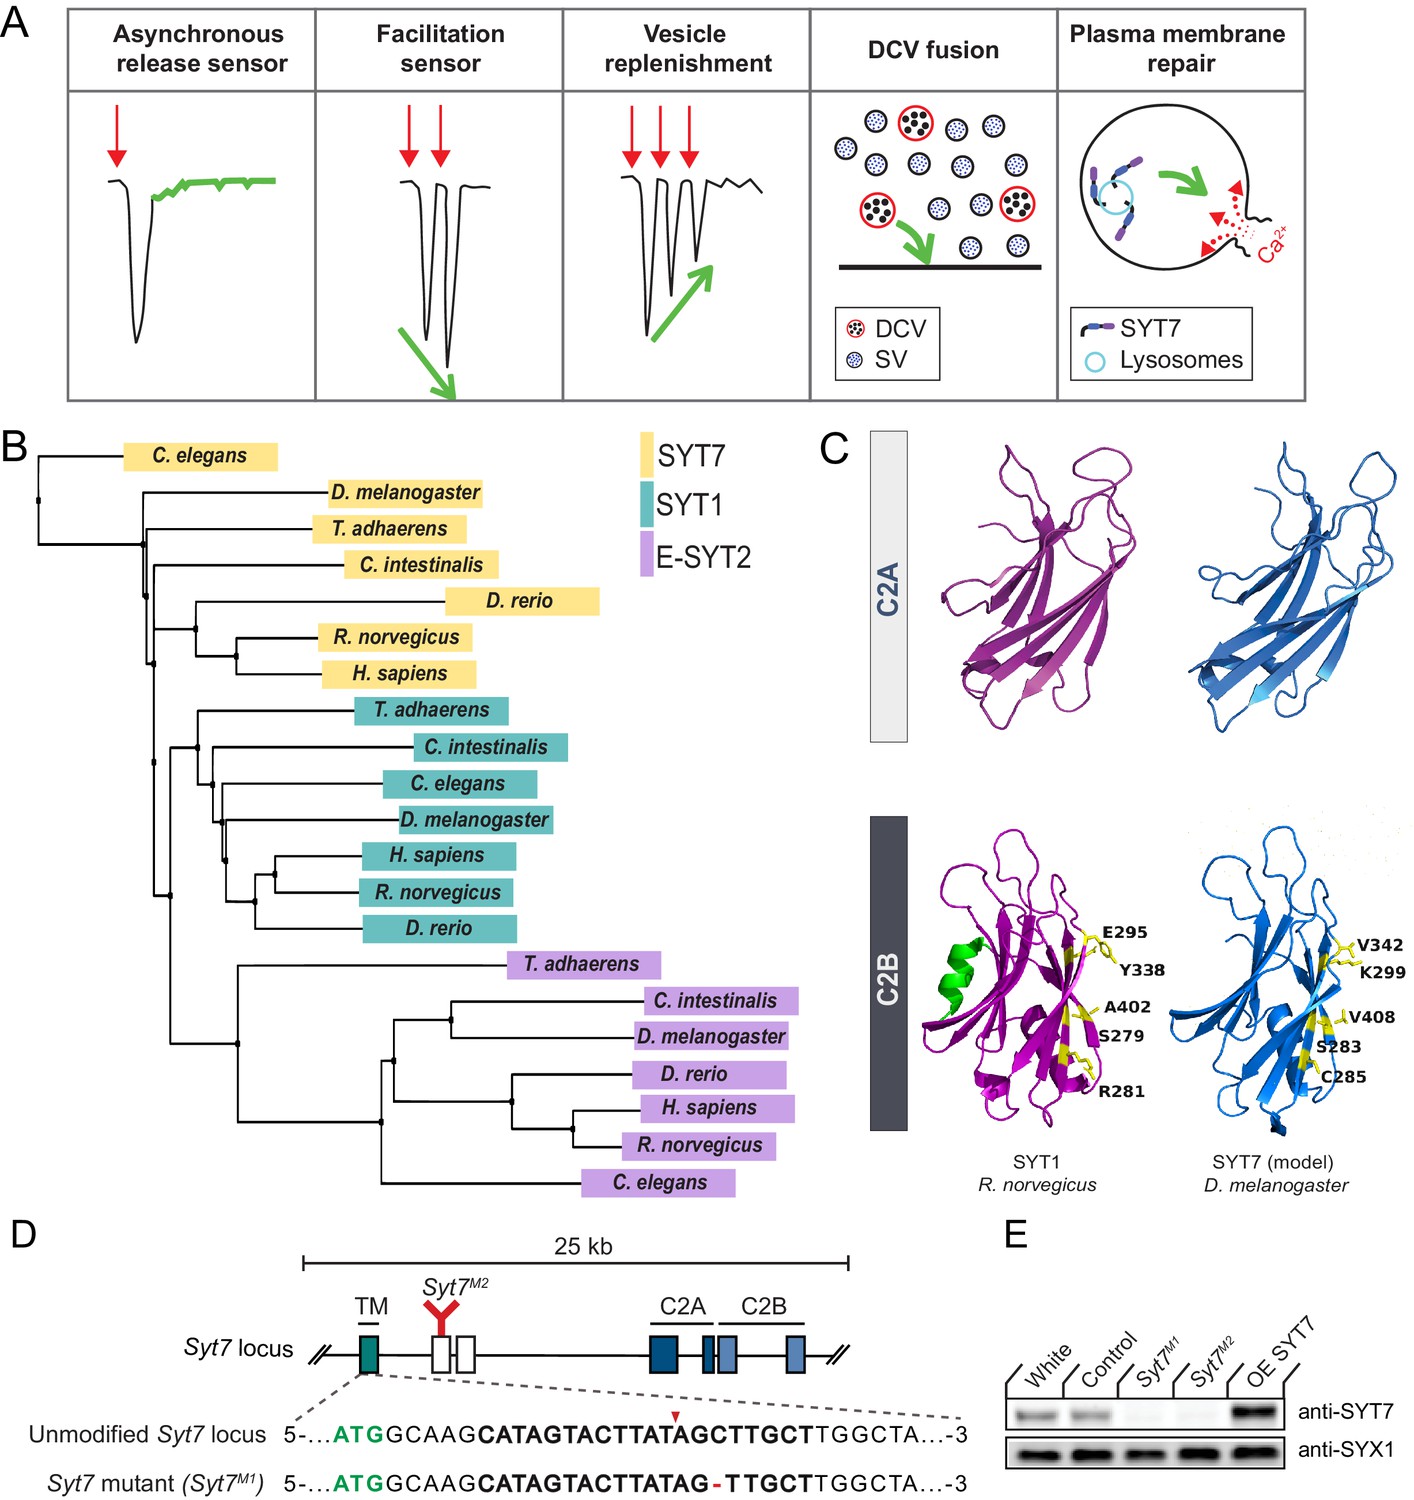
SYT1 and SYT7 comparison and generation of Syt7 mutants.
(A) Proposed roles for SYT7 in Ca2+-regulated membrane trafficking. (B) Phylogenetic tree of SYT1, SYT7 and E-SYT2 from the indicated species generated using the BLOSUM62 matrix with neighbor joining clustering. (C) Comparison of the structure of the C2A and C2B domains of R. norvegicus SYT1 (magenta) with a homology model of D. melanogaster SYT7 (blue). The C2B residues that form the SYT1-SNARE complex primary binding site are highlighted in yellow, with the counterpart changes noted in SYT7. The C2B HB helix in SYT1 is highlighted in green and missing from SYT7. (D) Diagram of the Syt7 genomic locus on chromosome four with coding exons indicated with boxes. Exon 1 (teal) encodes the intravesicular and transmembrane (TM) domains; exons 2 and 3 (white) encode the linker region; exons 4 and 5 encode the C2A domain (dark blue); and exons 6 and 7 encode the C2B domain (light blue). The location of the Syt7M2 Minos transposon insertion in exon two is indicated in red. Sequence of the Syt7M1 CRISPR mutant versus control is shown below with the start codon in green. The guide RNA sequence used to target Syt7 is bolded, with the cleavage site noted by the red arrowhead and the deleted cytosine with a red dash. (E) Western blot of SYT7 protein levels in head extracts of white, CRISPR control, Syt7M1, Syt7M2 and elavC155-GAL4; UAS-Syt7 (OE SYT7) with anti-SYT7 antisera (top panel). Syntaxin 1 (SYX1) antisera was used as a loading control (bottom panel). SYT7 is overexpressed 2.48 ± 0.4 fold compared to controls (p<0.05, Mann-Whitney unpaired t-test, n = 4).
Figure 1—figure supplement 1
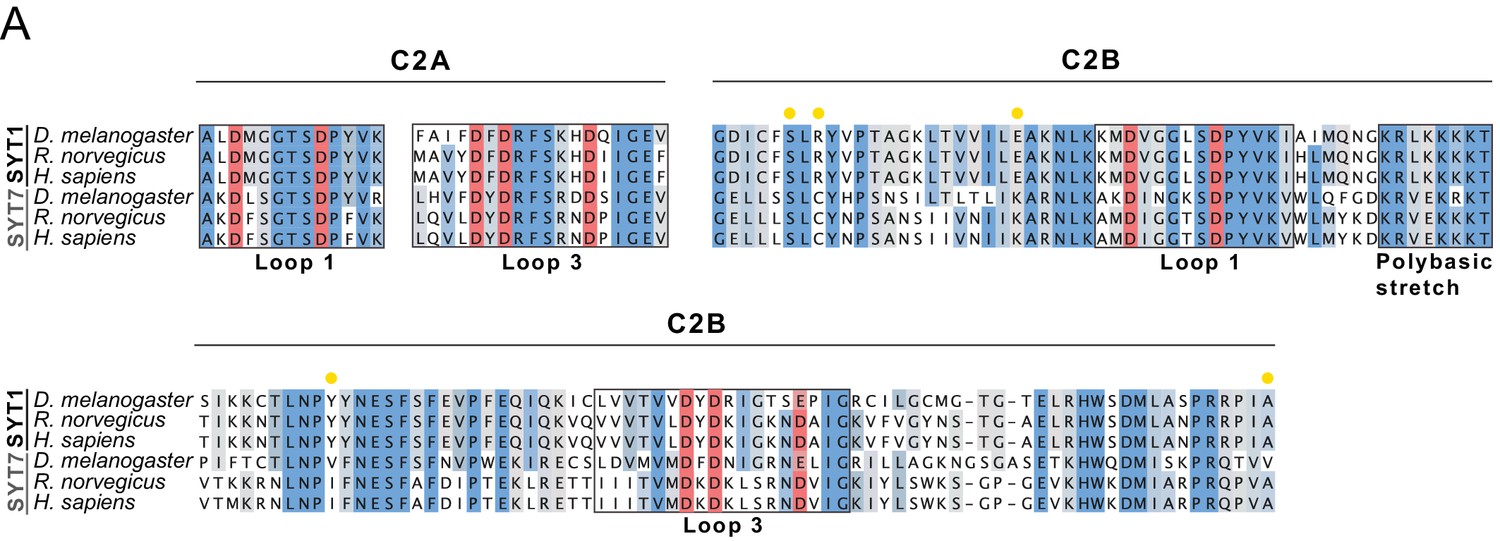
SYT1 and SYT7 sequence comparisons.
Annotated sequence alignment of the C2A Ca2+ binding loops and the C2B domain of SYT1 and SYT7 from the indicated species. Conserved resides are shaded dark blue, with conservative amino acid substitutions in light blue. Grey shading denotes subfamily-specific reside conservation in only SYT1 or SYT7. C2A and C2B Ca2+ binding residues are shaded red. Yellow circles denote residues that form the primary SYT1-SNARE complex binding interface. Four of the five residues are not conserved in Drosophila SYT7, with two containing identical substitutions previously found to abolish SYT1 function (R334H and E348K).
Figure 2

Syt7 mutants and Syt7/+ heterozygotes display enhanced neurotransmitter release.
(A) Average mEJC traces in control (black), Syt7M1/+ (green) and Syt7M1 mutants (blue). (B) Quantification of mean mEJC amplitude for the indicated genotypes (control: 0.62 ± 0.020 nA, n = 17; Syt7M1/+: 0.61 ± 0.021 nA, n = 21; Syt7M1: 0.57 ± 0.013 nA, n = 20). (C) Normalized cumulative mEJC charge for each genotype. (D) Quantification of mean mEJC frequency for the indicated genotypes (control: 1.30 ± 0.10 Hz, n = 17; Syt7M1/+: 1.66 ± 0.13 Hz, n = 19; Syt7M1: 1.36 ± 0.12 Hz, n = 19). (E) Average eEJC traces in control (black), Syt7M1/+ (green) and Syt7M1 (blue). (F) Quantification of mean eEJC amplitude for the indicated genotypes. (G) Average normalized responses for each genotype plotted on a semi-logarithmic graph to display release components. (H) Cumulative release normalized to the maximum response in 2 mM Ca2+ for each genotype. (I) Quantification of mean eEJC half-width in the indicated genotypes (control: 7.81 ± 0.47 ms, n = 9; Syt7M1/+: 7.77 ± 0.26 ms, n = 14; Syt7M1: 7.15 ± 0.34 ms, n = 10). (J) Quantification of evoked quantal content with mEJC amplitude for the indicated genotypes (control: 250.1 ± 30.58 SVs, n = 9; Syt7M1/+: 377.9 ± 31.13, n = 14; Syt7M1: 495.3 ± 36.75, n = 10). (K) Quantification of evoked quantal content with mEJC charge for the indicated genotypes (control: 221.3 ± 20.54 SVs, n = 9; Syt7M1/+: 371.6 ± 43.56, n = 14; Syt7M1: 503.6 ± 31.99, n = 10). (L) Log-log plot for eEJC amplitudes recorded in 0.175, 0.2, 0.3, 0.4, 0.6, 0.8, 1, and 2 mM extracellular [Ca2+] from control (black) and Syt7M1 mutants (blue), with a Hill fit for each genotype noted. Recordings were performed from 3rd instar segment A3 muscle 6. Extracellular [Ca2+] in E–K was 2 mM. Statistical significance was determined using one-way ANOVA (nonparametric) with post hoc Tukey’s multiple comparisons test. N.S. = no significant change. Error bars represent SEM.
Figure 3 with 1 supplement
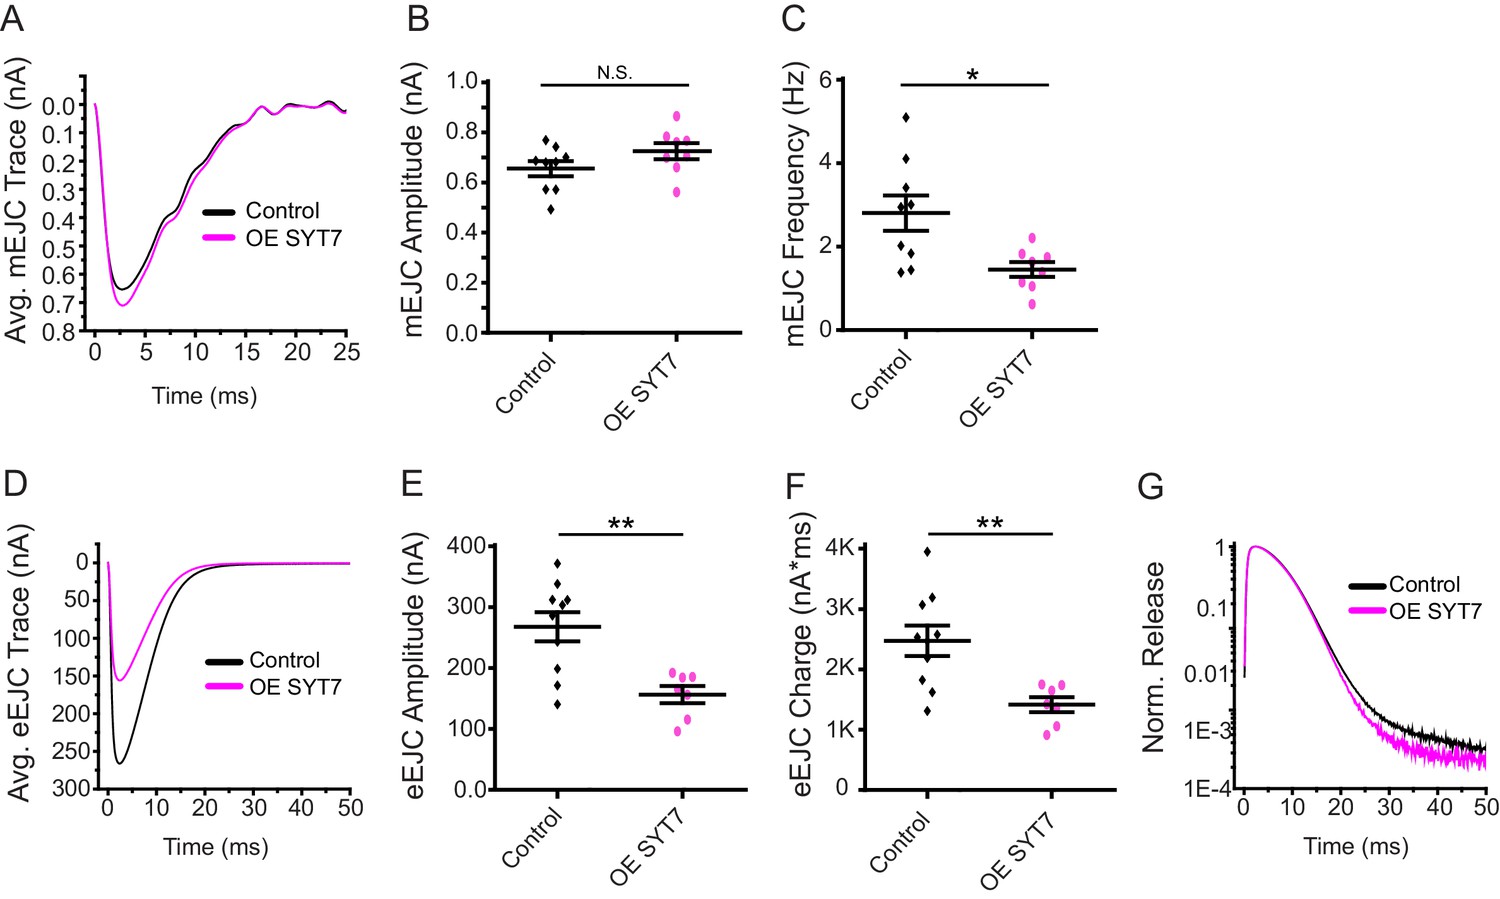
Neuronal overexpression of SYT7 reduces spontaneous and evoked SV release.
(A) Average mEJC traces in control (black) and elavC155-GAL4; UAS-Syt7 (OE SYT7, magenta). (B) Quantification of mean mEJC amplitudes in the indicated genotypes (control: 0.66 ± 0.03 nA, n = 9; OE SYT7: 0.73 ± 0.03 nA, n = 8). (C) Quantification of mean mEJC frequency in the indicated genotypes (control: 2.81 ± 0.42 Hz, n = 9; OE SYT7: 1.45 ± 0.18 Hz, n = 8). (D) Average eEJC traces in control (black) and elavC155-GAL4; UAS-Syt7 (OE SYT7, magenta). (E) Quantification of mean eEJC amplitudes in the indicated genotypes (control: 256.24 ± 22.38 nA, n = 10; OE SYT7: 166.66 ± 10.74 nA, n = 7). (F) Quantification of mean eEJC charge in the indicated genotypes (control: 2.5 × 10³ ± 0.25 × 10³ nA*ms, n = 10; OE SYT7: 1.4 × 10³ ± 0.12 × 10³ nA*ms, n = 7). (G) Average normalized responses for each genotype plotted on a semi-logarithmic graph to display release components. Recordings were performed from 3rd instar segment A3 muscle 6 in 2 mM Ca2+. Statistical significance was determined with a Mann-Whitney unpaired t-test.
Figure 3—figure supplement 1
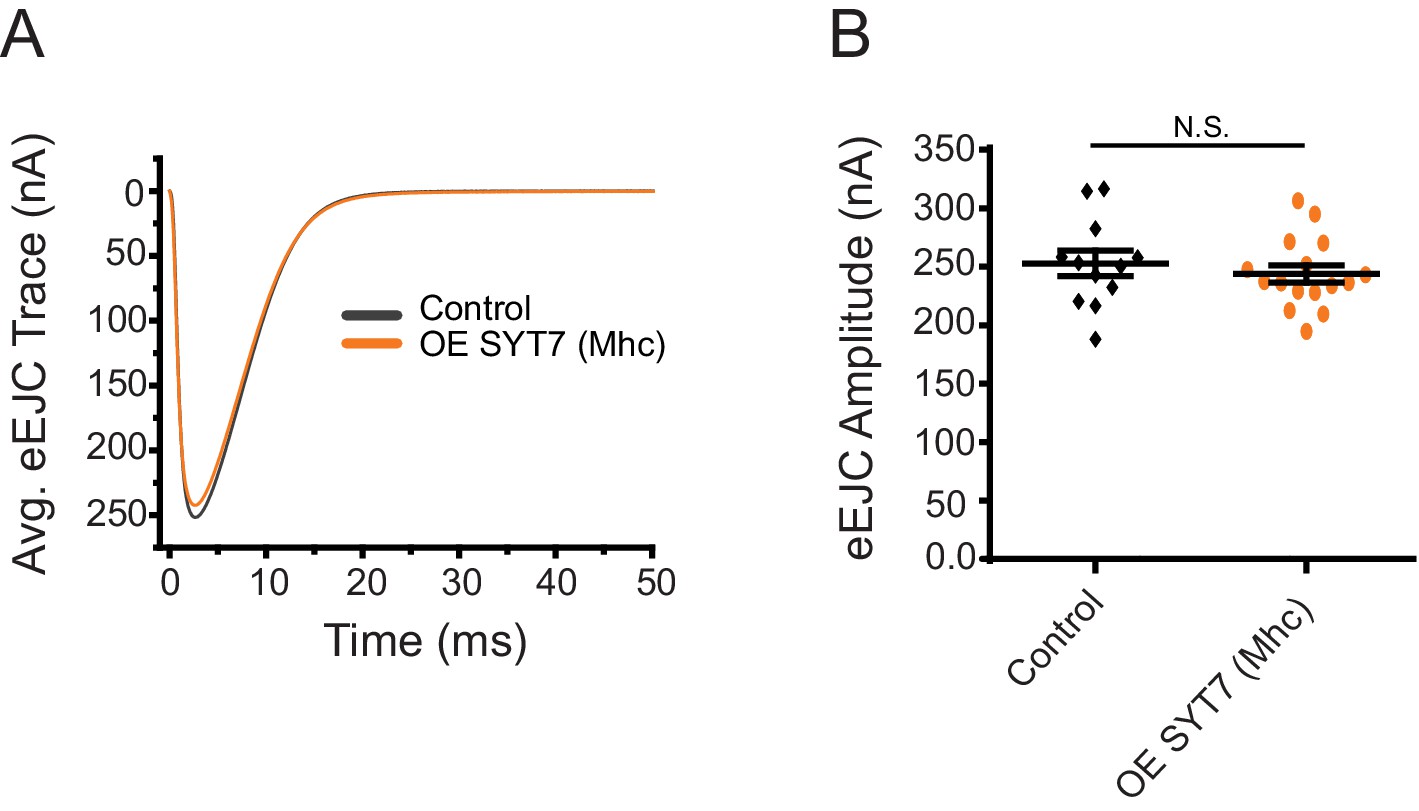
Overexpression of SYT7 in postsynaptic muscles does not disrupt synaptic transmission.
(A) Average eEJC traces in control (black) and Mhc-GAL4; UAS-Syt7 (OE SYT7, orange). (B) Quantification of mean eEJC amplitudes in the indicated genotypes (control: 252.82 ± 10.98 nA, n = 12; Mhc-GAL4; UAS-Syt7: 243.91 ± 7.46 nA, n = 16). Recordings were performed from 3rd instar segment A3 muscle 6 in 2 mM Ca2+. Statistical significance was determined with the Mann-Whitney unpaired test.
Figure 4

Analysis of synaptic morphology in Syt7 mutants.
(A, B) Immunocytochemistry of 3rd instar muscle 6/7 NMJs with anti-HRP (blue), anti-CPX (magenta) and anti-BRP (green) in control and Syt7M1. The boxed region is magnified below with channels showing BRP, CPX and the merge. Scale bar = 20 µm for large panels and 2 µm for boxed regions. Synaptic morphology was quantified for 3rd instar muscle 6/7 (C–E) and muscle 4 (F–H) in controls and Syt7M1 mutants. No significant differences were detected in synaptic bouton number (C, F); muscle 6/7: p=0.78; control: 81.87 ± 5.301, n = 15; Syt7M1: 79.60 ± 5.824, n = 15; muscle 4: p=0.24; control: 55.86 ± 3.141, n = 14; Syt7M1: 62.50 ± 4.575, n = 14), BRP puncta (D, G), muscle 6/7: p=0.94; control: 621.1 ± 26.28, n = 15; Syt7M1: 618.1 ± 25.73, n = 15; muscle 4: p=0.83; control: 450.5 ± 23.25, n = 14; Syt7M1: 443.5 ± 21.47, n = 14) or BRP puncta per muscle surface area (E, H), muscle 6/7: p=0.13; control: 0.0088 ± 0.0004, n = 15; Syt7M1: 0.0098 ± 0.0005, n = 15; muscle 4: p=0.88; control: 0.0105 ± 0.0008, n = 14; Syt7M1: 0.0107 ± 0.0007, n = 14). (I) Anti-BRP staining at 3rd instar muscle four in control and Syt7M1 imaged with SIM microscopy. Scale bar = 1 µm. (J) Relative cumulative frequency of AZ T-bar volume defined with anti-BRP staining at 3rd instar muscle 6/7 NMJs (p=0.026; control: 0.055 ± 0.004 µm2, n = 19 NMJs from five larvae; Syt7M1: 0.044 ± 0.003 µm2, n = 15 NMJs from four larvae). (K) Relative cumulative frequency of T-bar spacing defined by distance between nearest BRP puncta at 3rd instar muscle 6/7 NMJs (p=0.48; control: 0.28 ± 0.016 µm, n = 20 NMJs from five larvae; Syt7M1: 0.27 ± 0.014 µm, n = 15 NMJs from four larvae). Statistical significance was determined with Student’s t-test. (L) Mean fluorescence intensity of Fluo-4 AM in control (black) and Syt7M1 mutants (blue) during the indicated stimulation protocol. (M) Representative images of synaptic boutons stained with anti-HRP (left), with Fluo-4 AM maximum fluorescence intensity during stimulation shown on the right for control (above) and Syt7M1 (below). Scale bar = 1 µm.
Figure 5
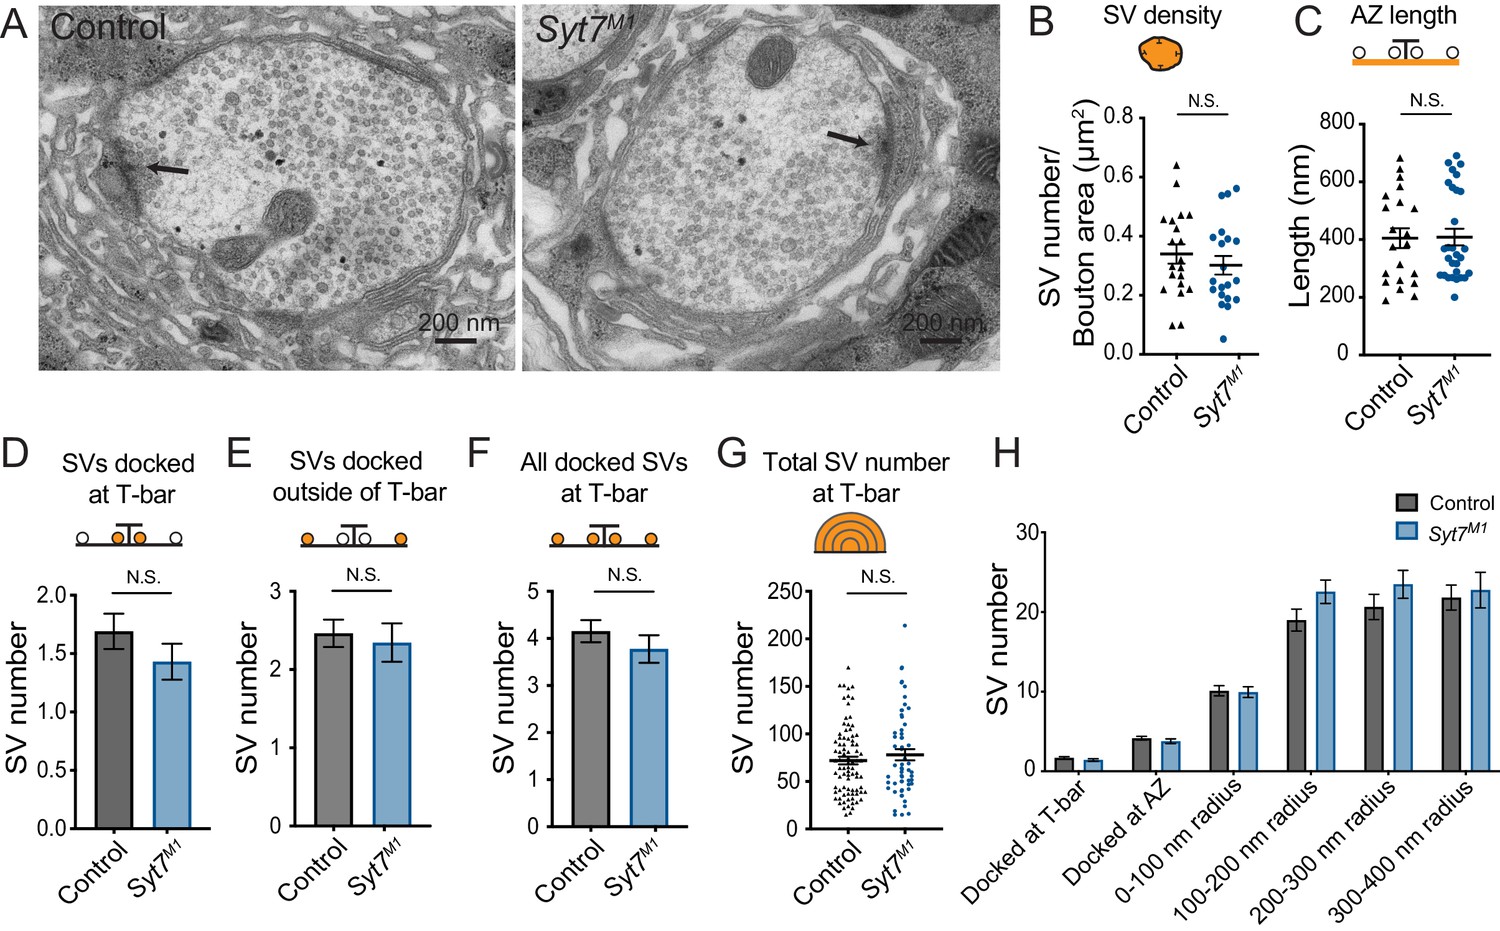
Ultrastructural analysis of SV distribution in Syt7 mutants.
(A) Representative EM micrographs of muscle 6/7 synaptic boutons in control and Syt7M1 3rd instar larvae. An AZ with its associated electron dense T-bar is denoted with an arrowhead in each micrograph. (B) Quantification of SV density (p=0.41; control = 0.34 ± 0.033 SVs/µm2, n = 20; Syt7M1 = 0.30 ± 0.031 SVs/µm2, n = 20). (C) Quantification of AZ length defined by the electron dense synaptic cleft (p=0.93; control: 404 ± 34.5 nm, n = 21 AZs from five larvae; Syt7M1: 409 ± 28.9 nm, n = 29 AZs from five larvae). (D) Quantification of SVs docked within 100 nm of the T-bar (p=0.41; control = 1.69 ± 0.15 SVs n = 84; Syt7M1 = 1.43 ± 0.15 SVs, n = 58). (E) Quantification of SVs docked within 100–400 nm of the T-bar (p=0.68; control = 2.46 ± 0.17 SVs n = 84; Syt7M1 = 2.35 ± 0.25 SVs, n = 58). (F) Quantification of all docked SVs at 0–400 nm from the T-bar (p=0.31; control = 4.16 ± 0.23 SVs n = 84; Syt7M1 = 3.78 ± 0.29 SVs, n = 58). (G) Quantification of all SVs within a 400 nm radius from the T-bar (p=0.38; control = 71.98 ± 4.05 SVs n = 84; Syt7M1 = 78.12 ± 5.89 SVs, n = 58). (H) Quantification of SV distribution at AZs in control and Syt7M1 mutants. Statistical significance was determined with Student’s t-test.
Figure 6
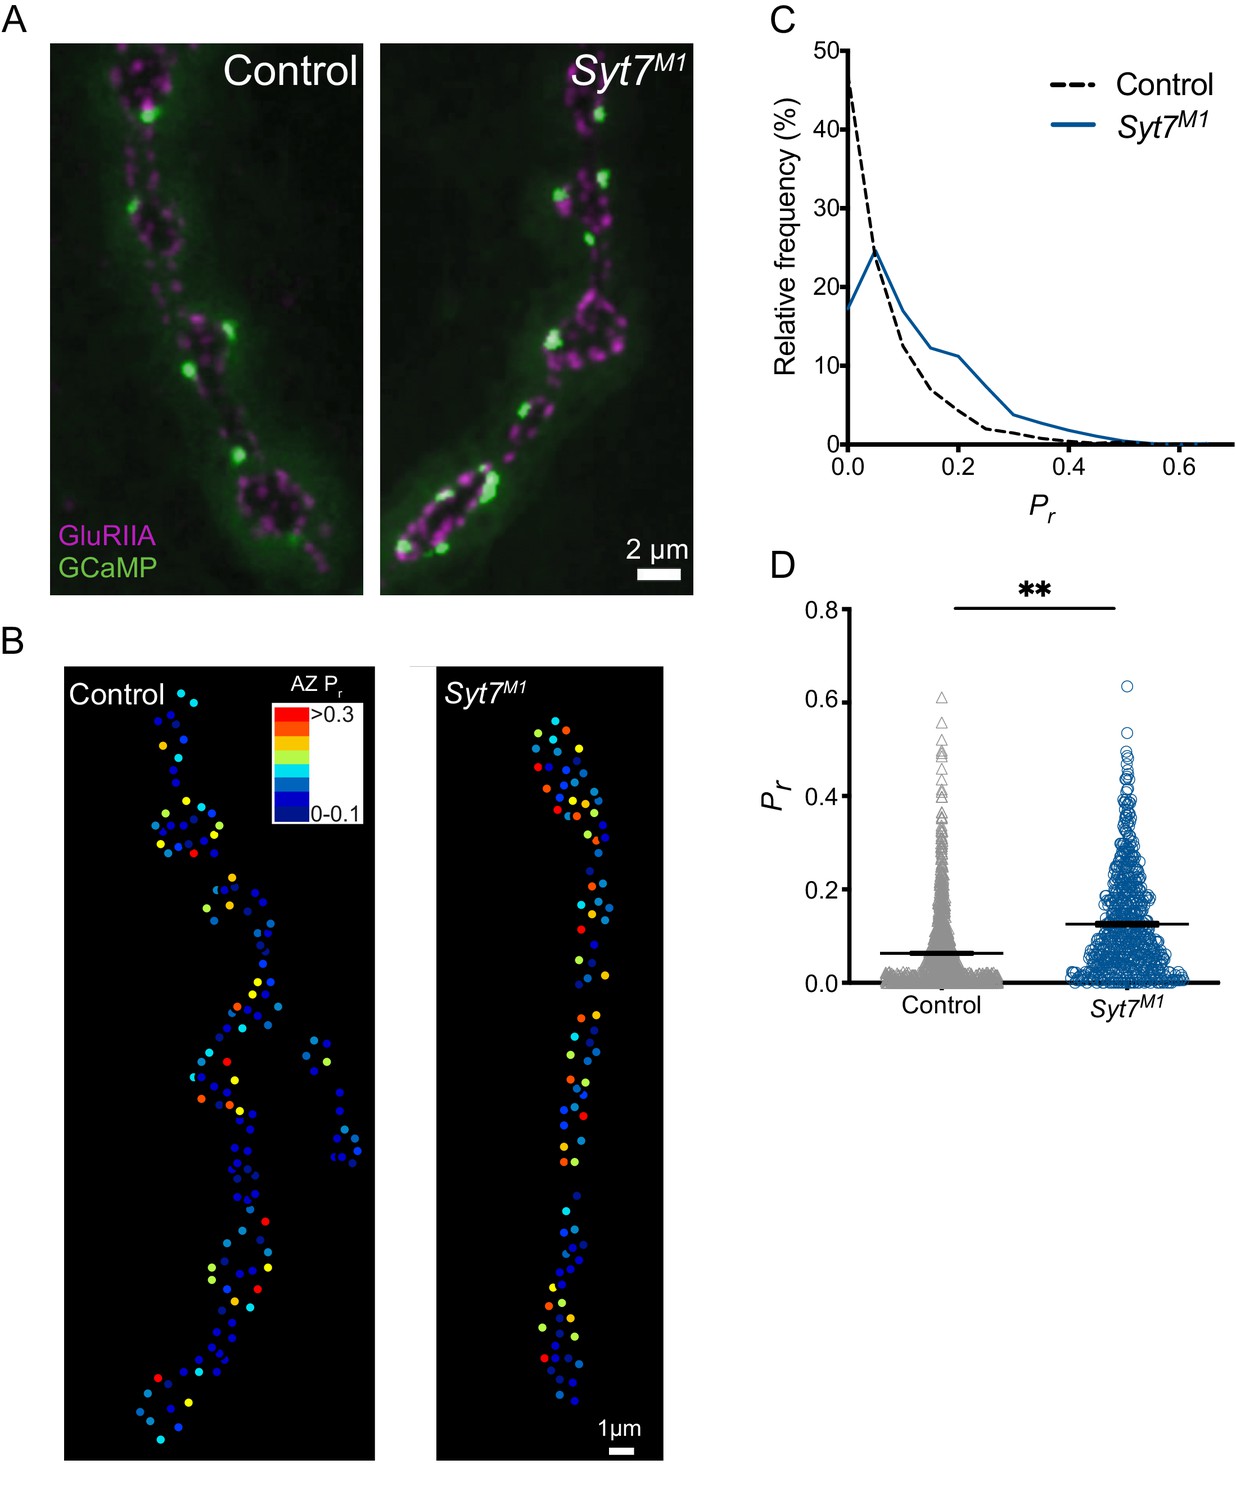
Quantal imaging reveals elevated release probability across the AZ population in Syt7 mutants.
(A) Representative images of GluRIIA positive PSDs (red) and postsynaptic myr-GCaMP6 flashes (green) in response to evoked stimulation in control and Syt7M1 mutants. (B) Pr heatmaps for muscle 4 NMJs generated following 0.3 Hz stimulation for 5 min in control and Syt7M1 mutants. The Pr color map is displayed in the upper right. (C) Frequency distribution of AZ Pr after a 0.3 Hz 5 min stimulation for control (black dashed line) and Syt7M1 (blue line). (D) Quantification of mean AZ Pr for the two genotypes (p≤0.01, Student’s t-test; control: 0.063 ± 0.002, n = 1158; Syt7M2: 0.12 ± 0.004, n = 768).
Figure 7
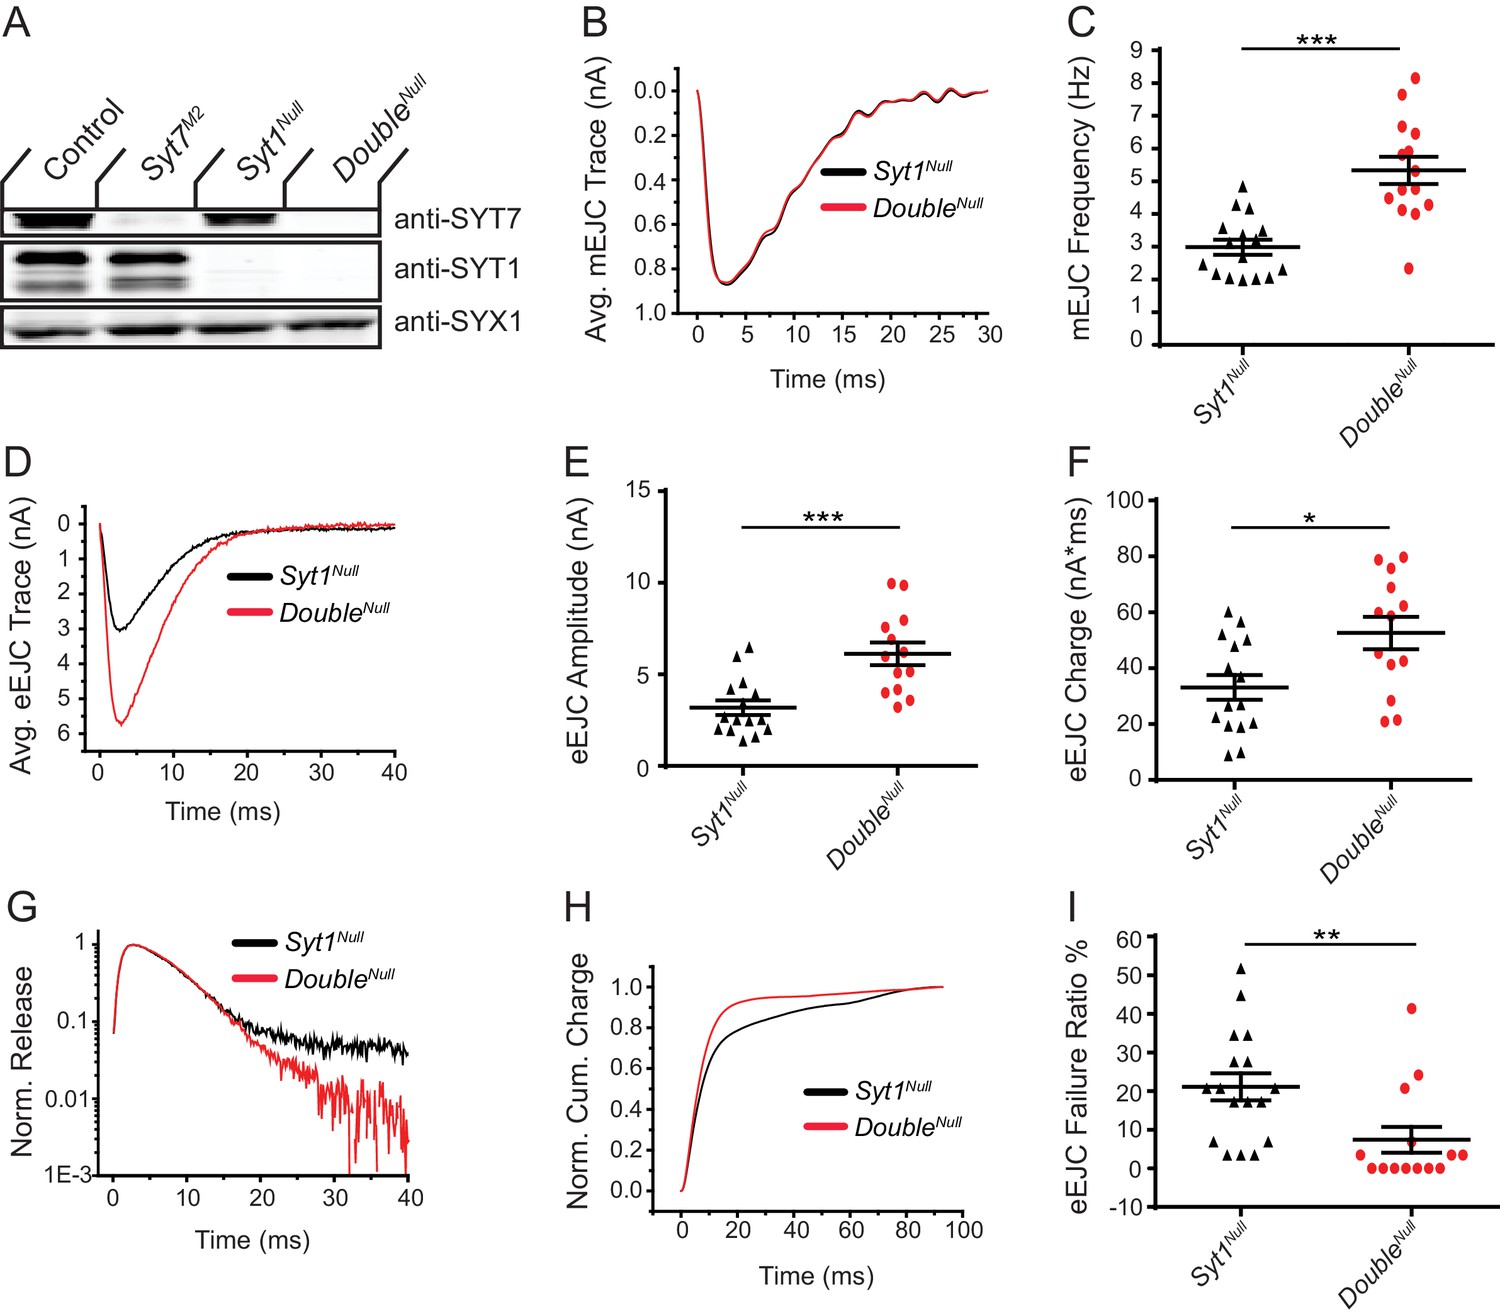
Loss of SYT7 enhances the residual release observed in Syt1 null mutants.
(A) Western blot of head extracts from control, Syt7M2, Syt1Null and Syt1null; Syt7M2 (DoubleNull) probed with anti-SYT7, anti-SYT1 and anti-SYX1 (loading control). SYT1 migrates as a doublet at 55 and 70 kD (Littleton et al., 1993a). (B) Average mEJC traces in Syt1Null (black trace) and DoubleNull (red trace) mutants obtained by summing all mEPSC events under the first peak distribution. (C) Quantification of mean mEJC frequency for the indicated genotypes. (D) Average eEJC traces in Syt1Null (black trace) and DoubleNull (red trace). (E) Quantification of mean eEJC amplitude for the indicated genotypes. (F) Quantification of mean eEJC charge for the indicated genotypes obtained by measuring total release over time. (G) Average normalized responses for each genotype plotted on a semi-logarithmic graph to display release components. (H) Cumulative release normalized to the maximum response in 2 mM Ca2+ for each genotype. Each trace was adjusted to a double exponential fit. (I) Quantification of eEJC failure ratio (%) in the indicated genotypes. Recordings were performed from 3rd instar segment A3 muscle 6 in 2 mM extracellular Ca2+. Statistical significance was determined with the Mann-Whitney unpaired t-test.
Figure 8
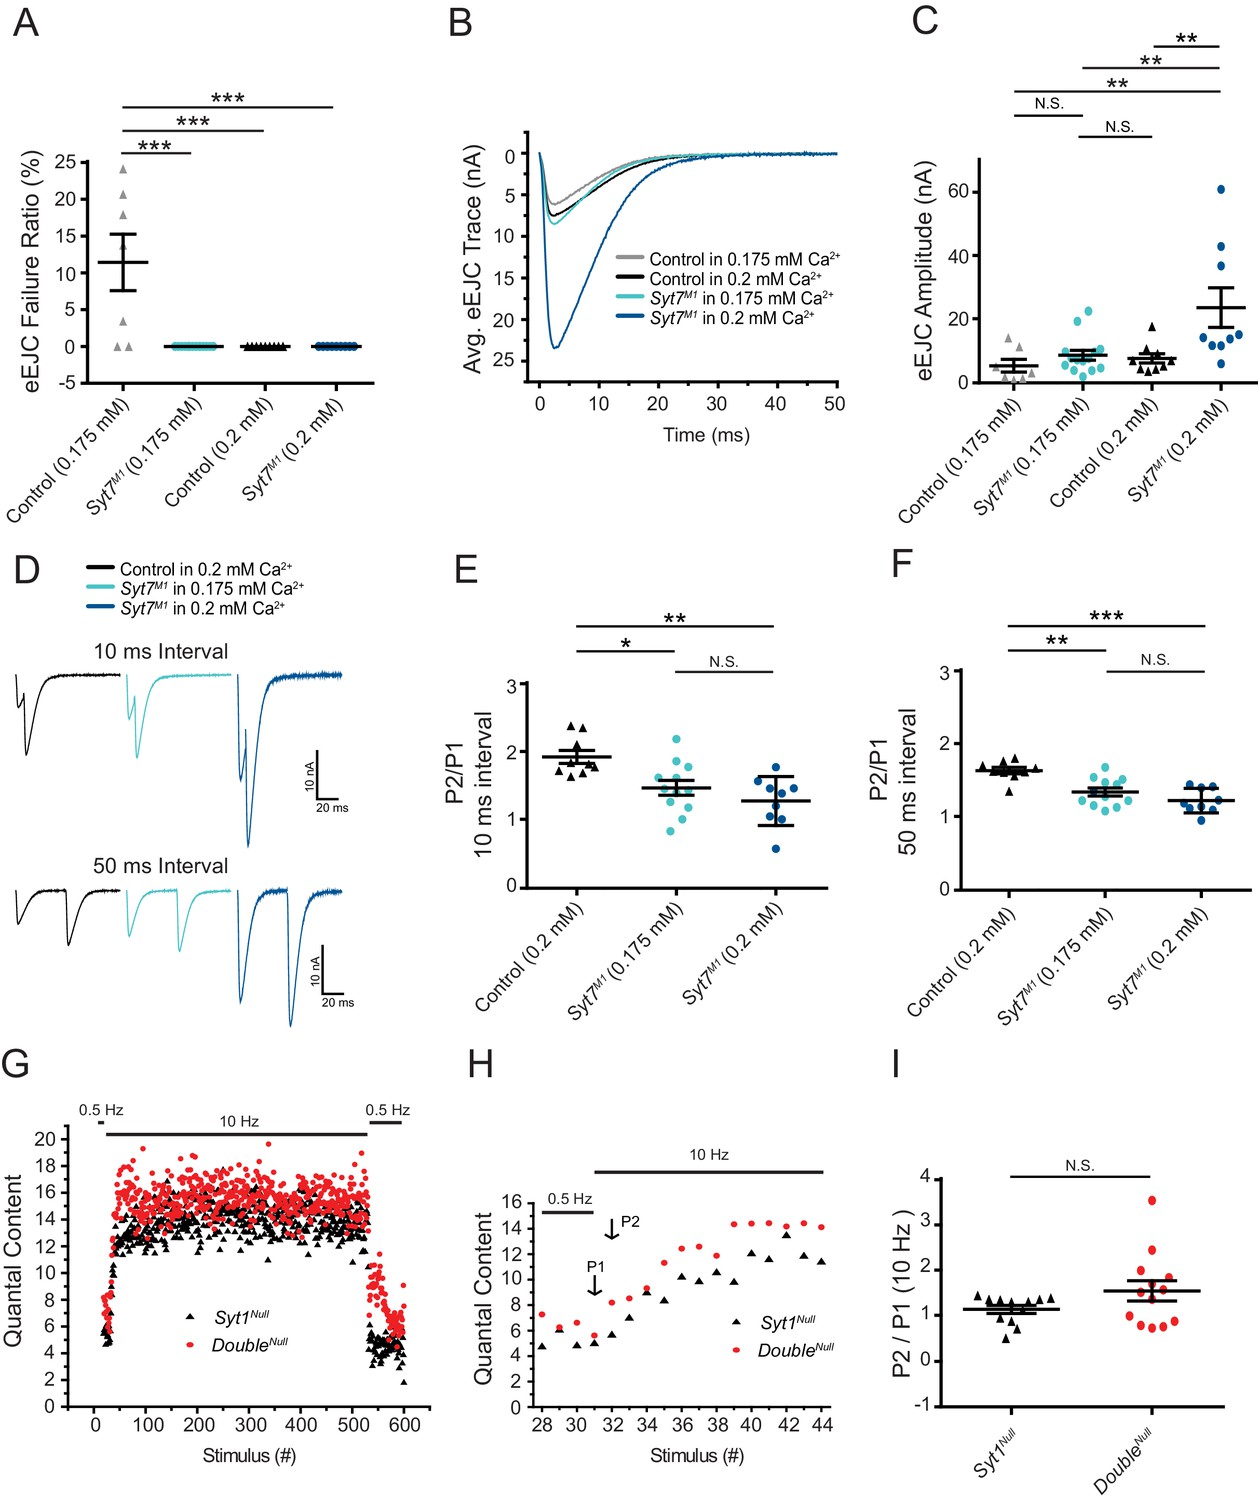
Short-term synaptic facilitation can occur without SYT7 or SYT1.
(A) Quantification of eEJC failure ratio (%) in the indicated genotypes. (B) Average eEJC traces recorded in 0.175 mM Ca2+ (control, grey; Syt7M1, light blue) or 0.2 mM Ca2+ (control, black; Syt7M1, dark blue). (C) Quantification of mean eEJC amplitude for the indicated genotypes (0.175 mM Ca2+: control, 5.42 ± 2.0 nA, n = 7; Syt7M1, 8.70 ± 1.6 nA, n = 14; 0.2 mM Ca2+: control, 7.73 ± 1.5 nA, n = 9; Syt7M1, 23.72 ± 6.2 nA, n = 9). (D) Representative eEJC traces to 10 ms or 50 ms paired-pulse stimuli recorded in 0.2 mM Ca2+ (control, black; Syt7M1, dark blue) or 0.175 mM Ca2+ (Syt7M1, light blue). (E) Quantification of facilitation (P2/P1) at 10 ms interval for the indicated genotypes (0.2 mM Ca2+: control, 1.93 ± 0.095, n = 9; Syt7M1, 1.28 ± 0.12, n = 9; 0.175 mM Ca2+: Syt7M1, 1.47 ± 0.11, n = 12). (F) Quantification of facilitation (P2/P1) at 50 ms interval for the indicated genotypes (0.2 mM Ca2+: control, 1.64 ± 0.043, n = 9; Syt7M1, 1.23 ± 0.056, n = 9; 0.175 mM Ca2+: Syt7M1, 1.34 ± 0.054, n = 12). Statistical significance was determined using one-way ANOVA (nonparametric) with post hoc Tukey’s multiple comparisons test for panels A-F. (G) Average eEJC quantal content determined from mEJC charge in 2 mM Ca2+ during a 10 Hz stimulation paradigm (30 stimuli at 0.5 Hz, 500 stimuli at 10 Hz, and return to 0.5 Hz) in Syt1Null (black) and DoubleNull (red). (H) Average quantal content for the last four responses of 0.5 Hz stimulation and the first 14 responses during 10 Hz stimulation in Syt1Null (black) and DoubleNull (red). P1 denotes the 1st response and P2 the 2nd response to 10 Hz stimulation. (I) Quantification of P2/P1 ratio in Syt1Null (black, 1.15 ± 0.089, n = 12) and DoubleNull (red, 1.55 ± 0.22, n = 13) at onset of 10 Hz stimulation. Statistical significance was determined with a Mann-Whitney unpaired t-test for panels H and I.
Figure 9
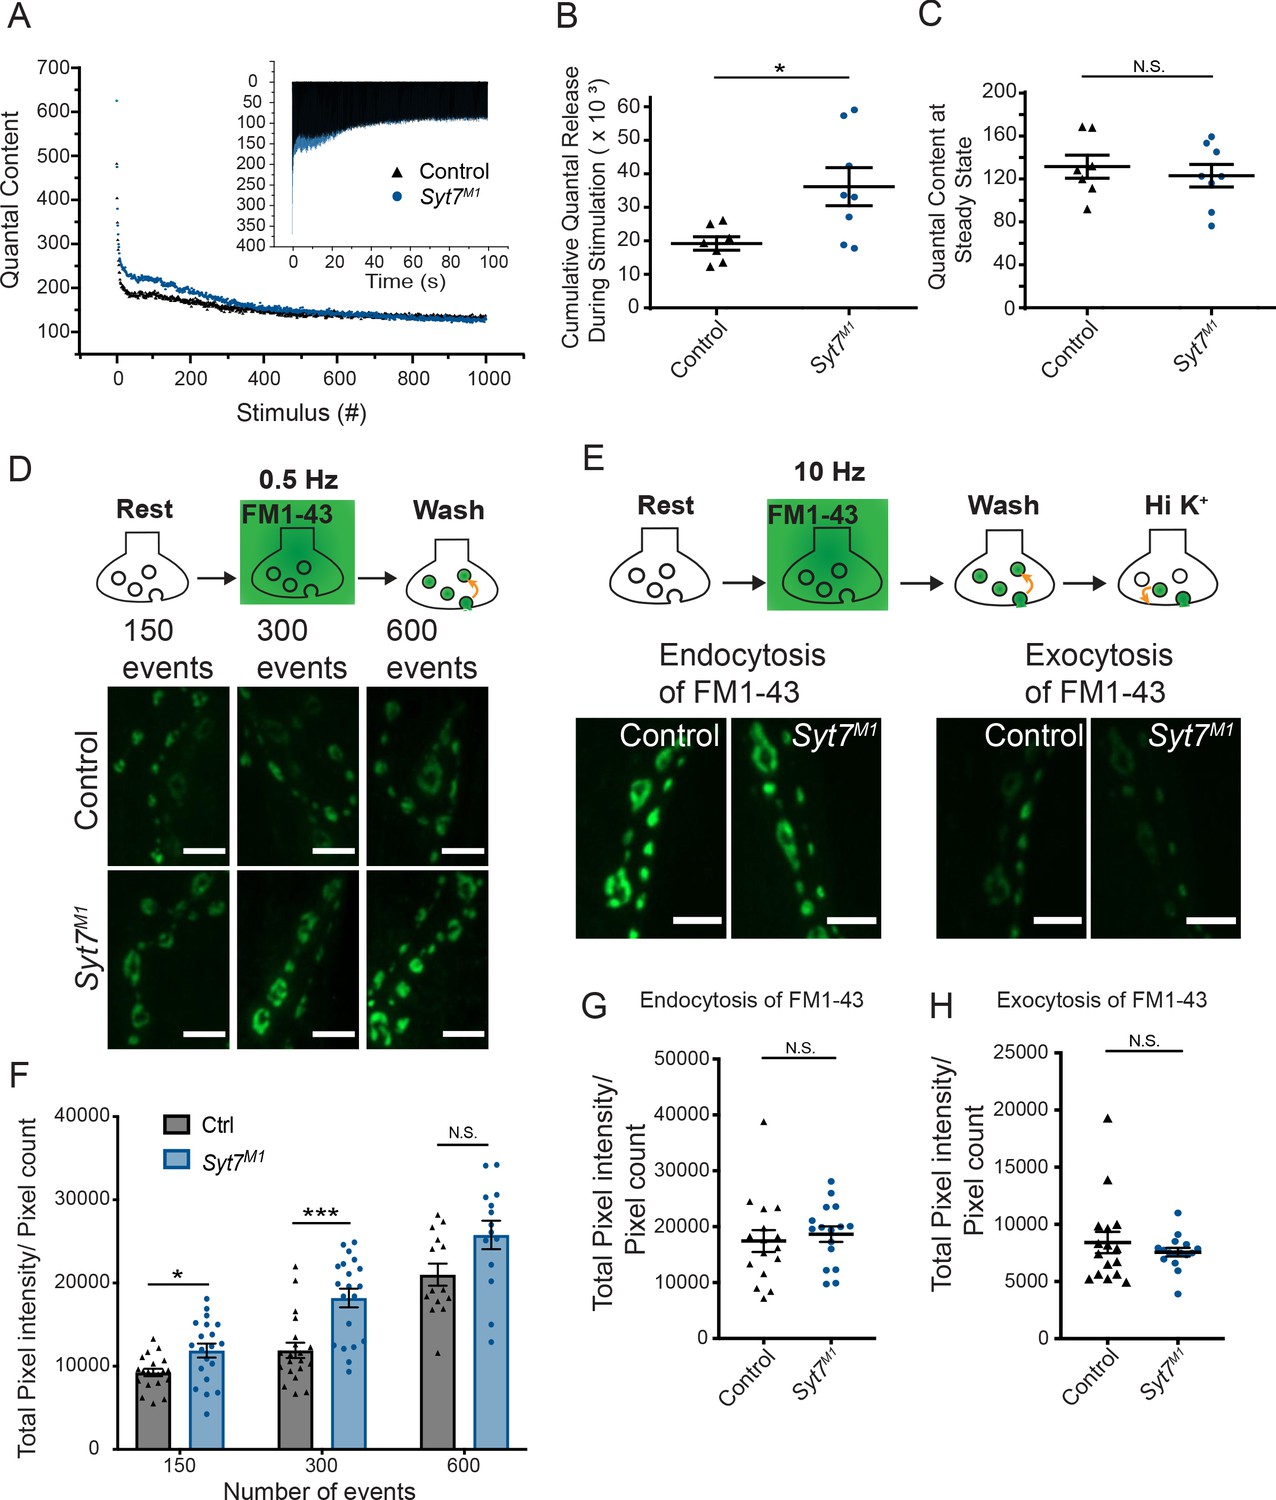
Syt7 mutants have a larger releasable pool of SVs and normal endocytosis.
(A) Representative mean eEJC quantal content determined by mEJC charge during 1000 stimuli at 10 Hz in 2 mM Ca2+ in control (black) and Syt7M1 (blue). The inset shows representative eEJC traces in control (black) and Syt7M1 (blue). (B) Quantification of average cumulative quanta released during the 1000 stimuli at 10 Hz tetanic stimulation in control (black, 19.21K ± 2.88K, n = 7) and Syt7M1 (blue, 36.18K ± 5.67K, n = 8). (C) Quantification of average quantal content at steady-state release at the end of the 10 Hz stimulation in control (black, 131.54 ± 10.71, n = 7) and Syt7M1 (blue, 123.05 ± 10.47, n = 8). Statistical significance for B and C was determined with a Mann-Whitney unpaired t-test. (D) FM1-43 loading in control and Syt7M1 larvae at muscle 6/7 NMJs in 2 mM Ca2+ following 150, 300 or 600 stimuli delivered at 0.5 Hz. (E) FM1-43 loading with 500 stimuli at 10 Hz in 2 mM Ca2+ and FM1-43 unloading with high K+ (90 mM) in control and Syt7M1 larvae at muscle 6/7 NMJs. (F) Quantification of FM1-43 loading following 150, 300 or 600 stimuli delivered at 0.5 Hz. (G) Quantification of FM1-43 loading after 500 stimulati at 10 Hz. (H) Quantification of FM1-43 unloading with high K+ (90 mM). Statistical significance was determined with Student’s t-test for F-H. Scale bar = 5 µm.
Figure 10 with 2 supplements
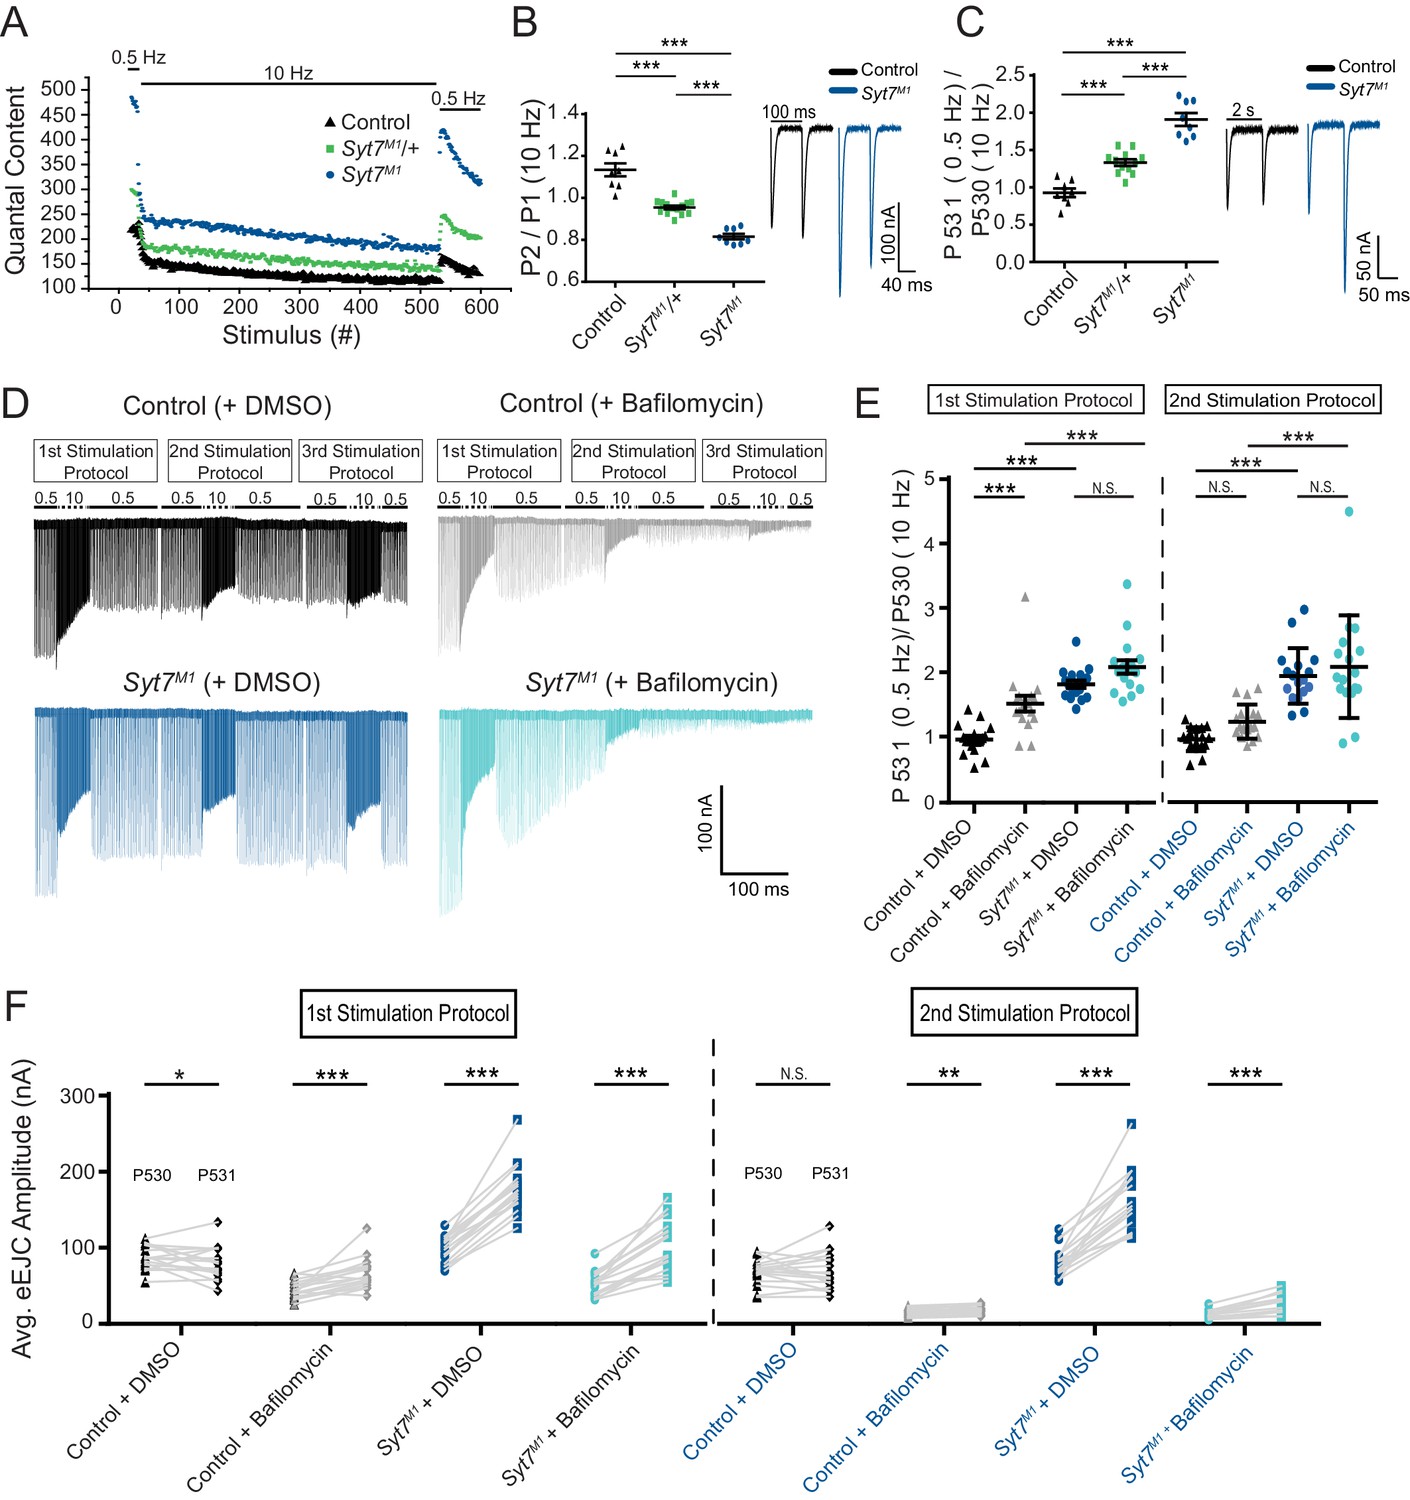
Syt7 mutants have enhanced refilling of the RRP that does not require endocytosis.
(A) Average eEJC quantal content during the indicated stimulation protocol in 2 mM external Ca2+ for control (black), Syt7M1/+ (green) and Syt7M1 (blue). (B) Quantification of P2/P1 ratio (P1 = 1st response to 10 Hz, P2 = 2nd response to 10 Hz) in control (black, 1.13 ± 0.03, n = 8), Syt7M1/+ (green, 0.95 ± 0.009, n = 14) and Syt7M1 (blue, 0.82 ± 0.01, n = 8). Representative eEJC traces of P1 and P2 for control (black) and Syt7M1 (blue) are shown on the right. (C) Quantification of P531/P530 ratio (P530 is the last response to 10 Hz and P531 is the 1st response to 0.5 Hz stimulation delivered 2 s after P530) in control (black, 0.93 ± 0.06, n = 8), Syt7M1/+ (green, 1.33 ± 0.04, n = 12) and Syt7M1 (blue, 1.91 ± 0.09, n = 8). Representative eEJC traces of P530 and P531 for control (black) and Syt7M1 (blue) are shown on the right. (D) Representative eEJC traces for control with DMSO (black) or 4 µM bafilomycin (gray) and Syt7M1 with DMSO (dark blue) or 4 µM bafilomycin (light blue) in 2 mM external Ca2+ with the indicated stimulation protocol repeated three times. (E) Quantification of P531/P530 for the indicated genotypes (1st stimulation protocol: Control + DMSO, 0.98 ± 0.056, n = 17; Control + bafilomycin, 1.53 ± 0.12, n = 17; Syt7M1 + DMSO, 1.83 ± 0.058, n = 17; Syt7M1 + bafilomycin, 2.10 ± 0.11, n = 17; 2nd stimulation protocol: Control + DMSO, 0.97 ± 0.045, n = 17; Control + bafilomycin, 1.25 ± 0.064, n = 17; Syt7M1 + DMSO, 1.95 ± 0.10, n = 17; Syt7M1 + bafilomycin, 2.09 ± 0.19, n = 17). Statistical significance was determined with a one-way Anova with Sidak’s multiple comparisons test. (F) Quantification of mean eEJC amplitudes for P530 and P531 for the indicated genotypes (1st stimulation protocol: P530 in Control + DMSO, 87.39 ± 3.85, n = 17; P531 in Control + DMSO, 80.22 ± 5.25, n = 17; P530 in Control + bafilomycin, 44.68 ± 2.80, n = 17; P531 in Control + bafilomycin, 66.26 ± 5.03, n = 17; P530 in Syt7M1 + DMSO, 97.62 ± 4.04, n = 17; P531 in Syt7M1 + DMSO, 177.34 ± 7.80, n = 17; P530 in Syt7M1 + bafilomycin, 52.44 ± 3.83, n = 17; P531 in Syt7M1 + bafilomycin, 102.50 ± 8.07, n = 17; 2nd stimulation protocol: P530 in Control + DMSO, 68.21 ± 3.97, n = 17; P531 in Control + DMSO, 70.05 ± 5.95, n = 17; P530 in Control + bafilomycin, 15.09 ± 1.26, n = 17; P531 in Control + bafilomycin, 18.15 ± 1.34, n = 17; P530 in Syt7M1 + DMSO, 82.89 ± 4.64, n = 17; P531 in Syt7M1 + DMSO, 163.52 ± 9.74, n = 17; P530 in Syt7M1 + bafilomycin, 11.98 ± 1.26, n = 17; P531 in Syt7M1 + bafilomycin, 24.71 ± 3.00, n = 17). Statistical significance was determined with a Student’s paired t-test.
Figure 10—figure supplement 1
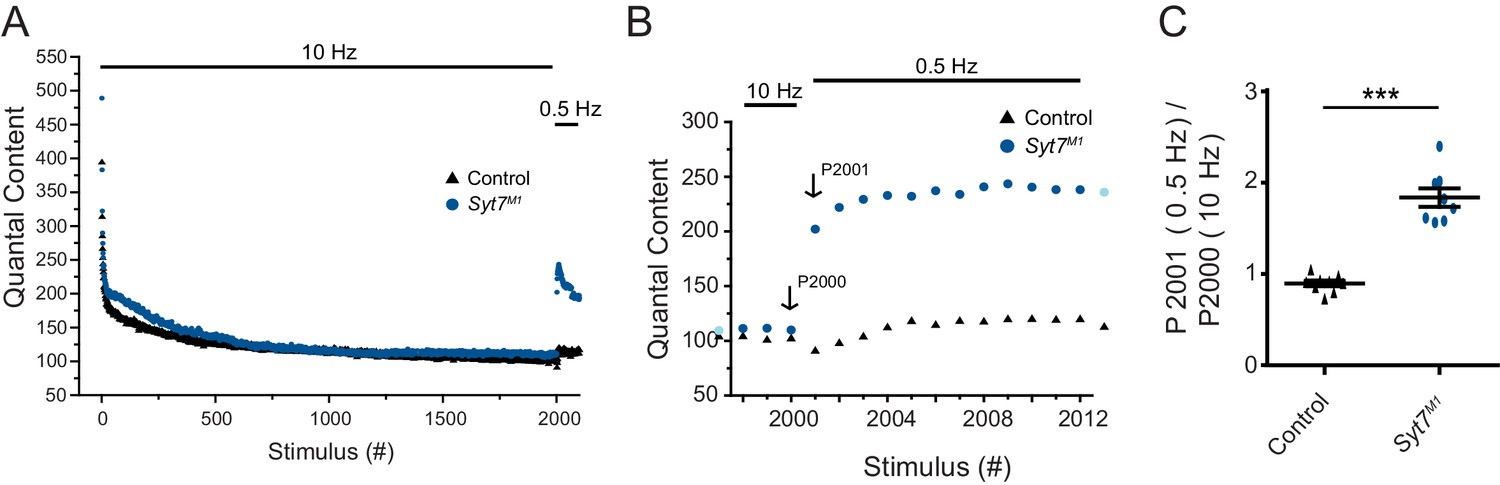
Enhanced recovery after termination of 10 Hz stimulation in Syt7 mutants.
(A) Average eEJC quantal content to 2000 stimuli at 10 Hz stimulation at 3rd instar segment A3 muscle 6 in 2 mM external Ca2+ for control (black) and Syt7M1 (blue). (B) Representative average quantal content of the last 3 responses to 10 Hz and the 1st 12 responses to 0.5 Hz stimulation. P2000 = last response to 10 Hz stimulation, P2001 = 1st response to 0.5 Hz stimulation 2 s after P2000. (C) Quantification of P2001/P2000 ratio for control (black, 0.90 ± 0.03, n = 9) and Syt7M1 (blue, 1.84 ± 0.10, n = 8). Statistical significance was determined with a Mann-Whitney unpaired t-test.
Figure 10—figure supplement 2
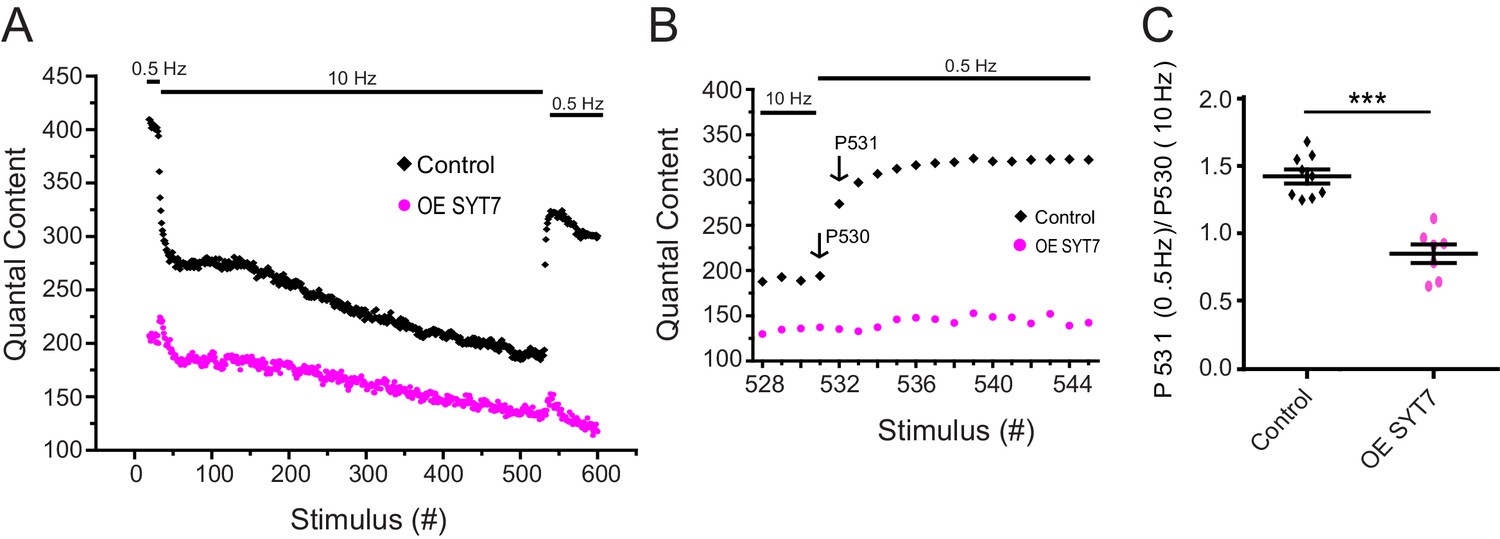
SYT7 overexpression reduces RRP refilling following 10 Hz stimulation.
(A) Representative average eEJC quantal content for the indicated stimulation in 2 mM external Ca2+ in control (black) and elavC155-GAL4; UAS-Syt7 (OE SYT7, magenta). (B) Representative average quantal content for the last 4 responses during 10 Hz and the 1st 14 responses during 0.5 Hz in control (black) and OE SYT7 (magenta). (C) Quantification of P531/P530 ratio for control (black, 1.43 ± 0.052, n = 9) and OE SYT7 (magenta, 0.85 ± 0.068, n = 7). Statistical significance was determined with a Mann-Whitney unpaired t-test.
Figure 11 with 2 supplements
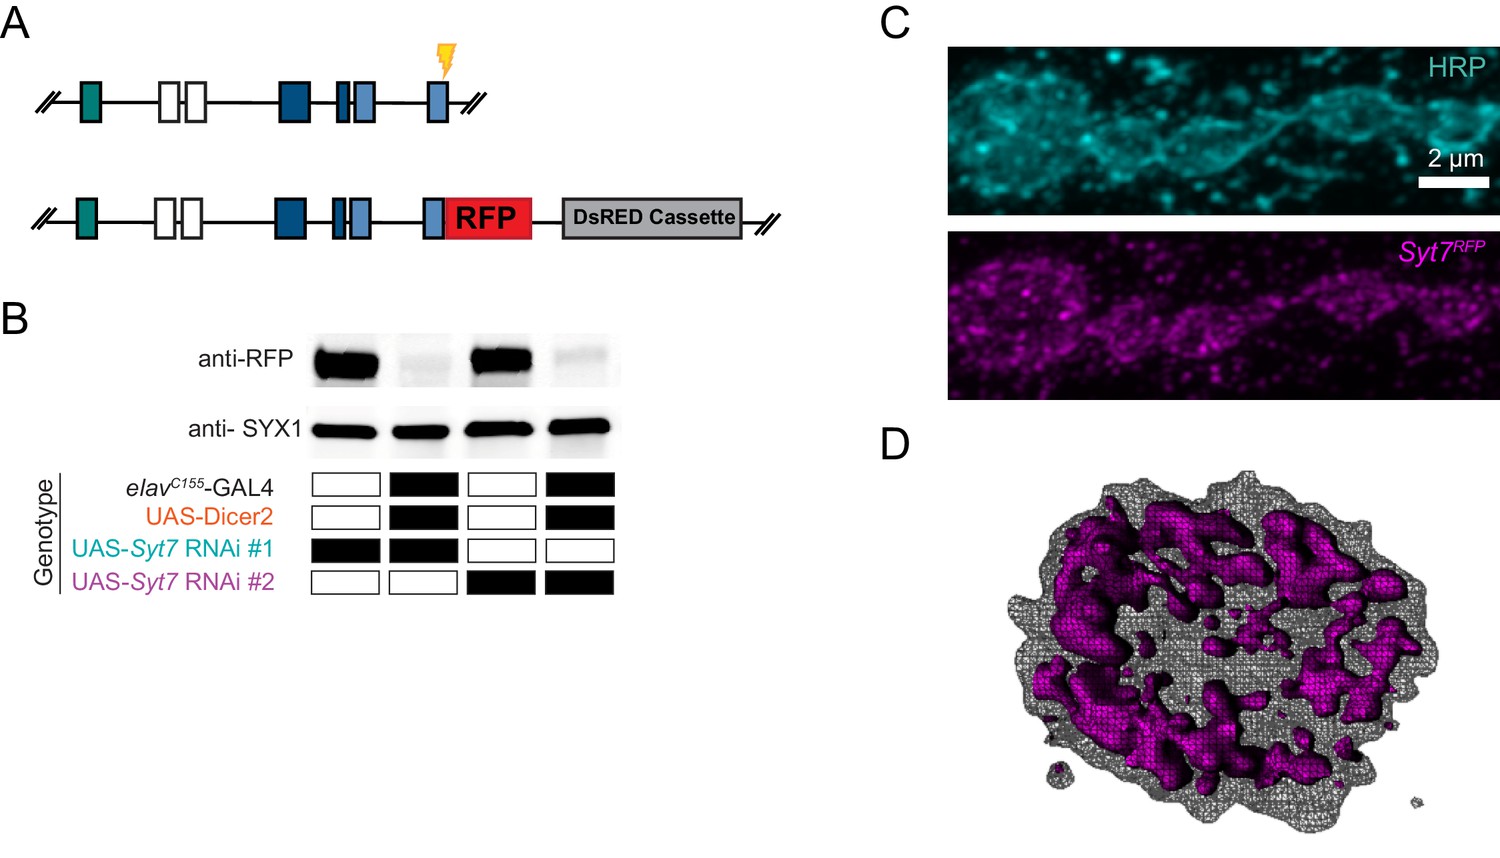
Tagging and location of endogenous SYT7.
(A) CRISPR strategy used to insert RFP in frame at the Syt7 3’end to generate SYT7RFP. Exon coloring is the same as Figure 1D. The guide RNA cleavage site is displayed in yellow. (B) Two Syt7 UAS-RNAi lines (#1 and #2) were used to pan-neuronally knockdown SYT7RFP. Western blot analysis of head extracts probed with anti-RFP (top panel) from SYT7RFP adults following pan-neuronal knockdown of SYT7: lane 1: UAS-Syt7 RNAi#1; SYT7RFP; lane 2: elavC155-GAL4, UAS-Dicer2; UAS-Syt7 RNAi#1; SYT7RFP; lane 3: UAS-Syt7 RNAi#2; SYT7RFP; lane 4: elavC155-GAL4, UAS-Dicer2; UAS-Syt7 RNAi line#2; SYT7RFP. SYX1 antisera was used as a loading control (bottom panel). (C) Immunocytochemistry with anti-HRP (top) and anti-RFP (bottom) in SYT7RFP3rd instar larvae at muscle 6/7 NMJs. SYT7RFP staining is abundant in the presynaptic terminal, with a few postsynaptic membrane compartments also labeled. (D) 3D rendering of the terminal bouton (left) from above. The SYT7RFP intra-terminal compartment is labeled in magenta, with HRP-labeled plasma membrane indicated with a grey mesh. Scale bar = 2 µm.
Figure 11—figure supplement 1
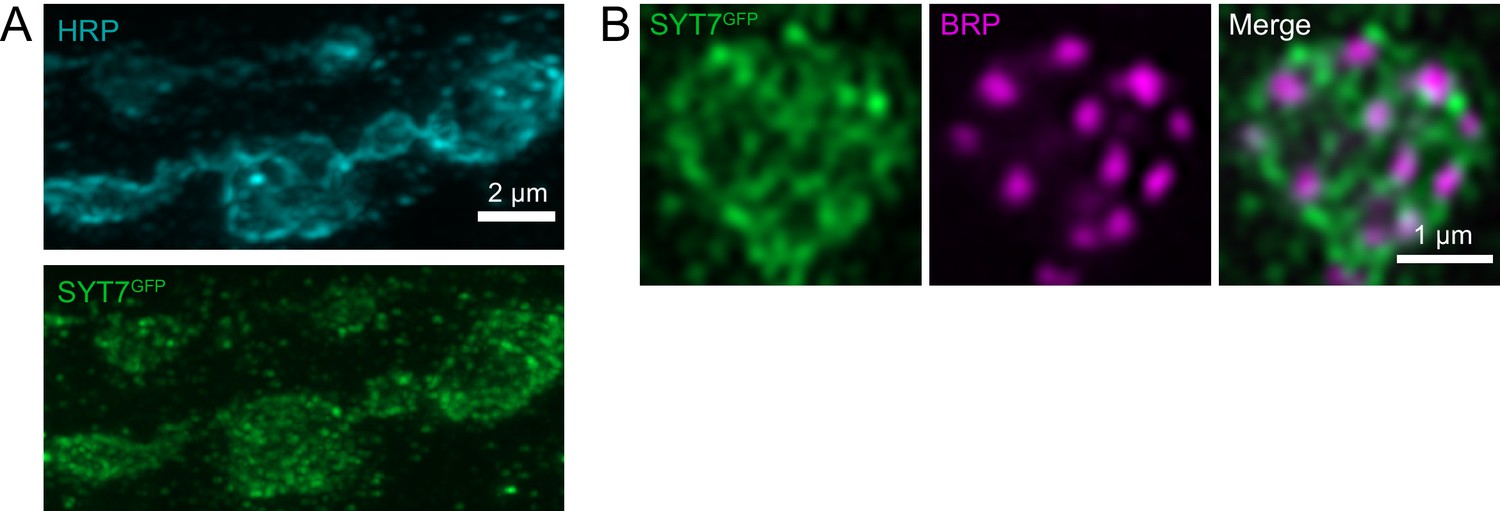
Location of SYT7GFP within synaptic boutons.
(A) Immunocytochemistry with anti-HRP (top) and anti-GFP (bottom) in SYT7GFP3rd instar larvae at muscle 6/7 NMJs. SYT7GFP staining, like SYT7RFP, localizes throughout the presynaptic terminal. Scale bar = 2 µm. (B) Synaptic bouton immunolabeled with anti-BRP and anti-GFP in SYT7GFP larvae. SYT7 surrounds but does not co-localize with BRP-labeled AZs, similar to other previously described peri-AZ proteins. Scale bar = 1 µm.
Figure 11—figure supplement 2
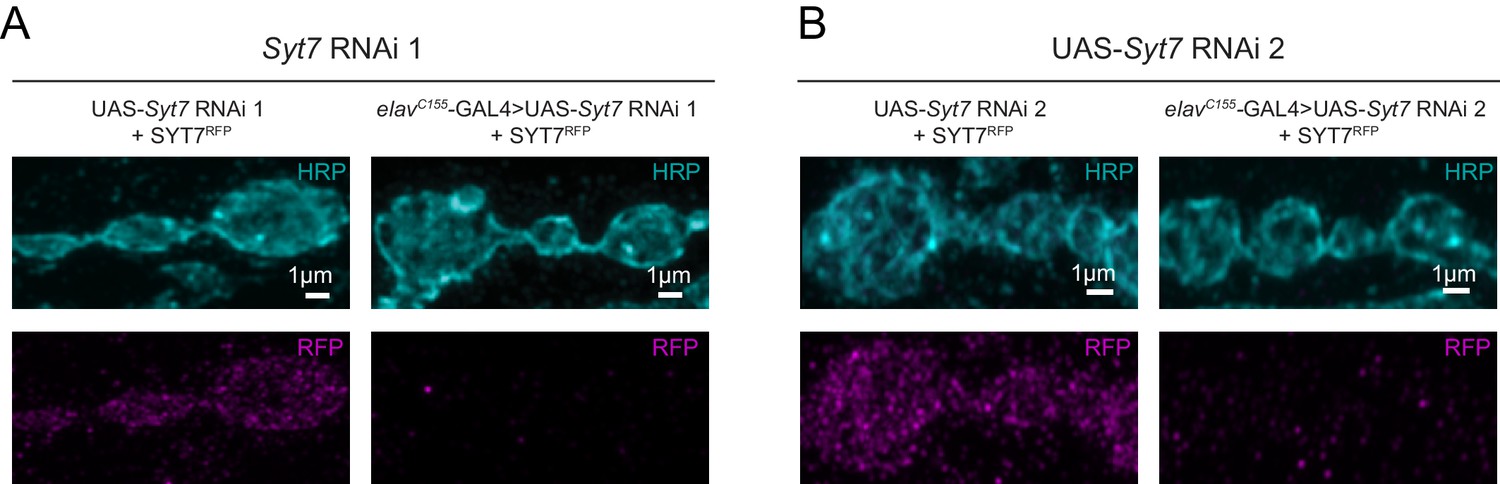
Knockdown of SYT7RFP with Syt7 RNAi eliminates RFP immunostaining.
(A) Immunocytochemistry with anti-HRP (cyan) and anti-RFP (magenta) in SYT7RFP3rd instar larvae without (left) or with elavC155-GAL4, UAS-Dicer2; UAS-Syt7 RNAi#1. (B) Immunocytochemistry with anti-HRP and anti-RFP in SYT7RFP without (left) or with elavC155-GAL4, UAS-Dicer2; UAS-Syt7 RNAi#2 (right). Neuronal knockdown of SYT7RFP eliminates presynaptic and most postsynaptic SYT7 staining, suggesting a small fraction of SYT7RFP may undergo exosome-mediated transfer, as shown for SYT4. The majority of SYT7 protein resides in the presynaptic terminal. Scale bar = 2 µm.
Figure 12 with 4 supplements

Localization of SYT7 in presynaptic terminals.
Immunostaining for the indicated proteins in each panel was performed at 3rd instar larval muscle 6/7 NMJs. Staining for all panels except A were done in the SYT7RFP endogenously tagged background using anti-RFP to label the SYT7 compartment, with the merged image shown on the right. The Pearson correlation coefficient (r) calculated from the cytofluorogram co-localization plots is shown on the upper right. All images are from single confocal planes. (A) Co-localization of the SV proteins SYT1 (left, magenta, anti-SYT1 antisera) and nSYB (middle, green, endogenous nSYBGFP) as a positive control. The remaining panels show boutons co-stained for SYT7RFP (left, magenta, anti-RFP antisera) and the indicated compartment marker (middle, green): (B) Dynamin (anti-DYN antisera); (C) SYX1 (anti-SYX1 antisera); (D) Reticulin like-1 (elavC155-GAL4; UAS-RTNL1-GFP); (E) lysosomal Na+/H+ exchanger 1 (elavC155-GAL4; UAS-NHE-GFP); (F) HRP (anti-HRP antisera); (G) BRP (anti-BRP Nc82 antisera); (H) nSYB (nSYBGFP); (I) Atrial natriuretic peptide (elavC155-GAL4; UAS-ANF-GFP); (J) SYT4 (endogenously tagged SYT4GFP-2M); (K) RAB7 (anti-RAB7 antisera); and (L) Golgin84 (anti-GOLGIN84 antisera). Co-localization plots were generated with normalized pixel intensity of stacked images of 10–24 type Ib boutons from three animals per genotype, with the color representing the frequency of data points as shown in the right scale bar. The vertical line on the X-axis indicates the threshold used to identify pixels above background for the compartment stain. The horizontal line on the Y-axis represents the threshold used to identify pixels above background for SYT7. Scale bar = 1 µm.
Figure 12—figure supplement 1
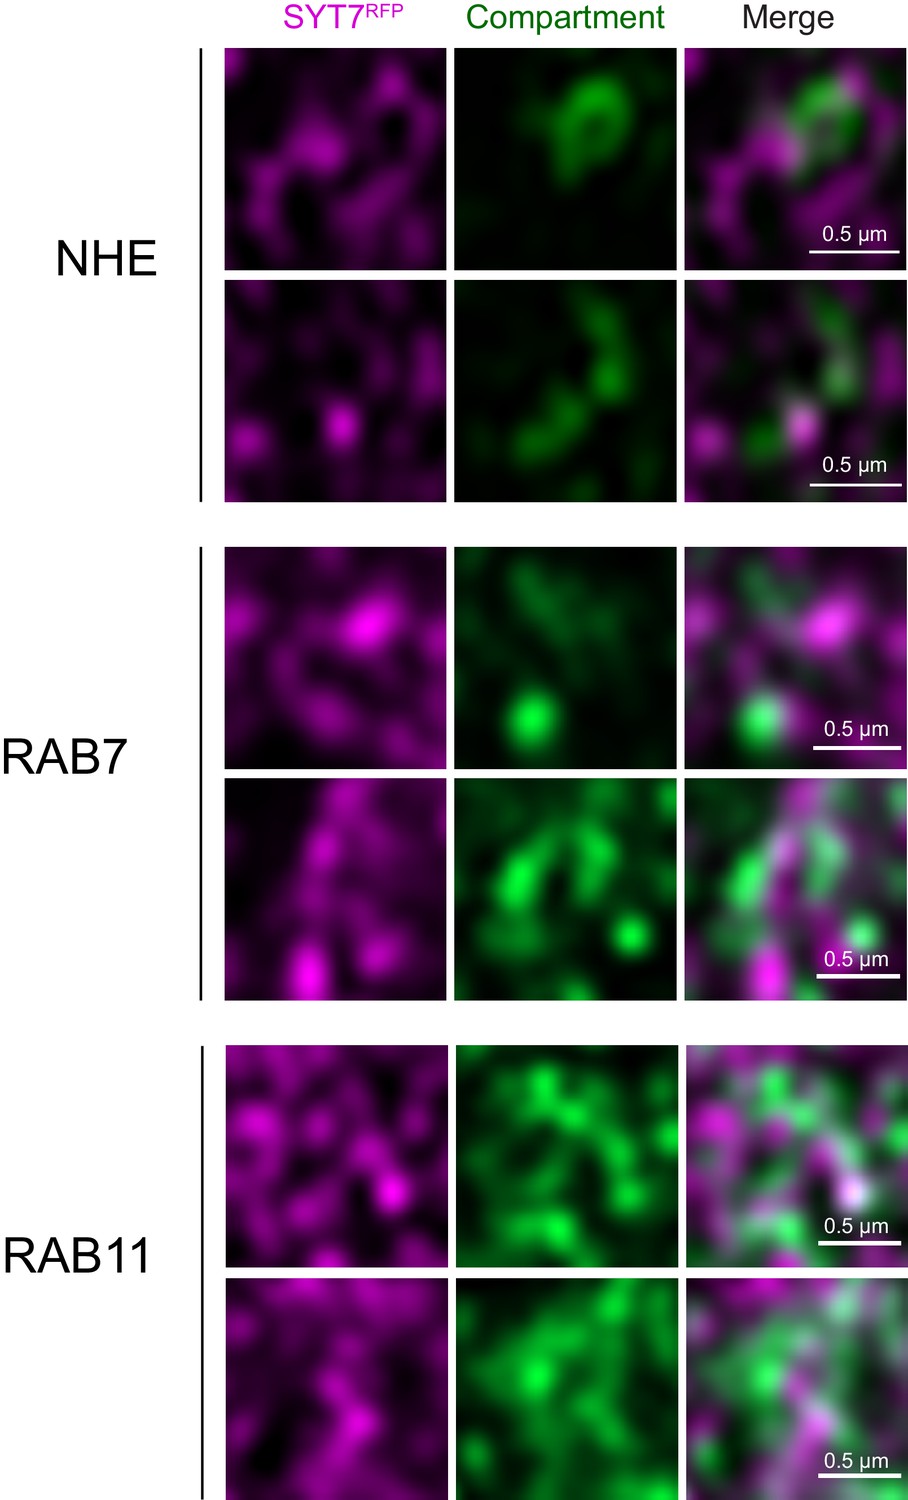
SYT7 tubules reside in proximity to multiple presynaptic compartments.
Immunostaining for endogenously-tagged SYT7RFP (label) and a lysosomal marker (NHE), a late endosomal marker (RAB7) and a peri-AZ endosomal protein (RAB11). The merged image is shown on the right. Scale bar = 0.5 µm.
Figure 12—figure supplement 2
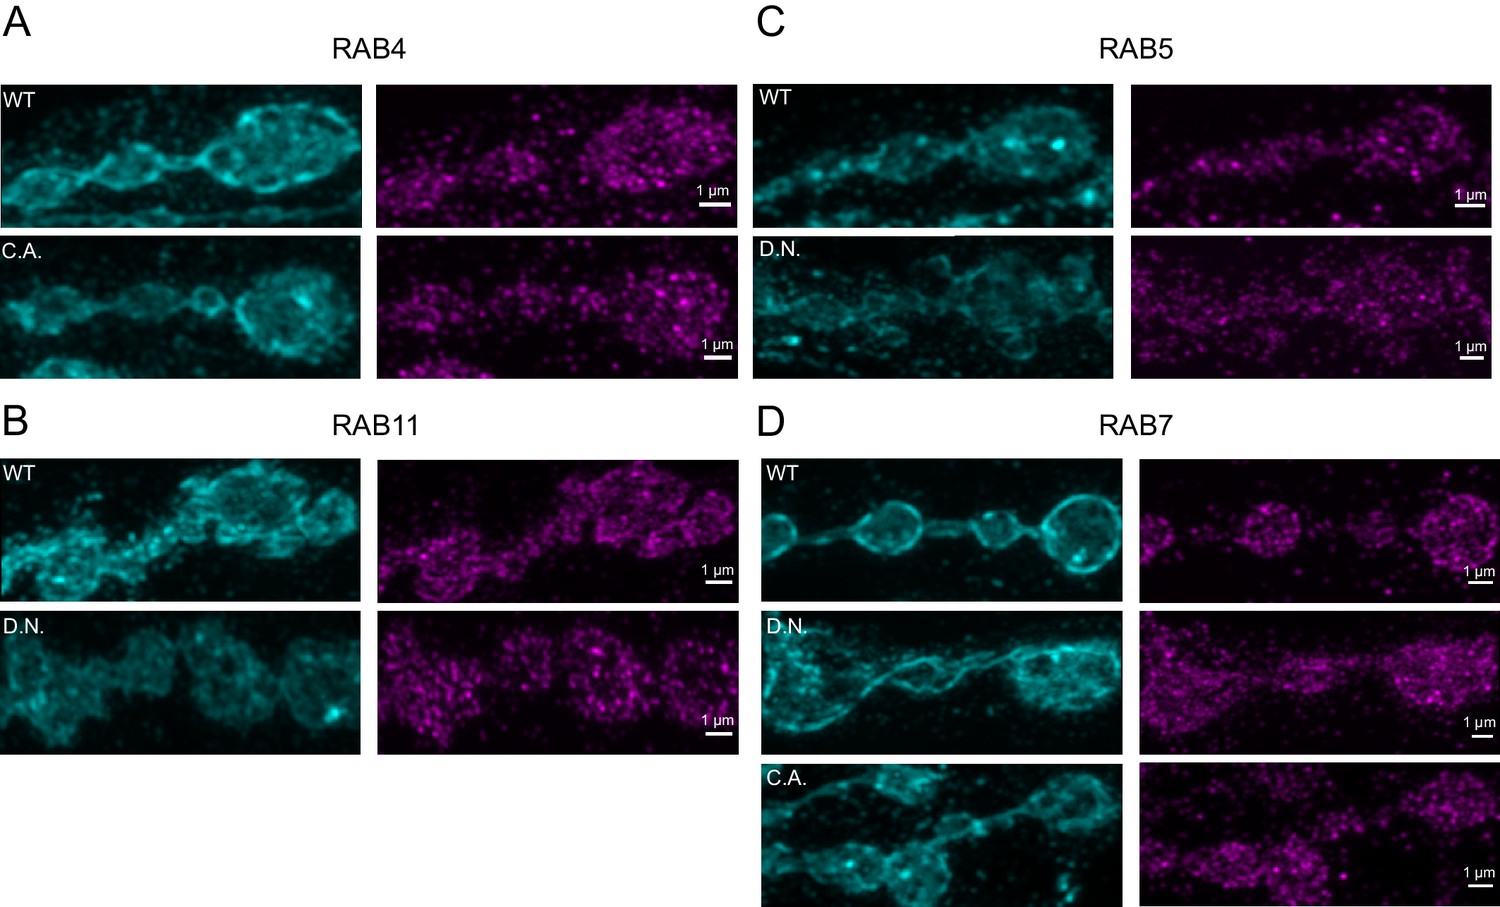
SYT7 localization is not altered by specific RAB protein manipulations.
Dominant-negative (D.N), constitutively-active (C.A.) or wildtype (WT) RAB4, RAB5, RAB7 and RAB11 were expressed from UAS constructs with elavC155-GAL4 in the SYT7RFP background. Immunostaining with anti-HRP and anti-RFP to label the SYT7 compartment is shown for each manipulation. Several manipulations resulted in extremely reduced larval viability and could not be analyzed. Scale bar = 1 µm.
Figure 12—figure supplement 3
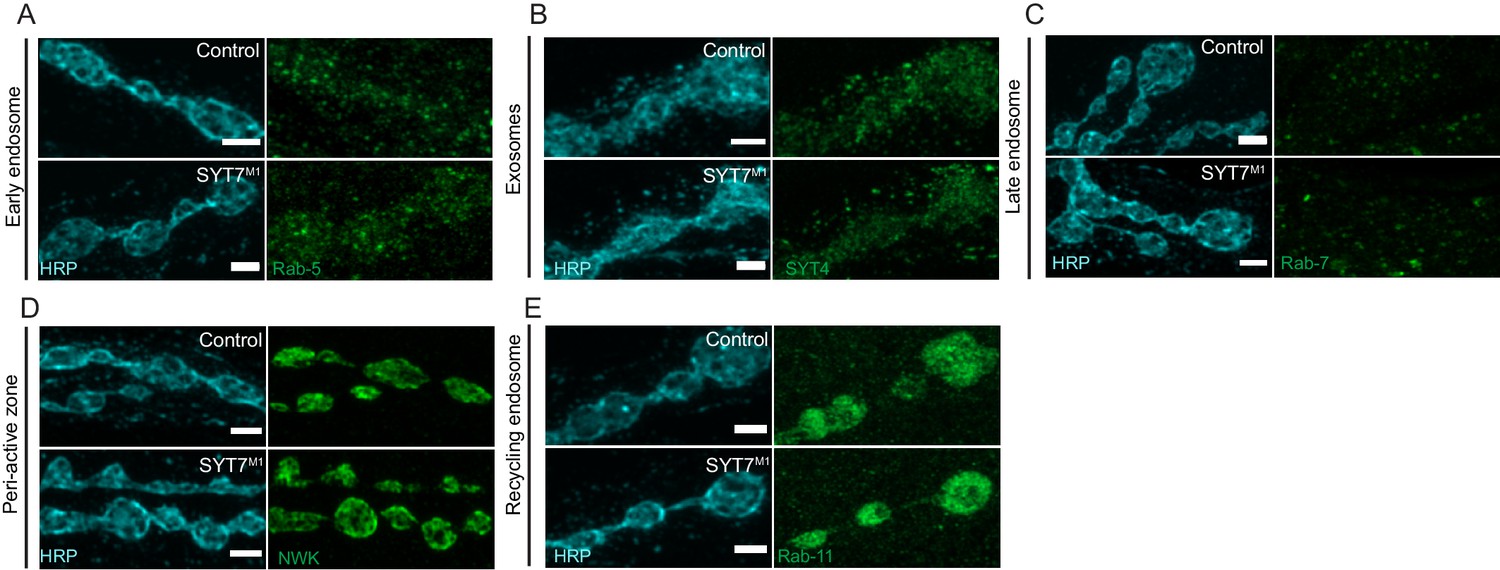
Localization of compartment-specific markers in Syt7 mutants.
Immunocytochemistry with anti-HRP (cyan) and anti-GFP (green) in control and Syt7M1 3rd instar larvae to label: (A) endogenously-tagged RAB5; (B) endogenously-tagged SYT4 (SYT4GFP-2M); (C) RAB7 (anti-RAB7 antisera); (D) NWK (anti-NWK antisera); and (E) endogenously tagged RAB11. No changes were observed in Syt7M1 mutants. Scale bar = 1 µm.
Figure 12—figure supplement 4
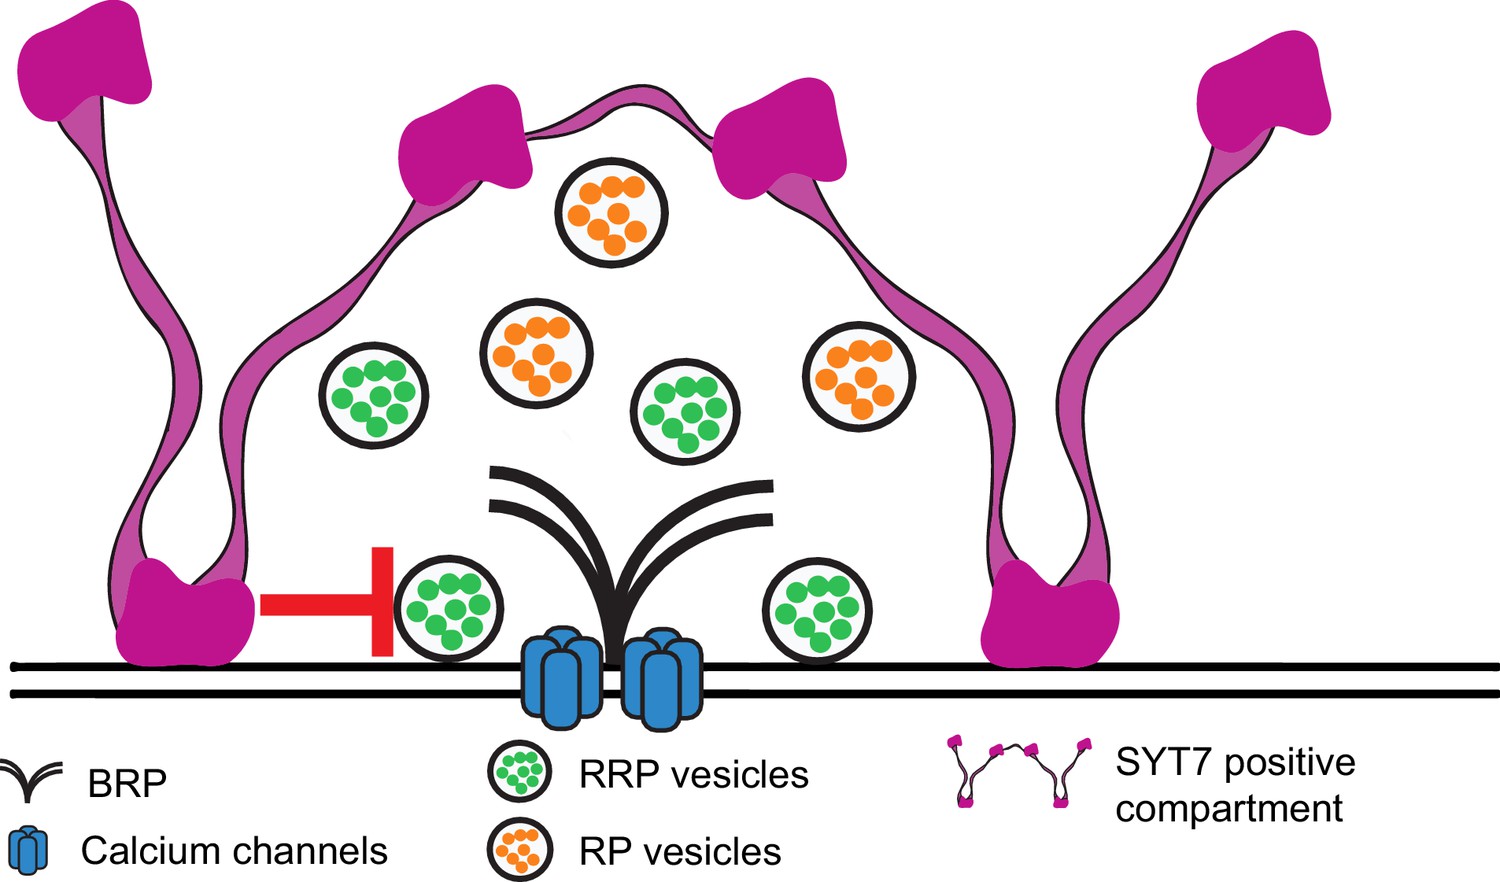
Model for SYT7 localization and function.
SYT7 functions to decrease the fusogenicity of SVs in the RRP and slow refilling of the RRP following stimulation. SYT7 localizes to internal tubular membranes within the peri-AZ network. This location places SYT7 at a key node to modulate SV re-entry into the RRP in a Ca2+-dependent manner by interfacing with other membrane compartments and the SV sorting machinery at peri-AZs.
Author response image 1
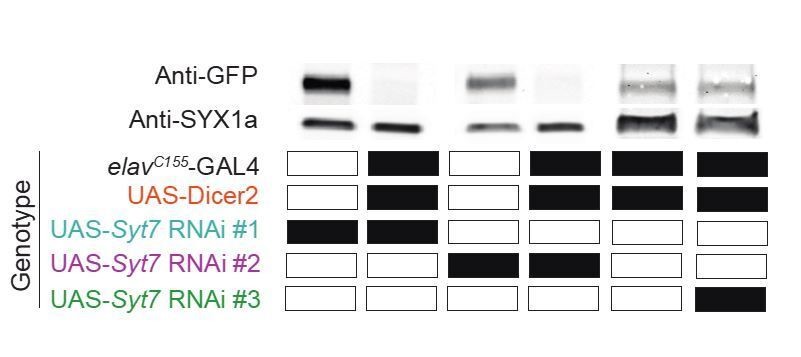
Three RNAis were tested for pan-neuronal knockdown of SYT7GFP.
Western blot was probed with anti-GFP. Lane #1: UAS-Syt7 RNAi#1 (Vienna #24989); SYT7GFP, lane #2: elavC155-GAL4, UAS-Dicer2; UAS-Syt7 RNAi#1; SYT7GFP, lane #3: UAS-Syt7 RNAi#2 (BDSC #27279); SYT7GFP, lane #4: elavC155-GAL4, UAS-Dicer2; UAS-Syt7 RNAi#2, lane #5: elavC155-GAL4, UAS-Dicer2; SYT7GFP and lane #6: elavC155-GAL4, UAS-Dicer2; UAS-Syt7 RNAi#3 (Saraswati et al., 2007); SYT7GFP.
Additional files
Download links
A two-part list of links to download the article, or parts of the article, in various formats.
Downloads (link to download the article as PDF)
Open citations (links to open the citations from this article in various online reference manager services)
Cite this article (links to download the citations from this article in formats compatible with various reference manager tools)
Drosophila Synaptotagmin 7 negatively regulates synaptic vesicle release and replenishment in a dosage-dependent manner
eLife 9:e55443.
https://doi.org/10.7554/eLife.55443


