Phylogenetic variation in cortical layer II immature neuron reservoir of mammals
- Neuroscience Institute Cavalieri Ottolenghi (NICO), Italy
- Department of Veterinary Sciences, University of Turin, Italy
- Università degli Studi di Teramo, Facoltà di Medicina Veterinaria, Italy
- School of Biological and Chemical Sciences, Queen Mary University of London, United Kingdom
- Neurobiology Unit, BIOTECMED, Universitat de València, and Spanish Network for Mental Health Research CIBERSAM, Spain
- Department of Comparative Biomedicine and Food Science, University of Padova, Italy
- Department of Anthropology and Center for the Advanced Study of Human Paleobiology, The George Washington University, United States
- D-HEST, ETH, Switzerland
- Institute of Anatomy, University of Zurich, Switzerland
Figures
Figure 1 with 1 supplement
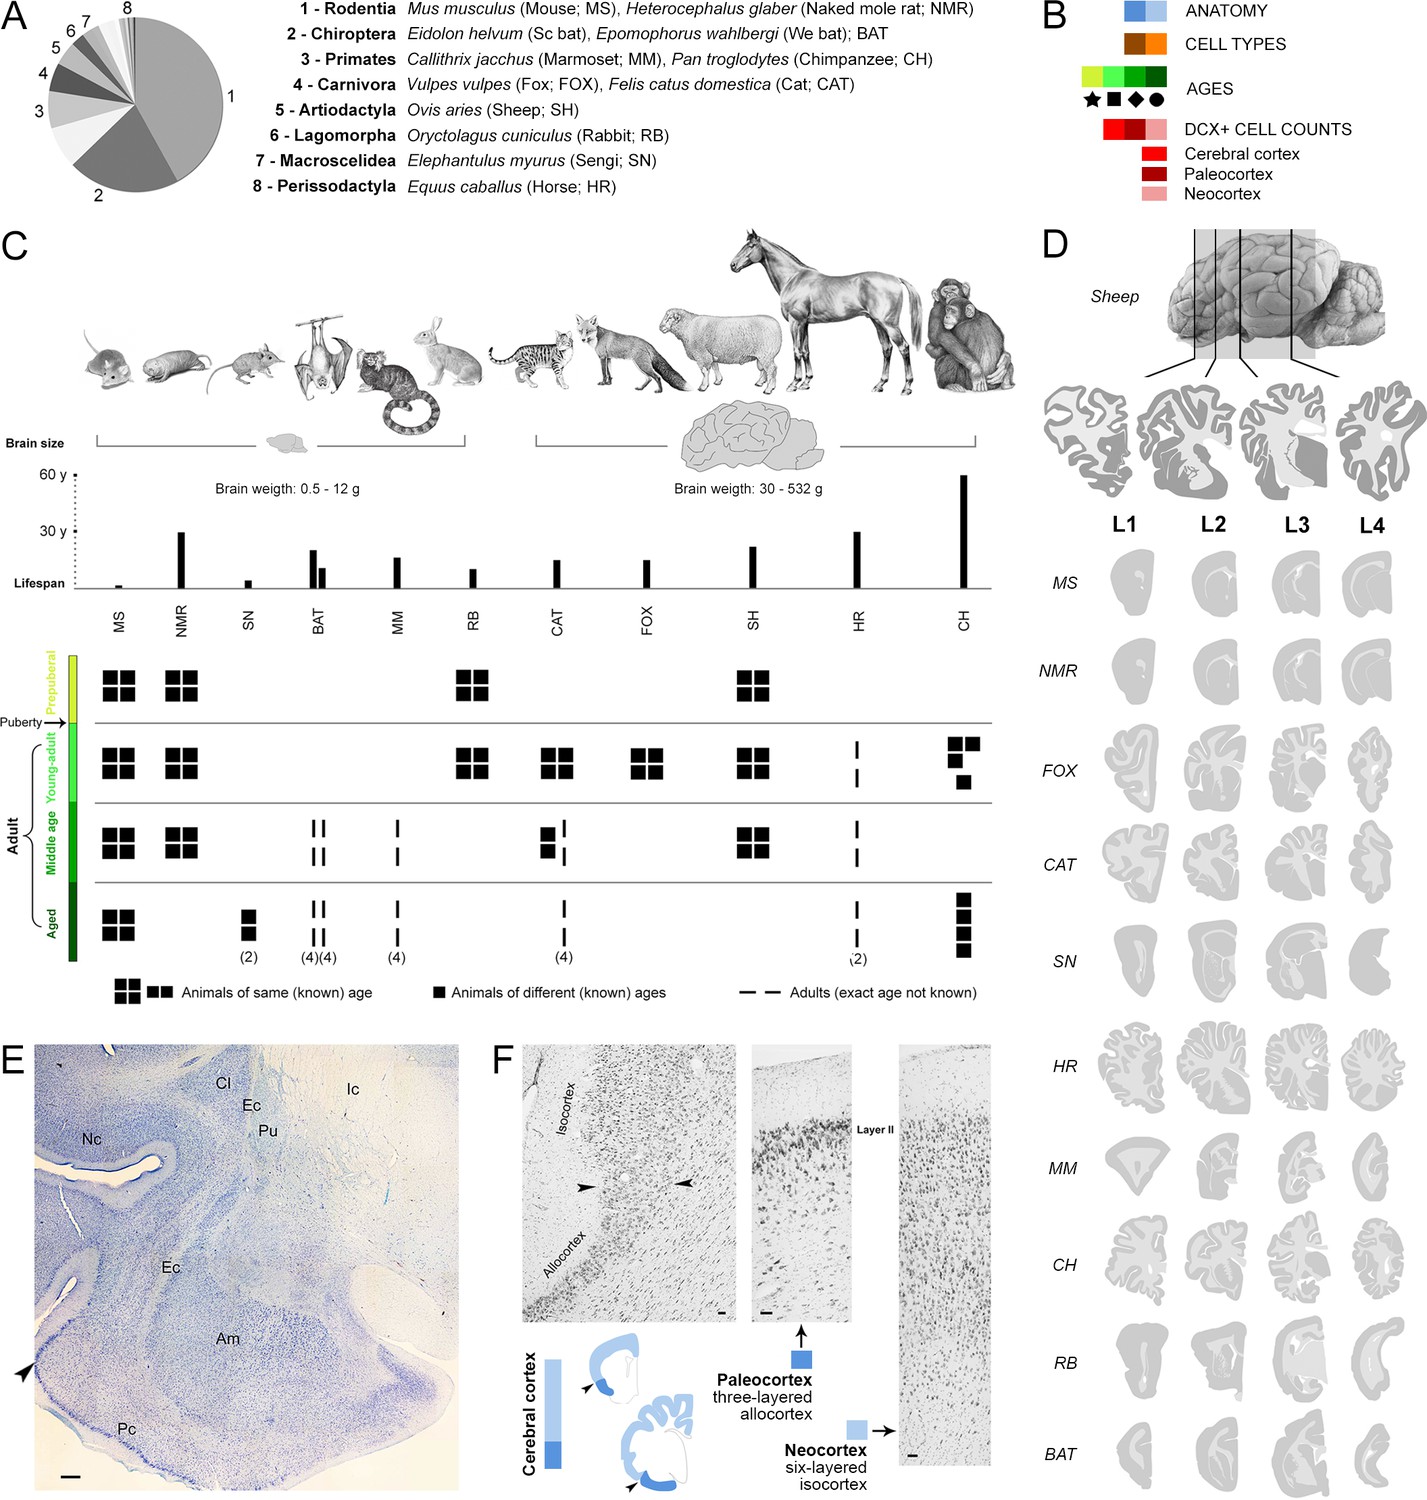
Sample of species, ages, and comparable brain regions (coronal levels) of the mammals used in this study (Supplementary file 1).
(A, C) Mammalian species and orders (scientific name, common name – used hereafter – and abbreviation) with special reference to their brain size and lifespan (C, top). (B) Color code (see also Figure 4). (C, bottom), Different ages considered for each species; all groups are composed of four individuals (apart from different specification; Supplementary file 1). (D) Four anterior-posterior brain levels, identified by comparable neuroanatomy based on histology (example of a cat brain section in E), and correspondent mini-atlases for each animal species; representative sections within the thickness of each level are shown. (F) Paleocortex-neocortex transition (arrowheads), identified histologically as a shift from three to six cortical layers. Scale bars: E, 500 µm; F, 50 µm.
Figure 1—figure supplement 1
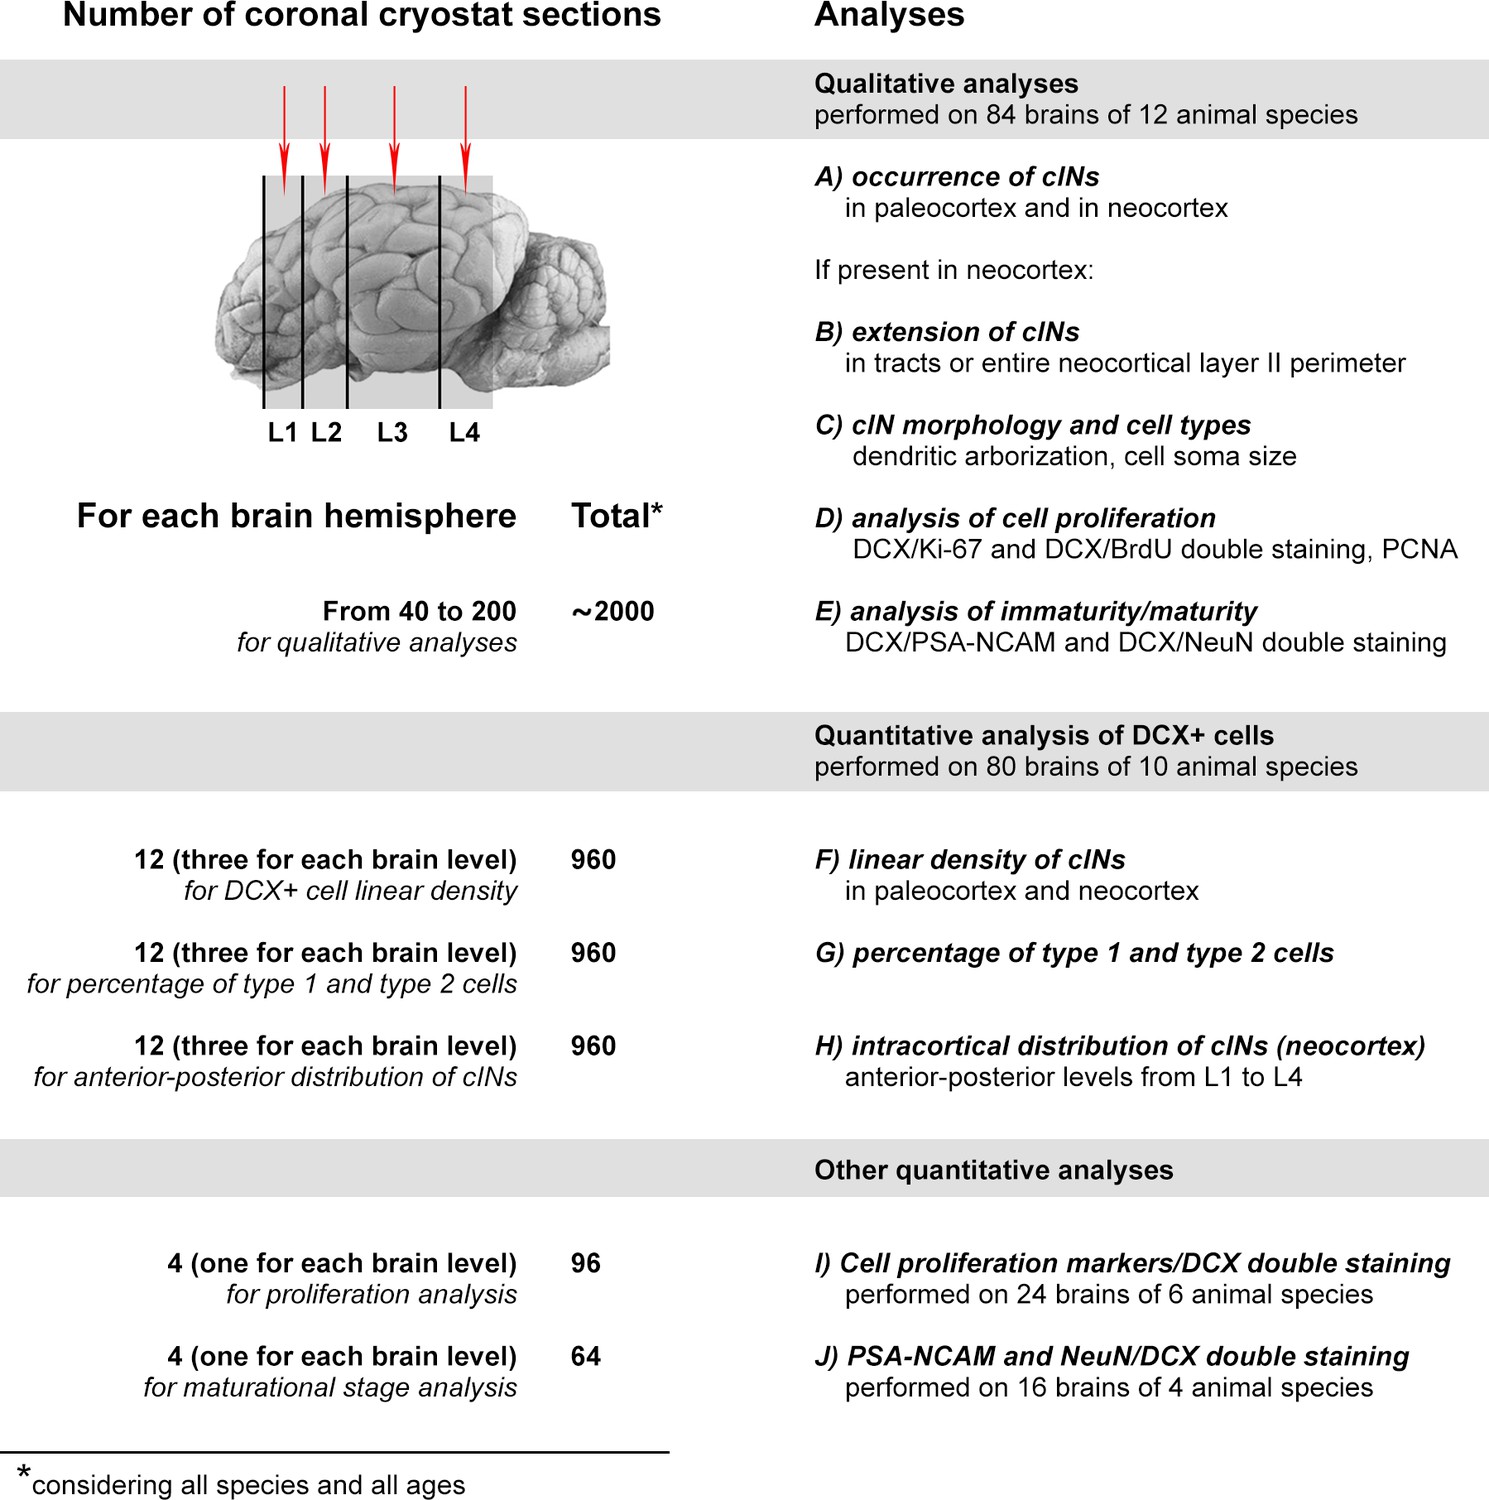
Summary of the qualitative and quantitative analyses performed in this study.
Figure 2 with 1 supplement
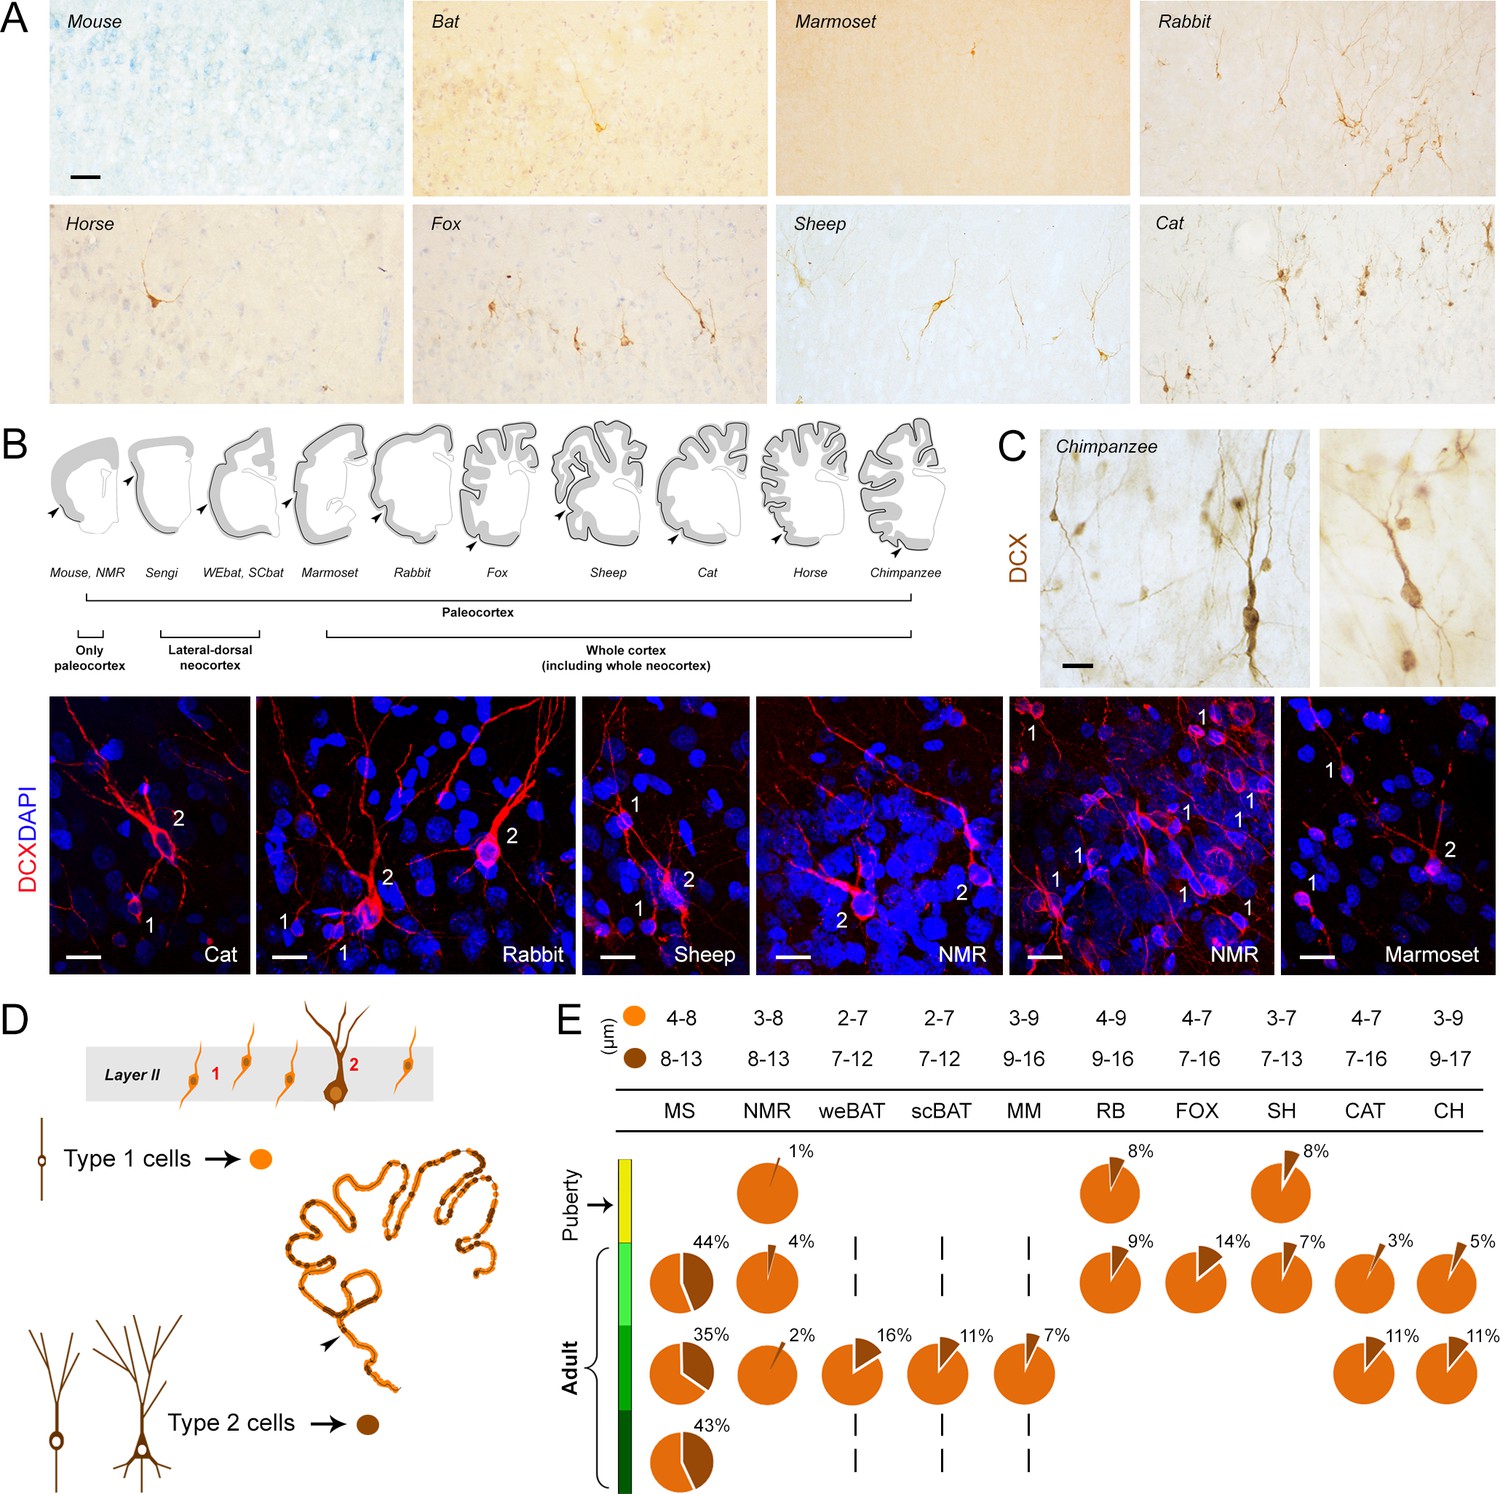
Occurrence, regional distribution and cell types of layer II DCX+ cells in the mammalian cerebral cortex.
(A) Representative images of the DCX+ neurons in neocortex. Scale bar: 50 µm. (B) Extension of cINs (DCX+ cells) in the cortical layer II (black line); arrowheads: paleocortex-neocortex transition. (C,D) Cell types and morphology of cINs; (C) representative examples of type 1/type 2 cortical DCX+ neurons in different mammalian species; scale bars: 20 µm; (D) Counting of type 1 and type 2 cells (pie charts showing the percentages in E, bottom). (E, top) Cell soma diameters (expressed as min/max range) of the DCX+ cortical cells in each species.
Figure 2—figure supplement 1
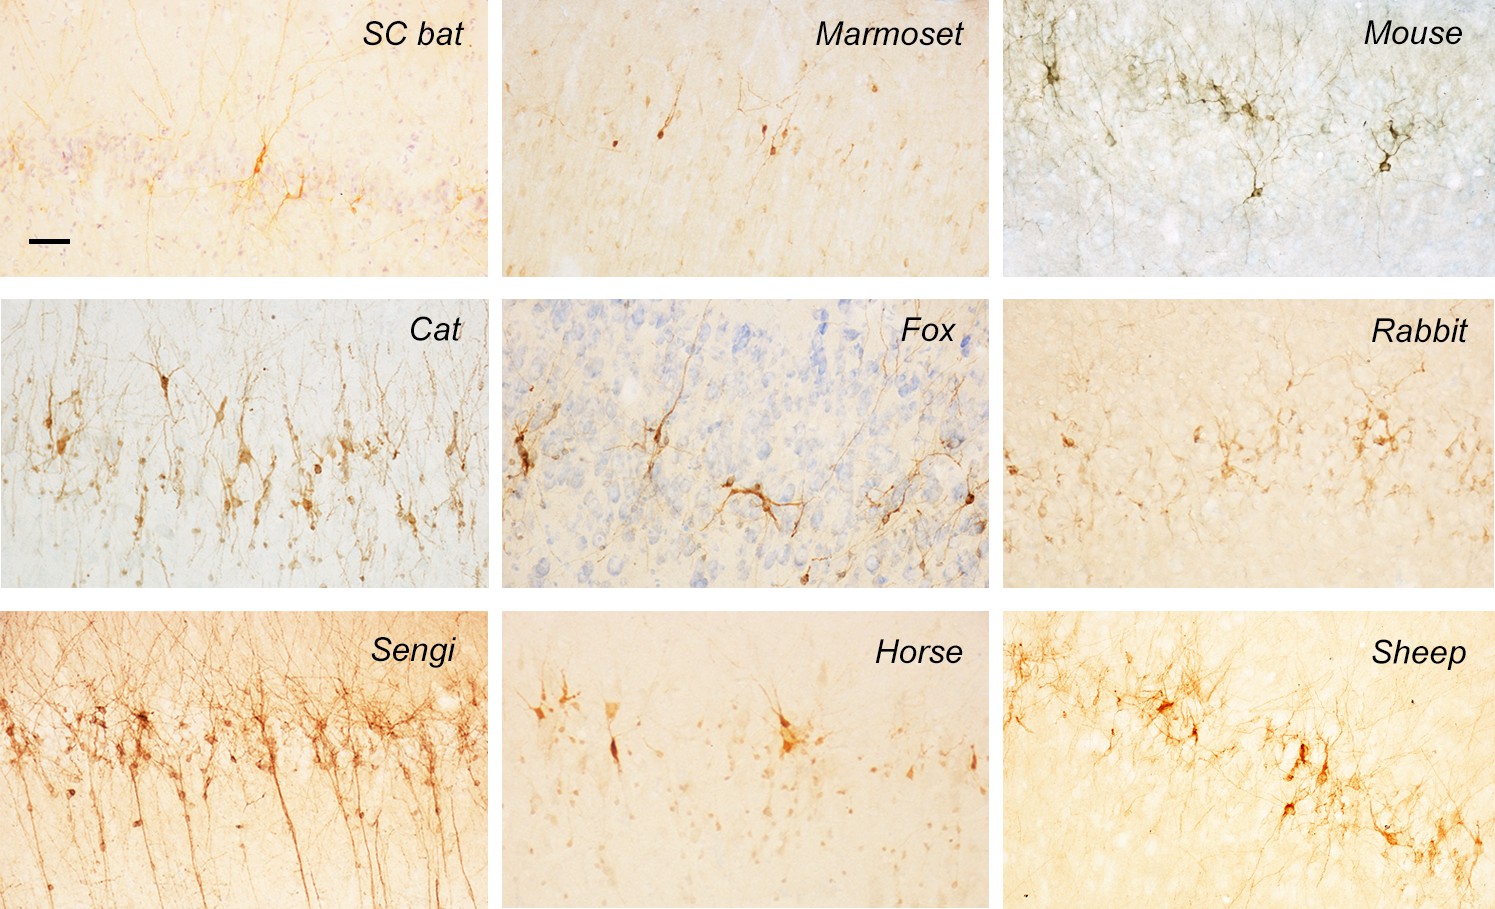
Representative images of DCX+ neurons in the paleocortex of different mammal species.
Scale bar: 50 μm.
Figure 3 with 1 supplement
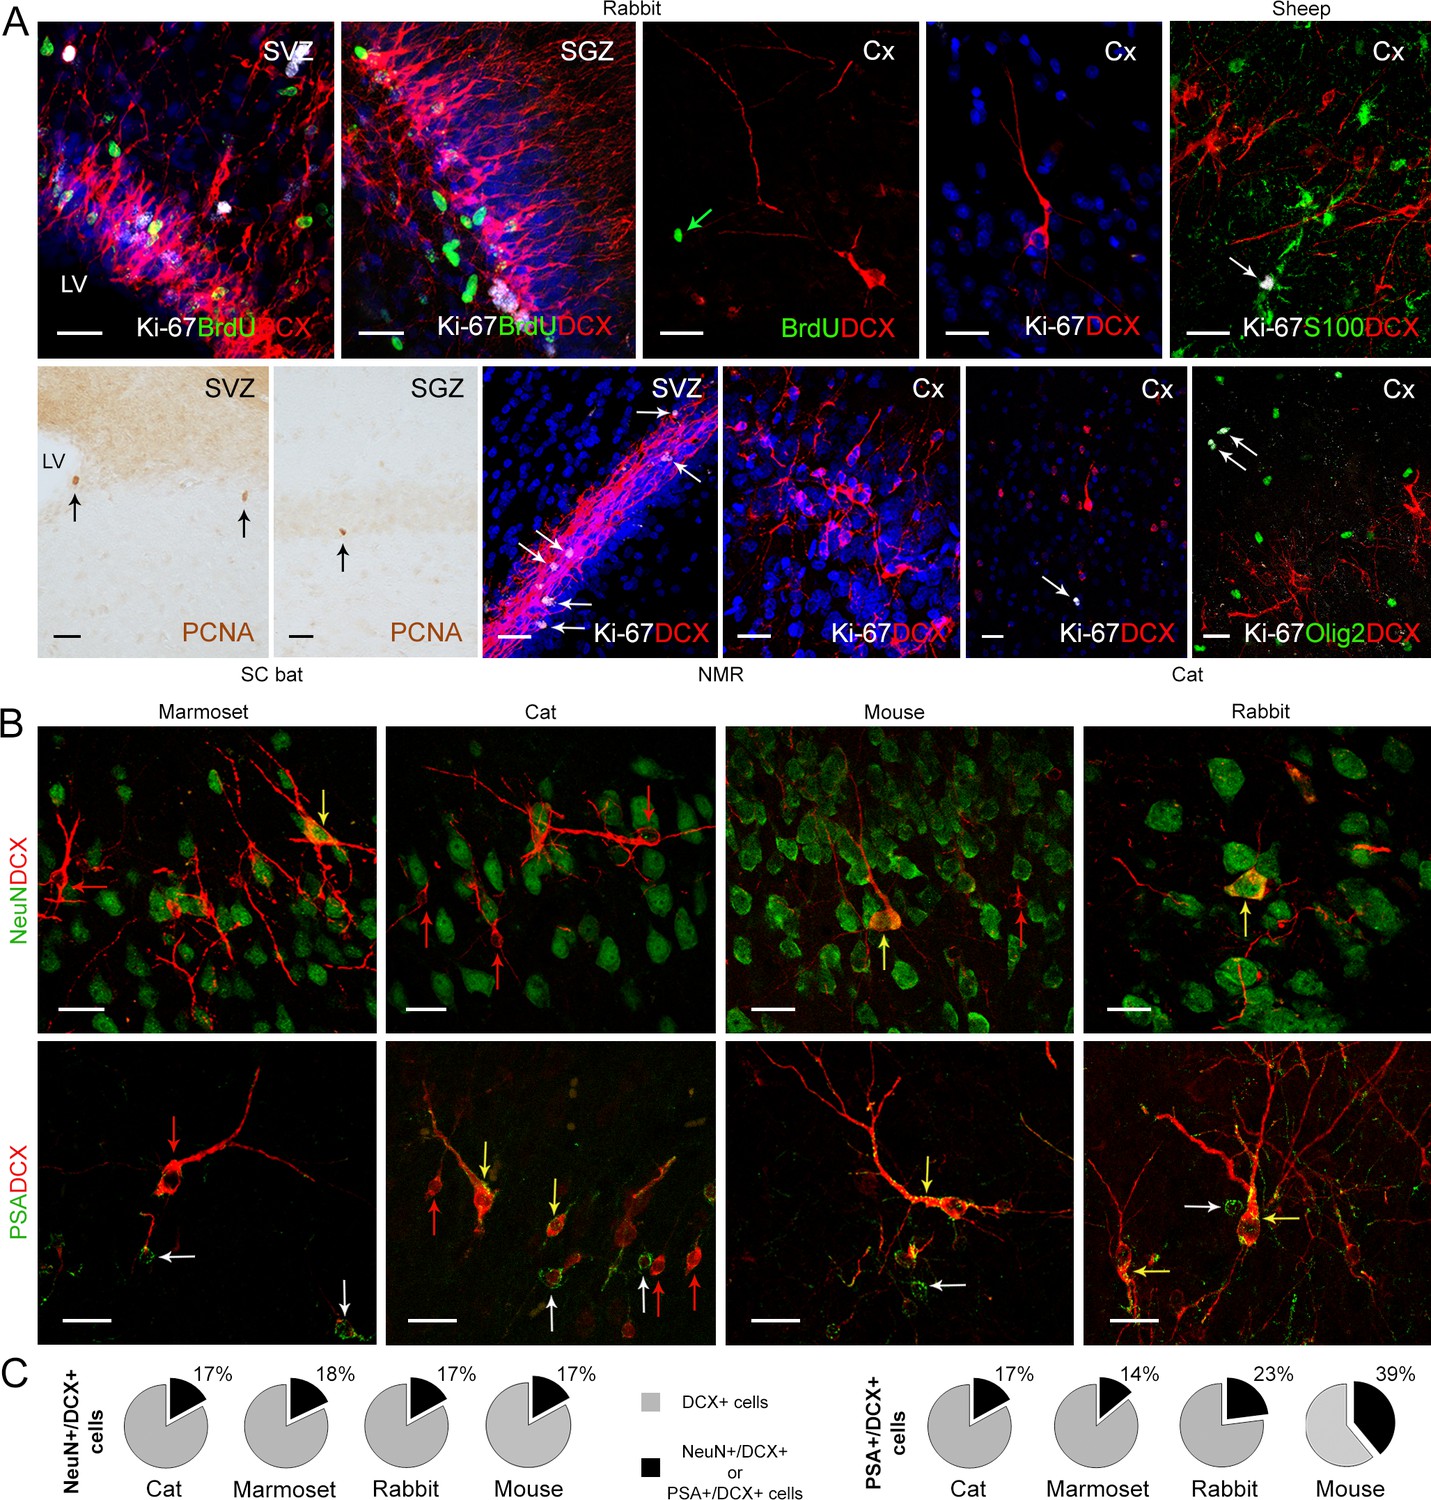
Detection of markers for cell division and neuronal maturity/immaturity in cortical layer II of adult mammals.
(A) Cell proliferation visualized in neurogenic subventricular zone (SVZ) and subgranular zone (SGZ), here used as an internal control, with nuclear markers of local cell proliferation. None of these markers were detectable in association with DCX+ immature neurons in the cortical layer II; some isolated Ki-67+ nuclei occasionally present in cortex do not co-label with DCX, likely corresponding to glial cells (see double staining with S-100β, top right, and Olig2, bottom right). (B) Subpopulations of DCX+ immature neurons in the cortical layer II co-express NeuN (mostly type 2 cells) and PSA-NCAM (both cell types); red arrows, single-stained DCX+ cells; white arrows, single-stained PSA-NCAM+ cells; yellow arrows, double-stained cells. (C) Percentage of NeuN+ and PSA-NCAM+ cells among the DCX+ cells. Scale bars: 25 µm.
Figure 3—figure supplement 1

Quantification of proliferating cells in upper neocortical layers (I, II, III) in mouse, NMR, marmoset, rabbit, sheep and cat considering Ki-67+ cells/mm2 (PCNA+ cells/mm2 and BrdU+ cells/mm2 were considered in SC bat and rabbit, respectively).
Note the very low rate of cell proliferation.
Figure 4 with 3 supplements
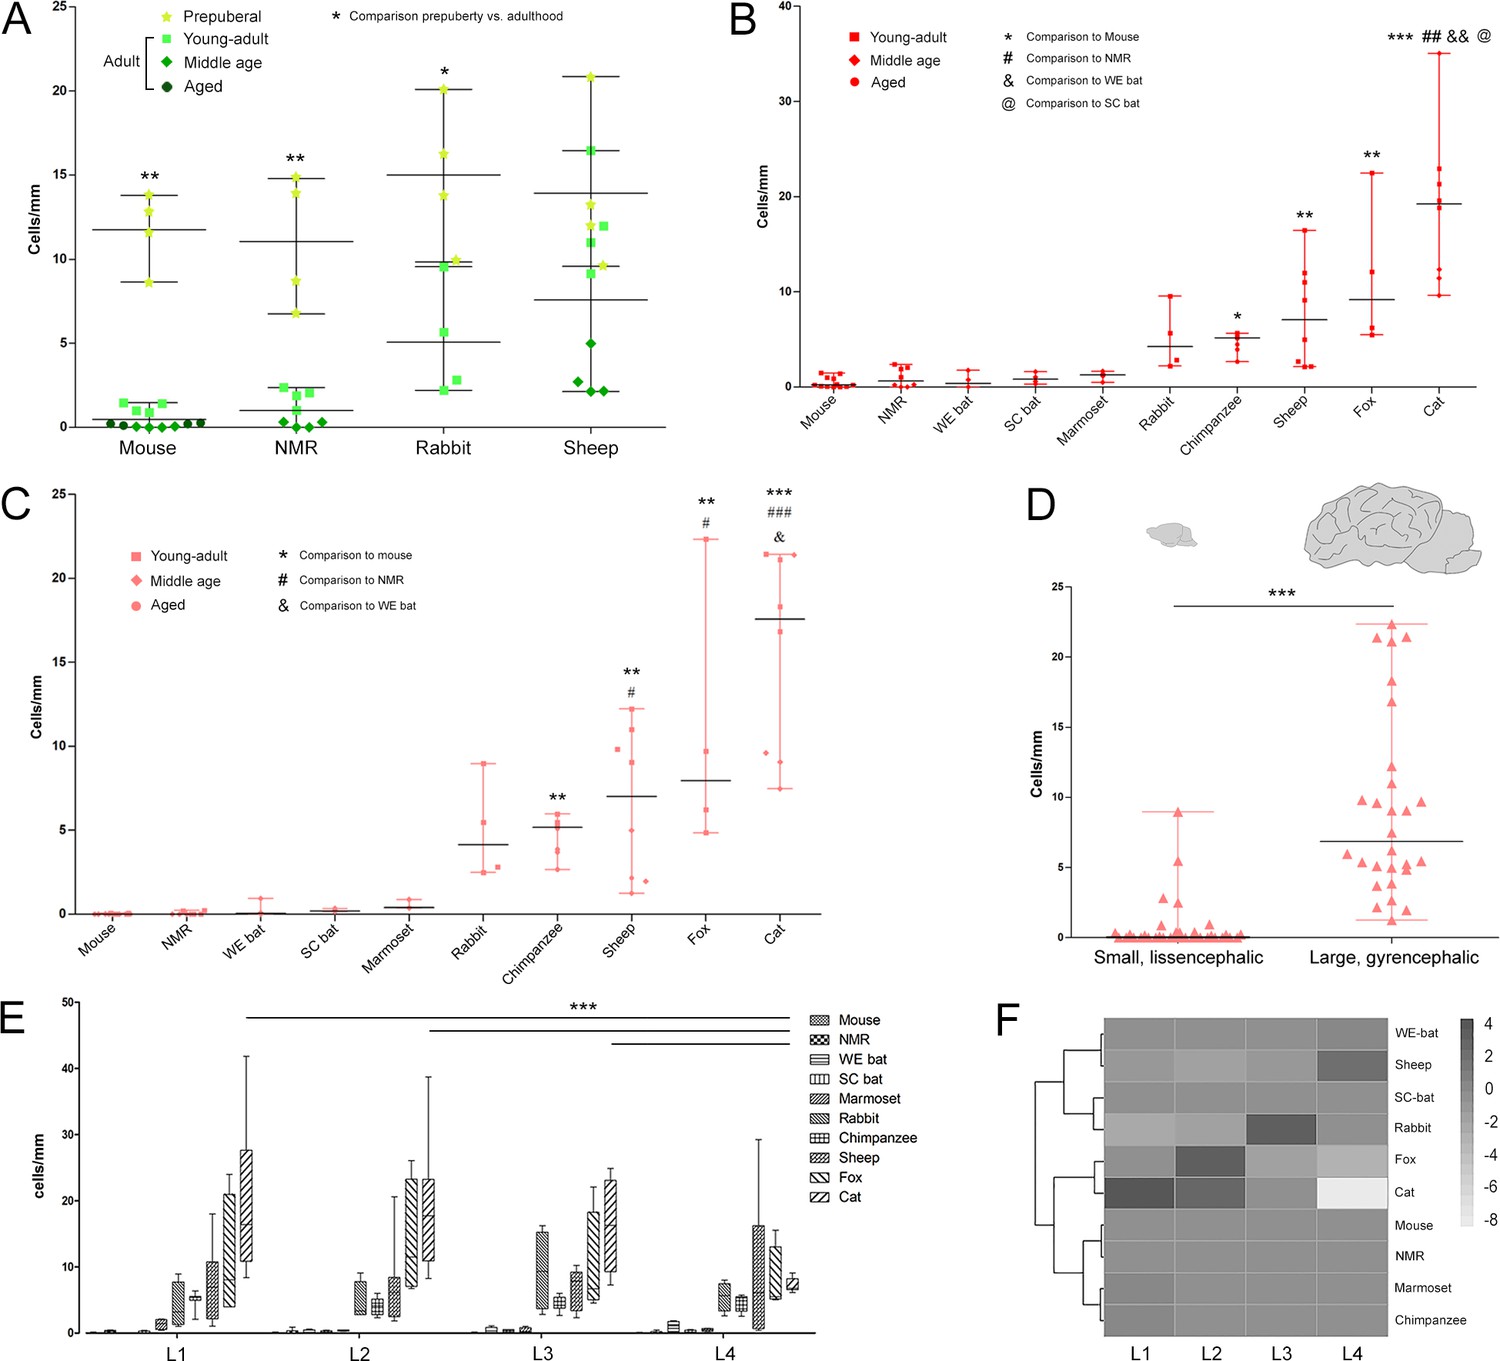
Quantification of DCX+ cINs density in the mammalian cortex.
(A) Linear density and statistical analysis of DCX+ cells in the cerebral cortex of four mammalian species at different ages (see color code in Figure 1B); a sharp drop between prepuberal and adult ages is detectable in rodents but not in sheep. (B–D) DCX+ cell linear densities and statistical analysis referred to the total extension of the cerebral cortex (B) and to the neocortex (C) of 10 mammalian species (adult specimens considered – see color code in Figure 1B); a high heterogeneity is detectable from mice to cat, even more evident when grouping small, lissencephalic and large, gyrencephalic mammals (D). (E) No main differences are detectable in the distribution/amount of cINs among different anterior-posterior brain levels (except for cat); (F) heatmap of the distribution of linear density in different brain levels (L1-L4; neocortex).
Figure 4—figure supplement 1

Quantification of DCX+ cells (linear densities in the cortical layer II).
(A) Representative sections from each level (L1–L4) of mouse and chimpanzee brain obtained with Neurolucida software. The contour of cortical layer II is shown in white and the location of DCX+ cells have been marked (type 1 as red dots, type 2 as green dots). Top, red: 12 cryostat coronal sections used for the quantification of linear densities in 80 mammalian brains. (B) Representative coronal sections at level 3, demonstrating the density and localization of layer II cortical DCX+ cells (dark red, cells in the paleocortex; pink dots, cells in the neocortex).
Figure 4—figure supplement 2
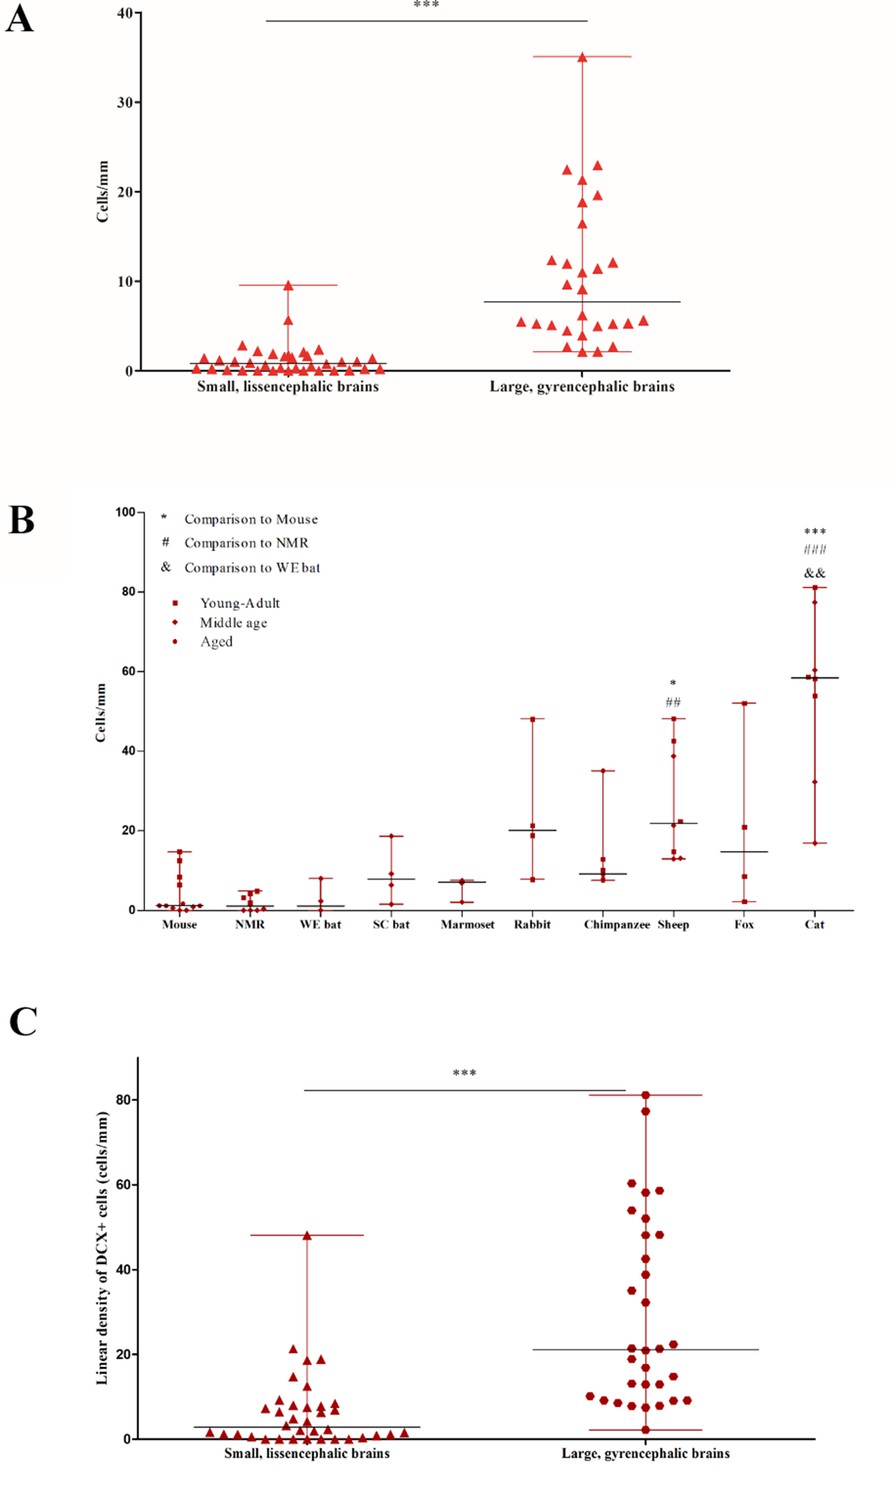
Quantification of DCX+ cINs density in the mammalian cortex.
(A) Total linear density of DCX+ cells in small, lissencephalic brains compared to large, gyrencephalic brains. Each data point represents the average DCX+ cell density from an individual brain in the sample. A high degree of heterogeneity is observed. (B) Linear density of DCX+ cells in paleocortex. There is a high heterogeneity in adults among all species. (C) Paleocortical linear density of DCX+ cells in small, lissencephalic brains compared to large, gyrencephalic brains.
Figure 4—figure supplement 3
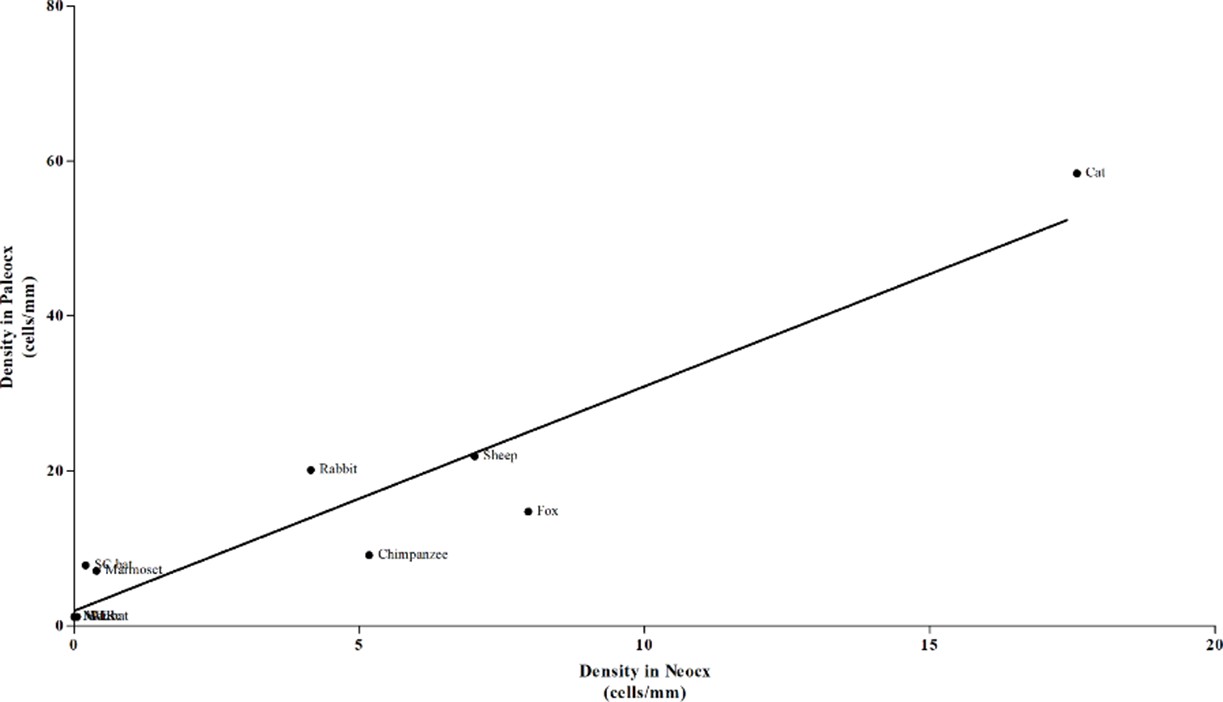
Correlation study between DCX+ cell density in paleo- and neo-cortex.
There is a highly significant correlation (***). By varying the neocortex also paleocortex varies (adult ages are grouped).
Figure 5 with 1 supplement
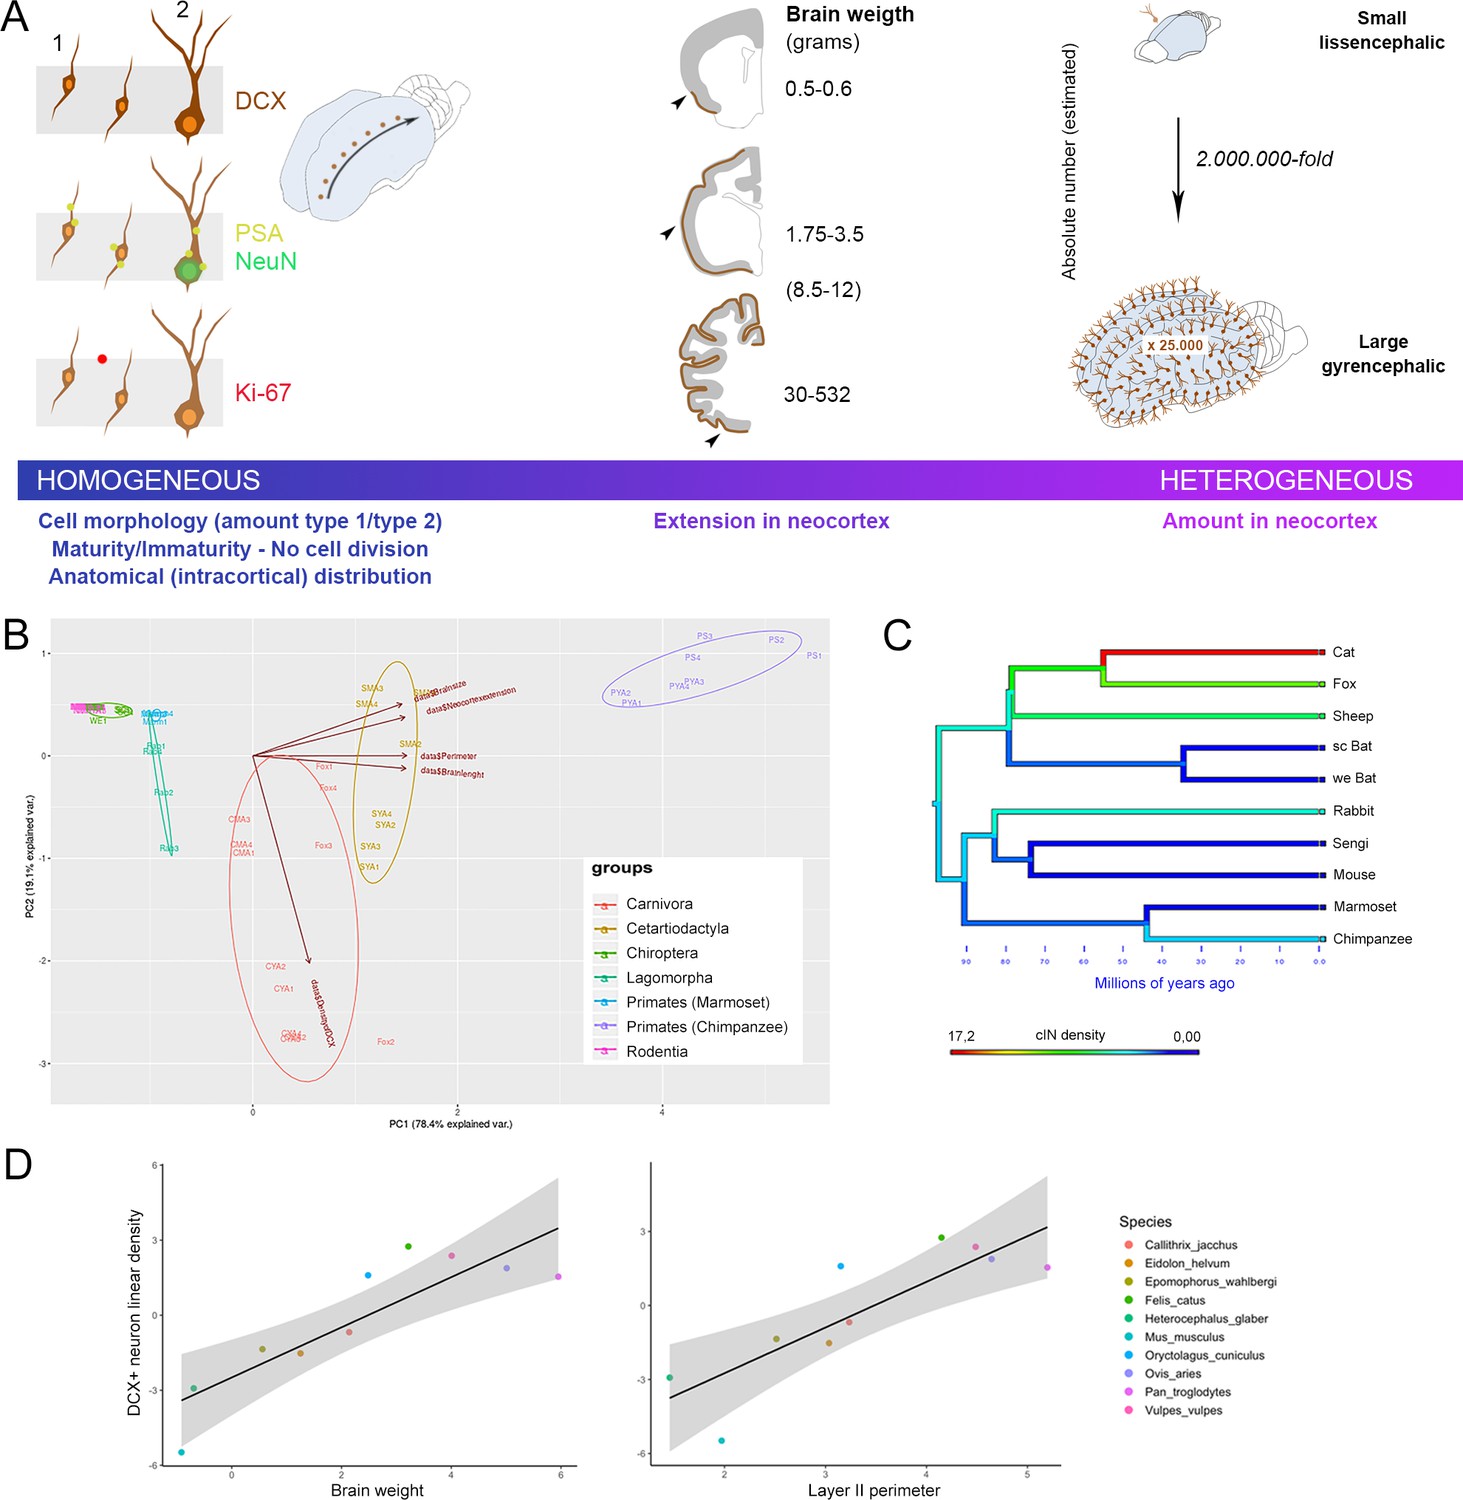
General features of cortical immature neurons are highly preserved in mammals whereas their amount is greater in large-brained species.
(A) Some aspects, including morphology, cell types, degree of immaturity and non-proliferative activity (left), appear quite constant across the mammalian species, whereas their extension in the neocortex (middle) and their overall amount (right) vary remarkably, increasing from small, lissencephalic to large, gyrencephalic brains. On the right, the estimation of total number of cINs in mouse and chimpanzee calculated by multiplying the median number of DCX+ cells in the neocortical layer II for the number of cryostat sections cut from the entire hemispheres; Supplementary file 4). (B) Principal Component Analysis (PCA; the different species are arranged according their orders; see text). The animal species are identified by different colours and abbreviations: CYA for Cat Young-Adult, CMA for Cat Middle Age, SYA for Sheep Young-Adult, SMA for Sheep Middle Age, PYA for Primates Young-Adult Chimpanzee, PS for Primate (Senior) aged Chimpanzee. (C) Map of character evolution on the phylogenetic tree illustrating the independent emergence of neocortical DCX+ neuron densities in the mammalian species considered. (D) PGLS regression showing that linear density of neocortical DCX+ neurons covaries significantly with brain weight and layer II perimeter.
Figure 5—figure supplement 1

PGLS regression analysis between layer II DCX+ neuron density and gyrification index.
The relationship between these two variables approached significance, but no phylogenetic signal was found (adjusted r2 = 0.328, p=0.10, Pagel’s lambda = 0.00), indicating that the two traits evolve independently from phylogenetic covariance.
Additional files
-
Supplementary file 1
Animals used in this study.
- https://cdn.elifesciences.org/articles/55456/elife-55456-supp1-v1.docx
-
Supplementary file 2
Main information on the animal species considered in this study.
Species with lissencephalic, small-brains are shown in regular font and species with gyrencephalic, large-brains are shown in italics.
- https://cdn.elifesciences.org/articles/55456/elife-55456-supp2-v1.docx
-
Supplementary file 3
Estimation of the neocortex surface area (calculated by using the median length of the layer II perimeter multiplied for 40 µm - thickness of sections - for the number of sections of the entire hemisphere).
- https://cdn.elifesciences.org/articles/55456/elife-55456-supp3-v1.docx
-
Supplementary file 4
Estimation of the total number of DCX+ cells in layer II of the neocortex (calculated by multiplying the median number of DCX+ cells per section for the number of sections).
Immature neurons prefer large brains
- https://cdn.elifesciences.org/articles/55456/elife-55456-supp4-v1.docx
-
Transparent reporting form
- https://cdn.elifesciences.org/articles/55456/elife-55456-transrepform-v1.pdf
Download links
A two-part list of links to download the article, or parts of the article, in various formats.
Downloads (link to download the article as PDF)
Open citations (links to open the citations from this article in various online reference manager services)
Cite this article (links to download the citations from this article in formats compatible with various reference manager tools)
Phylogenetic variation in cortical layer II immature neuron reservoir of mammals
eLife 9:e55456.
https://doi.org/10.7554/eLife.55456


