HIV efficiently infects T cells from the endometrium and remodels them to promote systemic viral spread
- Gladstone Institute of Virology and Immunology, United States
- Department of Urology, University of California, San Francisco, United States
- Department of Data Sciences and Operations, University of Southern California, United States
- Departments of Pediatrics and Microbiology and Immunology, Stanford School of Medicine, United States
- Lt Col, United States AF; Women’s Health Clinic, Naval Medical Center, United States
- Center for Reproductive Sciences, Department of Obstetrics, Gynecology and Reproductive Sciences, University of California, San Francisco, United States
- Department of Medicine, University of California, San Francisco, United States
Figures
Figure 1 with 1 supplement
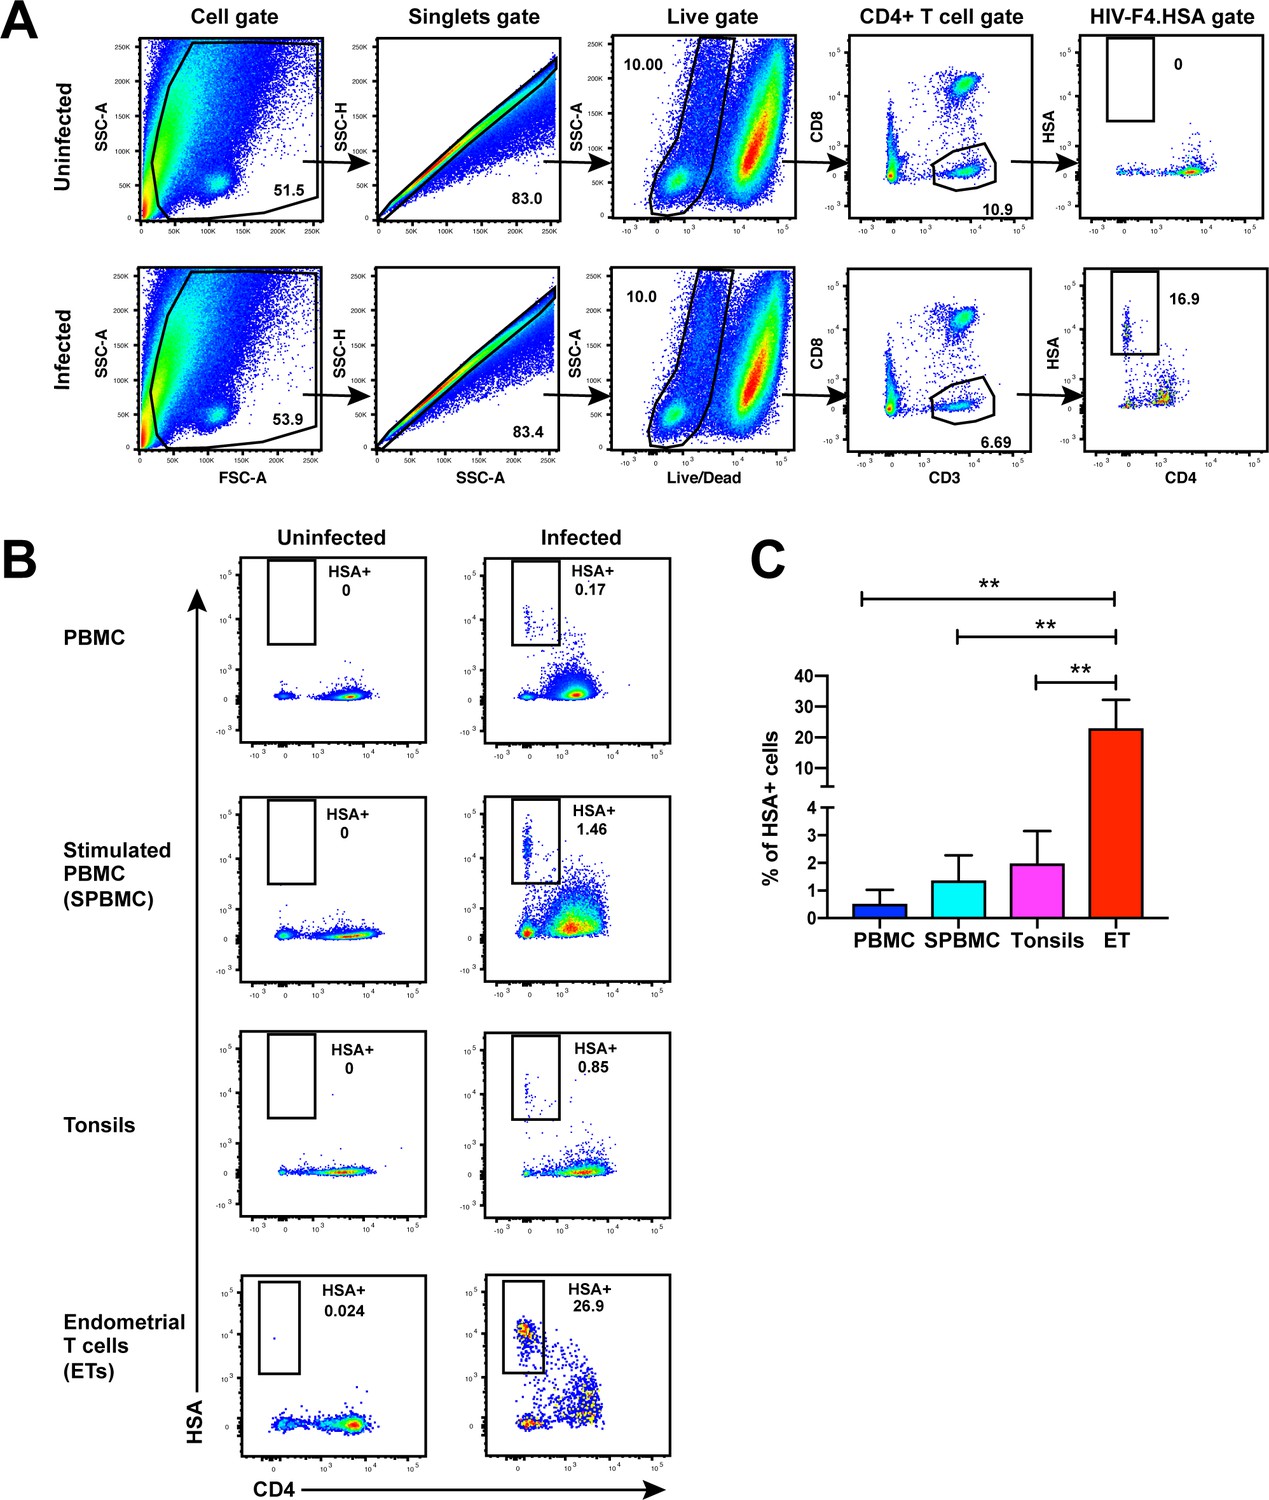
Unstimulated endometrial T cells are highly susceptible to infection by CCR5-tropic HIV.
(A) FACS plots demonstrating a distinct population of productively-infected endometrial T cells (ETs) following exposure to the HIV reporter strain F4.HSA. Unstimulated ETs were mock-treated or exposed to F4.HSA for 3 days and then analyzed by FACS. Shown is the gating strategy leading to identification of HIV-infected ETs, representative of 4 independent donors. (B) Representative FACS plots of uninfected and infected cultures of PBMCs (unstimulated or PHA-stimulated), unstimulated tonsillar human lymphoid aggregate (HLAC) cultures, or unstimulated ETs. Cells were mock-treated or inoculated with F4.HSA, and monitored 3 days later by FACS for levels of productive infection. Left: Uninfected controls. Right: Infected cultures. Results are gated on live, singlet CD3+CD8- cells and are representative of 4 independent donors. (C) ETs are significantly more susceptible than PBMCs and tonsils to infection by F4.HSA. Results of FACS analysis from 4 independent donors gated on live, singlet CD3+CD8- cells. **p<0.01 as assessed using the Student’s unpaired t test.
Figure 1—figure supplement 1
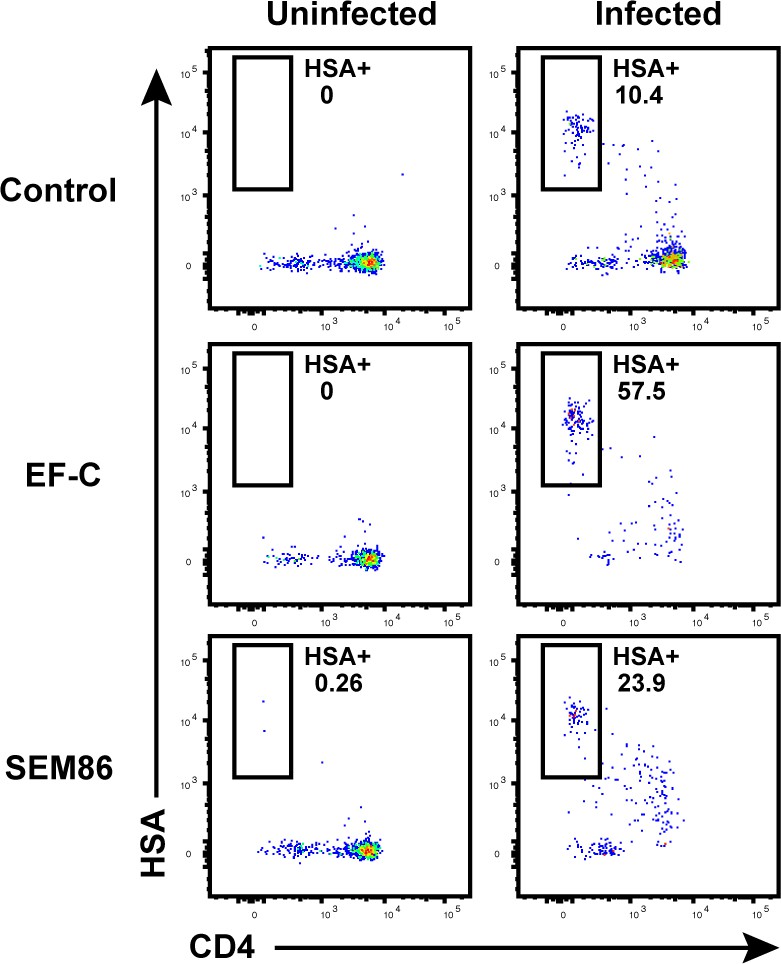
Transduction-enhancing fibrils promote HIV infection of endometrial T cells.
Unstimulated endometrial cells were mock-treated or infected with F4. HSA, either in the absence of any viral enhancing factor, or in the presence of 50 μg/ml EF-C or 100 μg/ml SEM86. Cells were monitored by FACS 3 days later for infection rates. Of note, 100 μg/ml is a physiologically relevant concentration of SEM86, similar to that found in semen (Roan et al., 2014). Left: Uninfected control. Right: F4.HSA-exposed cultures. Results are gated on live, singlet CD3+CD8- cells. Shown are data representative of 3 independent donors.
Figure 2 with 8 supplements
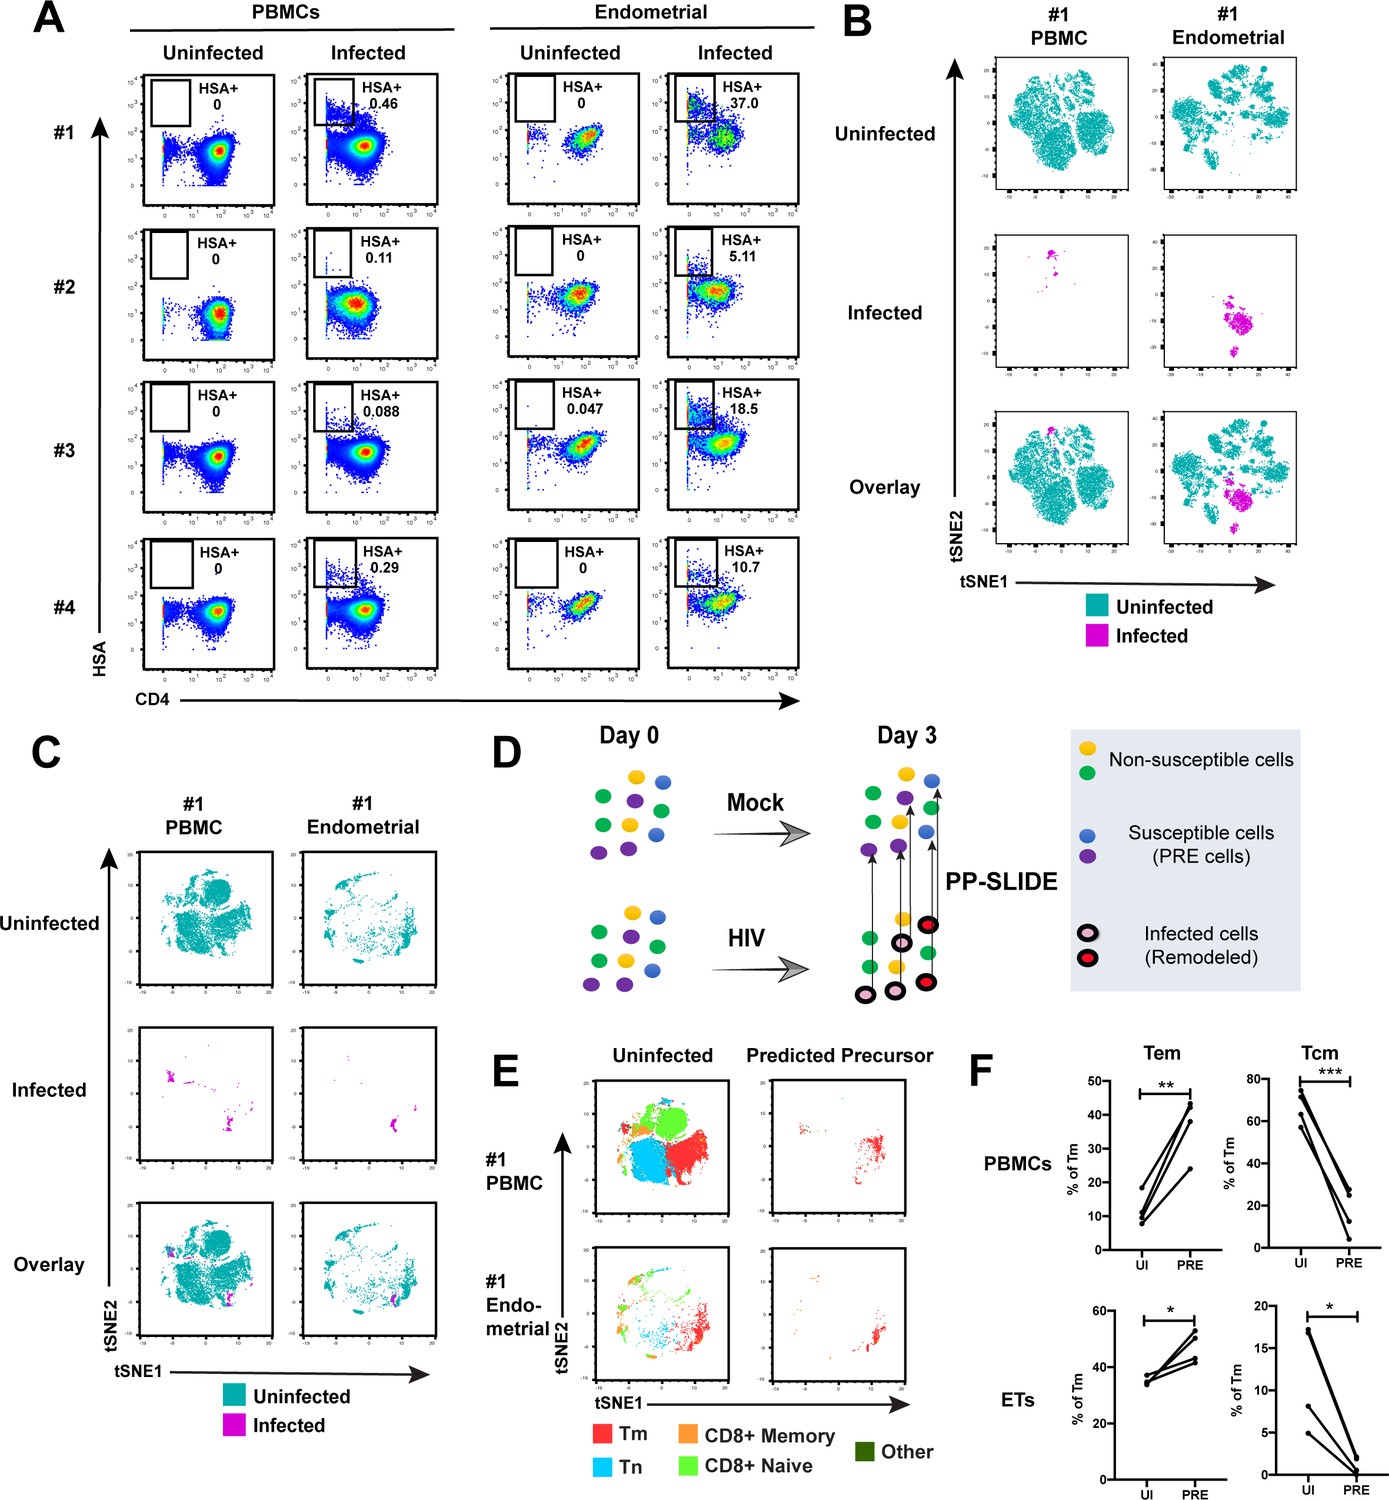
Comparison of HIV-susceptible cells in unstimulated PBMCs and endometrium.
(A) Paired unstimulated PBMCs and endometrial cells from 4 donors were mock-treated or inoculated with F4.HSA and monitored 3 days later for levels of productive infection. Results are gated on live, singlet CD3+CD8- cells. Numbers correspond to the percentage of infected cells in each sample. (B) t-SNE plots of uninfected and infected cells from Donor #1 shown in panel A, where the PBMC and endometrial specimens were run as separate t-SNEs. Infected cells reside in unique regions of the t-SNE as a result of viral-induced remodeling. Data are representative of 4 independent donors. (C) t-SNE plots of uninfected and infected cells from Donor #1 shown in panel A, where the PBMC and endometrial specimens were run within the same t-SNE. Although the same number of HIV-infected ETs are shown here as in panel B, these cells occupy less t-SNE space since much of the space is now taken up by cells from the PBMC sample. Corresponding data for the remaining 3 donors in panel A are presented in Figure 2—figure supplement 2. (D) Schematic defining Predicted Precursor (‘PRE’) cells. A population of T cells is either mock-treated (top) or exposed to HIV (bottom). These cells include ones that are not susceptible to infection (yellow and green) and those that are (blue and purple). After 3 days, infected cells (surrounded by a black ring) are identified as those expressing the HIV reporter HSA. These cells, however, are remodeled as represented by the conversion from their original blue and purple colors to the red and pink colors, respectively. By using PP-SLIDE to identify for every infected cell the phenotypically most similar cell in the uninfected culture (upward arrows), we identify the PRE cells which harbor the predicted phenotypes of the original cells targeted for HIV infection. These cells do not have the confounder of HIV-induced phenotypic changes, and can be compared to non-susceptible cells in the uninfected culture to identify unique features associated with cells targeted for infection. (E) t-SNE plots of uninfected and PRE cells demonstrate that the dominant population of T cells targeted for infection in both blood and endometrium are memory CD4+ T (Tm) cells. Tm cells (CD4+CD45RO+CD45RA-), naïve CD4+ T cells (CD4+CD45RO-CD45RA+, abbreviated Tn cells), memory CD8+ T cells (CD8+CD45RO+CD45RA-), and naïve CD8+ T cells (CD8+CD45RO-CD45RA+) were identified by manual gating and colored as indicated. Corresponding data for the remaining 3 donors in panel A are presented in Figure 2—figure supplement 2. (F) Comparison of the proportions of Tem (CD4+CD45RO+CD45RA-CCR7-CD62L-) and Tcm (CD4+CD45RO+CD45RA-CCR7+CD62L+) among uninfected Tm and PRE cells in PBMCs and ETs reveals preferential infection of Tem in both compartments. *p<0.05, **p<0.01, ***p<0.001 as assessed using the Student’s paired t test.
Figure 2—figure supplement 1

CyTOF gating strategy to identify uninfected and HIV-infected T cells.
Figure 2—figure supplement 2
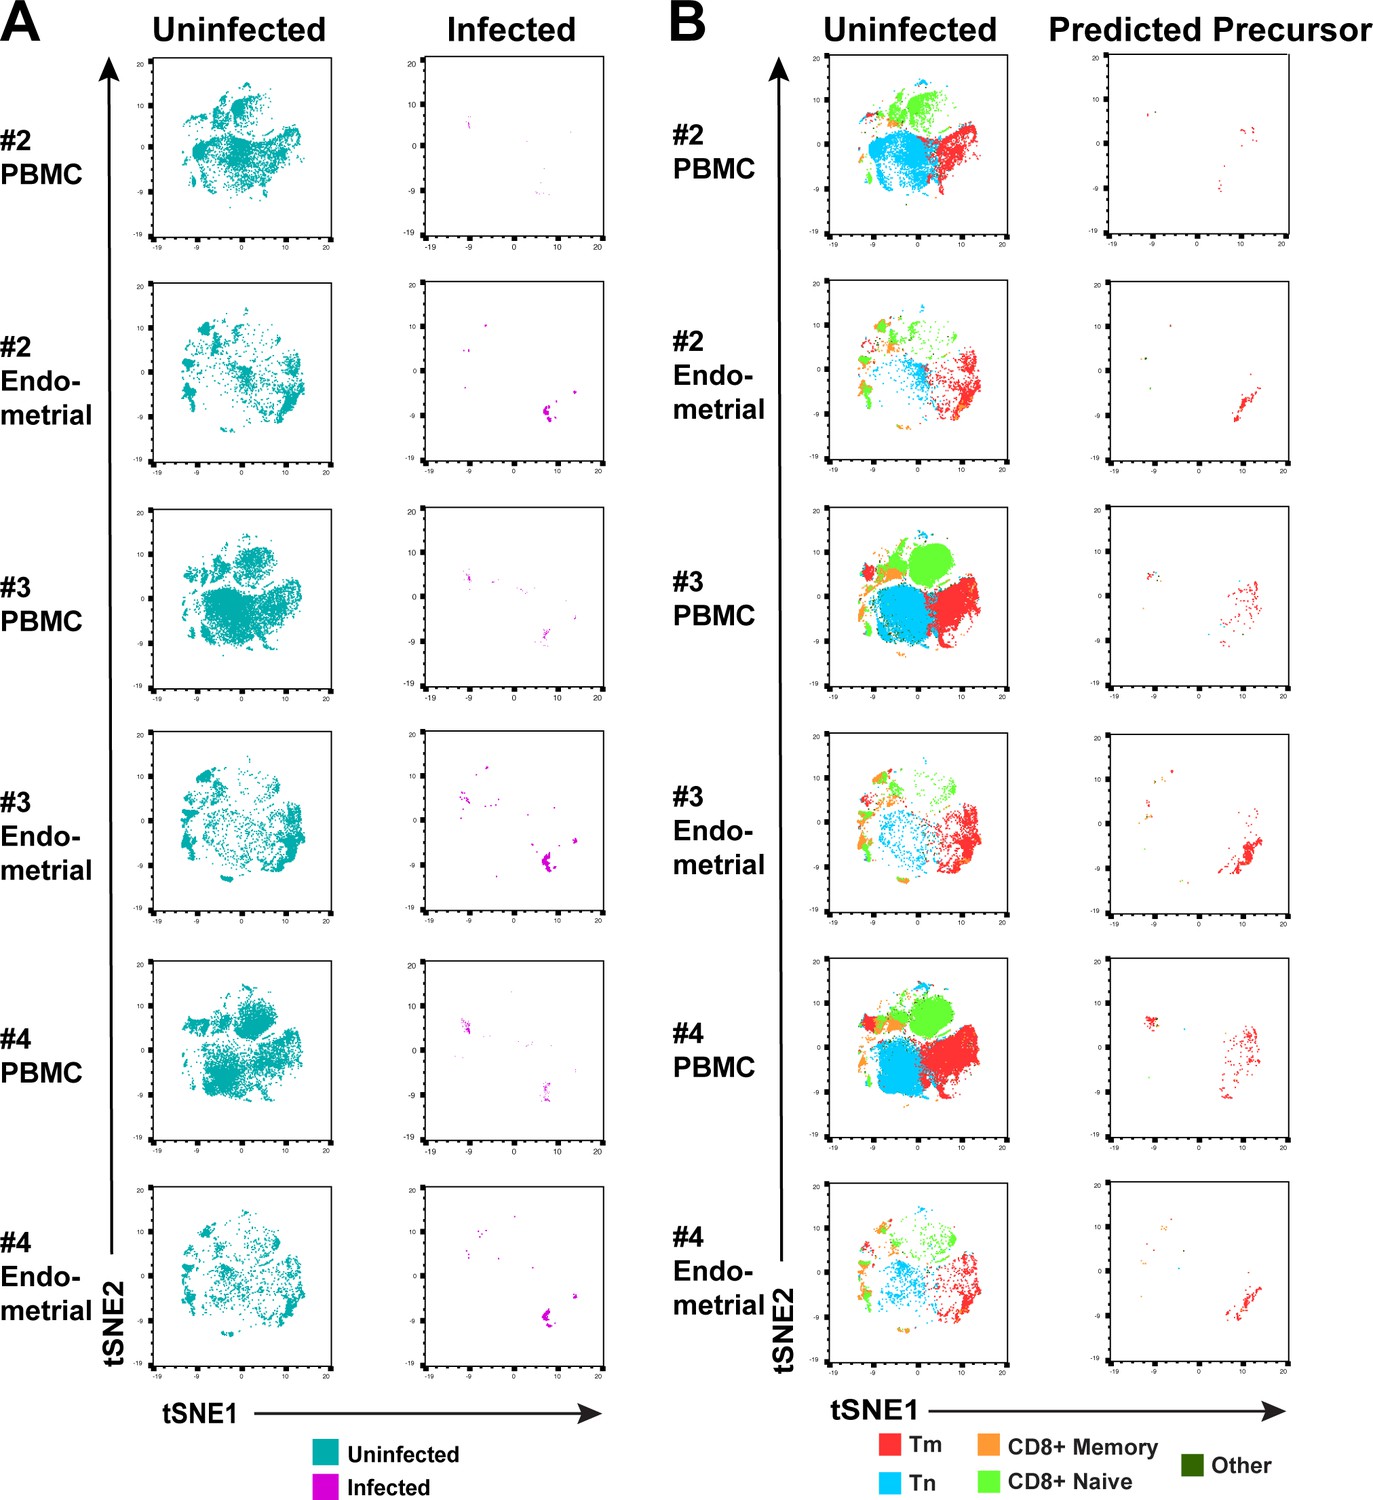
Comparison of HIV-susceptible cells in unstimulated PBMCs and endometrium.
(A) t-SNE plots of uninfected and infected cells from PBMCs or ETs, for Donors #2, 3, and 4 in Figure 2. The PBMC and endometrial specimens were run within the same t-SNE. (B) t-SNE plots of uninfected and PRE cells from Donors #2, 3, and 4 in Figure 2 color-coded by the indicated T cell subsets. The data demonstrate that the dominant population of HIV-susceptible cells from both unstimulated PBMCs and endometrium are Tm.
Figure 2—figure supplement 3

Quantitation of viral-induced remodeling of T cells from PBMCs and ETs.
SLIDE analysis (Cavrois et al., 2017; Sen et al., 2014) was conducted to quantitate the extent of HIV-induced remodeling in infected cells from endometrium and PBMCs, and reported as the SLIDE score. Scores > 1.2 indicate presence of strong viral-induced remodeling with a least 20% fold-change. Significant remodeling (p<0.0001) was observed in both PBMCs and ETs. However, the extent of remodeling was not significantly different in the two compartments (p=0.2251) as determined by two-sample t-tests on the remodeling ratios corresponding to each infected cell. See also Supplementary file 3 and Materials and Methods.
Figure 2—figure supplement 4

Comparison of uninfected and bystander cells from PBMCs and ETs.
(A) t-SNE plots of uninfected and bystander cells from PBMCs or ETs. The PBMC and endometrial specimens were run within the same t-SNE. (B) SLIDE analysis revealing significantly higher remodeling in the productively-infected (HSA+) than in the bystander (HSA-) Tm cells from both blood and endometrium. *p<0.05, **p<0.01 as assessed using the Student’s paired t test. (C) SLIDE analysis revealing that endometrial Tm cells treated with conditioned media from F4.HSA-infected cultures in the presence of ART are less remodeled than productively-infected cells. Each set of line corresponds to one of two donor specimens. (D) t-SNE plots of endometrial Tm cells from two donors treated, in the presence of ART, with conditioned media from uninfected or F4.HSA-infected cultures. The Tm cells exposed to conditioned media from infected cultures reside in similar regions of the t-SNE as those exposed to conditioned media from uninfected cultures, and in different regions than that occupied by productive-infected cells.
Figure 2—figure supplement 5
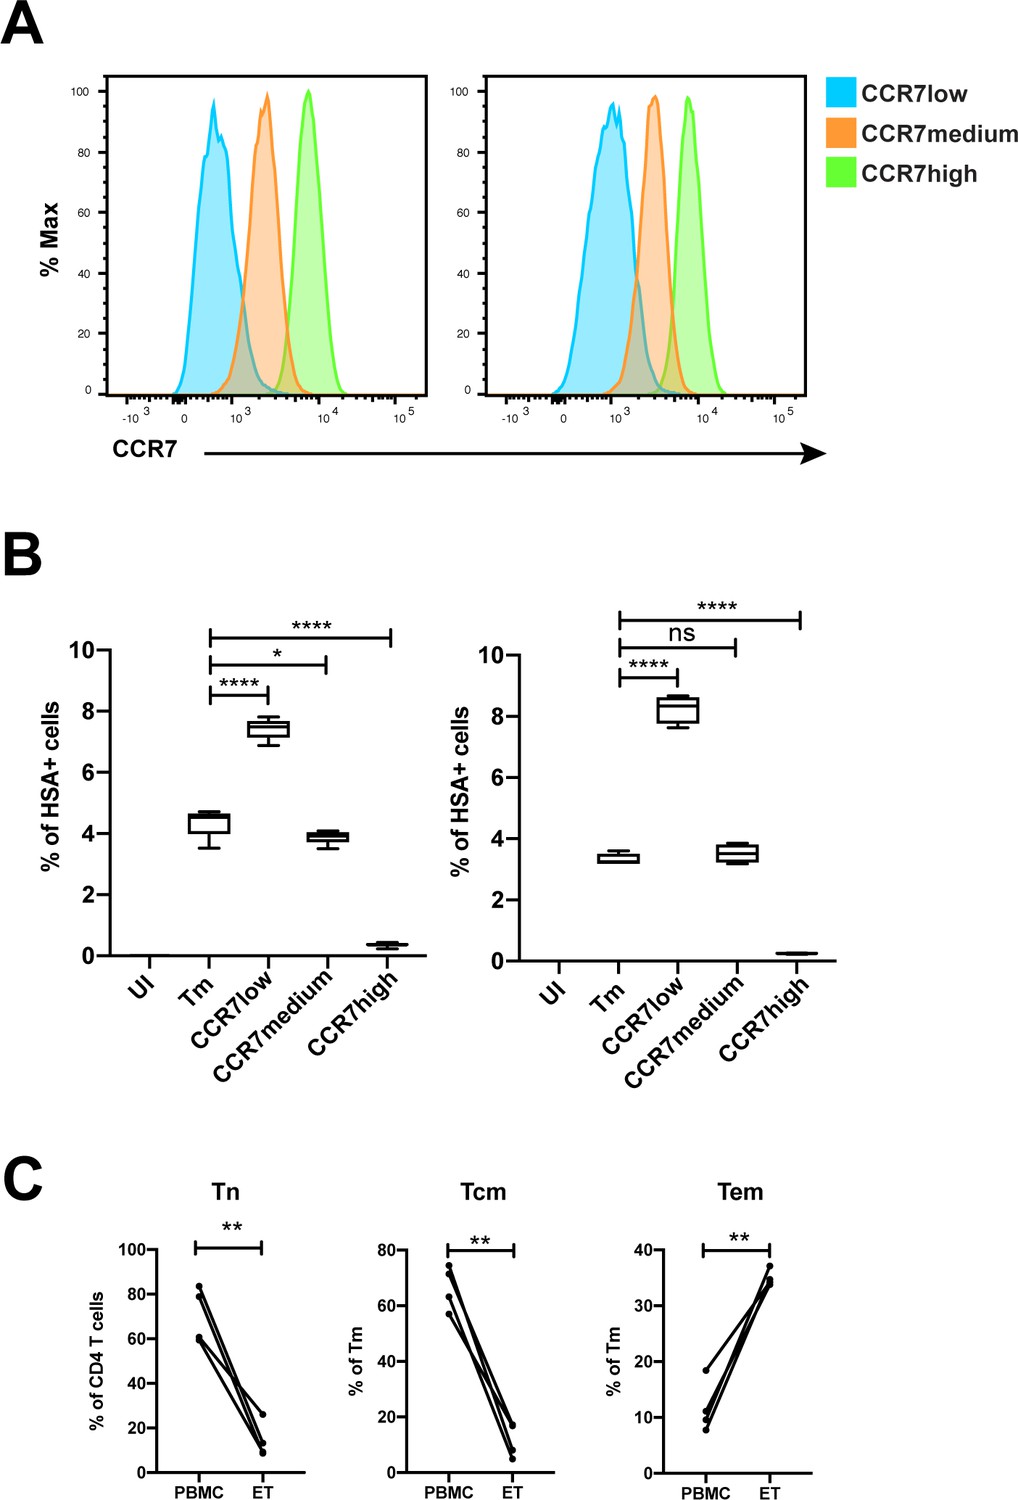
Validation of susceptibility of Tm subsets to HIV infection.
(A) Histograms showing the expression of CCR7 on three populations of sorted Tm cells (CD3+CD4+CD45RA-) expressing different levels of CCR7, a marker of Tcm, for two independent donors. (B) The sorted cells in panel A, along with total Tm cells, were exposed to F4.HSA and assessed for infection rates 3 days later. UI corresponds to Tm cells treated with media alone. Results are gated on live, singlet CD3+CD8- cells. The results from two donors demonstrate that infection rates inversely correlated with expression of CCR7, and validate the PP-SLIDE prediction that cells expressing high levels of CCR7 are poorly permissive to F4.HSA. Shown are the results from 2 donors representative of a total of 4. (C) The proportions of CD4+ T cells that were Tn (CD45RO-CD45RA+), and of memory CD4+ T cells (CD45RO+CD45RA-) that were Tem (CCR7-CD62L-) or Tcm (CCR7+CD62L+), were compared between uninfected endometrial and blood specimens. **p<0.01 as assessed using the Student’s paired t test. n.s.: not significant.
Figure 2—figure supplement 6
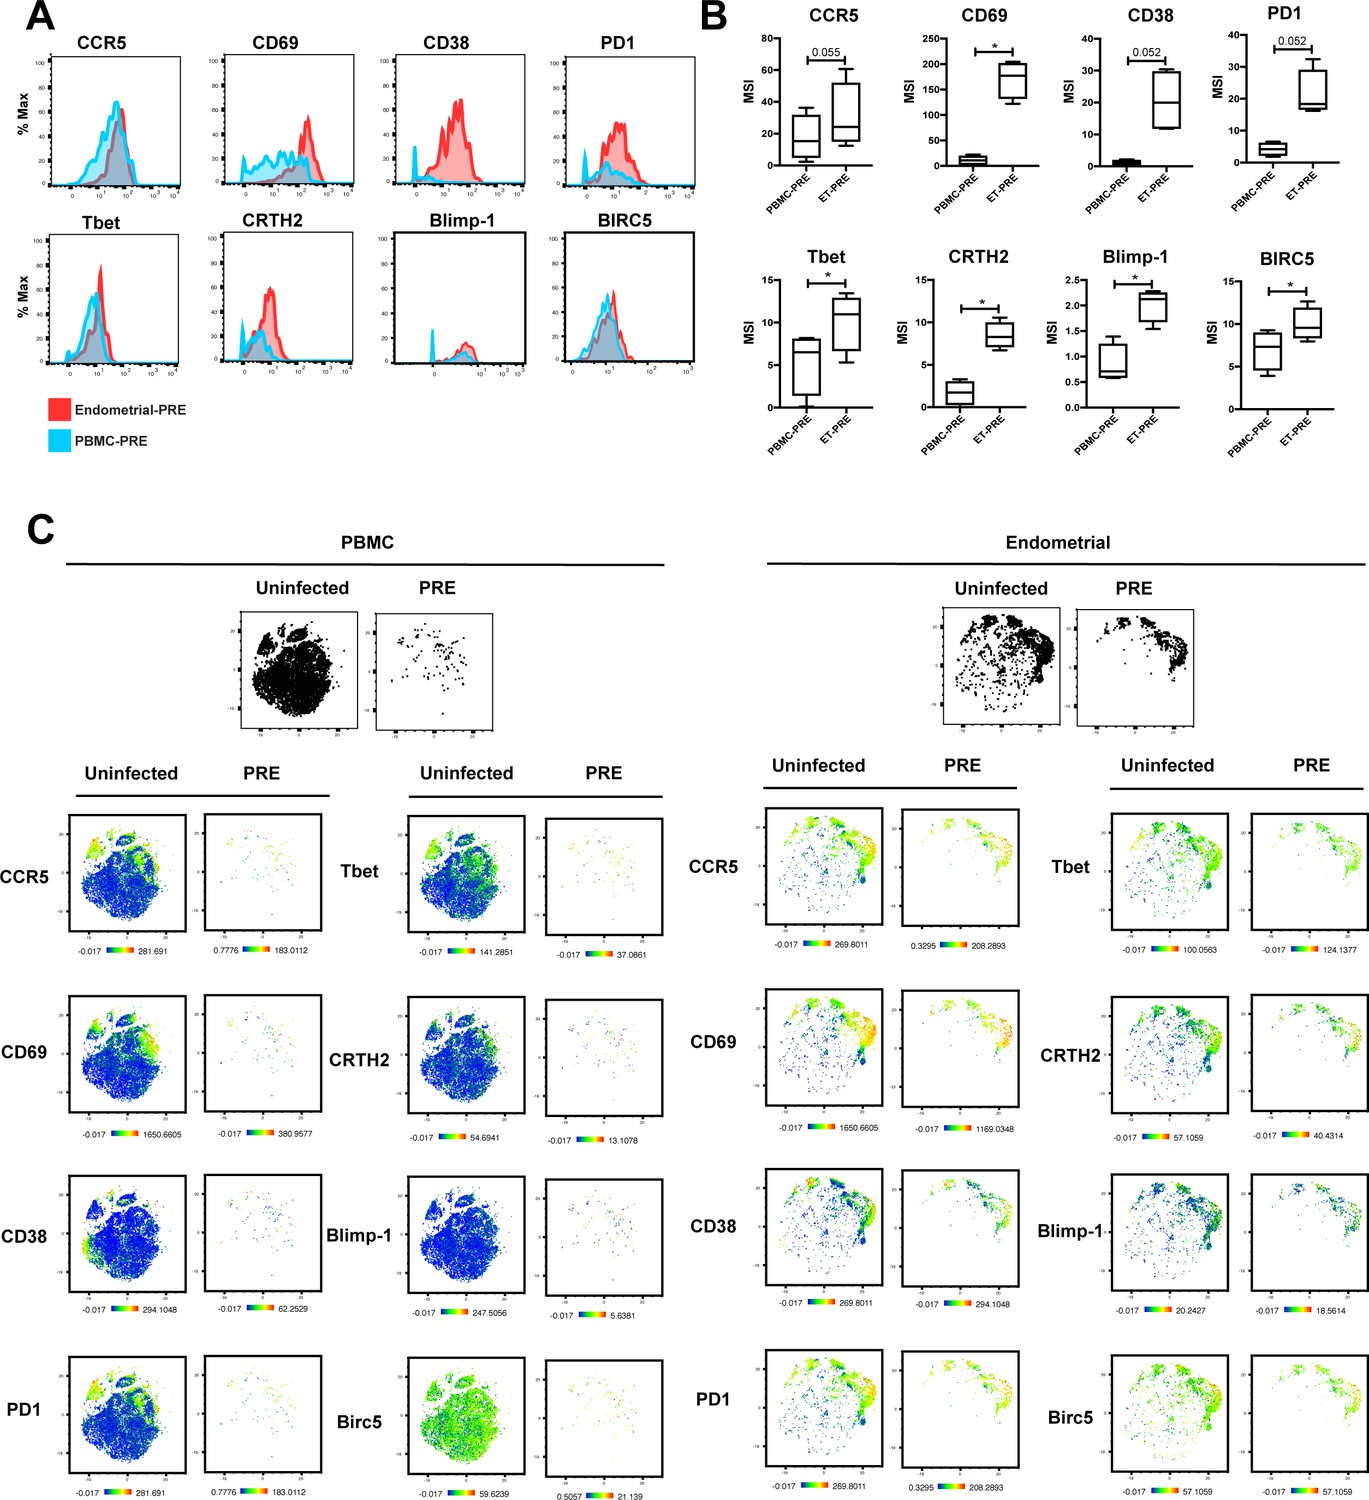
Antigens differentially expressed between PRE cells from PBMCs vs endometrium.
(A) Histograms showing the expression of select antigens differentially expressed between PRE cells from PBMCs versus endometrium for one representative donor of 4 total. Results are gated on live, singlet Tm cells. (B) Box plots showing the parameters differentially expressed between PRE cells from unstimulated PBMCs vs. endometrium. Results are gated on live, singlet Tm cells and correspond to data from 4 independent donors. *p<0.05 as assessed using the Student’s paired t-test and adjusted for multiple testing using the Benjamini-Hochberg for FDR. (C) Heatmap representations of t-SNE plots showing expression levels of select antigens differentially expressed between PRE cells from PBMCs versus endometrium for 1 representative donor of 4 total. Also shown are the expression levels of the same antigens in the total population of uninfected Tm cells. The pairs of t-SNE plots at the top depict the cells as large black dots to facilitate assessment of location of the PRE cells. Results are gated on live, singlet Tm cells.
Figure 2—figure supplement 7
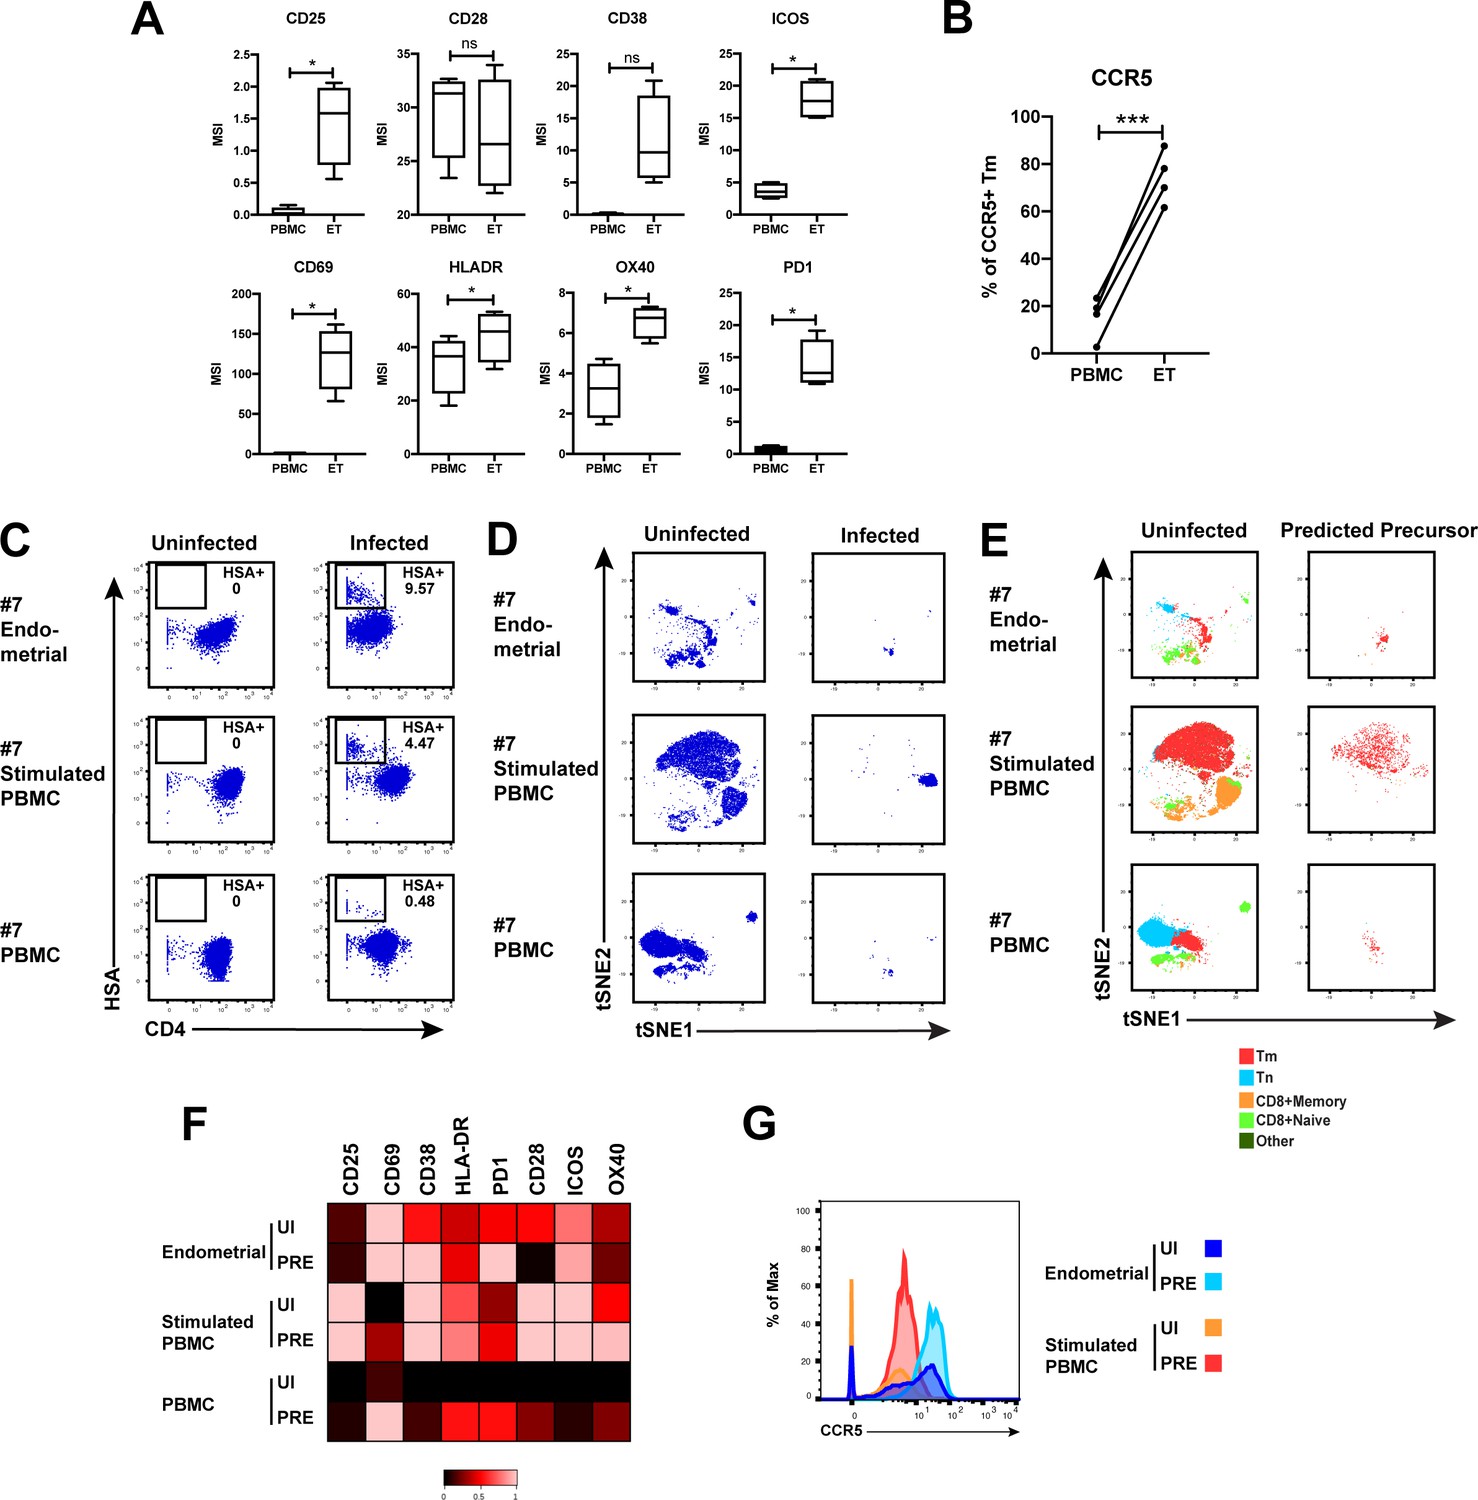
HIV-susceptible Tm cells from endometrium are less activated than HIV-susceptible Tm cells from stimulated PBMCs.
(A) Expression levels of activation markers on uninfected Tm cells from PBMCs and ETs. *p<0.05 as assessed using the Student’s paired t test and adjusted for multiple testing using the Benjamini-Hochberg for FDR. n.s.: non-significant. (B) Proportions of Tm cells from uninfected PBMCs and ETs that expressed CCR5. ***p<0.001 as assessed using the Student’s paired t test. (C) Unstimulated ETs, stimulated PBMCs, or unstimulated PBMCs, isolated from the same donor, were mock-treated or exposed to F4.HSA and monitored 3 days later for levels of productive infection. Results are gated on live, singlet CD3+CD8- cells. Numbers reflect the percentages of HIV-infected cells. (D) t-SNE plots corresponding to the uninfected T cells and HIV-infected cells from the indicated PBMC or endometrial cultures. (E) t-SNE plots of uninfected and PRE cells from the indicated PBMC or ET cultures showing the distribution of Tm, Tn, memory CD8+ T cells, and naïve CD8+ T cells. Note that PRE cells from all 3 samples are Tm, but these Tm were phenotypically distinct from one another, as suggested by their residing in different regions of the t-SNE. (F) Heatmap showing expression levels of activation markers differentially expressed in uninfected (UI) and PRE Tm cells from the indicated ET or PBMC cultures. Compared with PRE cells from the endometrium, those from stimulated PBMCs expressed higher levels of most activation markers in the CyTOF panel. Results are gated on live, singlet Tm cells. (G) Histogram showing expression levels of CCR5 on UI and PRE Tm cells from ETs or stimulated PBMC cultures. Endometrial UI and PRE Tm cells expressed higher levels of CCR5 than the corresponding populations from stimulated PBMCs.
Figure 2—figure supplement 8
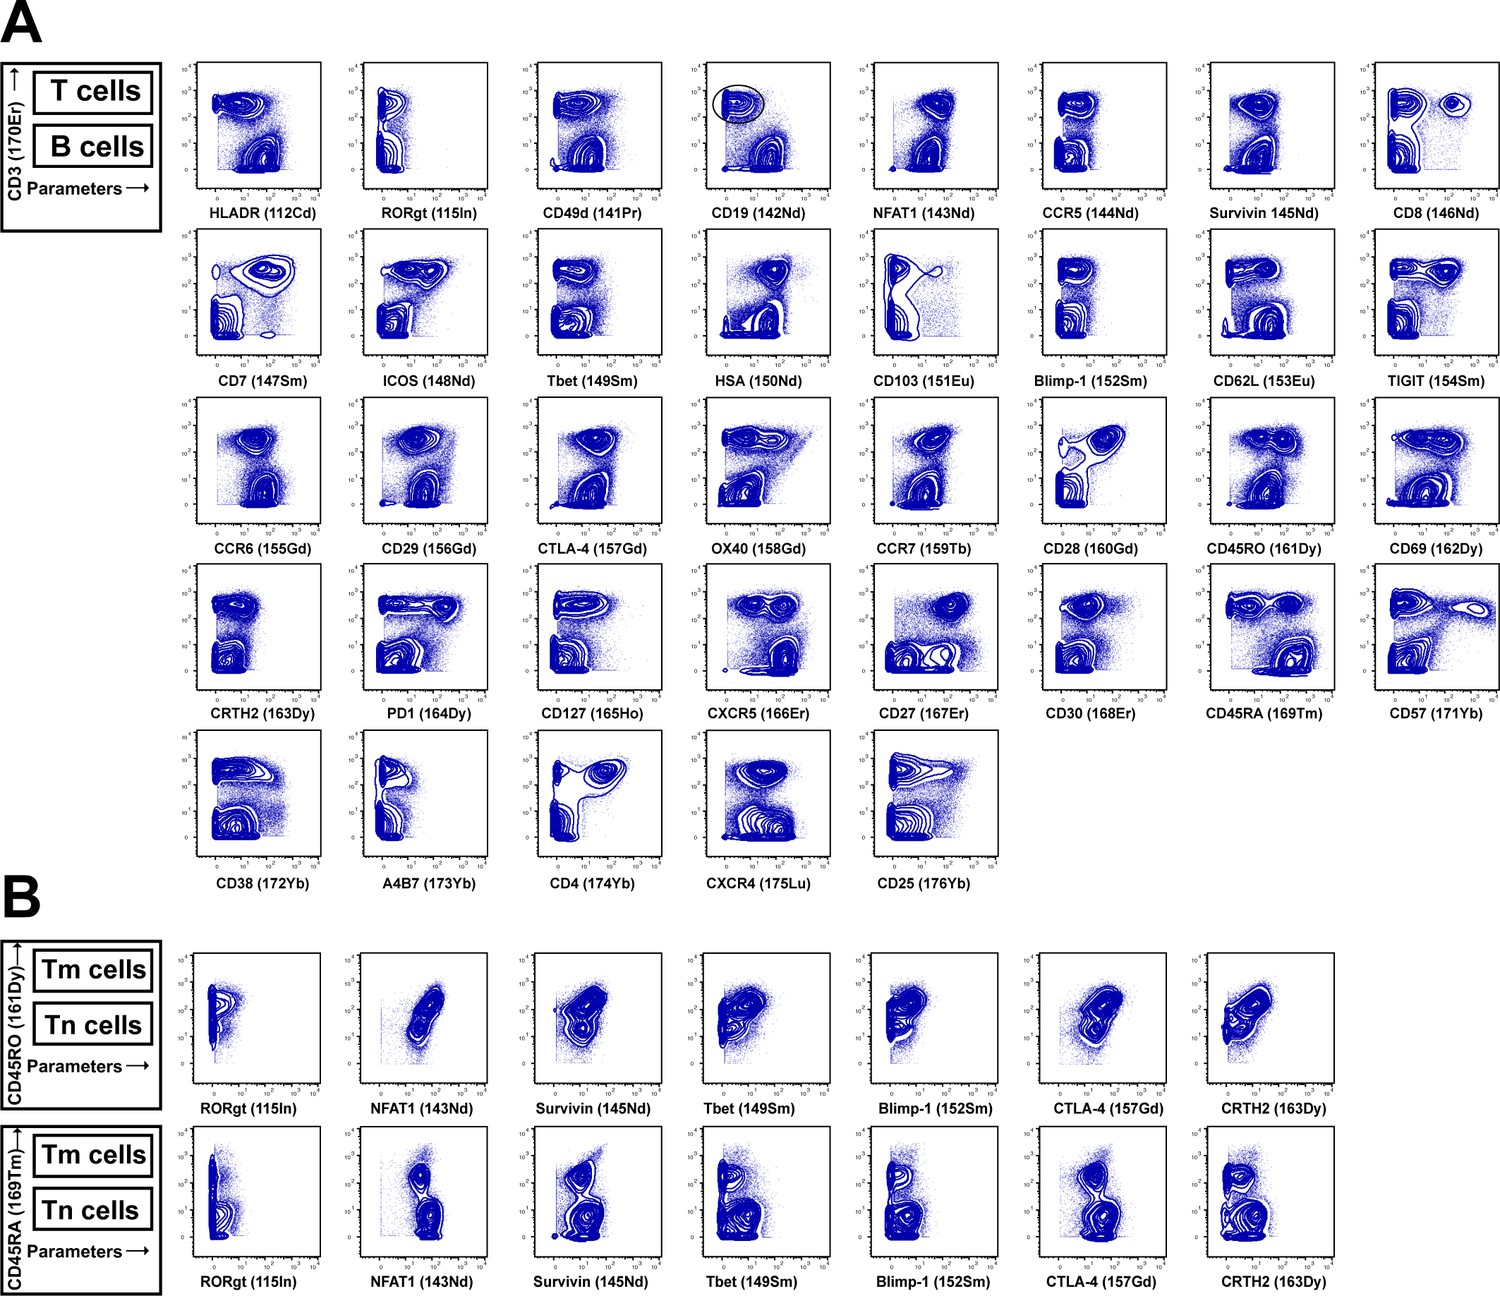
Validation of CyTOF antibodies through comparison of antigen expression on immune subsets.
Tonsillar HLACs provide a good source of cells for panel validation because T cell antigens are often differentially expressed in B cells, and tonsils provide an abundant source of both T and B cells (Cavrois et al., 2017). Shown are data representative of one of 10 independent donors. (A) As demonstrated schematically in the upper left, the top population of each plot corresponds to T cells (CD3+) while the bottom population corresponds to B cells (CD3-). Each antibody in the panel was validated by standard two-dimensional plots showing expression of CD3 (y-axis) versus each indicated antibody (x-axis). The observed expression patterns are consistent with known expression patterns on T cells and B cells. Results are gated on live, singlet cells. (B) Some antigens were further validated by demonstrating differential expression in naïve (Tn) vs. memory (Tm) CD4+ T cells. As demonstrated schematically on the left, in the first row the top population of each plot corresponds to Tm cells while the bottom population corresponds to Tn cells, while in the second row the top population of each plot corresponds to Tn cells while the bottom population corresponds to Tm cells. Results s are gated on live, singlet, CD3+CD8- cells.
Figure 3 with 1 supplement
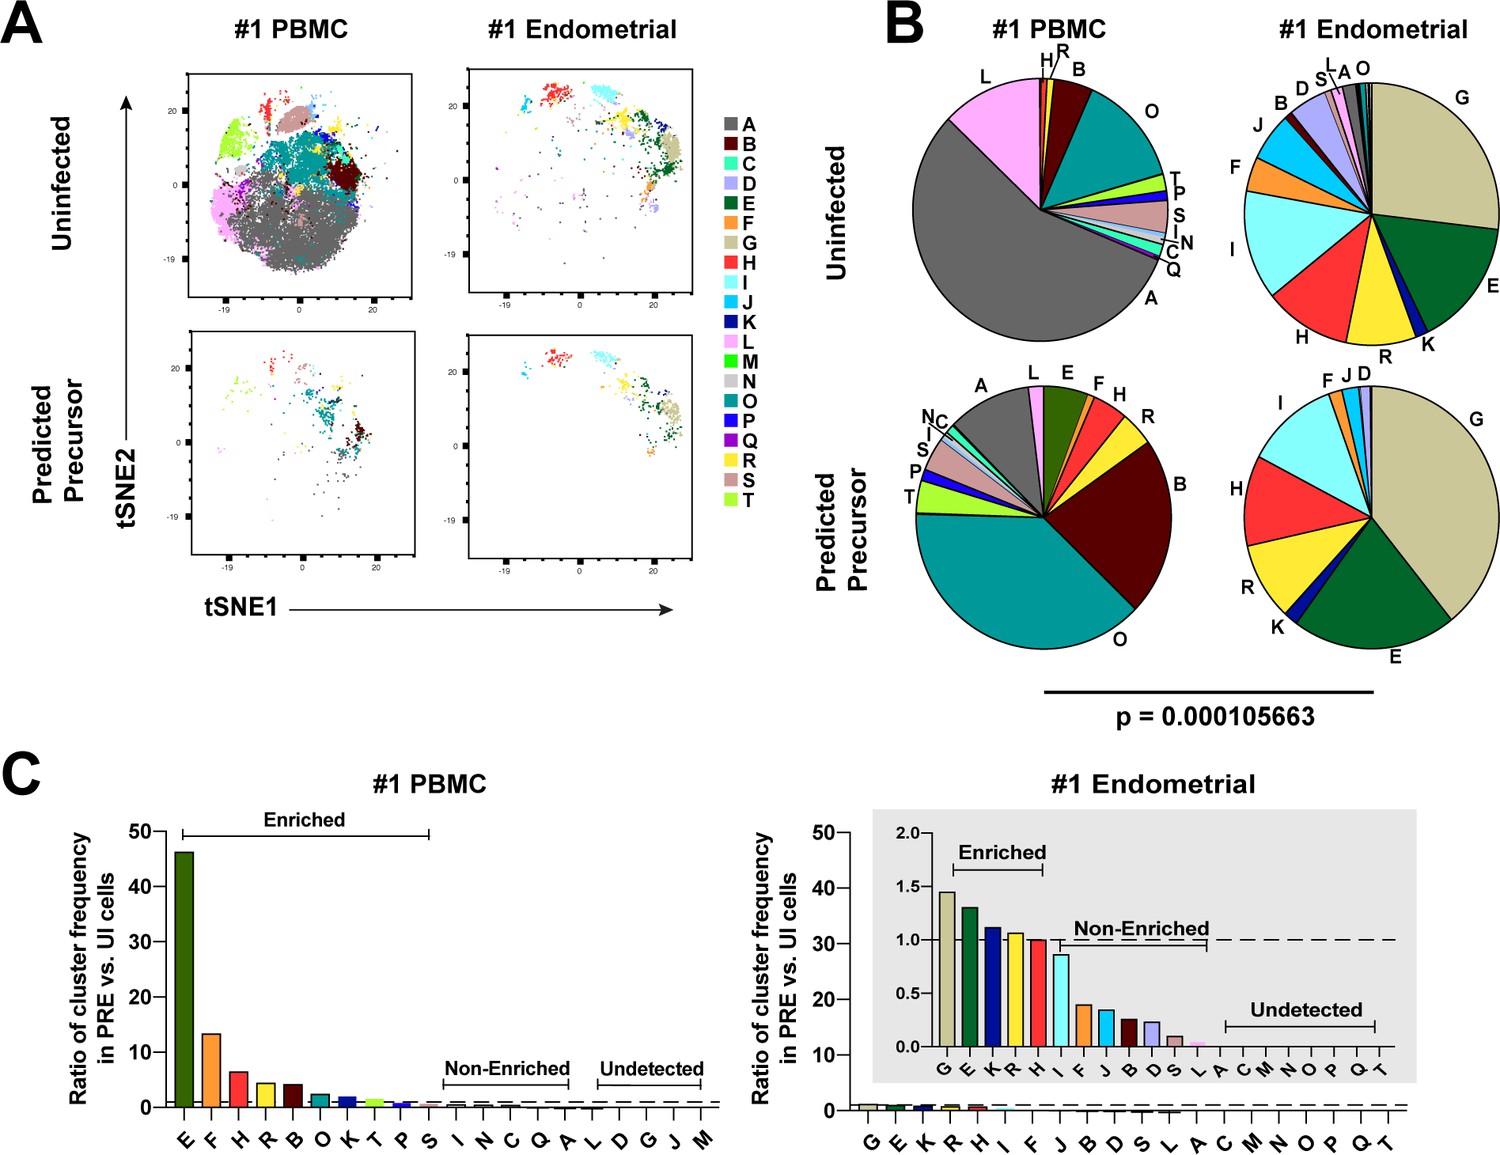
Most subsets of Tm in endometrium but not blood are susceptible to HIV infection.
(A) Tm and PRE cells from the blood and endometrium of Donor 1 were analyzed by FlowSOM, which identified 20 clusters of cells (A – T), each depicted with a different color. Note the pattern of uninfected Tm is different from that of the PRE cells for PBMCs, but similar for the endometrium. (B) Pie charts showing proportion of each cluster in the uninfected and PRE cells from PBMCs and ETs. Small clusters with frequencies less than 1% are not depicted. The patterns of clusters in Tm and PRE cells from ETs match more closely than those from PBMCs. Chi-square goodness of fit tests for checking similarity in the distribution of clusters among the Tm and the PRE populations was calculated and the difference in this chi-square dissimilarity metric between the PBMC versus ET datasets is reported as a P-value using procedures detailed in Materials and Methods. (C) PRE cells from PBMCs are more enriched for specific clusters than PRE cells from endometrium. To determine whether PRE cells preferentially resided within any of the clusters, the frequency of each PRE cluster was divided by the frequency of the equivalent cluster among uninfected Tm cells (see Materials and Methods). Ratios > 1 indicate clusters that are enriched in PRE cells relative to uninfected Tm cells. Note the extent of enrichment, as reflected by the ratio values, was more pronounced in PBMCs (left) relative to the endometrium (right). The grey inset is a zoomed-in view of the endometrium data. Corresponding data for the remaining 3 donors are presented in Figure 3—figure supplement 1.
Figure 3—figure supplement 1
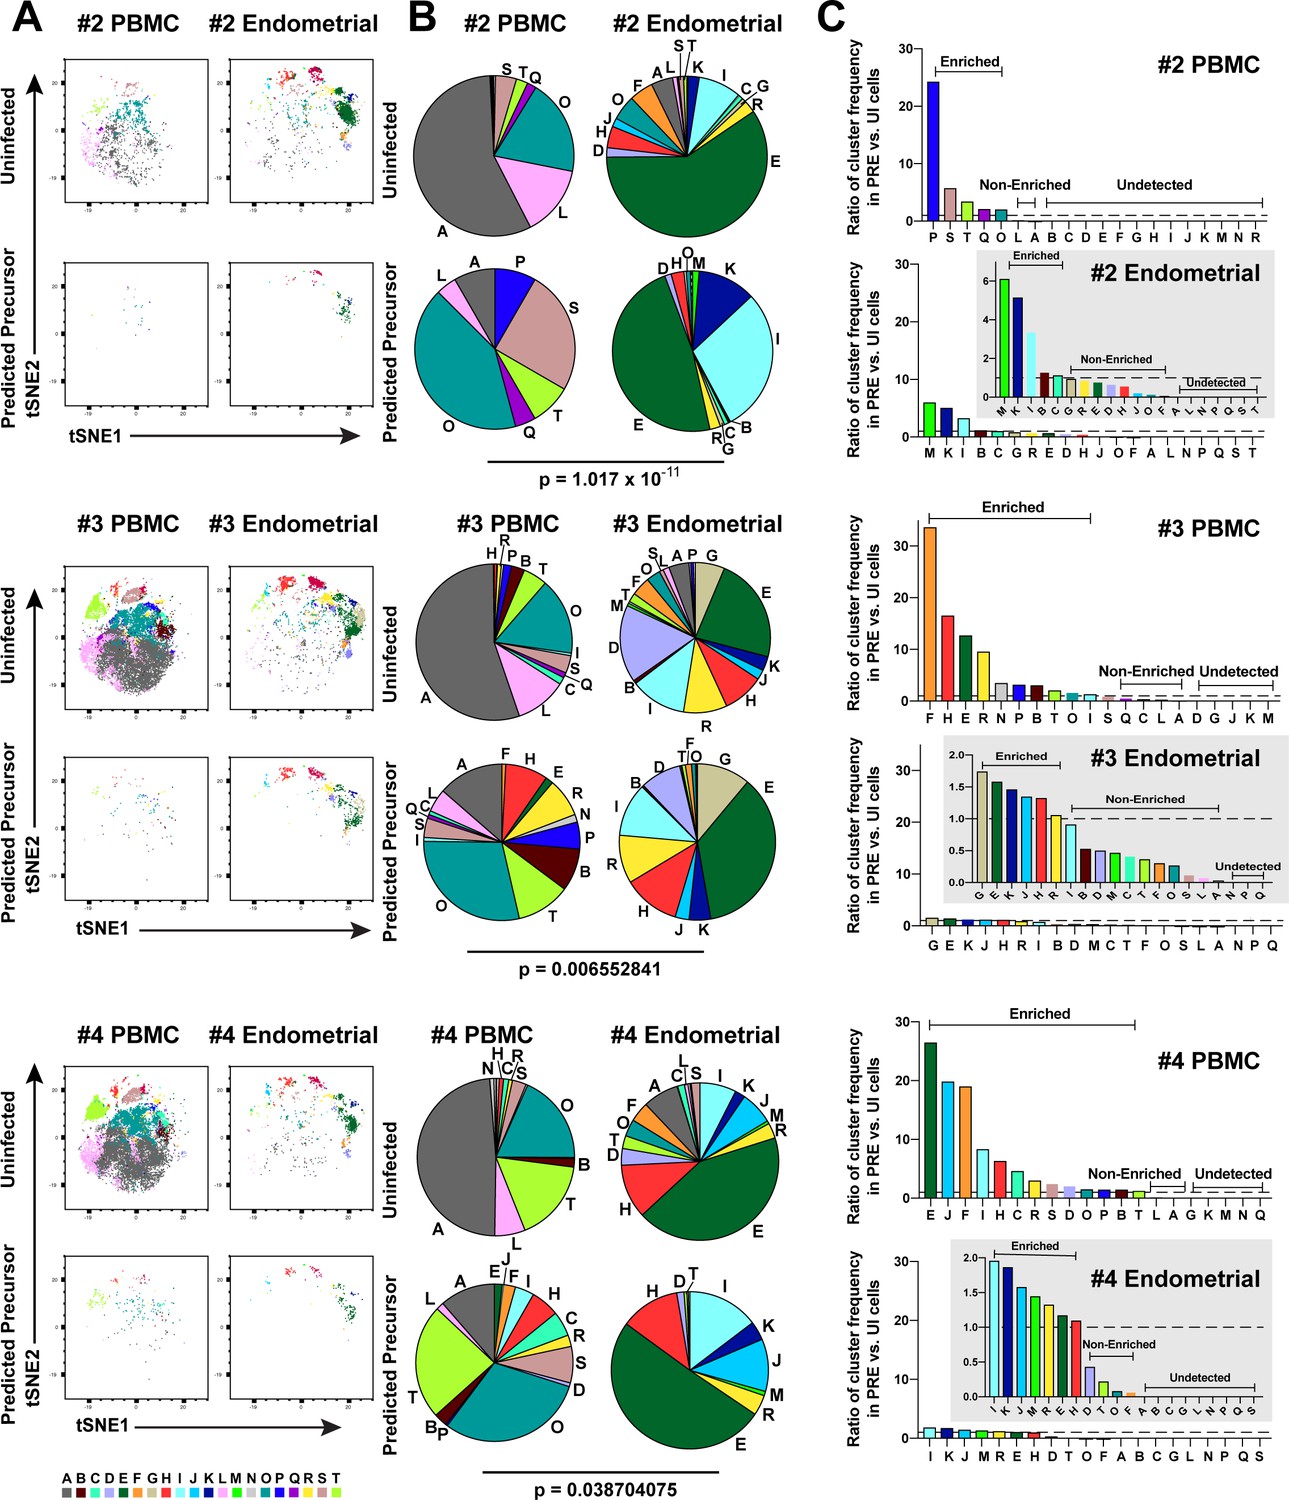
Most subsets of Tm in endometrium are susceptible to HIV infection.
(A) Uninfected and PRE cells from PBMCs and the endometrium from Donors 2, 3, and 4 were analyzed by FlowSOM to identify 20 clusters of cells (A – T), each depicted with a different color. (B) Pie charts showing proportion of each cluster in the uninfected and PRE cells from PBMCs and ETs. Small clusters with frequencies less than 1% are not depicted. The patterns of clusters in Tm and PRE cells from ETs match more closely than those from PBMCs. Chi-square goodness of fit tests for checking similarity in the distribution of clusters among the Tm and the PRE populations was calculated and the difference in this chi-square dissimilarity metric between the PBMC versus ET datasets is reported as a P-value using procedures detailed in Materials and Methods. (C) PRE cells from PBMCs are more enriched for specific clusters than PRE cells from ETs. The frequency of each PRE cluster was divided by the frequency of that cluster among Tm as described in Materials and Methods. The grey insets on the right depict zoomed-in views of the data.
Figure 4 with 2 supplements
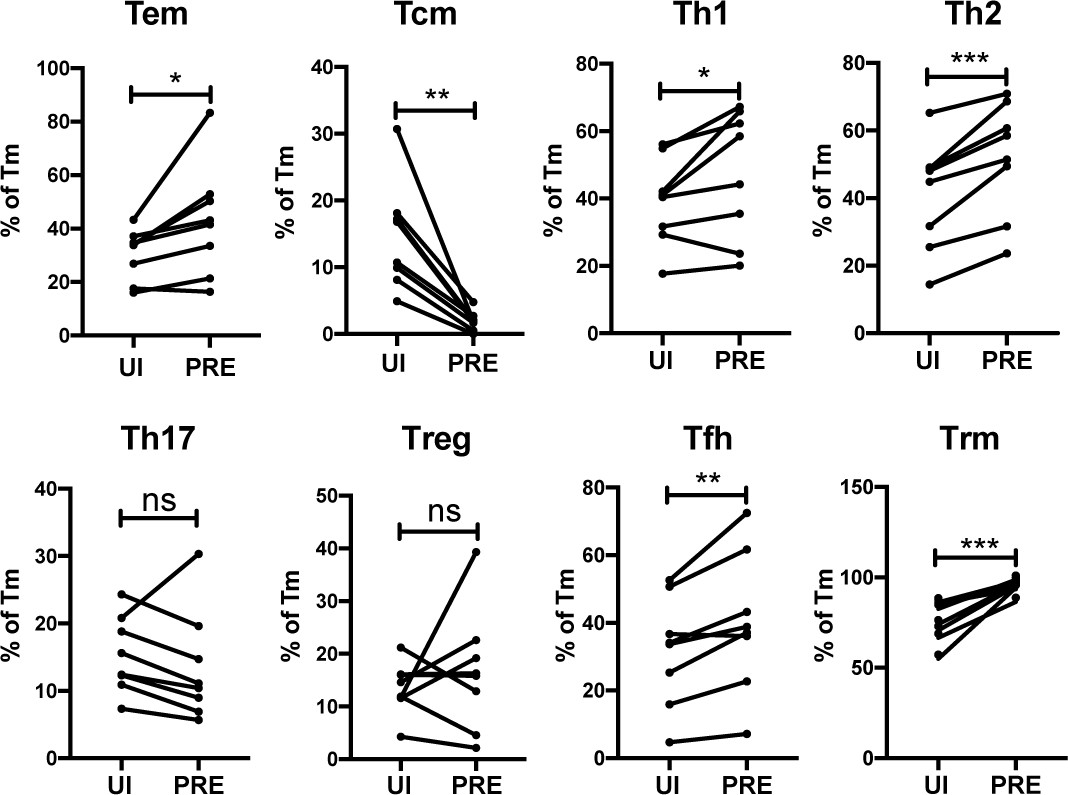
HIV preferentially infects endometrial Tem and Trm with phenotypic features of Th1, Th2, and Tfh cells.
The proportions of ETs that were Tem (CCR7-CD62L-), Tcm (CCR7+CD62L+), Th1 (Tbet+), Th2 (CRTh2+), Th17 (RORγt+), Tregs (CD127-CD25+), Tfh (PD1+CXCR5+), and Trm (CD69+) were compared among uninfected Tm cells (UI) and PRE cells. *p<0.05, **p<0.01, ***p<0.001 as assessed using the Student’s paired t test. n.s.: not significant.
Figure 4—figure supplement 1

Memory CD4+ T cells from the endometrium of 4 additional donors are highly susceptible to productive infection by HIV.
(A) ETs from 4 additional donors were mock-treated or inoculated with F4.HSA, and then monitored 3 days later by CyTOF for levels of productive infection. Left: Uninfected samples. Right: F4.HSA-exposed cells. Results are gated on live, singlet CD3+CD8- cells. (B) t-SNE plots corresponding to uninfected T cells (left), HIV-infected cells, and an overlay of the two plots (right) for the 4 donors shown in panel A. (C) t-SNE plots of uninfected T cells and the PRE cells from the 4 donors shown in panel A demonstrate that the dominant population of susceptible cells are Tm. Tm, Tn, memory CD8+ T cells, and naïve CD8+ T cells were identified by manual gating and colored as indicated.
Figure 4—figure supplement 2
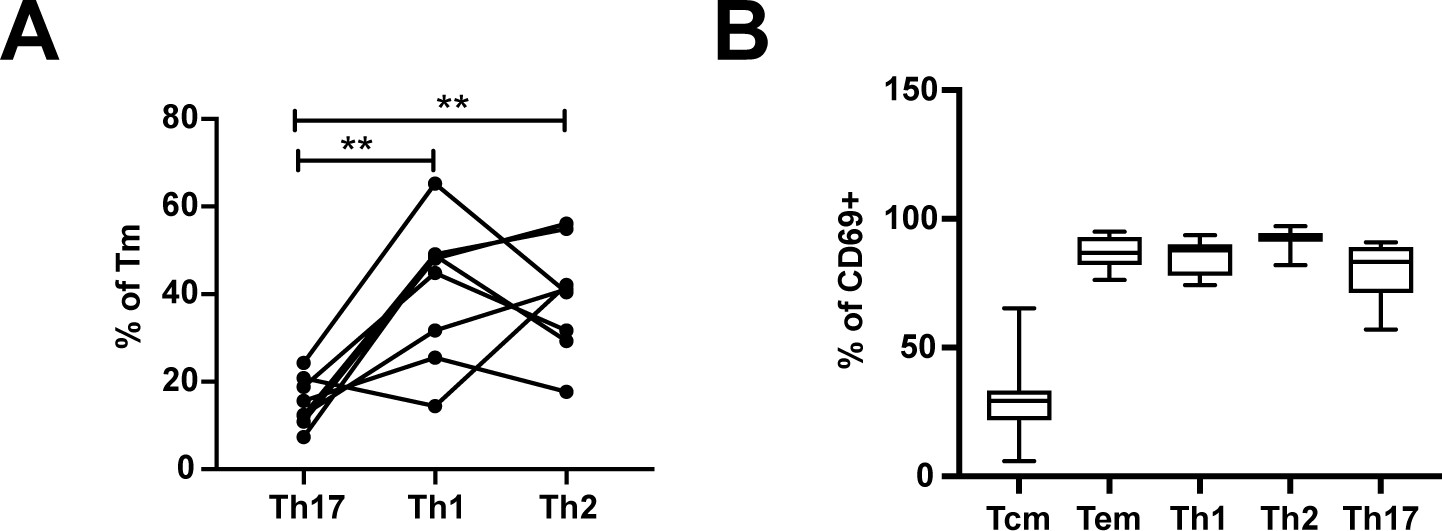
Frequencies of differentiated subsets expressing the Trm marker CD69.
(A) Proportions of Tm that were Th17 (RORγt+), Th1 (Tbet+), or Th2 (CRTh2+) cells. **p<0.01 as assessed using the Student’s paired t test and adjusted for multiple testing using the Benjamini-Hochberg for FDR. (B) The proportions of Tcm (CCR7+CD62L+), Tem (CCR7-CD62L-), Th1 (Tbet+), Th2 (CRTh2+), and Th17 (RORγt+) cells that expressed the Trm marker CD69.
Figure 5 with 1 supplement
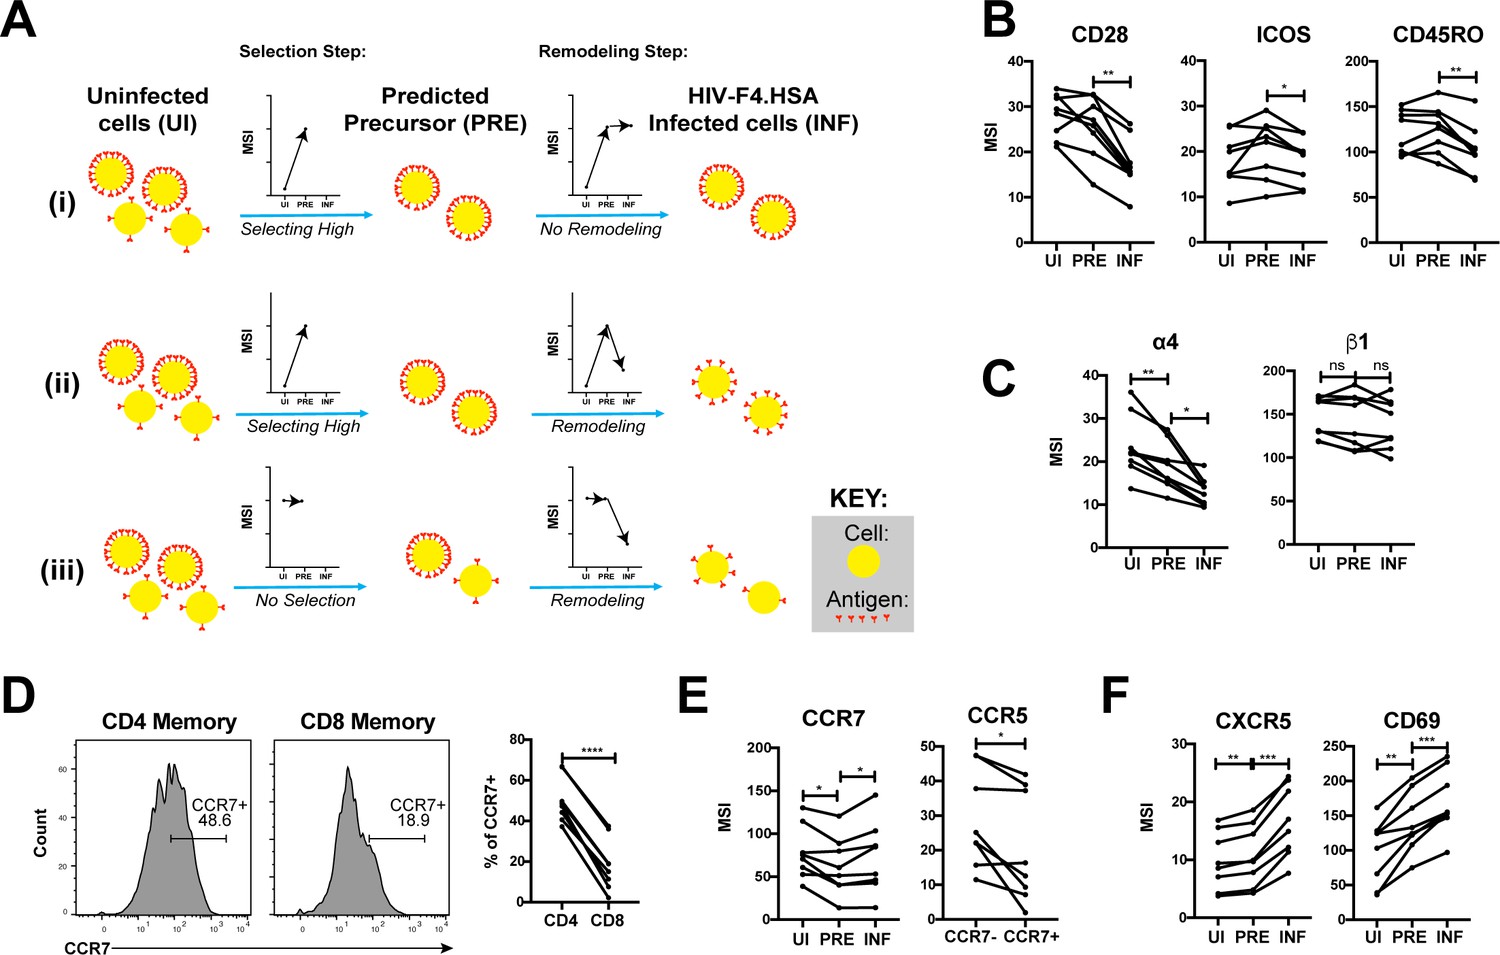
HIV remodels cells to impair TCR signaling and promote migration of infected cells to lymph node follicles.
(A) Schematic of the use of PP-SLIDE to distinguish HIV-induced up- or down-regulation of an antigen from preferential infection of cells expressing higher or lower levels of the antigen. In this schematic, circles (yellow) correspond to individual cells expressing different levels of a hypothetical antigen (red). The y-axis of the graph reflects the MSI of the antigen. In scenario (i), HIV preferentially infects cells with high levels of the antigen (as reflected by the MSI being higher on PRE cells than uninfected (UI) cells) and doesn’t modulate antigen levels after infection (as reflected by the MSI being the same on PRE cells and infected (INF) cells). In scenario (ii), HIV preferentially infects cells with high levels of the antigen (as in scenario (i)), but downregulates its expression in infected cells (as reflected by the MSI being lower on INF cells relative to PRE cells). In scenario (iii), HIV preferentially infects cells with overall equivalent levels of the antigen (as reflected by the MSI being the same on PRE cells and UI cells) but then downregulates the antigen in INF cells (as reflected by the MSI being lower on INF cells than PRE cells). (B) F4.HSA downregulates CD28, ICOS, and CD45RO, components of the TCR signaling apparatus. *p<0.05, **p<0.01 as assessed using the Student’s paired t test and adjusted for multiple testing using the Benjamini-Hochberg for FDR. (C) F4.HSA downregulates the α4 component of the α4β1 integrin. *p<0.05, **p<0.01 as assessed using the Student’s paired t test and adjusted for multiple testing using the Benjamini-Hochberg for FDR. (D) CCR7 expression is higher on Tm cells than on memory CD8+ T cells from the endometrium. Left: Histogram plots showing memory T cells gated on CD4 or CD8 as indicated. Right: Summary of data from 8 donors. ****p<0.0001 as assessed using the Student’s paired t test. (E) F4.HSA preferentially infects Tm cells with low levels of CCR7 but then upregulates expression of this receptor. Left: Plot showing MSI of CCR7 on UI, PRE, and INF cells. Right: Plot showing higher levels of expression of the HIV co-receptor CCR5 on CCR7- Tm cells, which provides an explanation for the higher susceptibility of these cells to infection. *p<0.05 as assessed using the Student’s paired t test. (F) F4.HSA upregulates expression of follicle-homing receptor CXCR5 and the lymph node retention marker CD69. **p<0.01, ***p<0.001 as assessed using the Student’s paired t test and adjusted for multiple testing using the Benjamini-Hochberg for FDR.
Figure 5—figure supplement 1
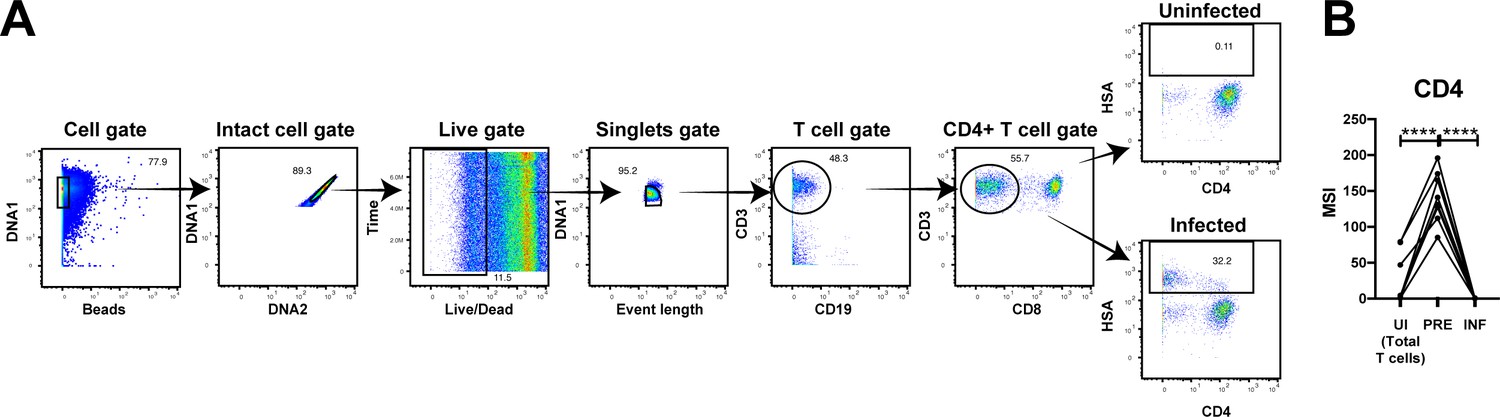
PP-SLIDE successfully identifies CD4+ T cells as preferential T cell targets of infection and detects downregulation of CD4 upon infection.
(A) Gating strategy to identify infected genital T cells. In this gating scheme, we defined infected cells as the total population HSA-expressing CD3+CD8- cells, so as to not pre-select for CD4-downregulated cells. Shown is the gating strategy for one donor representative of a total of 8. (B) HIV preferentially selects T cells with high levels of CD4 for infection, and then downregulates the receptor. The uninfected (UI) cells in this analysis correspond to the total population of uninfected T cells which includes both CD4+ and CD8+ T cells. ****p<0.0001 as assessed using the Student’s paired t test.
Figure 6
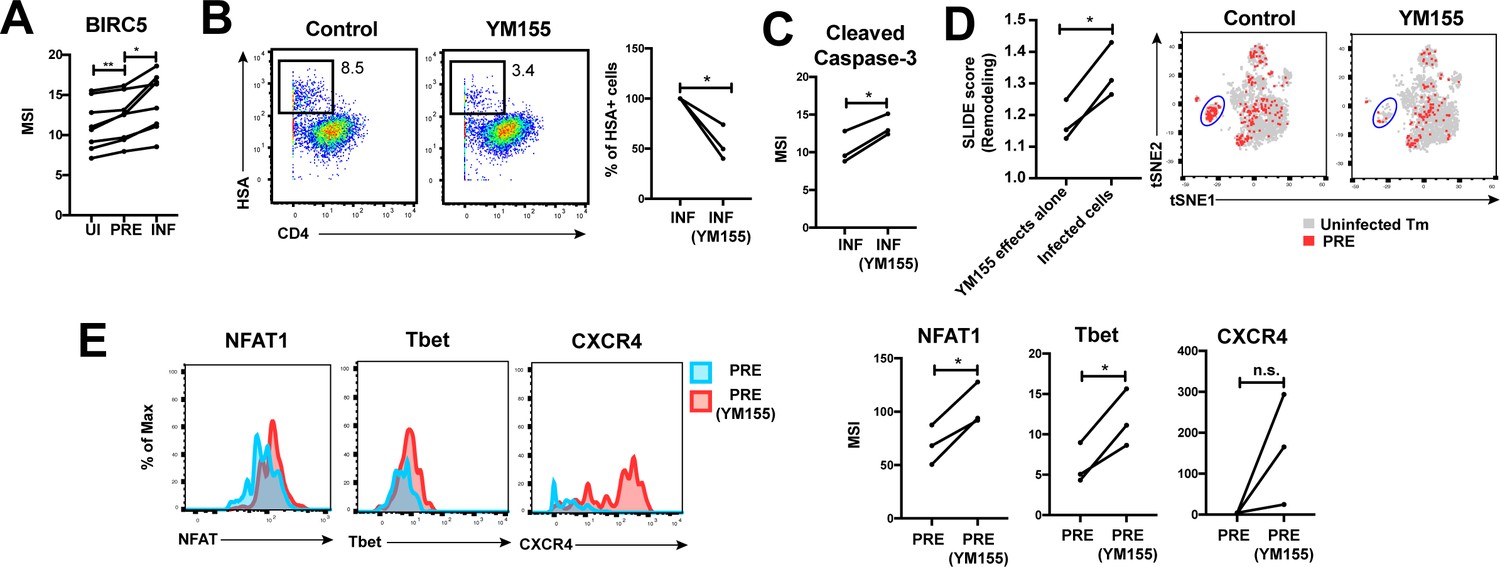
HIV exploits BIRC5 for cell survival upon infection of genital T cells.
(A) F4.HSA preferentially infects Tm cells with high levels of BIRC5, and then further upregulates expression of this protein during infection. *p<0.05, **p<0.01 as assessed using the Student’s paired t test. (B) Left: Representative plots of CyTOF analysis of the frequencies of HIV-infected cells in the absence vs. presence of the BIRC5 inhibitor YM155 (200 nM). Results are gated on live, singlet Tm cells. Right: Data from 3 donors (Donors 11–13, Supplementary file 1) demonstrating significant decrease in proportion of HIV-infected cells upon YM155 treatment. (C) HIV-infected cells that persist in the presence of YM155 are more pro-apoptotic as assessed by higher expression levels of cleaved caspase-3 relative to infected cells that were never exposed to YM155. (D) Left: SLIDE analysis revealing significantly higher remodeling in the productively-infected YM155-treated cells than in the uninfected YM155-treated cells. *p<0.05, **p<0.01 as assessed using the Student’s paired t test. Right: YM155 promotes death of some infected Tm over others. t-SNE plots of uninfected (grey) and PRE (red) cells for cultures exposed or not to YM155. Highlighted in blue is a region of the t-SNE preferentially devoid of PRE cells in the YM155 sample, suggesting preferential killing of these cells upon infection. Data are representative of a total of 3 independent donors. (E) Antigens differentially expressed on HIV-susceptible cells that survive infection in the presence of YM155. PRE cells from YM155-exposed cultures were compared to those from cultures never exposed to the drug for expression levels of the indicated antigens. Left: Representative histogram plots. Right: Cumulative data from 3 donors. *p<0.05, as assessed using the Student’s paired t test. n.s.: non-significant.
Figure 7

Model of how HIV-induced remodeling of genital T cells can promote systemic spread of the virus.
Infected cells from the genital tract are poorly capable of mounting an effective immune response due to downregulation of multiple components of the TCR signaling apparatus, and survive due to upregulation of BIRC5. Downregulation of α4β1 and upregulation of CCR7 promote migration of the infected cells from the genital mucosa to draining lymph nodes, where upregulation of CXCR5 and CD69 promote migration to and retention within the follicles.
Author response image 1

SEM86 does not alter the surface expression levels of CD3 or CD4 in primary T cells.
Author response image 2
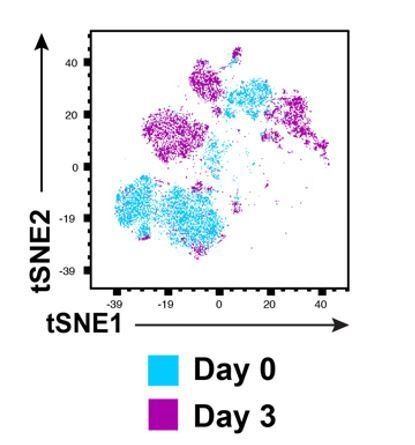
Phenotypic drift occurs upon culturing of freshly isolated endometrial T cells for 3 days.
Additional files
-
Supplementary file 1
Clinical parameters of donor specimens analyzed by CyTOF.
Table of patient clinical parameters (age, race, cycle day, diagnosis, cycle phase, progesterone levels, and specimen source) for each of the specimens analyzed by CyTOF.
- https://cdn.elifesciences.org/articles/55487/elife-55487-supp1-v1.docx
-
Supplementary file 2
List of CyTOF staining antibodies.
Table showing the antigen, metal label, antibody clone, and source of the CytOF antibodies used in this study.
- https://cdn.elifesciences.org/articles/55487/elife-55487-supp2-v1.docx
-
Supplementary file 3
SLIDE scores for individual specimens.
SLIDE scores (Sen et al., 2015) for each individual specimen were reported as the mean of the remodeling ratios corresponding to each infected cell. Scores > 1.2 revealed viral-induced remodeling at 20% or more fold change. P-values correspond to the significance of the remodeling score and are calculated as described in the Methods.
- https://cdn.elifesciences.org/articles/55487/elife-55487-supp3-v1.docx
-
Transparent reporting form
- https://cdn.elifesciences.org/articles/55487/elife-55487-transrepform-v1.docx
Download links
A two-part list of links to download the article, or parts of the article, in various formats.
Downloads (link to download the article as PDF)
Open citations (links to open the citations from this article in various online reference manager services)
Cite this article (links to download the citations from this article in formats compatible with various reference manager tools)
HIV efficiently infects T cells from the endometrium and remodels them to promote systemic viral spread
eLife 9:e55487.
https://doi.org/10.7554/eLife.55487


