Purkinje cell neurotransmission patterns cerebellar basket cells into zonal modules defined by distinct pinceau sizes
- Department of Pathology and Immunology, Baylor College of Medicine, United States
- Department of Neuroscience, Baylor College of Medicine, United States
- Jan and Dan Duncan Neurological Research Institute of Texas Children’s Hospital, United States
- Program in Developmental Biology, Baylor College of Medicine, United States
Figures
Figure 1
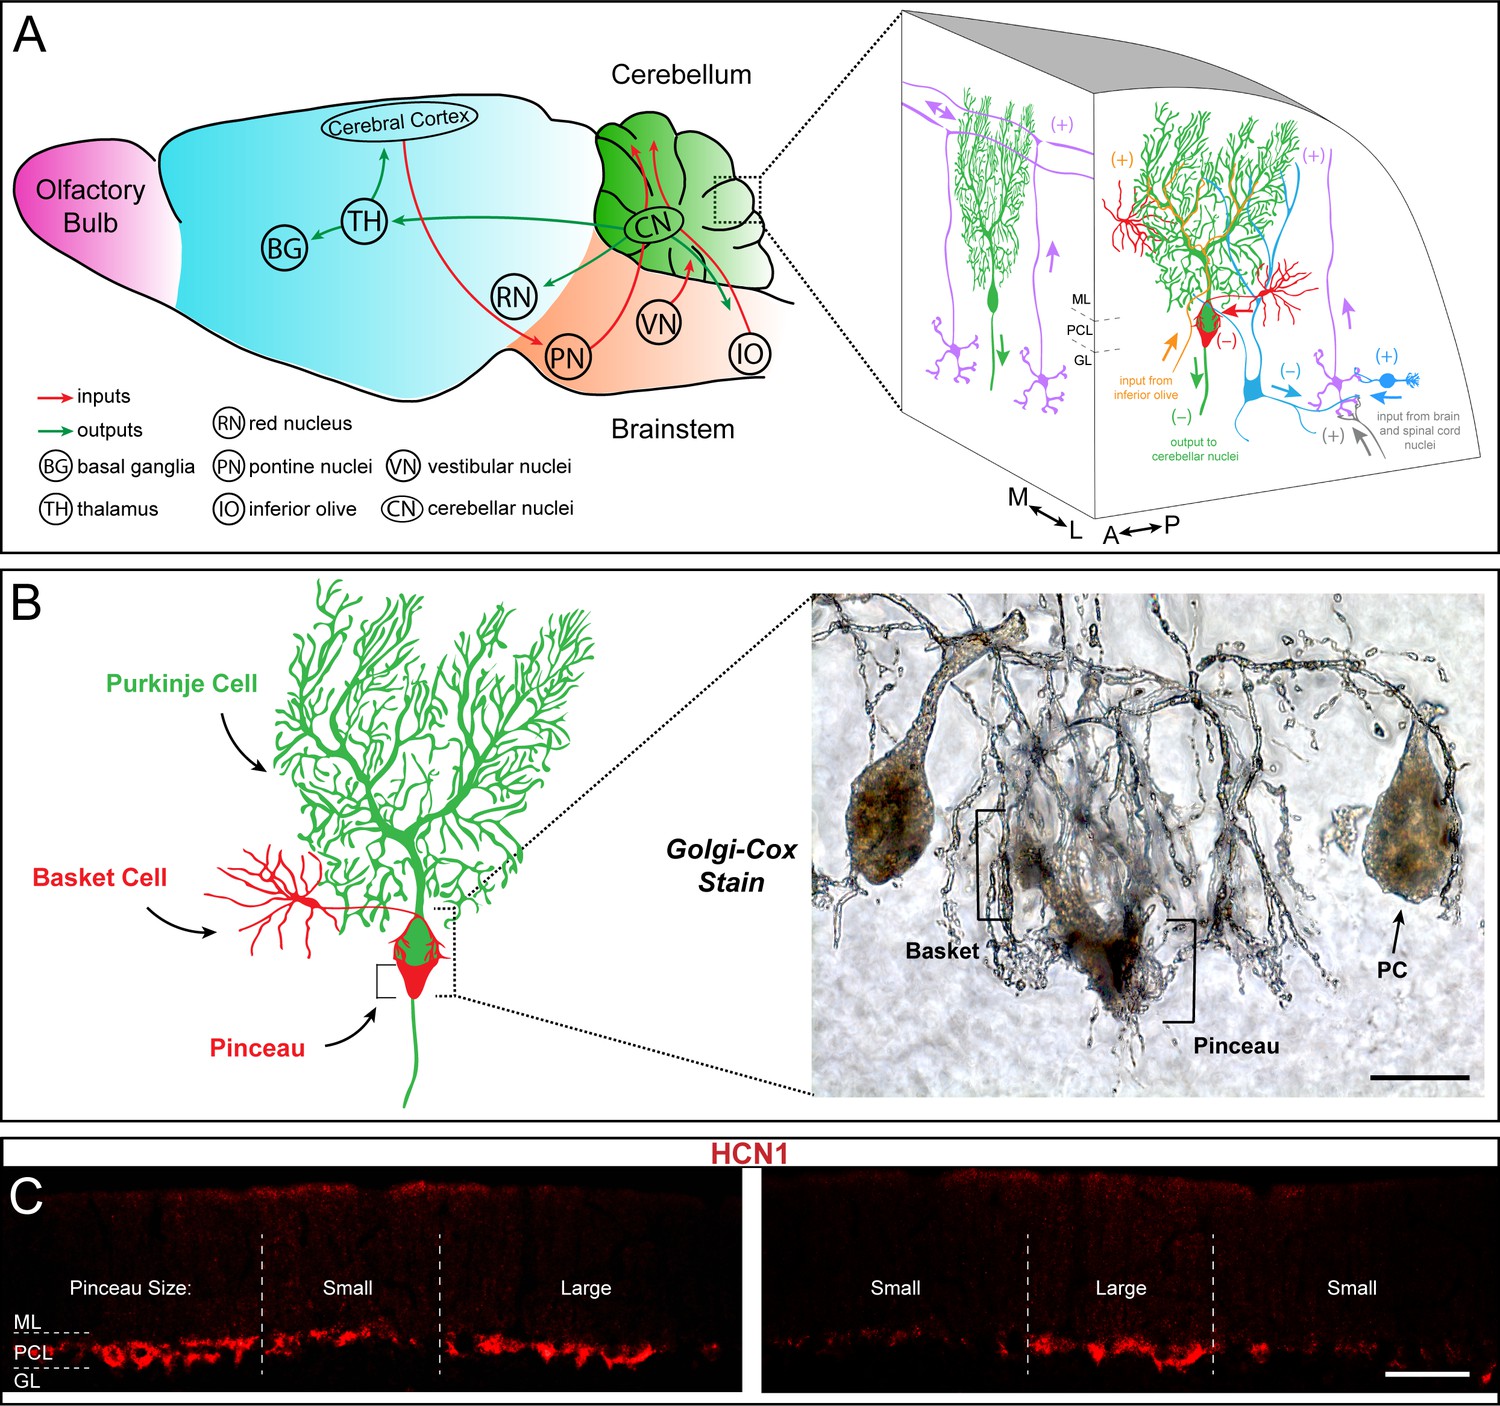
Basket cells are inhibitory interneurons in the cerebellar cortex that innervate Purkinje cells with a unique terminal called the pinceau.
(A) Left: Schematic of sagittal tissue section through the mouse brain illustrating key inputs (red arrows) and outputs (green arrows) between the cerebellum and other major brain regions. For reference, general divisions of the brain including the cerebellum (green), brainstem (orange), cerebral cortex (blue), and olfactory bulb (purple) are color coded. Right: Magnified schematic, depicted as a 3-dimensional image, of the cerebellar cortex showing the main cell types including Purkinje cells (green), granule cells (purple), and basket and stellate cells (red). Purkinje cell somata are contained in the Purkinje cell layer (PCL) underneath the molecular layer (ML), and directly below the PCL lies the granular layer (GL) containing granule cells and various classes of interneurons (blue). (+) and (–) indicate excitatory and inhibitory synapses, respectively. Known orientations of projections and cell morphologies are presented in both the sagittal ((A) anterior, (P) posterior) and coronal ((M) medial, (L) lateral) planes. (B) Left: Schematic of a Purkinje cell (PC, green) with an innervating basket cell (BC, red). Right: Golgi-Cox staining reveals the intricate innervation of basket cell axons onto the Purkinje cell soma and the axon initial segment (AIS). The ascending collaterals are not easily appreciated here. Basket cell axons initially form branching contacts on the somata of Purkinje cells, creating a basket-like shape (left bracket). Upon reaching the AIS, the axons extend terminal branches that converge to form the pinceau (right bracket). Scale bar is 15 μm. (C) Coronal-cut cerebellar tissue sections from an adult mouse stained for HCN1, which reveals the zonal patterning of basket cell pinceau projections. Dotted lines indicate zone boundaries. PCL, ML, and GL are indicated by PCL, ML, and GL, respectively. Basket cell pinceaux are located in the most superficial regions of the GL. Scale bar is 100 μm.
Figure 2 with 2 supplements

HCN1-labeled basket cell pinceaux are smaller in zebrinII-positive zones and larger in zebrinII-negative Purkinje cell zones.
(A, C, E) Coronal sections cut through the cerebellar cortex showing zebrinII (green, PC) and HCN1 (red, pinceau) expression. Dotted lines delineate the Purkinje cell zonal boundaries. Purkinje cell bodies are contained within the Purkinje cell layer (PCL) underneath the molecular layer (ML), and basket cell pinceaux are located in the superficial granular layer (GL) and PCL. (B, D, F) Magnified image of a zebrinII zonal boundary from panel A, C, and E, respectively (left, zebrinII-negative; right, zebrinII-positive). (E,F) Merged zebrinII and HCN1 expression patterns from A–D. Scale bars are 100 μm and 30 μm, respectively. Brackets in F highlight the pinceau size difference across a zebrinII Purkinje cell zonal boundary. (G) Schematic depiction of pinceau size distinctions in zebrinII-positive and -negative zones. (H) Whole-mount schematic diagram of the cerebellum showing the zebrinII expression pattern in lobule VIII. ZebrinII-positive zones in green are marked as P1+, P2+, and P3+ using the standard zebrinII zone nomenclature (see Sillitoe and Hawkes, 2002). (I) Quantification of pinceau area across zebrinII Purkinje cell zones in C57BL/6J mice reveals significantly smaller total pinceau size in zebrinII-positive zones (mean = 131.4 µm², SD = 44.76 µm²) compared to negative zones (mean = 383.5 µm², SD = 87.19 µm²). Each data point indicates the total area of multiple HCN1-labeled pinceaux within a 100 μm-wide region of a zebrinII-positive or -negative Purkinje cell zone, reported in µm² (N = 6, n = 12 sections, 26 zebrinII-positive Purkinje cell zones and 26 zebrinII-negative Purkinje cell zones; ****p<0.0001). (J) Corrected total cell fluorescence (CTCF) analysis reveals no significant difference in HCN1-labeled pinceau fluorescence intensity between pinceaux associated with zebrinII-positive (mean = 73.9, SD = 3.3) and zebrinII-negative (mean = 73.41, SD = 3.55) Purkinje cells. Each data point represents the CTCF value of a 1 µm² region in a single pinceau (N = 6 mice, n = 12 large and 12 small pinceaux; p>0.05; note, however, that although six mice were used for the quantitative analysis, the patterned relationship between HCN1 and zebrinII was consistently observed in every mouse studied so far, N > 20).
-
Figure 2—source data 1
Source data for representative graphs in Figure 2.
- https://cdn.elifesciences.org/articles/55569/elife-55569-fig2-data1-v2.xlsx
Figure 2—figure supplement 1
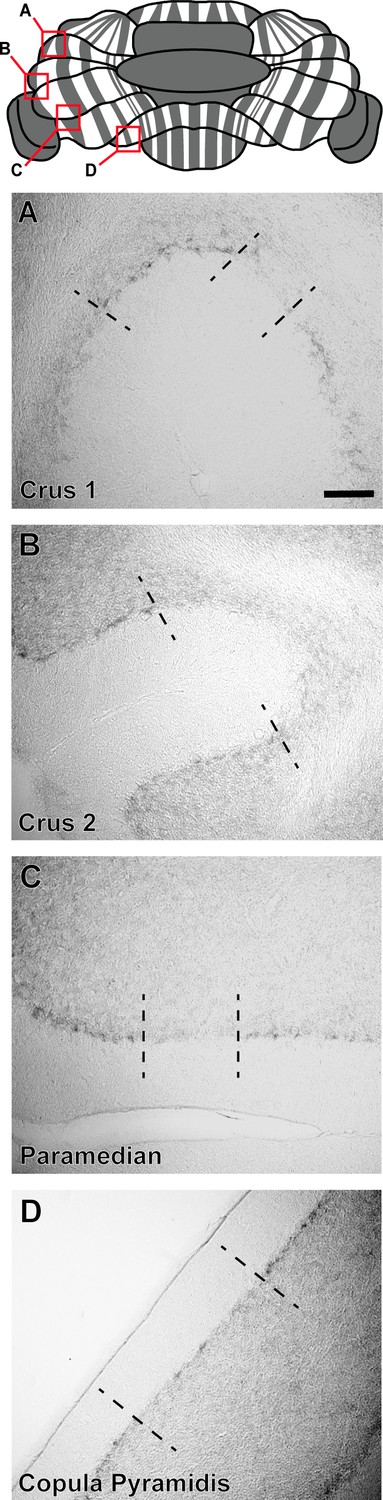
HCN1 expression reveals zones in the hemisphere lobules.
Top: Whole-mount schematic representation of zebrinII zonal expression (gray denotes positive domains) throughout the cerebellum. (A–D) Coronal sections from hemispheric regions of the cerebellum showing HCN1 expression, visualized with DAB. Boxes (A–D) on the schematic correspond to the hemispheric regions depicted in images (A–D) from Crus1, Crus2, paramedian, and copula pyramidis lobules. Dotted black lines indicate the boundaries between regions containing stronger HCN1 expression (corresponding to zebrinII-negative zones) and lower HCN1 expression (corresponding to zebrinII-positive zones). Scale bar in A is 50 μm (N = 6). The distinction between pinceau zones in the hemispheres is weak compared to the vermis.
Figure 2—figure supplement 2
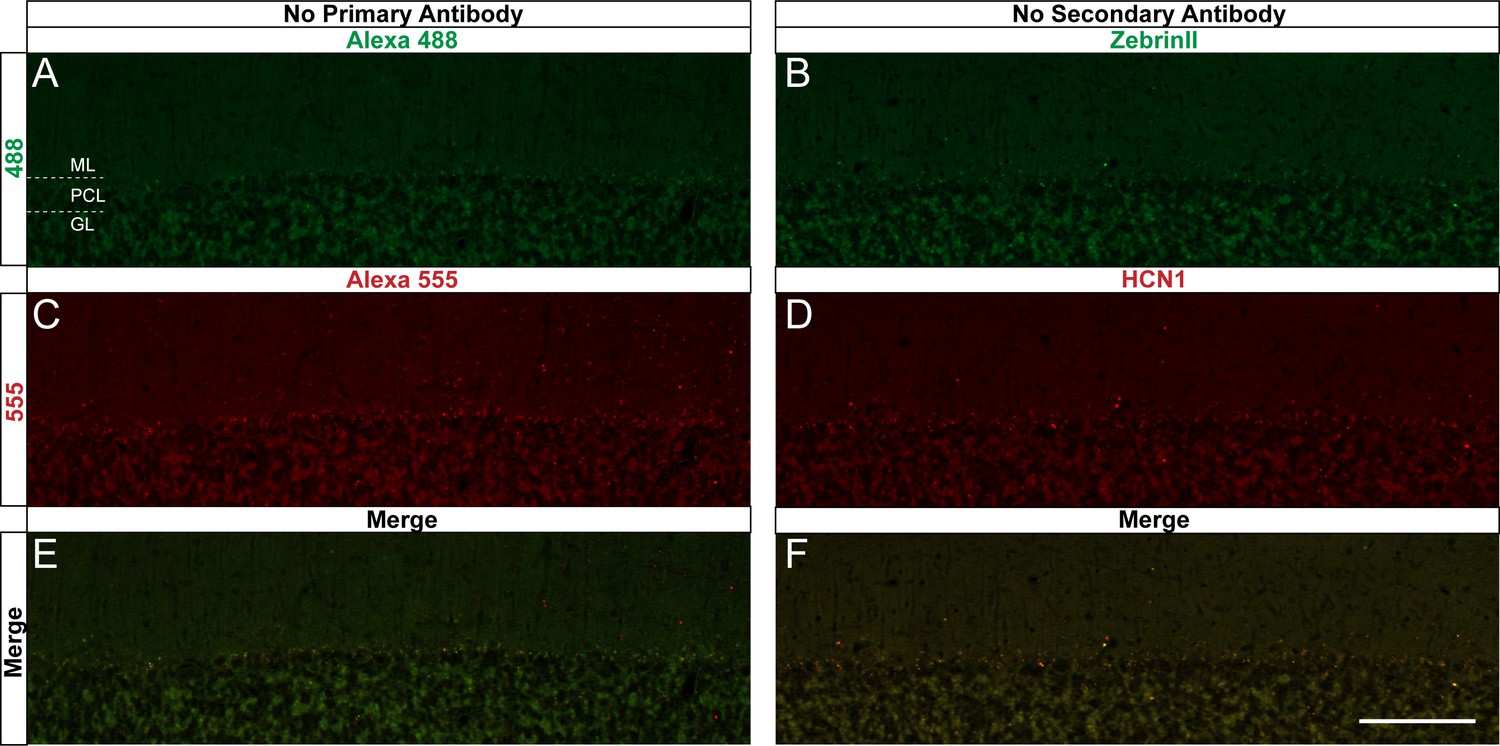
Sample antibody staining controls for the expression of protein markers in basket cell zones.
(A, C, E) Secondary antibody staining without the application of a primary antibody shows only the expected background, non-specific signal that is typical for Alexa 488 (green), Alexa 555 (red), and merged images, respectively. (B, D, F) Primary antibody staining without the application of secondary antibody also shows the lack of an immunopositive signal for zebrinII (green), HCN1 (red) and merged images, respectively. Scale bar in F is 100 μm. (A, B) were imaged to visualize the Alexa 488 fluorophore; (C, D) were imaged to visualize the Alexa 555 fluorophore (N = 7).
Figure 3

HCN1-labeled basket cell pinceaux are larger in PLCβ4-positive Purkinje cell zones.
(A, C, E) Coronal sections cut through the cerebellar cortex showing PLCβ4 (green, PC) and HCN1 (red, pinceau) expression. Dotted lines indicate Purkinje cell zonal boundaries. Purkinje cell somata are contained within the Purkinje cell layer (PCL) underneath the molecular layer (ML), and basket cell pinceaux are observed in the granular layer (GL) and occasionally in the PCL. (B, D, F) Higher magnification view of a PLCβ4 zonal boundary (left, PLCβ4-positive; right, PLCβ4-negative). Scale bars are 100 μm and 30 μm, respectively. Brackets in (F) highlight the pinceau size difference across a PLCβ4 Purkinje cell zonal boundary. (G) Schematic depiction of the pinceau size differences in PLCβ4-positive and -negative zones. (H) Whole-mount schematic diagram of the cerebellum showing the PLCβ4 and HCN1 expression patterns in lobule VIII. PLCβ4-positive zones in green are marked as P1- and P2- using the standard zebrinII zone nomenclature (Ozol et al., 1999; Sillitoe and Hawkes, 2002). Differences in HCN1-labeled pinceau sizes across PLCβ4 zones are labeled in dark red and light red, with larger pinceaux (dark red) located on Purkinje cells within the PLCβ4-positive zones (N = 4).
Figure 4
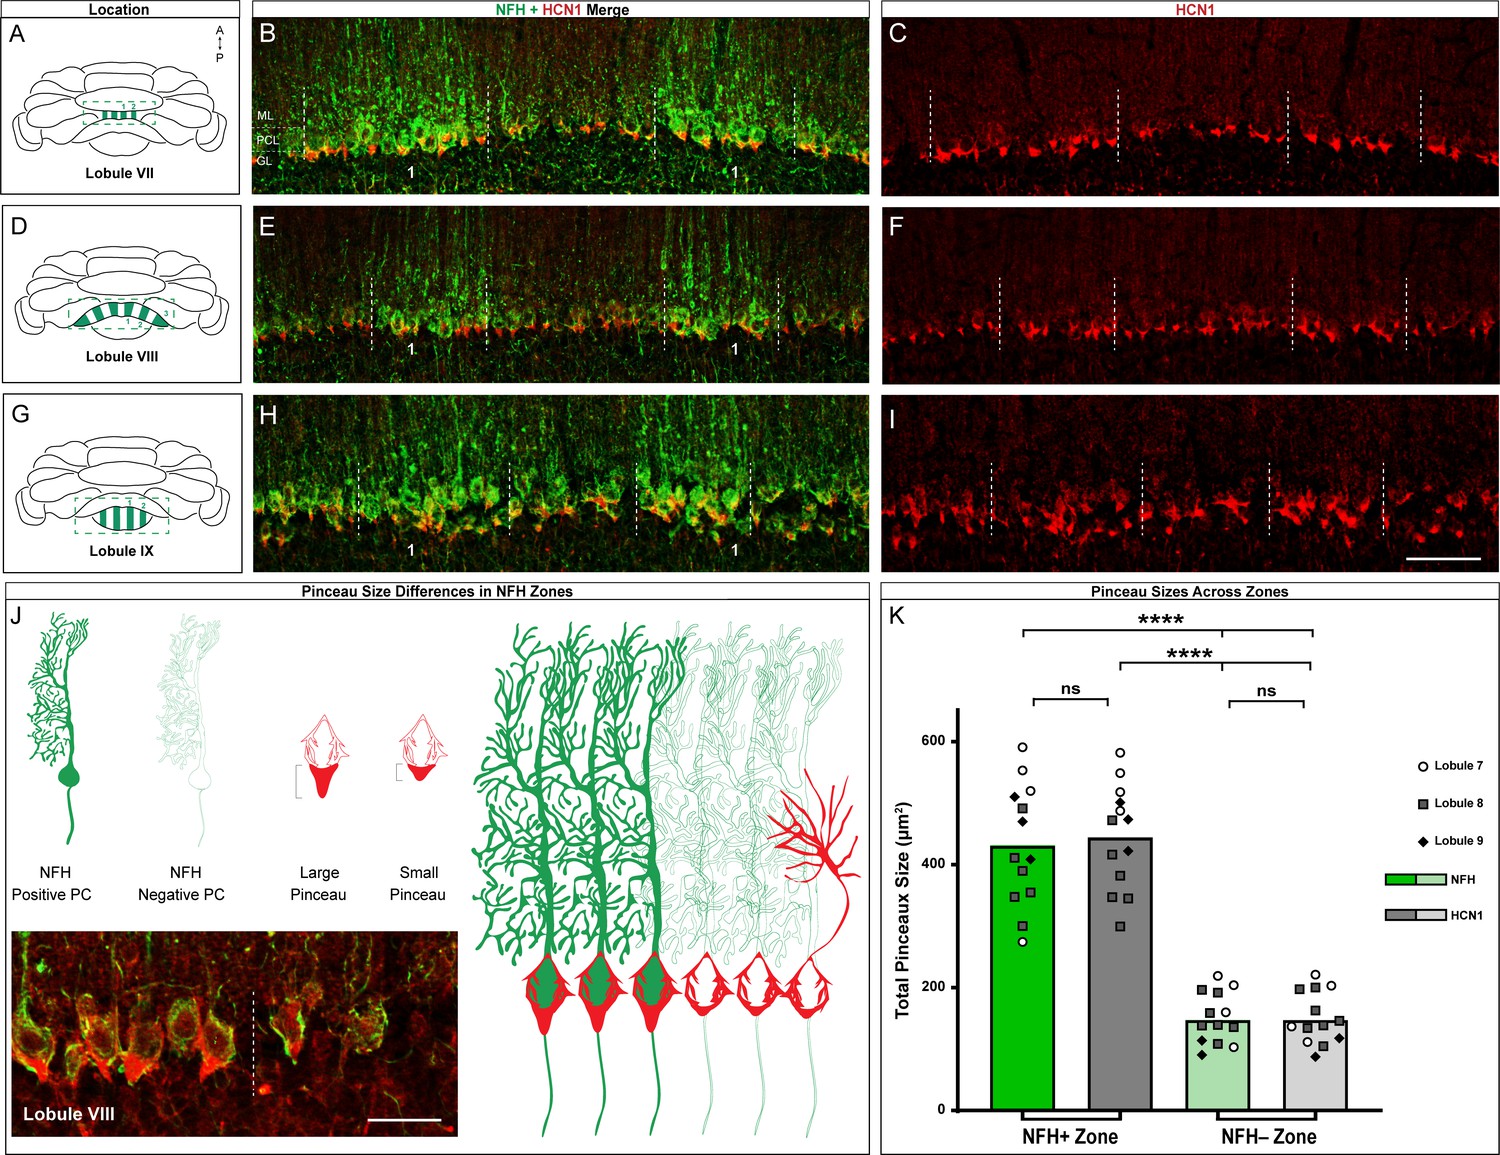
HCN1-labeled basket cell pinceaux are larger in NFH-positive Purkinje cell zones across different cerebellar lobules.
(A, D, G) Whole-mount cerebellum schematic showing NFH expression patterns in lobules VII, VIII, and IX respectively. NFH-positive zones are marked as 1, 2, 3. (B, C) Coronal sections cut through lobule VII showing NFH (green, Purkinje cell) and HCN1 (red, pinceau) expression. Dotted lines delineate the Purkinje cell zonal boundaries. The Purkinje cell layer (PCL), molecular layer (ML), and granular layer (GL) are labeled as guides for locating the basket cell pinceaux. (E, F) Coronal sections cut through lobule VIII showing NFH and HCN1 expression. (H, I) Coronal section showing NFH and HCN1 expression in lobule IX. Scale bar is 100 μm. (J) Schematic depiction of pinceau size differences between NFH-positive (left) and -negative (right) zones, with larger pinceaux located on Purkinje cells in the NFH-positive zones. For simplicity, we did not include a schematized representation of NFH expression within the basket cell terminals (pinceaux), although its expression there should be noted (Demilly et al., 2011). Inset in the bottom left shows the difference between pinceau sizes in an NFH-positive (left) and -negative (right) zone, in tissue from lobule VIII stained with NFH (green) and HCN1 (red). Scale bar is 30 μm (N = 4). (K) Quantification of pinceau area in NFH-positive and -negative zones analyzed for HCN1 and NFH, the latter of which is expressed in the pinceaux in addition to the Purkinje cells. Pinceau in NFH-positive zones (mean = 431.2 µm² (NFH) and 444.6 µm² (HCN1), SD = 99.3 µm² (NFH) and 85.94 µm² (HCN1)) are significantly larger than those in NFH-negative zones (mean = 147.8 µm² (NFH) and 148 µm² (HCN1), SD = 42.02 µm² (NFH) and 42.87 µm² (HCN1)). Each data point indicates the total area of multiple NFH or HCN1-labeled pinceaux within a 100 μm-wide region of an NFH-positive or -negative Purkinje cell zone, reported in µm² (N = 6, n = 6 sections, 13 NFH-positive Purkinje cell zones and 13 NFH-negative Purkinje cell zones; measurements from lobule 7 (white circles), lobule 8 (gray squares), and lobule 9 (black triangles) are represented; ****p<0.0001).
-
Figure 4—source data 1
Source data for representative graphs in Figure 4.
- https://cdn.elifesciences.org/articles/55569/elife-55569-fig4-data1-v2.xlsx
Figure 5
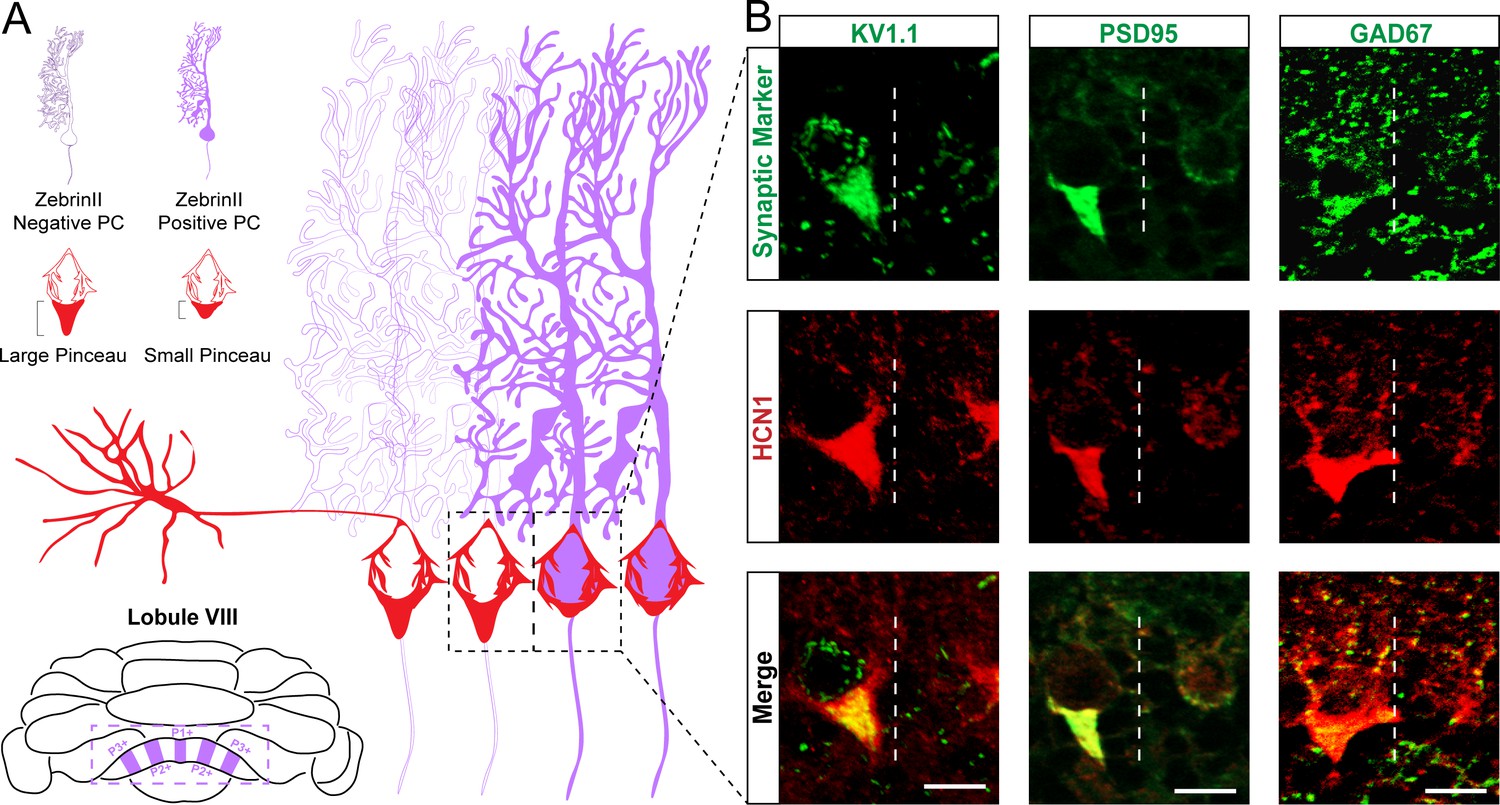
Kv1.1, PSD95, and GAD67 label basket cell pinceaux and adhere to the same zonal patterning as HCN1.
(A) Schematic of basket cell pinceau size differences across zonal boundaries. Dotted area around Purkinje cell somata depicts the boundary between a zebrinII-negative zone (left) and a zebrinII-positive zone (right). Basket cell pinceaux are larger, on average, in the zebrinII-negative zones. (B) Magnified images of Kv1.1, PSD95, GAD67 (green), and HCN1 (red) expression in basket cell pinceaux across a zebrinII zonal boundary. Dotted white lines indicate the boundary between a zebrinII-negative zone (left) and a zebrinII-positive zone (right). Pinceau sizes are distinctly larger in the zebrinII-negative zone as marked by all four pinceau markers. Merged HCN1 and Kv1.1, PSD95, GAD67 expression is shown in the bottom row, respectively (N = 7 for Kv1.1, seven for PSD95, and seven for GAD67). Scale bars are 15 μm.
Figure 6 with 1 supplement

Genetically marked basket cell pinceaux are distinguished by size according to Purkinje cell zones.
(A, B, C) Coronal sections cut through the cerebellar cortex showing IP3R1 (blue, PC), GFP (green, pinceau), and PLCβ4 (red, PC) expression in Ascl1CreERT2;Tauflox-stop-mGFP-lacZ tissue. Dotted line indicates the Purkinje cell boundary between a PLCβ4-positive (left) and PLCβ4-negative (right) zone. Scale bar in A is 50 μm. (D) Merged IP3R1, GFP, and PLCβ4 expression. Brackets highlight genetically labeled-pinceaux of different sizes between PLCβ4-positive and -negative zones, which is consistent with the results from the HCN1-labeled pinceaux. (E) Schematic of experimental timeline and procedure to generate genetically labeled basket cells and pinceaux. Upon tamoxifen administration, the CreER protein that was sequestered in the cytoplasm by HSP is now able to enter the nucleus and induce recombination at loxP sites. Neurons are marked with GFP after recombination. (F) Quantification of pinceau area across PLCβ4 zones reveals significantly higher total pinceau size in PLCβ4-positive zones (mean = 537.7 µm², SD = 125.2 µm²) compared to PLCβ4-negative zones (mean = 166.5 µm², SD = 62.17 µm²). Each data point indicates the total area of multiple HCN1-labeled pinceaux within a 100 μm-wide region of a PLCβ4-positive or -negative Purkinje cell zone, in µm² (N = 4, n = 8 sections, 20 PLCβ4-positive zones and 22 PLCβ4-negative zones; ****p<0.0001).
-
Figure 6—source data 1
Source data for representative graphs in Figure 6.
- https://cdn.elifesciences.org/articles/55569/elife-55569-fig6-data1-v2.xlsx
Figure 6—figure supplement 1
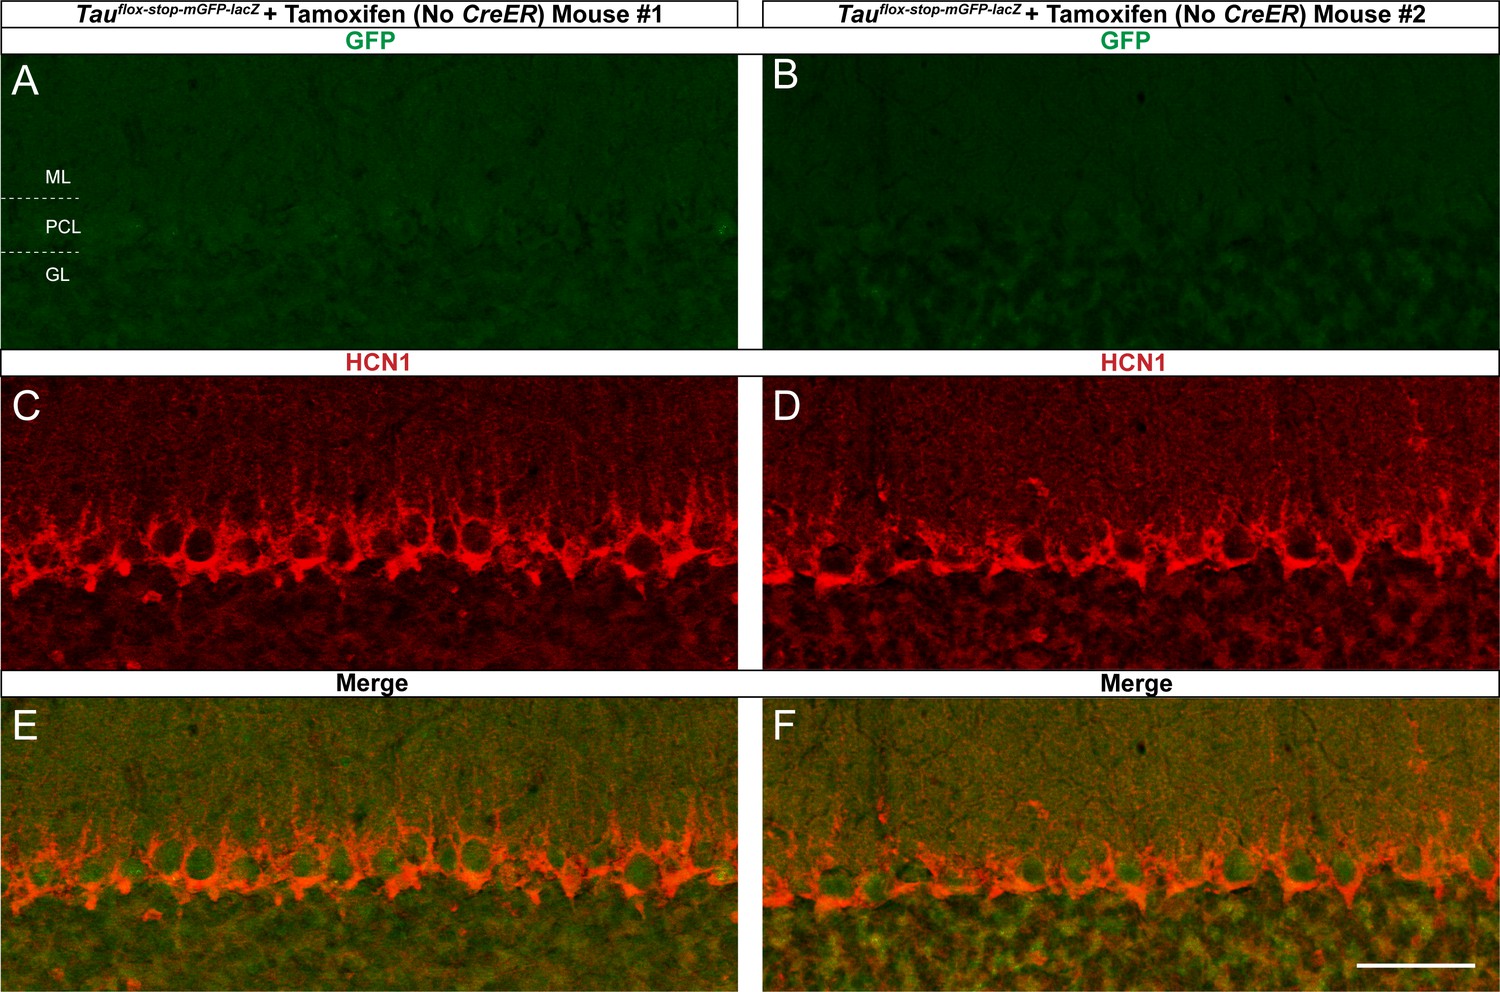
Controls for assessing genetically labeled basket cells.
(A, B) Coronal sections from two different animals that only have the Tauflox-stop-mGFP-lacZ allele and not the Ascl1CreERT2 allele. Staining with an Alexa 488 (green) secondary antibody shows that basket cells and their pinceaux are not genetically labeled with the myristoylated GFP without recombination using Ascl1CreERT2. C and D show HCN1 (red) expression in basket cell pinceaux in the same tissue sections in A and B, respectively. (E, F) Merged Alexa 488 (green) and HCN1 (red) expression from A–D. Scale bar in F is 50 μm (N = 3).
Figure 7
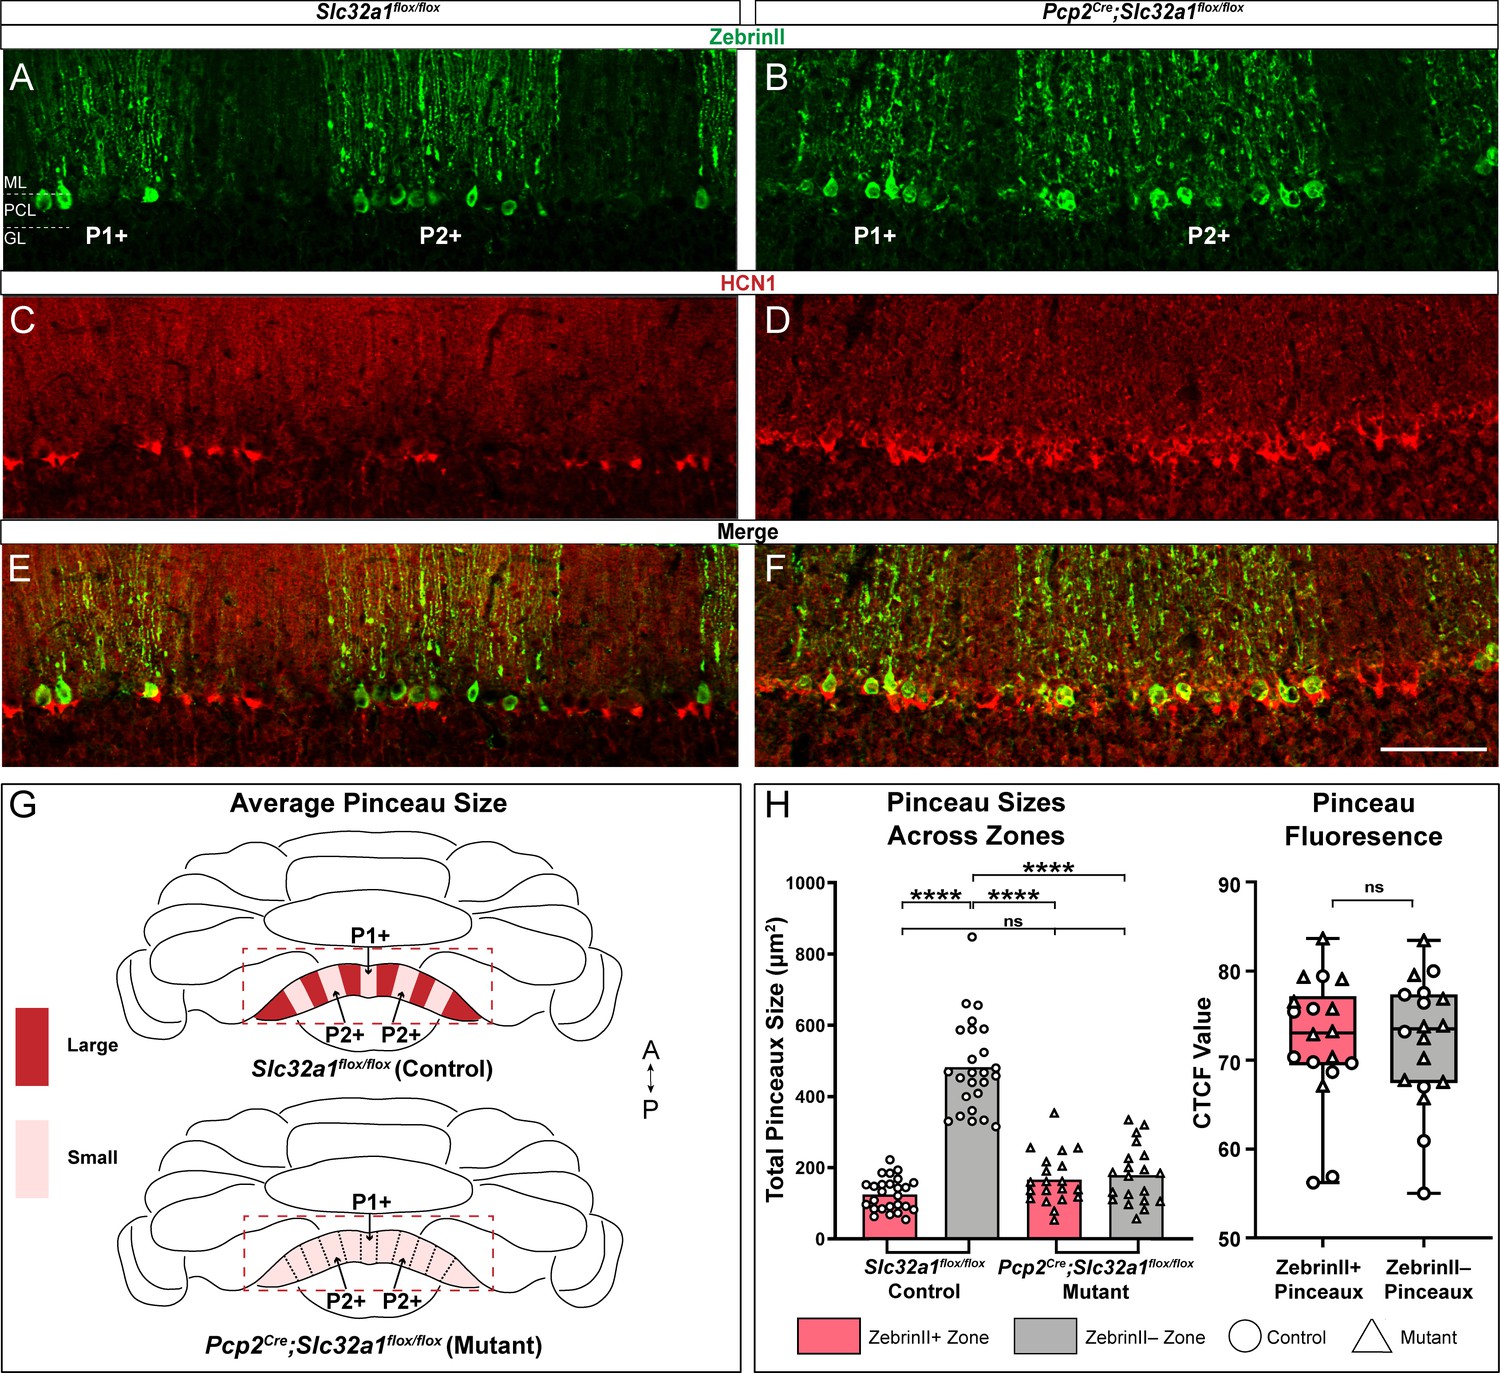
Zonal patterning of basket cell pinceaux is disrupted in Pcp2Cre;Slc32a1flox/flox mutants.
(A, B, C, D) Anatomically matched coronal sections through lobule VIII showing zebrinII (green, PC) and HCN1 (red, pinceau) expression. (A, C) Slc32a1flox/flox (control) data. (B, D) Pcp2Cre;Slc32a1flox/flox (mutant) data, showing altered zonal organization of both Purkinje cells and pinceaux compared to controls. (E, F) merged zebrinII and HCN1 expression in controls and mutants, respectively. Scale bar is 100 μm. (G) Schematic whole-mount cerebellum diagram showing differences in pinceau size organization in Slc32a1flox/flox controls and Pcp2Cre;Slc32a1flox/flox mutants. In controls, pinceau sizes fall into distinct zonal domains, with dark red depicting areas with larger pinceaux and light red depicting those with smaller pinceaux. In the mutants, the zonal size organization is largely eliminated across all regions. (H) Left: Quantification of pinceau area across Purkinje cell zones reveals significantly smaller total pinceau size in zebrinII-positive zones (mean = 124.8 µm², SD = 45.65 µm²) compared to zebrinII-negative zones (mean = 482.6 µm², SD = 128.8 µm²; p<0.0001) in Slc32a1flox/flox controls, but there was no significant difference in pinceau sizes in Pcp2Cre;Slc32a1flox/flox mutants (mean = 166.5 µm², SD = 71.94 µm² for zebrinII-positive zones; mean = 178.7 µm², SD = 81.72 µm² for zebrinII-negative zones; p=0.9719). Additionally, while both mutant zones had significantly smaller pinceaux compared to control zebrinII-negative zones (control zebrinII-negative vs. mutant zebrinII-positive p<0.0001; control zebrinII-negative vs. mutant zebrinII-negative p<0.0001) there was no significant difference in the size of pinceaux between that of the mutant zones and the size of pinceaux in the control zebrinII-positive zones (control zebrinII-positive vs. mutant zebrinII-positive p=0.3883; control zebrinII-positive vs. mutant zebrinII-negative p=0.1755). Each data point indicates the total area of the ROI covered by HCN1-labeled pinceaux within a 100 μm-wide region of a zebrinII-positive or -negative Purkinje cell zone, in µm². For mutant mice, N = 4, n = 8 sections, 20 zebrinII-positive Purkinje cell zones and 20 zebrinII-negative Purkinje cell zones. For controls, N = 6 mice, 12 sections, 26 zebrinII-positive zones and 25 zebrinII-negative zones. Right: Corrected total cell fluorescence (CTCF) analysis reveals no significant difference in HCN1-labeled pinceau fluorescence intensity between pinceaux associated with zebrinII-positive (mean = 72.24, SD = 7.22) and zebrinII-negative (mean = 72.15, SD = 7.2) Purkinje cells, from both control and mutant animals. Each data point represents the CTCF value of a 1 µm² region in a single pinceau (N = 6 control and four mutant mice, n = 18 large and 18 small pinceaux; p>0.05).
-
Figure 7—source data 1
Source data for representative graphs in Figure 7.
- https://cdn.elifesciences.org/articles/55569/elife-55569-fig7-data1-v2.xlsx
Figure 8
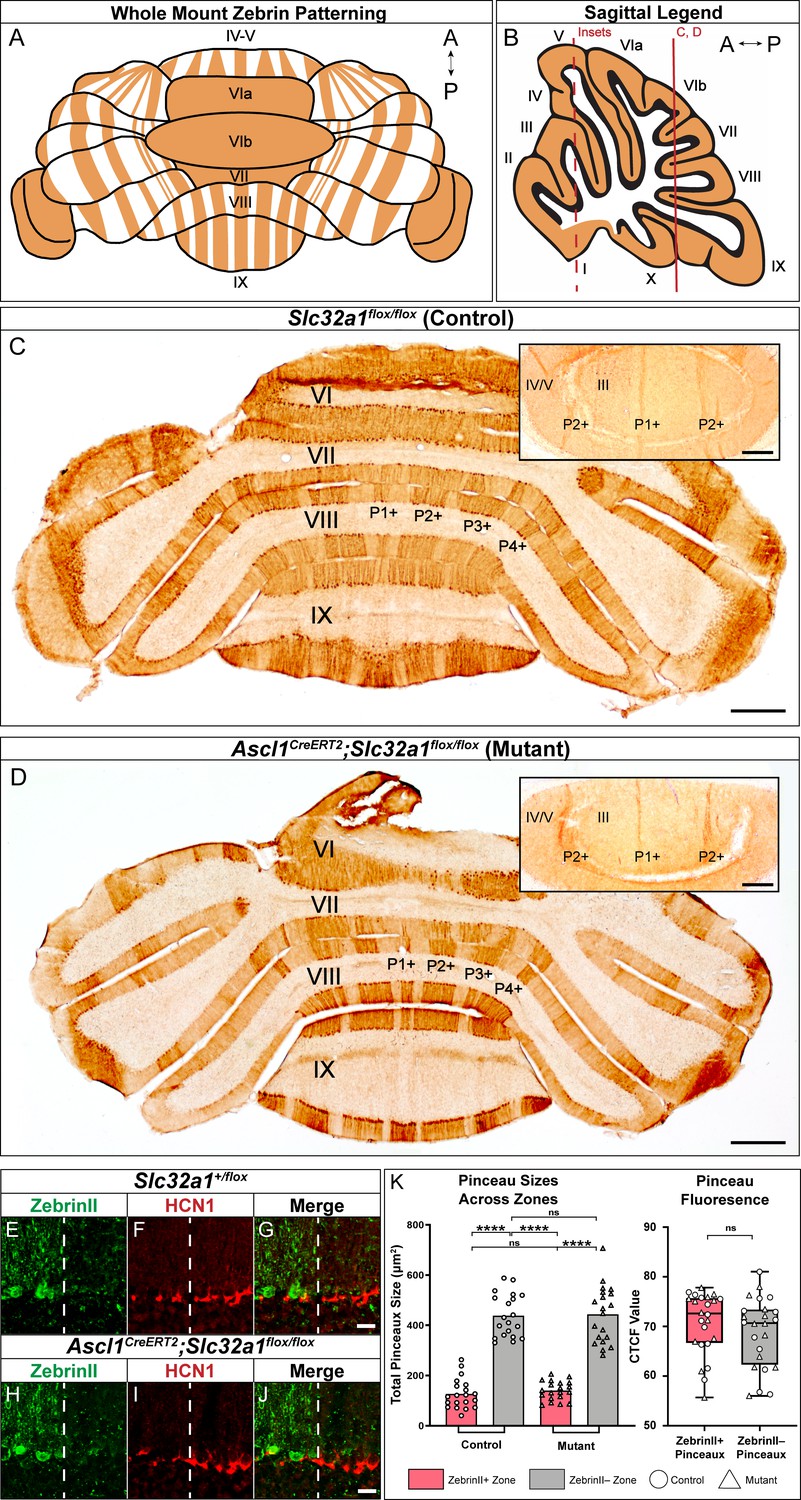
Silencing basket cell GABAergic inhibitory neurotransmission does not affect the zonal patterning of Purkinje cells.
(A) Schematic representation of normal zebrinII patterning across the whole mouse cerebellum, seen in a whole-mount configuration. (B) Sagittal schematic of a mouse cerebellum slice at the midline; the red vertical line indicates the anatomical location of the coronal sections shown in C and D. The red dotted line indicates the location of the cerebellum that the insets were acquired from. (C) Coronal section from a control mouse given tamoxifen at E18.5, stained to reveal normal zebrinII expression patterning (N = 4, scale bar is 500 μm). Because the Ascl1CreERT2 allele was not expressed in this animal, inhibitory neurotransmission of basket cells was not affected. Inset in the top right corner shows a higher power magnification image from lobules III and IV/V in the anterior cerebellum (scale bar is 250 μm), with normal zebrinII zonal patterning for that region of the cerebellum. Coronal-cut tissue section from a mouse expressing both the Ascl1CreERT2 and Slc32a1flox/flox alleles, given tamoxifen at E18.5 to target the silencing of neurotransmission in basket cells. Because both the Ascl1CreERT2 allele and the Slc32a1flox/flox allele, which is used to delete Slc32a1 with spatial and temporal control, were expressed in this animal, cerebellar basket cell neurotransmission was silenced throughout its lifetime. Despite this, staining in the anterior (top right inset), central and posterior lobules reveals that zebrinII patterning is unchanged in the absence of basket cell neurotransmission, as shown in D (N = 4). In lobules III and IV/V of the anterior cerebellum (inset), the ~500 µm distance between the P1+ and P2+ zebrinII zones (Sillitoe and Hawkes, 2002; Sillitoe et al., 2008b) and the sharpness of the zebrinII Purkinje cell zonal boundaries is maintained after GABAergic neurotransmission is genetically blocked at the basket cell terminals (scale bar is 250 µm). (E-G) Example immunohistochemistry for quantification of pinceaux size in a Slc32a1+/flox mouse. Scale = 25 µm. ZebrinII boundary = dotted line. (E) ZebrinII expression in Purkinje cells. (F) HCN1 expression in basket cell pinceaux. (G) ZebrinII and HCN1 merged image. (H-J) Example immunohistochemistry for quantification of pinceau size in an Ascl1CreERT2;Slc32a1flox/flox mouse. Scale = 25 µm. ZebrinII boundary = dotted line. (H) ZebrinII expression in Purkinje cells. (I) HCN1 expression in basket cell pinceaux. (J) ZebrinII and HCN1 merged image. (K) Left: Quantification of pinceau area across Purkinje cell zones reveals significantly smaller total pinceau size in zebrinII-positive zones compared to zebrinII-negative zones in both Slc32a1flox/flox controls (mean = 127.4 µm², SD = 59.25 µm² for zebrinII-positive zones; mean = 439.1 µm², SD = 85.34 µm² for zebrinII-negative zones; p<0.0001) and Ascl1CreERT2;Slc32a1flox/flox mutants (mean = 140.6 µm², SD = 37.73 µm² for zebrinII-positive zones; mean = 443.8 µm², SD = 113.3 µm² for zebrinII-negative zones; p<0.0001). Unlike the effects seen with silenced Purkinje cells as shown in Figure 7, silencing basket cells does not eliminate the size difference between pinceaux in zebrinII-positive and zebrinII-negative regions in the mutants. Each data point indicates the total area of the ROI covered by HCN1-labeled pinceaux within a 100 μm-wide region of a zebrinII-positive or -negative Purkinje cell zone, in µm². For control mice, N = 3, n = 4 sections, 20 zebrinII-positive Purkinje cell zones and 20 zebrinII-negative Purkinje cell zones. For mutants, N = 3 mice, n = 4 sections, 20 zebrinII-positive zones and 20 zebrinII-negative zones. Right: Corrected total cell fluorescence (CTCF) analysis reveals no significant difference in HCN1-labeled pinceau fluorescence intensity between pinceaux associated with zebrinII-positive (mean = 70.76, SD = 6.292) and zebrinII-negative (mean = 68.91, SD = 7.0) Purkinje cells, from both control and mutant animals. Each data point represents the CTCF value of a 1 µm² region in a single pinceau (N = 3 control and three mutant mice, n = 12 large and 12 small pinceaux per genotype; p>0.05).
-
Figure 8—source data 1
Source data for representative graphs in Figure 8.
- https://cdn.elifesciences.org/articles/55569/elife-55569-fig8-data1-v2.xlsx
Additional files
Download links
A two-part list of links to download the article, or parts of the article, in various formats.
Downloads (link to download the article as PDF)
Open citations (links to open the citations from this article in various online reference manager services)
Cite this article (links to download the citations from this article in formats compatible with various reference manager tools)
Purkinje cell neurotransmission patterns cerebellar basket cells into zonal modules defined by distinct pinceau sizes
eLife 9:e55569.
https://doi.org/10.7554/eLife.55569


