Kin discrimination in social yeast is mediated by cell surface receptors of the Flo11 adhesin family
- Department of Genetics, Philipps-Universität Marburg, Germany
- Department of Biosystems Science and Engineering, ETH Zürich, Switzerland
- Department of Biochemistry, Philipps-Universität Marburg, Germany
- Max Planck Institute for Terrestrial Microbiology, Germany
- LOEWE Center for Synthetic Microbiology, Philipps-Universität Marburg, Germany
Figures
Figure 1 with 2 supplements
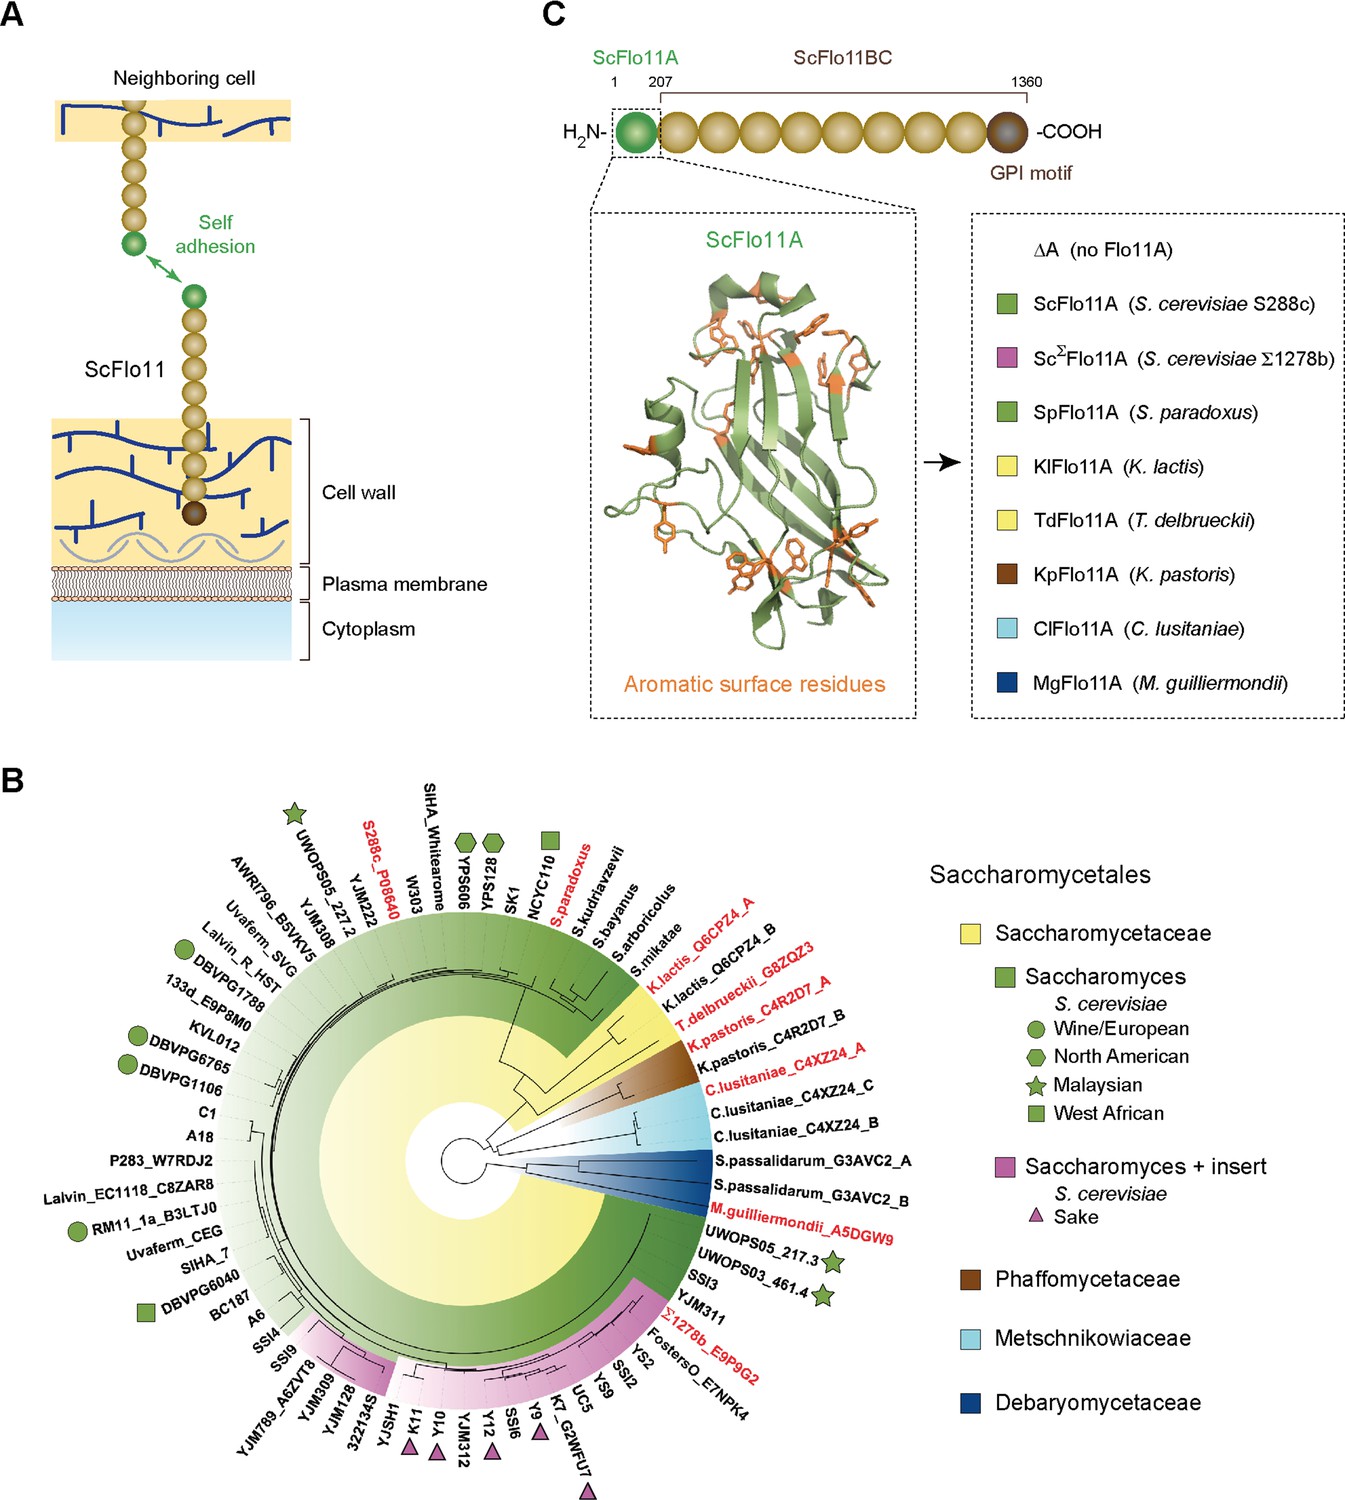
Functional model and phylogeny of fungal Flo11A domains.
(A) Model showing self adhesion of two S. cerevisiae Flo11 molecules (ScFlo11) conferred by homotypic binding of ScFlo11A adhesion domains (green sphere), which are covalently anchored via ScFlo11BC (beige spheres) and a transamidated GPI motif (brown sphere) to the cell wall (Kraushaar et al., 2015). (B) Phylogenetic tree of Flo11A-type domains from different Saccharomycetales species. The tree was created by using the webPRANK alignment server (Löytynoja and Goldman, 2010) and 52 Flo11A sequences from different S. cerevisiae strains together with 16 Flo11A-type sequences from S. paradoxus, S. kudriavzevii, S. bayanus, S. arboricolus, S. mikatae, K. lactis, T. delbrueckii, K. pastoris, C. lusitaniae, S. passalidarum and M. guilliermondii, respectively. Affiliations of Flo11A-type sequences with the families of Saccharomycetaceae, Phaffomycetaceae, Metschnikowiaceae or Debaryomycetaceae are indicated by colors. Absence (green) or presence (magenta) of a small insert of about 15 amino acids in Flo11A sequences from Saccharomyces species is indicated. For Flo11A sequences from S. cerevisiae, names of corresponding strains are indicated followed by the UniProt database identification number, where available. S. cerevisiae strains with clean lineages, which according to whole genome analysis form five well-supported clades (Wine/European; North American; Malaysian; West African; Sake) (Liti et al., 2009), are indicated by different symbols. For all other Flo11A-type sequences, names of corresponding yeast species are shown followed by the UniProt identification number. For Flo11-type proteins carrying multiple Flo11A domains, position of the domain relative to the N-terminus is indicated (A: first; B: second; C: third). Flo11A-type domains functionally characterized in S. cerevisiae in this study are shown in red. (C) Diagram showing the architecture of ScFlo11 (top) together with the structure of the ScFlo11A adhesion domain with the aromatic surface residues (Kraushaar et al., 2015) (left inlet) and seven Flo11A domains from different Saccharomycetales species that were replaced for ScFlo11A (right inlet, colored according to B). Numbers above diagram indicates amino acid residues flanking the A and BC region of ScFlo11. The length of the A region of different species varies between 185 and 240 amino acids (Figure 1—figure supplement 1).
Figure 1—figure supplement 1
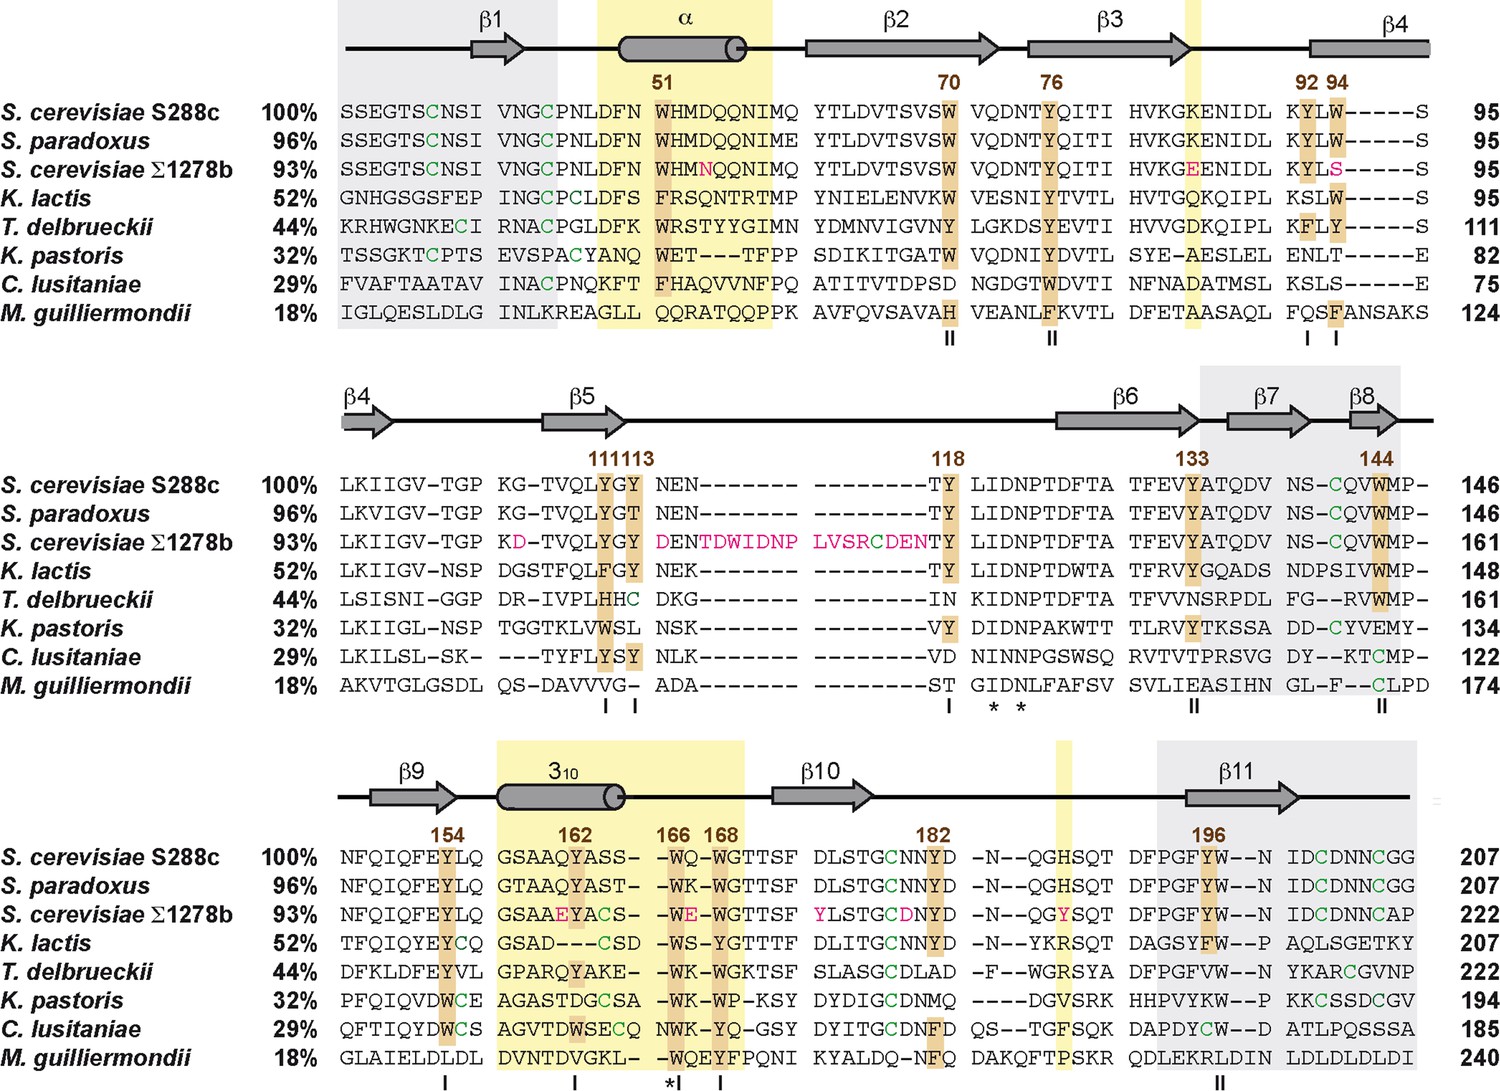
Multiple sequence alignment of Flo11A-type domains from different Saccharomycetales species.
Sequences are described in Supplementary file 1 and were alignment by using the Clustal Omega web tool (McWilliam et al., 2013). Numbers after species names indicate percentage identity to Flo11A from S. cerevisiae strain S288c. Numbers on the right indicate position of residues relative to the translational start site. Secondary structure elements were derived from STRIDE analysis of ScFlo11A (Kraushaar et al., 2015). Relevant aromatic residues are highlighted in brown. Cysteines are shown in green. Residues of Flo11A from S. cerevisiae strain Σ1278b differing from ScFlo11A are shown in magenta. Yellow boxes highlight the apical region (Kraushaar et al., 2015). The Roman numerals indicate residues constituting the aromatic bands I or II. Asterisks mark residues conserved in all sequences.
Figure 1—figure supplement 2

Functional analysis of Flo11A-type domains from different Saccharomycetales species.
Biofilm formation of flo11∆ yeast strain RH2662 expressing Flo11A domains from different yeast species (Supplementary file 3) was measured on agar surfaces after 5 d of growth as previously described (Roberts and Fink, 1994). Images of biofilms were taken before (total) and after (adhesive) washing away non-adhesive cells from the agar surface.
Figure 2 with 4 supplements
Quantification of Flo11-mediated cell adhesion forces.
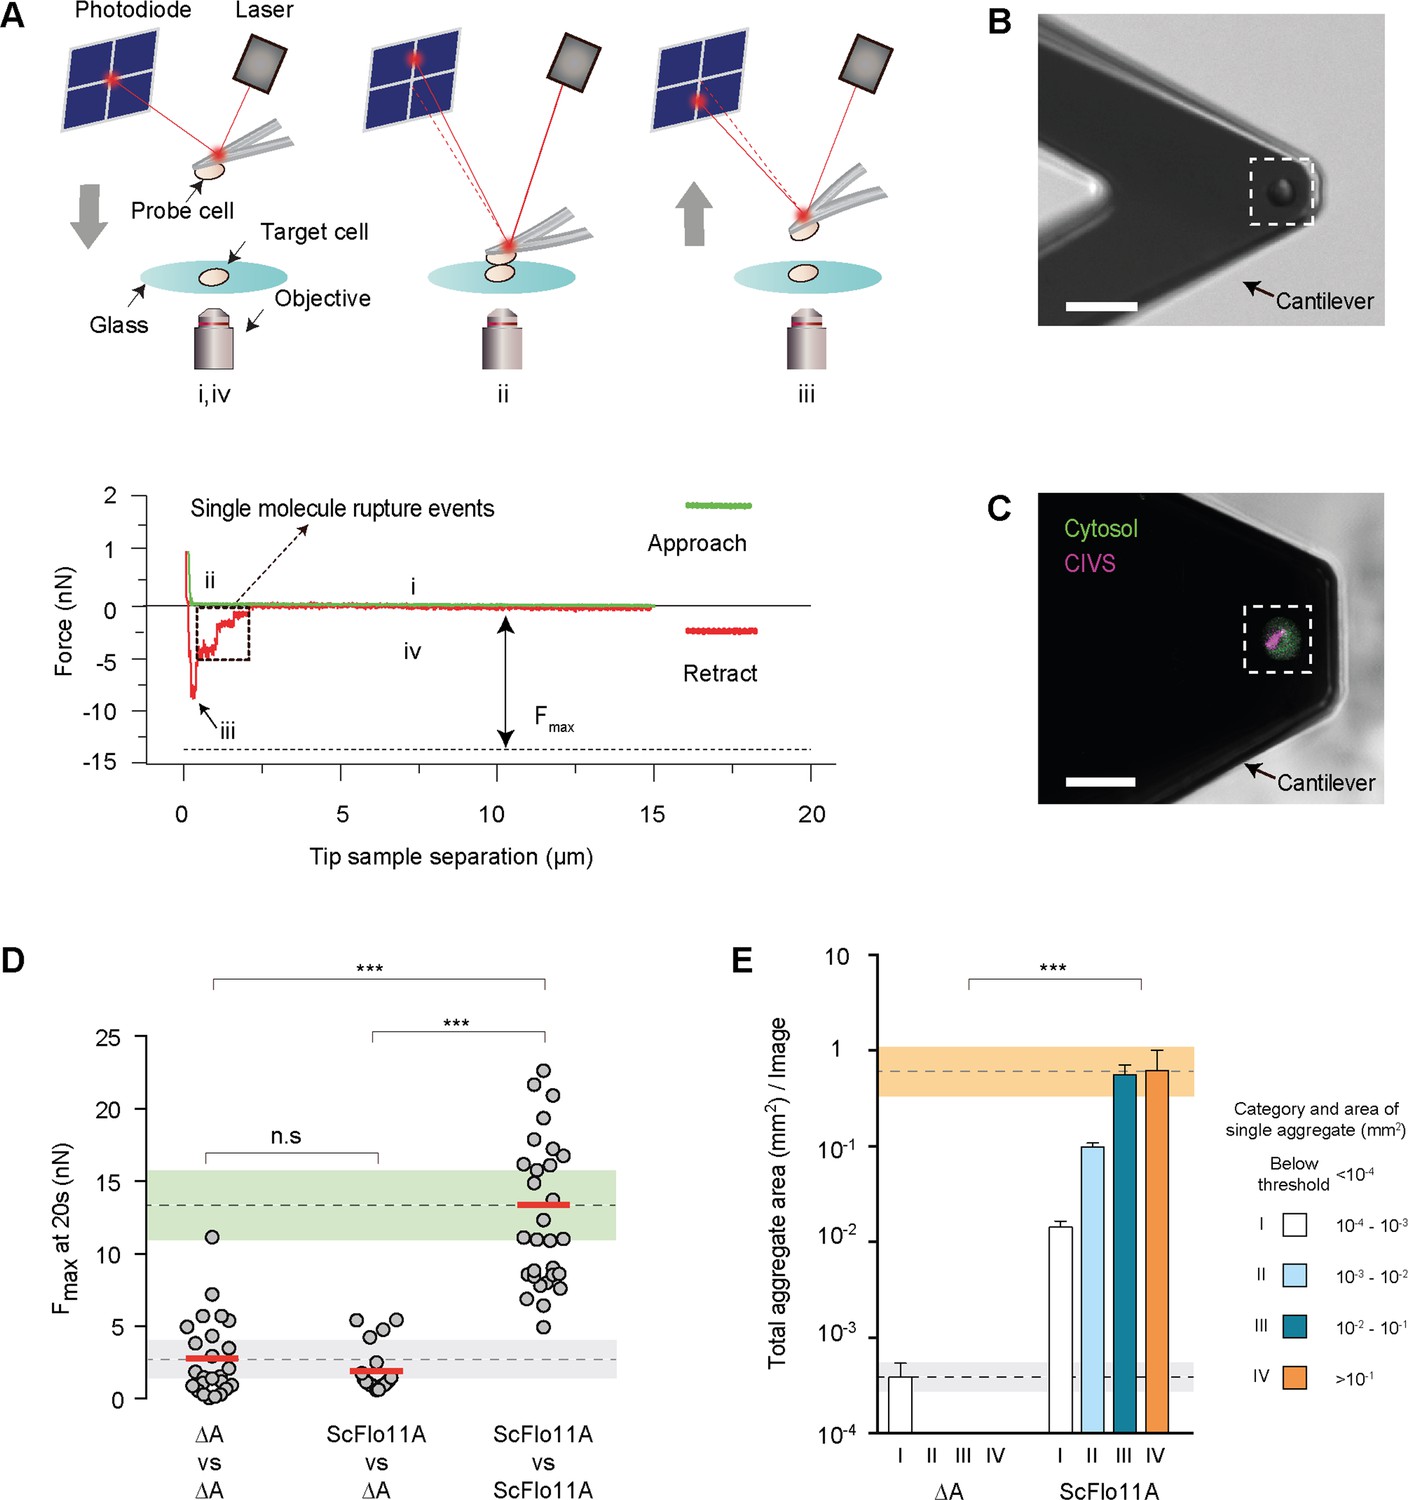
(A) Outline of a single-cell force spectroscopy (SCFS) experiment (upper scheme). (i) The probe cell is immobilized on an AFM cantilever and brought into contact at a defined speed with a target cell adhering to a glass substrate until a preset contact force is reached. After a defined contact time (ii), the cantilever is retracted until the probe cell is fully separated from the target cell (iii and iv). During approach and retraction, the cantilever deflection and thus, the force acting on the probe cell, is detected by using a laser and a photodiode and is recorded in a force-distance curve (lower scheme) that allows calculation of the maximum adhesion force (Fmax). (B) Single yeast probe cells immobilized on an AFM cantilever. The image was obtained by differential interference contrast imaging. Scale bar corresponds to 15 µm. (C) Confocal laser scan microscopy after staining with FUN-1 dye. Fungal cells internalize FUN-1 and the dye is seen as diffuse green cytosolic fluorescence. FUN-1 is then transported to the vacuole in metabolically active cells and subsequently compacted into fluorescent, red cylindrical intravacuolar structures (CIVS), here pseudo-colored in purple to indicate healthy cells (Millard et al., 1997). Scale bar corresponds to 15 µm (D) Adhesion forces mediated by ScFlo11A at single cell level were determined for homotypic or heterotypic interaction of yeast cells presenting no Flo11A (ΔA) or ScFlo11A by SCFS (Figure 2—source data 1). Average FMax values measured after 20 s of contact time are shown as red bars and were calculated from at least 15 independent individual measurements (grey dots). The average adhesion forces mediated by cells lacking ScFlo11A or with ScFlo11A are shown by dotted lines, and corresponding SD areas are shown by grey and green bands. (E) Cell-cell aggregation strength mediated by ScFlo11A in homogeneous populations was determined using yeast strains presenting no Flo11A (ΔA) or ScFlo11A by QCAM (Figure 2—figure supplement 4). Total area covered (mm2) by all cell aggregates of a given size category (I - IV) per image area (1 cm2) is shown as a quantitative measure for cell-cell aggregation. Error bars indicate standard deviation obtained by at least three independent measurements. The average total aggregate areas obtained with cells lacking Flo11A or with regular ScFlo11A are shown by dotted lines, and corresponding SD areas are shown by grey and orange bands. Significance was calculated applying an unpaired t-test (D) or a Wilcoxon rank sum test (E) with p>0.05 (n.s), 0.05 ≥ P > 0.01 (*), 0.01 ≥ P > 0.001 (**), p≤0.001 (***).
-
Figure 2—source data 1
Single cell-cell adhesion forces determined by SCFS and presented in Figure 2.
- https://cdn.elifesciences.org/articles/55587/elife-55587-fig2-data1-v2.xlsx
Figure 2—figure supplement 1
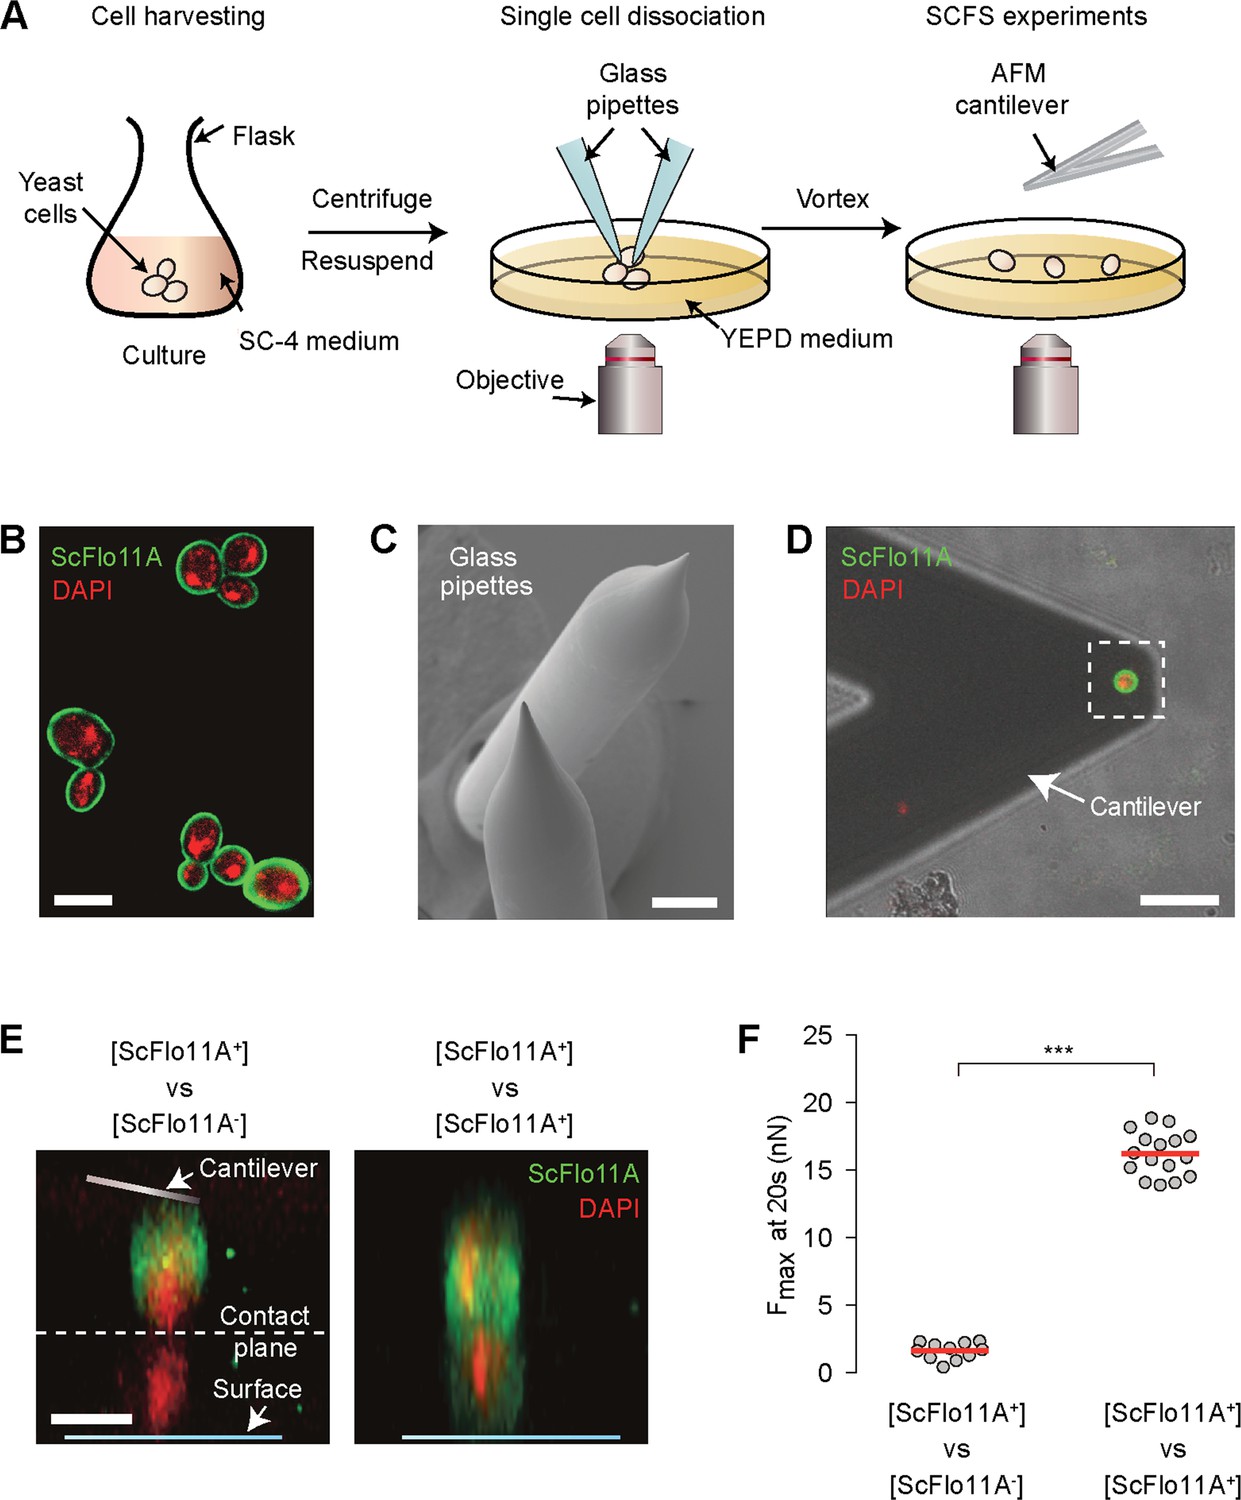
Preparation of single yeast cells suitable for SCFS analysis.
(A) Outline of the single-cell force spectroscopy (SCFS) experiment. Yeast cells were grown and harvested in SC-4 medium and collected to be centrifuged and resuspended in YEPD medium. Resuspended cells were then plated, dissociated and vortexed and replated on a new dish for SCFS. (B) Confocal laser scanning microscopy after staining the ScFlo11A domain with fluorescently-labelled antibodies (green) and yeast nuclei with DAPI (red) from harvested cells after growing in SC-4 media. Scale bar, 5 µm. (C) SEM of pipettes used to separate cells. (D) Example of an isolated cell attached to an AFM cantilever for adhesion studies. The ScFlo11A domain was stained with fluorescently-labelled antibodies (green) and yeast nuclei with DAPI (red) to monitor surface expression of adhesins. Scale bar, 15 µm. (E–F) Correlation between cell surface presence of ScFlo11A and magnitude of cell-cell adhesion forces. Amount and localization of ScFlo11A on probe and target cells was visualized by staining ScFlo11A (green) and nuclei (red) followed by confocal laser scan microscopy. Scale bar, 5 µm. Cells used for SCFS analysis were stained after determination of adhesion forces and imaged mounted on the AFM cantilever (probe cell) or a glass surface (target cell). Z-stacks of images recorded at 0.4 µm distance are shown for a ScFlo11A-presenting probe cell in contact with a non-presenting target cell (ScFlo11A+ vs ScFlo11A-) and for a ScFlo11A-presenting probe and target cell configuration (ScFlo11A+ vs ScFlo11A+). Average maximum adhesion forces (Fmax) were obtained after 20 s by contact time of ScFlo11A-presenting probe cells with non-presenting target cells (Figure 2—source data 1). Forces of individual cell-cell pairs were measured by SCFS (dots) and average values calculated (red line).
Figure 2—figure supplement 2
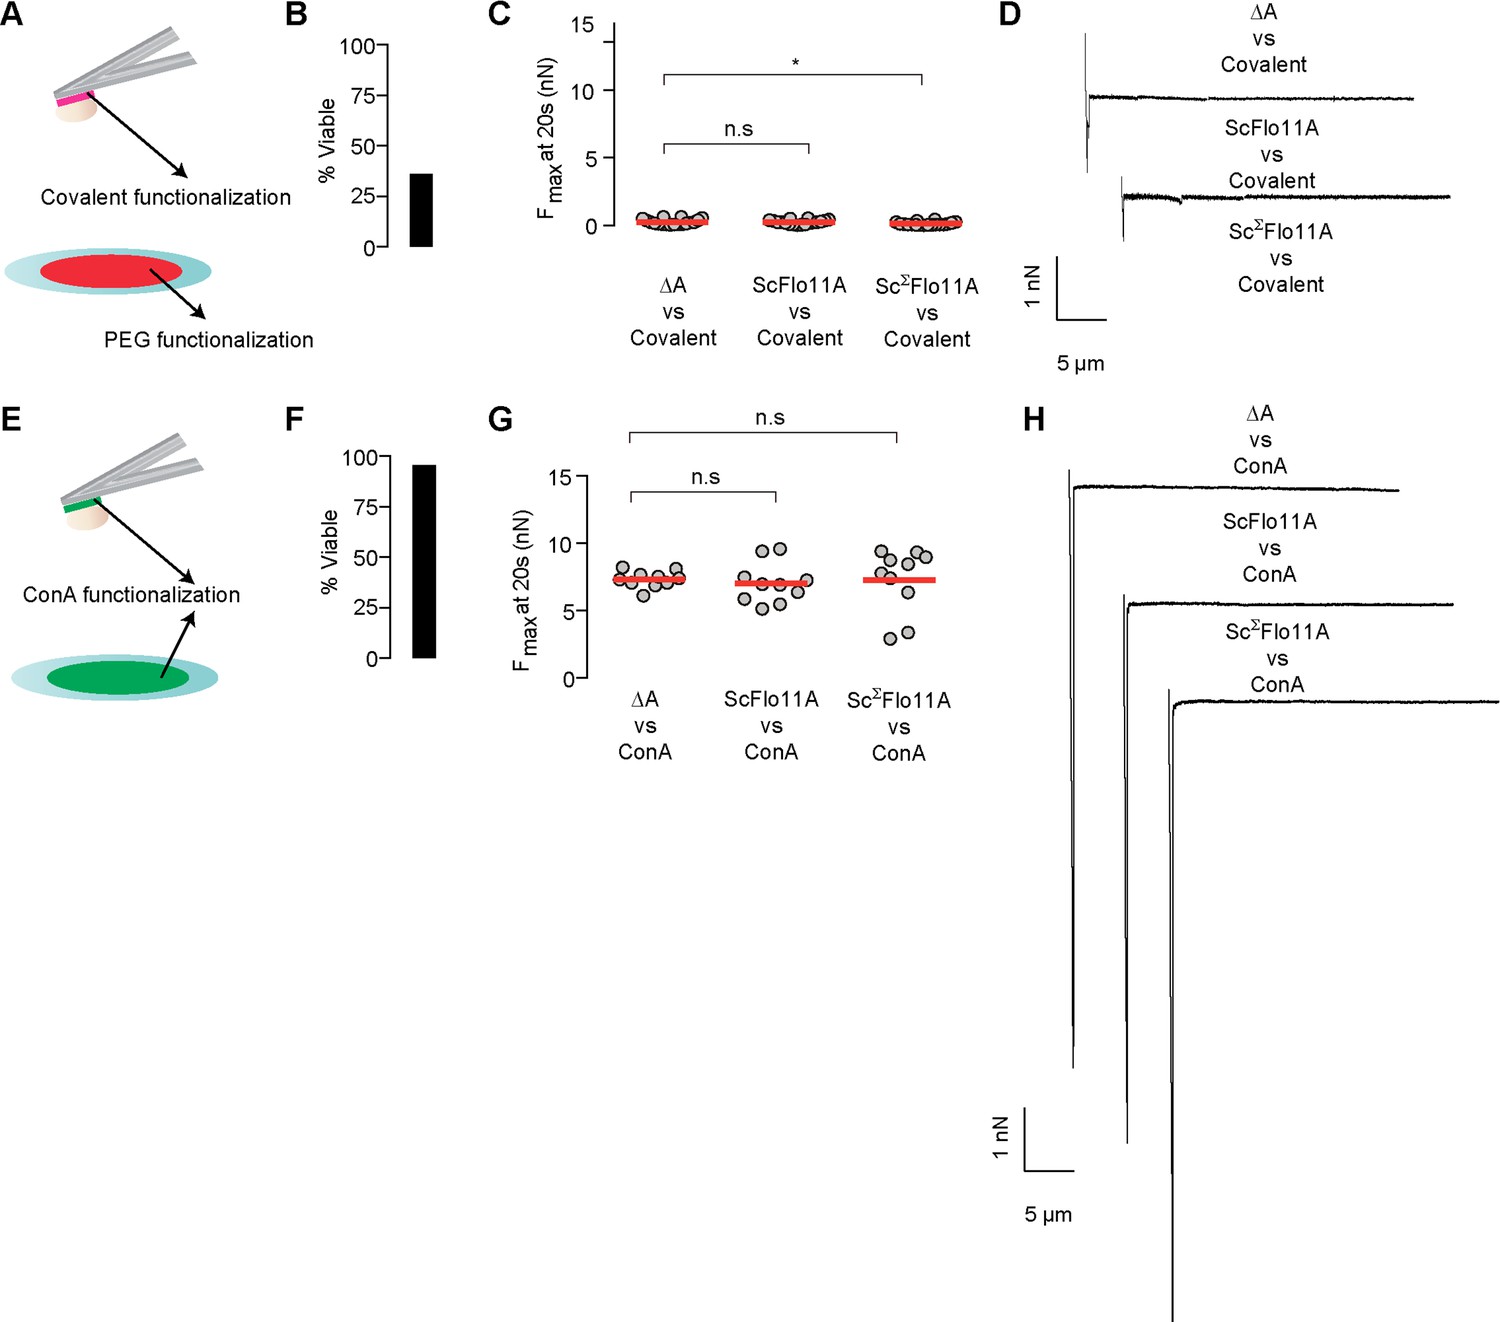
Controls for cell adhesion on cantilever.
(A) Cells were tested for adhesion experiments by functionalizing them to the cantilever using covalent chemistry and measured against a PEG-passivated surface. (B) Cell viability of covalently attached cells on cantilever was only 35% according to FUN1 staining. (C) Viable cells were selected and measured on PEG coated glass surfaces and showed almost no adhesion (Figure 2—source data 1). (D) Selected adhesion curves from the three different Flo11A constructs from experiment described in panel C). (E) Cells were tested for adhesion experiments by attaching them to a cantilever which were passively coated with ConA and measured against a PEG-passivated surface. (F) Cell viability of ConA attached cells on cantilever was 95% according to FUN1 staining. (G) Viable cells were selected and measured on ConA coated glass surfaces and showed almost similar adhesive values for all Flo11A variants (Figure 2—source data 1). (H) Selected adhesion curves from the three different Flo11A constructs described in panel G).
Figure 2—figure supplement 3

Time course of average force values obtained by single-cell force spectroscopy (SCFS).
(A–F), Shown are average maximum adhesion forces obtained by SCFS using yeast cells expressing different Flo11A domains in homotypic or heterotypic configurations as indicated. Average maximum adhesion force values of force time traces were measured at time intervals of 0.5, 1, 5, 10, 20 s. Individual measurements can be found in Figure 2—source data 1, Figure 3—source data 1, Figure 4—source data 1 and Figure 4—source data 1.
Figure 2—figure supplement 4
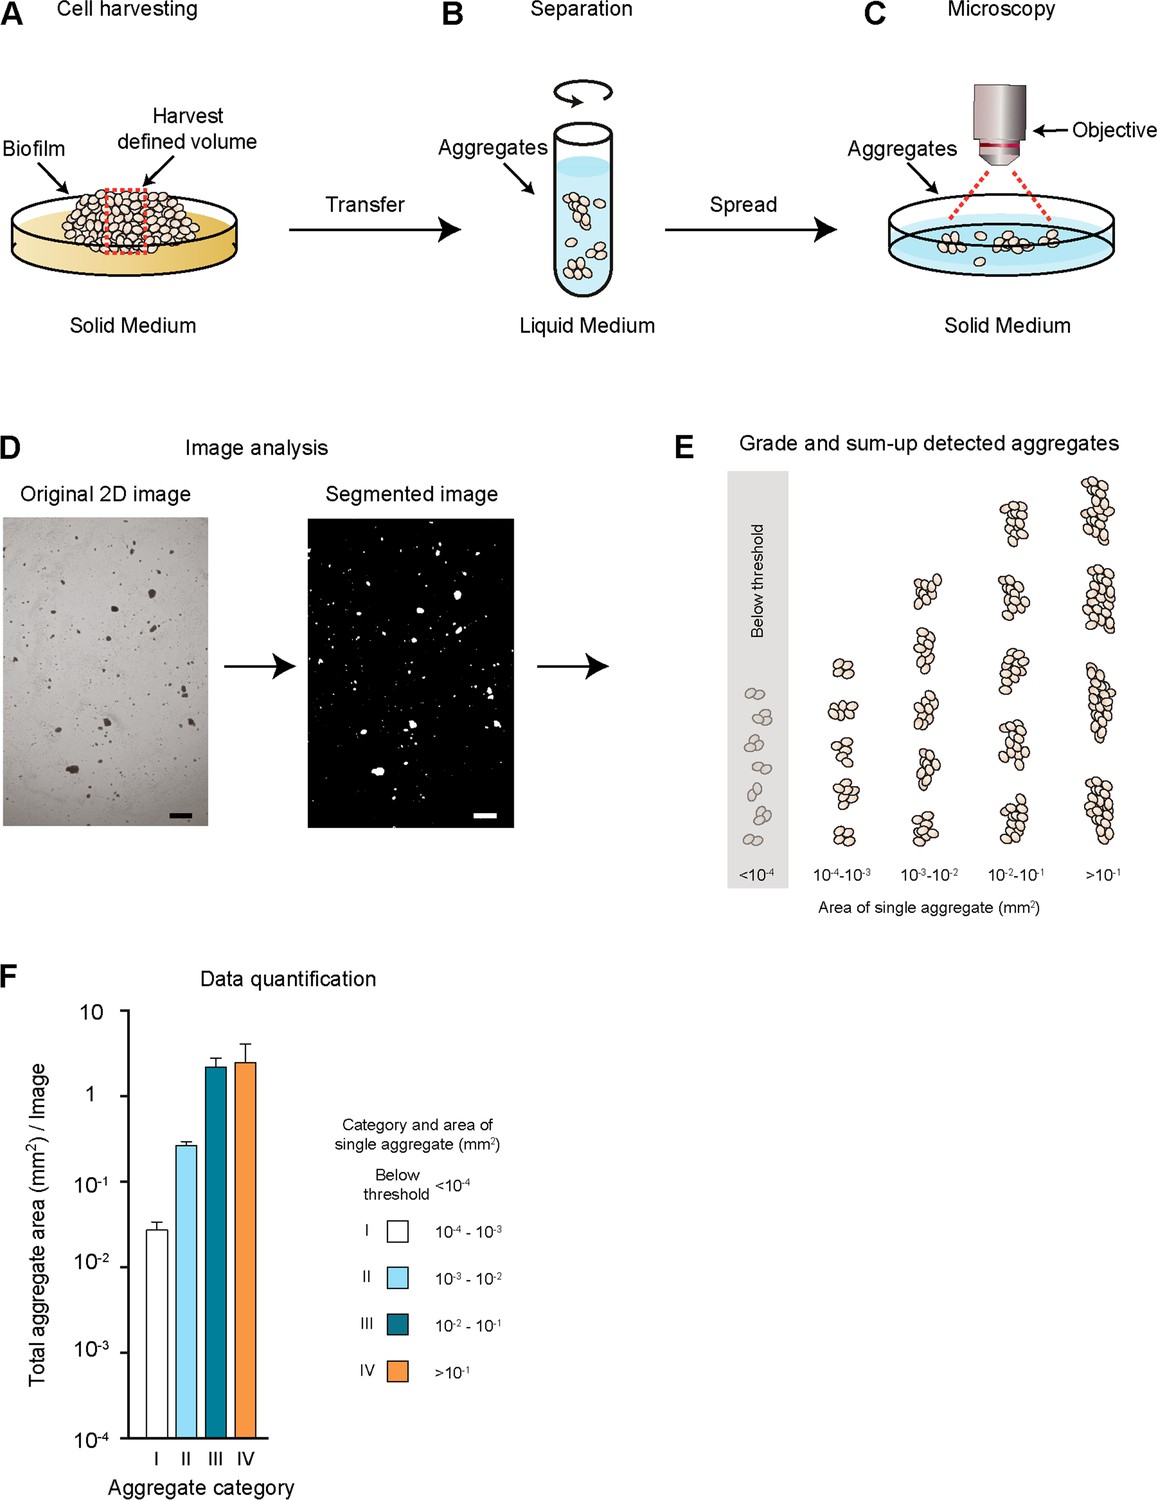
Quantitative cell aggregation microscopy (QCAM).
To obtain a quantitative measure for cell-cell aggregation, the QCAM method was developed as described in the Materials and Methods section. (A) Cells are grown on a solid agar surface to build a biofilm, before a defined volume of cells is harvested and transferred to a defined volume of liquid medium. (B,C) Cell aggregates are subsequently separated by vortexing, and a defined volume is spread on solid medium for microscopy. (D) Microscopic 2D images of a defined area are further analyzed by automated cell aggregate size analysis. Scale bar, 1 mm. (E,F) Data obtained from the image analysis is further sorted and quantified by determination of the total area covered by cell aggregates (in units of mm2) of a given size category (I - IV) in relation to the total image area (1 cm2). Aggregates with a size smaller than 10−4 mm2 are below the threshold for detection.
Figure 3 with 1 supplement
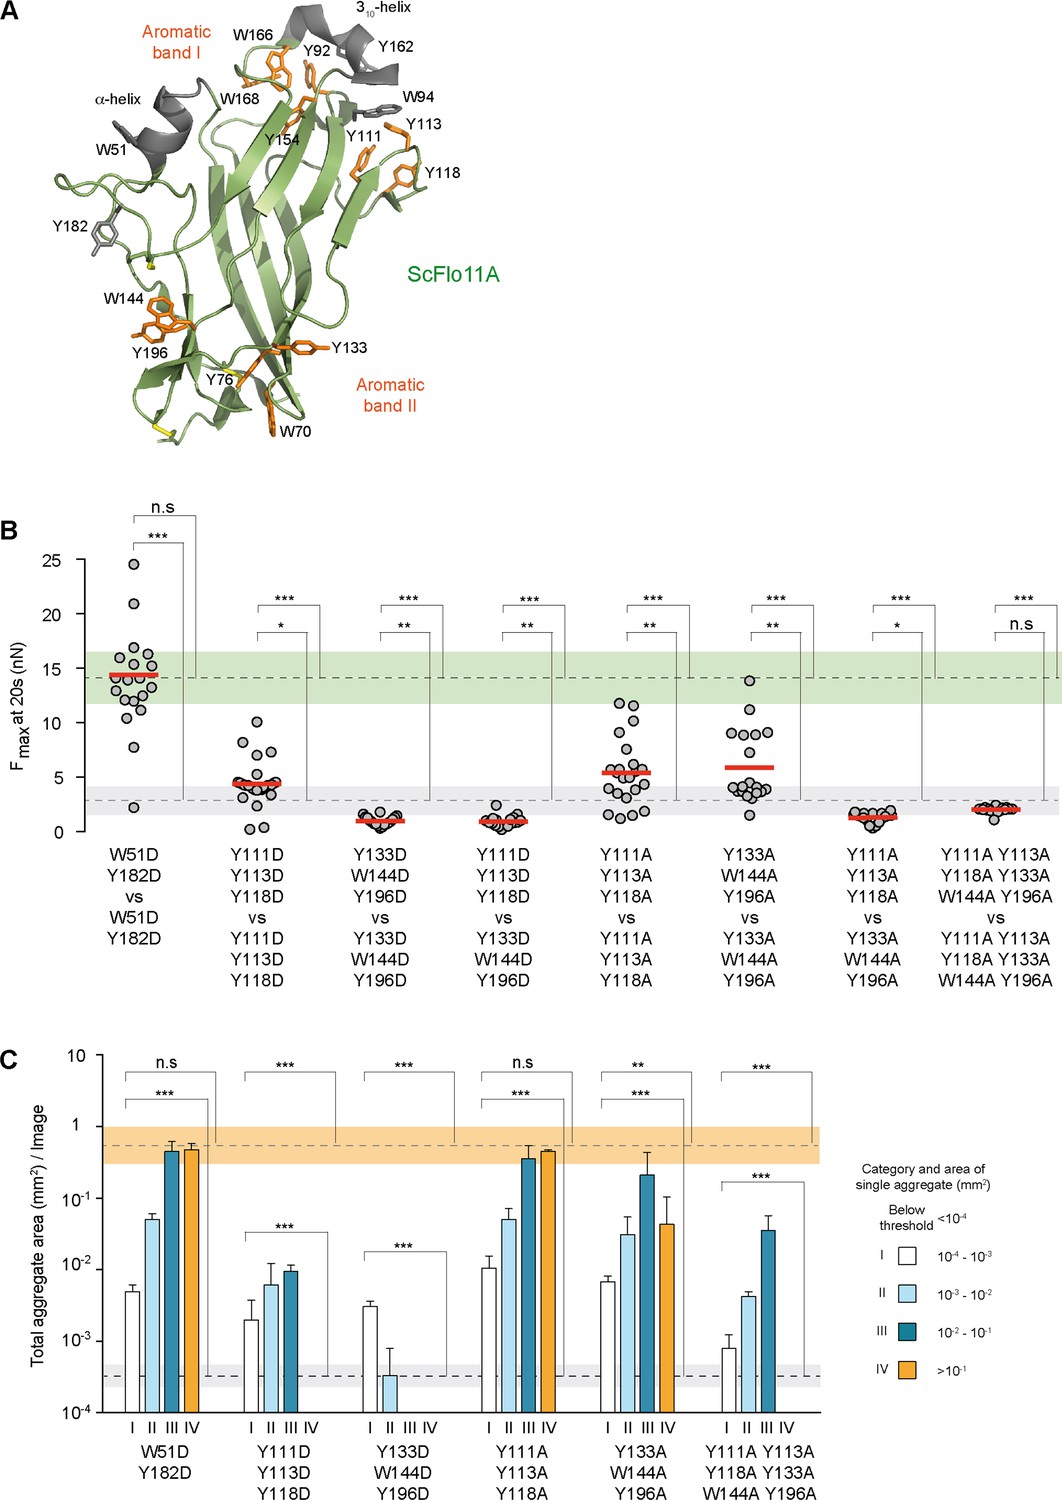
Functional mapping of the Flo11A protein surface at single cell and population level.
(A) Structural model of ScFlo11A (PDB code 4UYR). Functionally relevant aromatic surface residues of aromatic bands I and II are depicted in orange (as shown in Figure 3—figure supplement 1). Surface exposed aromatic residues and helices not required for cell-cell adhesion, are shown in grey. Disulfide bonds are shown in yellow. (B) Adhesion forces mediated by ScFlo11A mutants at single cell level were determined by SCFS (Figure 3—source data 1) as described in Figure 2D. Mutations of ScFlo11A are indicated. The average adhesion forces and SD areas mediated by cells with regular ScFlo11A or lacking ScFlo11A are indicated as green or grey bands. (C) Cell-cell aggregation strength mediated by ScFlo11A mutants in homogeneous populations was determined by QCAM as described in Figure 2E. Mutations of ScFlo11A are indicated and correspond to mutations measured by SCFS in b. The average total aggregate areas obtained by cells with regular ScFlo11A or lacking ScFlo11A are indicated as orange or grey bands. Significance was calculated as described in Figure 2.
-
Figure 3—source data 1
Single cell-cell adhesion forces determined by SCFS and presented in Figure 3.
- https://cdn.elifesciences.org/articles/55587/elife-55587-fig3-data1-v2.xlsx
Figure 3—figure supplement 1
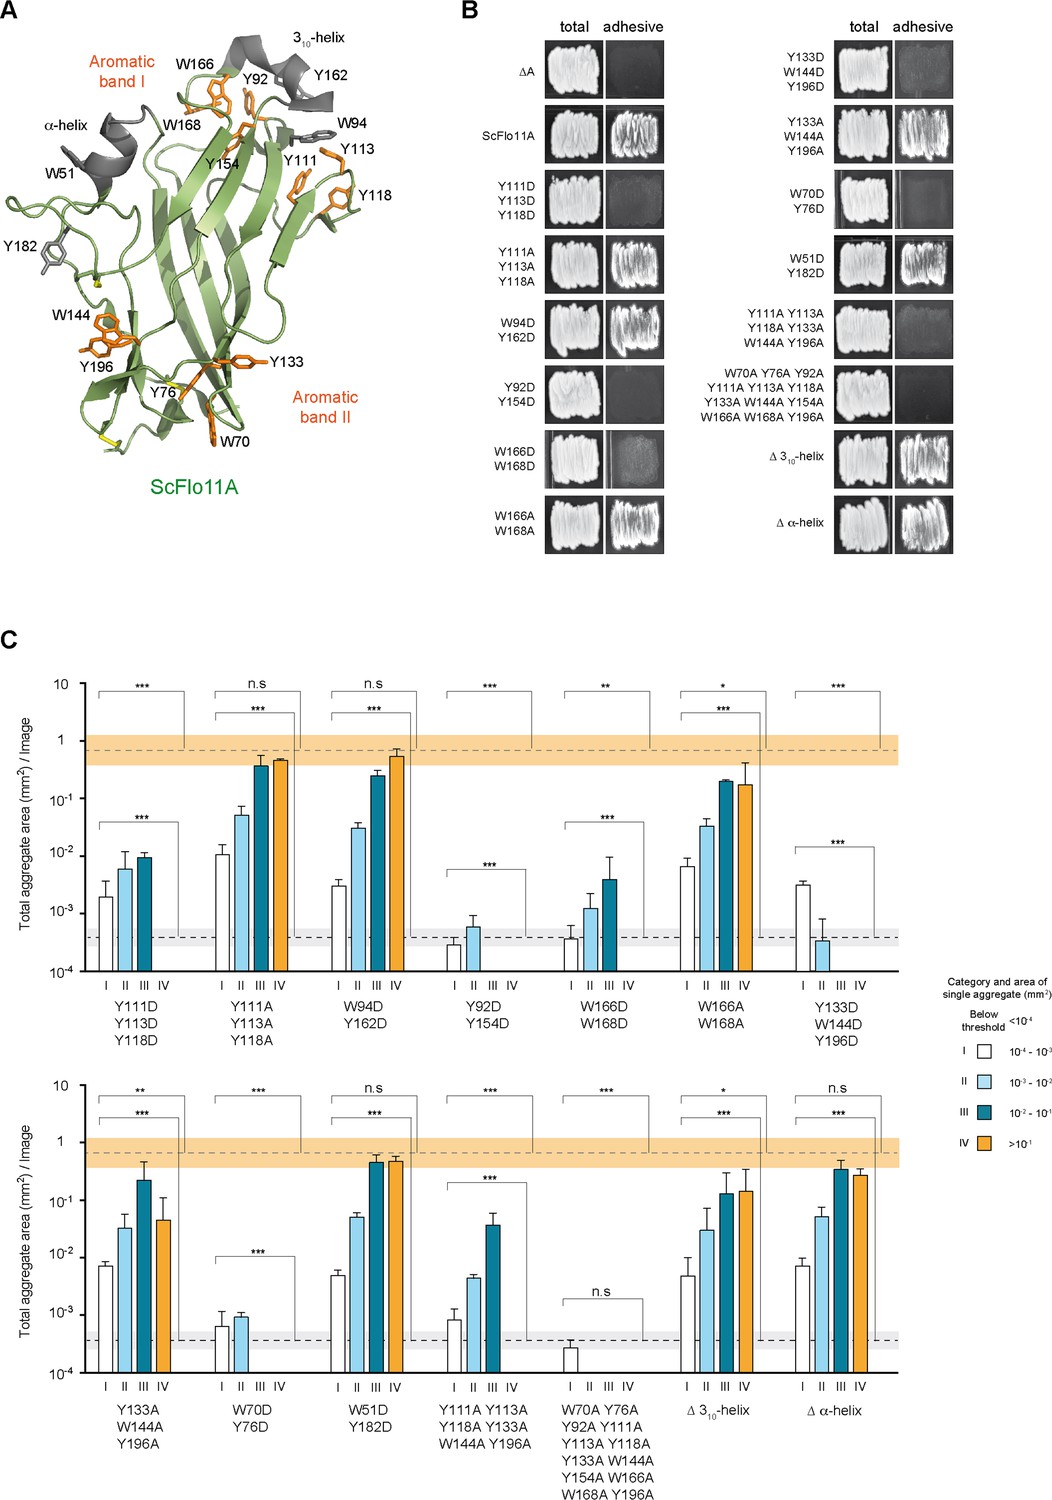
Structure-based functional analysis of ScFlo11A.
(A) Structural model of Flo11A from S. cerevisiae strain S288c (PDB code 4UYR). Functionally relevant aromatic surface residues of bands I and II are shown in orange. Surface-exposed aromatic residues and helices not required for biofilm formation or cell-cell, aggregation, respectively, are shown in grey. (B) Biofilm formation of yeast strains expressing no Flo11A (∆A) or different ScFlo11A variants was determined on agar surfaces by a wash test. (C) Cell-cell aggregation mediated by different ScFlo11A variants was quantified using QCAM analysis.
Figure 4 with 4 supplements
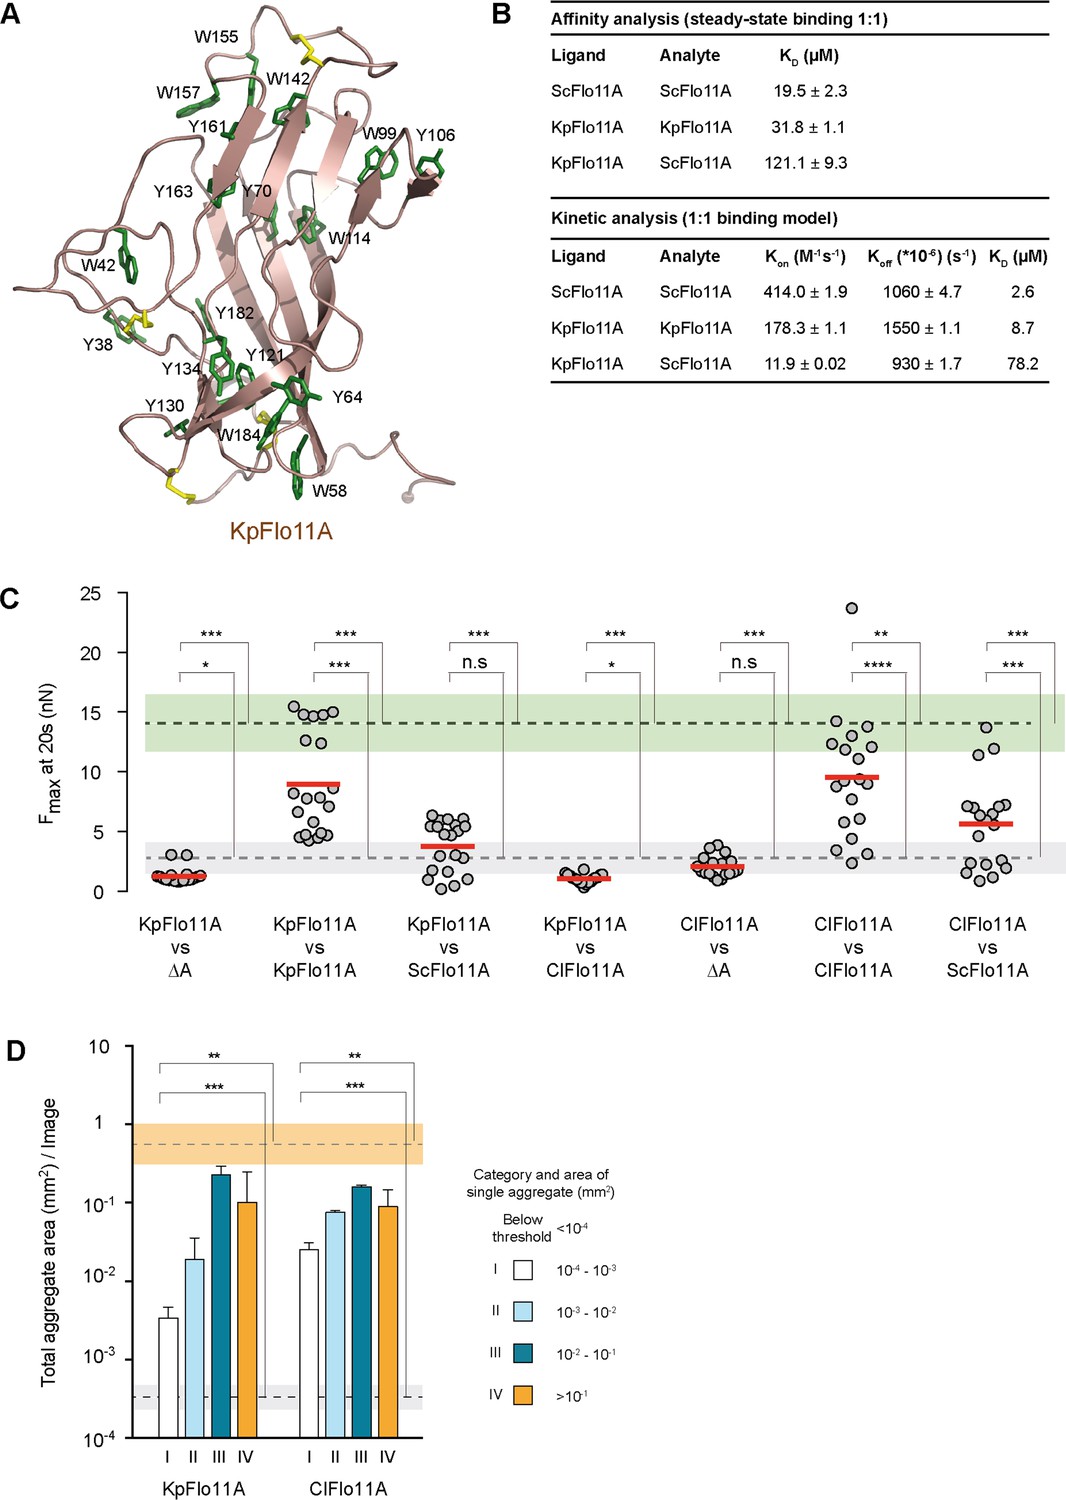
Structural and functional properties of Flo11A from Komagataella pastoris at single cell and population level.
(A) Crystal structure of KpFlo11A at 1.40 Å resolution (PDB code 5FV5). The structural model shows solvent-exposed aromatic residues (Tyr, Trp) in green. Disulfide bonds are shown in yellow. (B) Results and statistics derived from SPR analysis (Figure 4—figure supplement 4) for ScFlo11A-ScFlo11A, KpFlo11A-KpFlo11A and KpFlo11A-ScFlo11A interactions, respectively. Calculations for affinity and kinetic analysis are based on experiments carried out at least in duplicate. The KD value for ScFlo11A in the affinity analysis was previously reported (Kraushaar et al., 2015). (C) SCFS analysis for measuring adhesion forces mediated by homo- or heterotypic interactions of KpFlo11A, ScFlo11A and ClFlo11A (Figure 4—source data 1), respectively, was performed as described in Figure 2D. (D) QCAM analysis for measurement of cell-cell aggregation strength mediated by KpFlo11A and ClFlo11A, respectively, was performed as described in Figure 2E. The average total aggregate areas obtained by cells with regular ScFlo11A or lacking ScFlo11A are indicated as orange or grey bands. Significance was calculated as described in Figure 2.
-
Figure 4—source data 1
Single cell-cell adhesion forces determined by SCFS and presented in Figure 4.
- https://cdn.elifesciences.org/articles/55587/elife-55587-fig4-data1-v2.xlsx
Figure 4—figure supplement 1
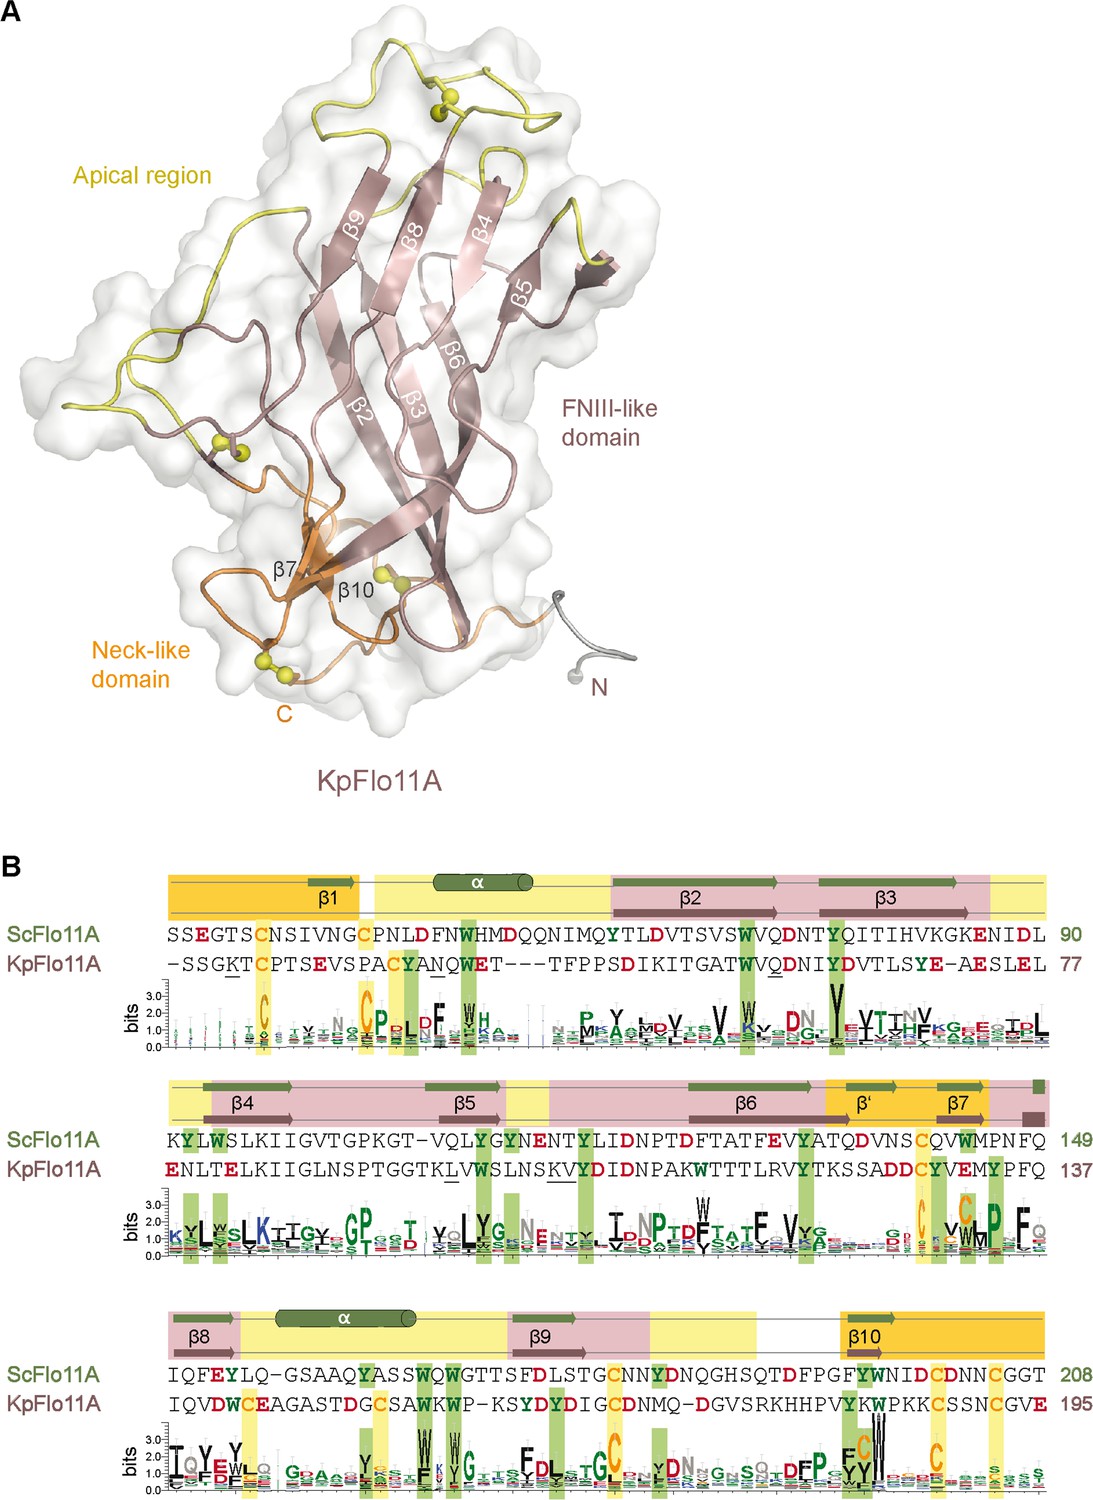
Overall structure of the KpFlo11A domain from Komagataella pastoris.
(A) Crystal structure of KpFlo11A with one molecule per asymmetric unit (asu). The fibronectin type III domain is shown in brown, the neck subdomain in orange and the apical region in yellow (PDB entry 5FV5). (B) Sequence alignment of ScFlo11A and KpFlo11A using Clustal Omega (McWilliam et al., 2013). Tryptophans and tyrosines are highlighted in green, glutamates and aspartates in red. Disulfide bridge forming cysteines are shown in orange and highlighted in yellow. The WebLogo below shows the distribution of amino acids within the INTERPRO family of Flo11A-type domains (IPR018789) using 55 non-redundant sequences. The height corresponds to the position-specific prevalence.
Figure 4—figure supplement 2
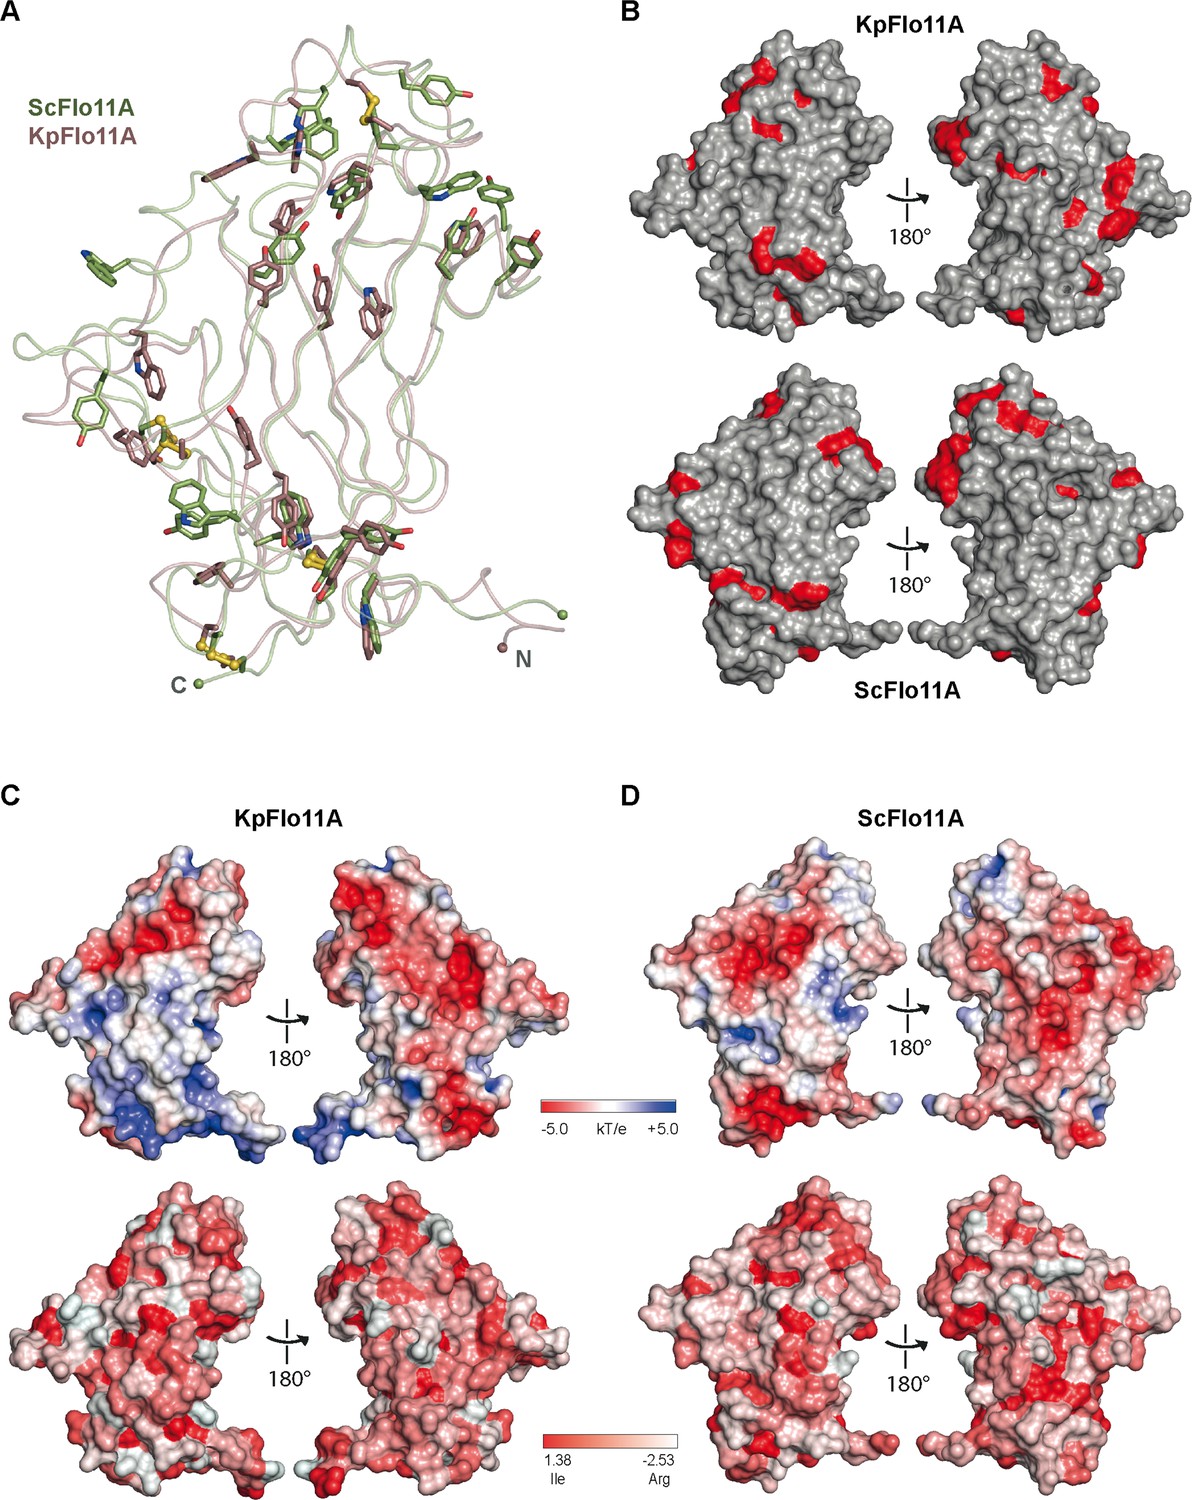
Structural comparison between ScFlo11A and KpFlo11A.
(A) Structural superposition between ScFlo11A (green) and KpFlo11A (brown). The root-mean-square deviation is 1.048 Å for 685 Cα atoms. Tyr and Trp residues are highlighted as sticks. Disulfide bonds are shown in yellow. Superposition was done with PyMOL (Delano, 2002). (B) Comparison of surface exposed Tyr and Trp residues (red) between KpFlo11A and ScFlo11A. (C,D) Comparison of KpFlo11A and ScFlo11A surface characteristics. Electrostatic surface potentials (top) were calculated by APBS (Baker et al., 2001) and illustrate the overall acidic characteristics of the surfaces. Analysis of hydrophobicity (bottom) is based on the hydrophobicity scale as defined by Eisenberg (Eisenberg et al., 1984).
Figure 4—figure supplement 3
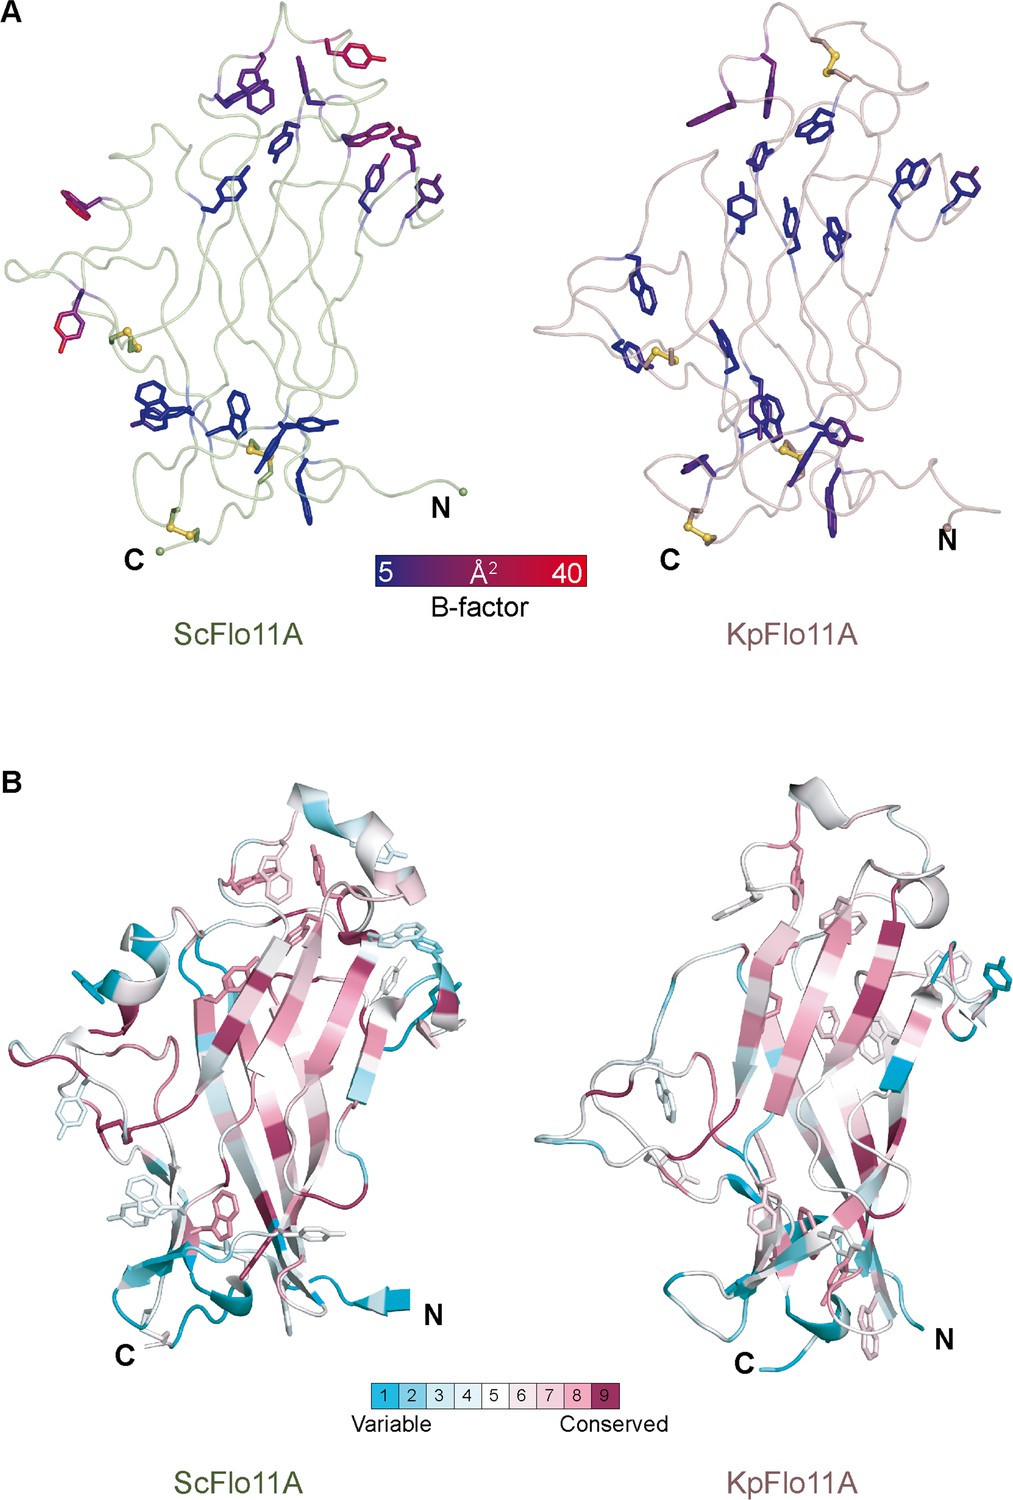
Rigidity of aromatic surface patches in ScFlo11A and KpFlo11A and overall conservation.
(A) The crystal structures of ScFlo11A and KpFlo11A with highlighted Tyr and Trp residues colored by temperature factors (B-factors). High flexibility is indicated by red and low flexibility by blue color. Disulfide bonds are shown in yellow. (B) Analysis of residues conserved between ScFlo11A and KpFlo11A using the ConSurf server (Celniker et al., 2013) based on a multiple sequence alignment (Kraushaar et al., 2015). The calculation method for the rate of evolution at each site in the multiple sequence alignment was the Bayesian method and the Evolutionary substitution model the default setting JTT.
Figure 4—figure supplement 4
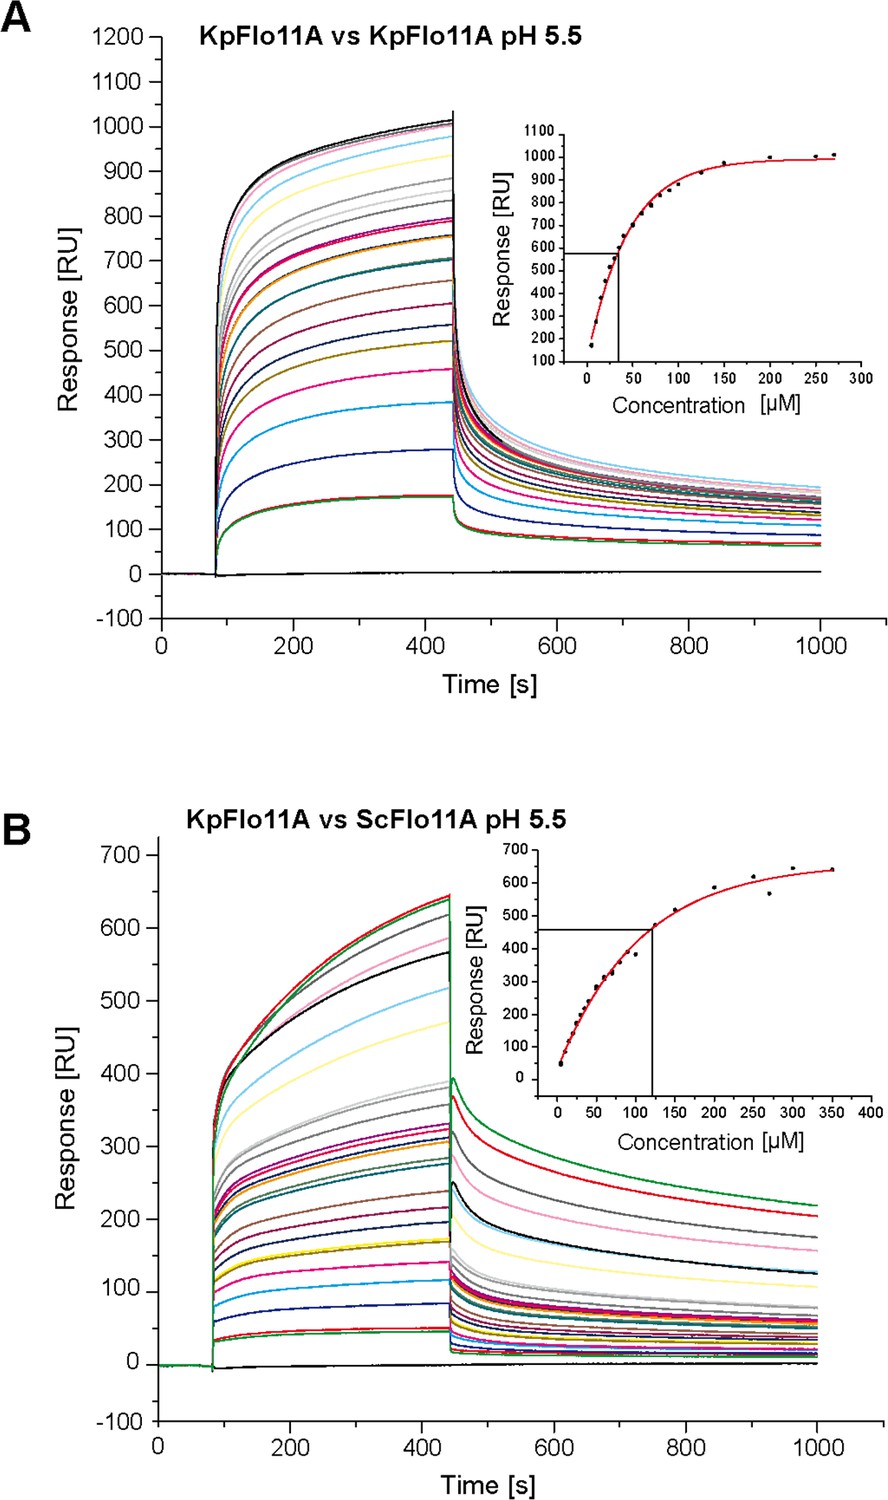
SPR binding analysis of KpFlo11A-KpFlo11A and KpFlo11A-ScFlo11A interactions.
Sensorgrams of KpFlo11A-KpFlo11A interactions (A) and KpFlo11A-ScFlo11A interactions (B) with concentrations from 5 to 350 µM KpFlo11A or ScFlo11A, respectively, in solution. KpFlo11A was immobilized on a CM5 chip to a level of ~5,000 RU. Association was enabled for 360 s, dissociation for 600 s. Analysis was performed in acetate buffer with pH 5.5 that is close to the pI of ScFlo11A-His6 respectively KpFlo11A-His6. The inlay shows the concentration-dependent changes of plasmon resonance signals (dots), which were fitted with a steady-state 1:1 binding model using the BIAevaluation software suite.
Figure 5 with 1 supplement
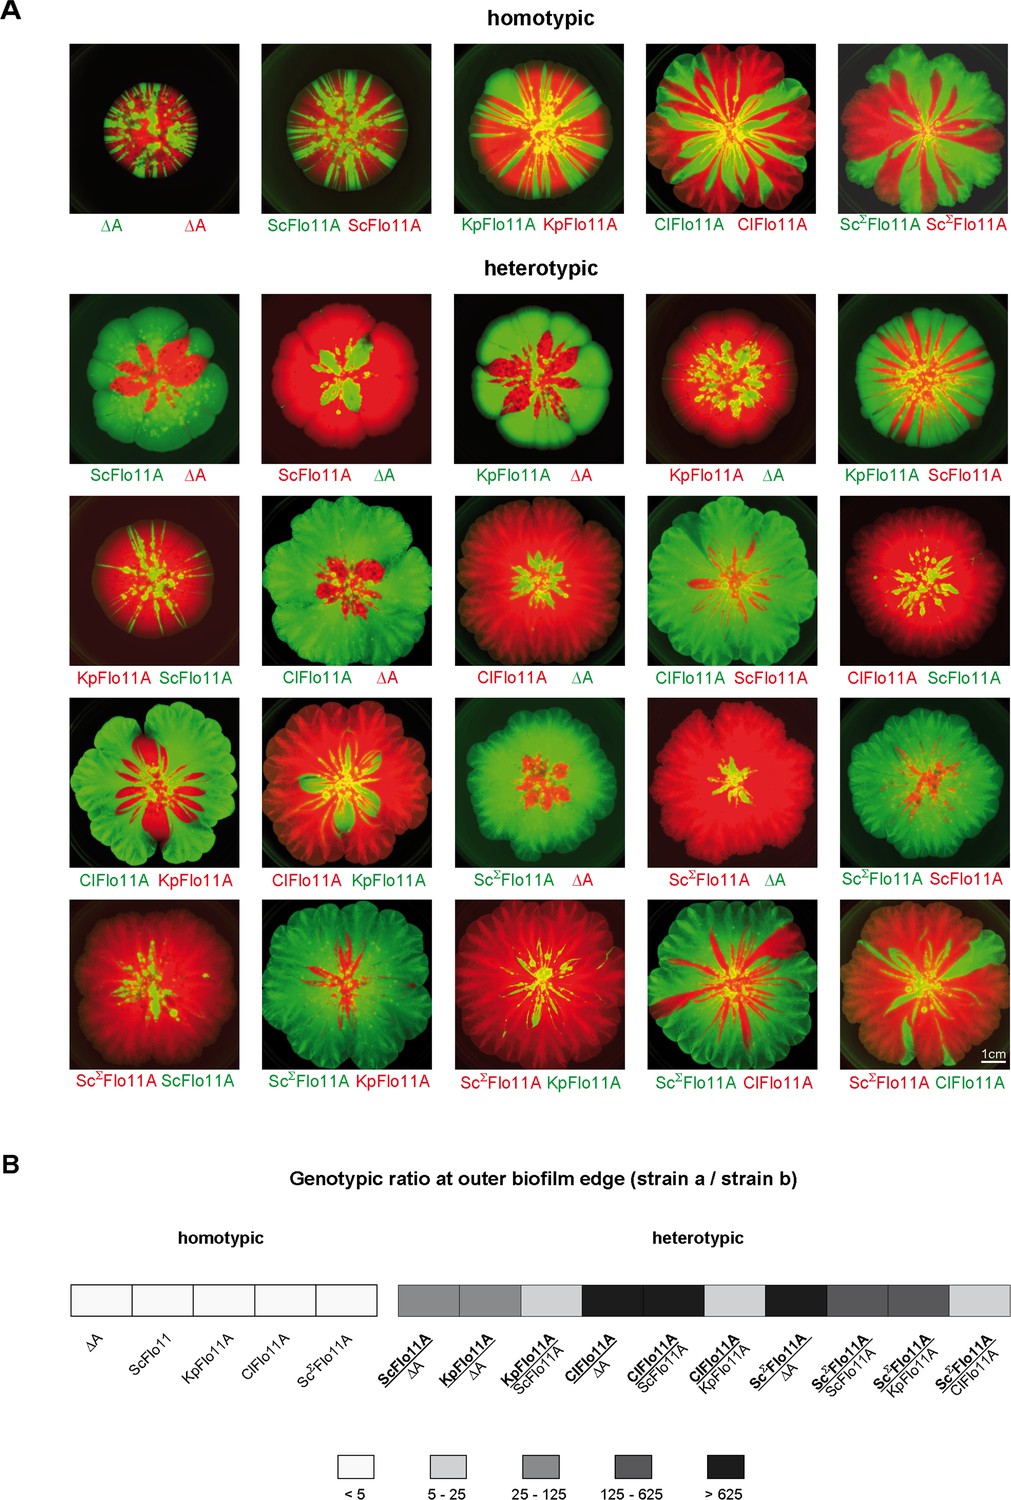
Flo11A-mediated separation of competitive yeast strains.
(A) Competitive biofilm assays. Yeast strains expressing the indicated Flo11 variants were mixed in a 1:1 ratio and were grown to a mat biofilm for three weeks. To distinguish between competing Flo11 variants, strains were tagged by expression of either GFP (green color) or RFP (red color). Homotypic and heterotypic Flo11 combinations are indicated. Each Flo11 variant was assayed using two independent strains tagged by either GFP or RFP, to test robustness to the fluorescence marker. Scale bar corresponds to 1 cm. (B) Quantification of presence of competing Flo11 strains from A present at the outer biofilm edge (Figure 5—source data 1). For quantification of the genotypic ratio, the amount of the signal produced by the superior strain a (bold) was divided by the amount of the signal from the inferior strain b (regular). Average ratios are presented using five different categories as indicated. For each combination of competing strains, at least two biological replicates of independently obtained clones were assayed.
-
Figure 5—source data 1
Quantification of RFP and GFP signals in mixed biofilms presented in Figure 5.
- https://cdn.elifesciences.org/articles/55587/elife-55587-fig5-data1-v2.xlsx
Figure 5—figure supplement 1

Quantitative analysis of biofilms upon competitive assays.
Yeast strains expressing the indicated Flo11 variants were mixed in a 1:1 ratio (OD600 of cells) and grown to a mat biofilm for three weeks. Competing yeast strains were tagged by expression of either GFP (green color) or RFP (red color). Homotypic and heterotypic strain combinations are shown separately as indicated. Each Flo11 variant was assayed using two independent strains tagged by either GFP or RFP, to test robustness to the fluorescence marker. After three weeks of development, biofilms were photographed using GFP and RFP filters, and resulting pictures were further processed for quantification of biofilms sizes and for spatial analysis of green and red signals within biofilms (Figure 5—source data 1). (A) Spatial distribution of competing yeast strains within biofilms. Curves in the depicted graphs show the red/green signal ratios in relation to the distance from the center (inoculation spot) of the biofilms. Replicates are shown by different color. (B) Biofilm size for each combination of competing yeast strains is shown by bars indicating the total area covered by the different biofilms in cm2. Error bars indicate standard deviation. (C) Relative presence of competing strains within whole biofilms is shown as the ratio of the total amount of red signals versus the total amount of green signals within biofilms. Error bars indicate standard deviation. (D) Relative presence of competing strains at the outer biofilm edge is shown as the ratio of red versus green signals present along a line in distance of 50 pixels to the biofilm edge. Error bars indicate standard deviation.
Figure 6 with 1 supplement
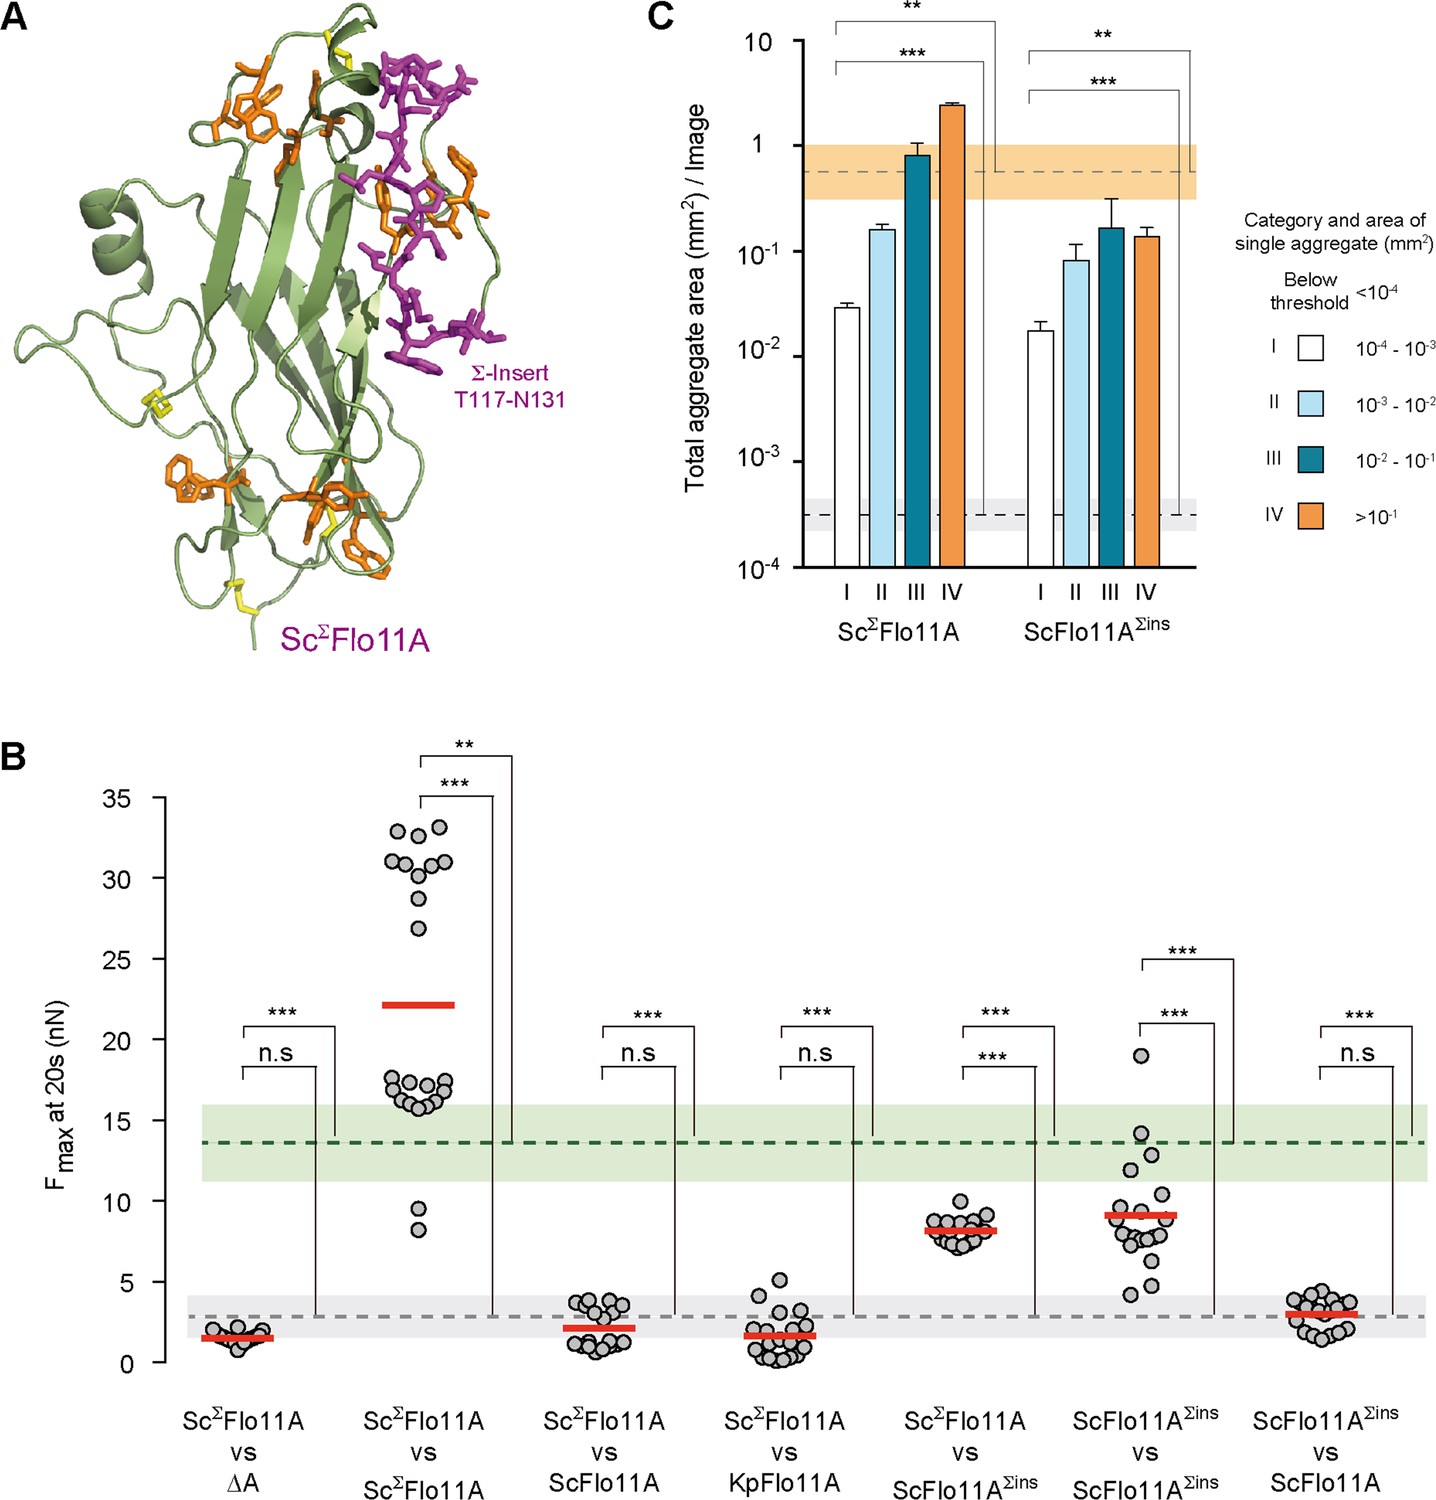
Structural and functional properties of ScΣFlo11A from S. cerevisiae strain Σ1278b at single cell and population level.
(A) A structural model of ScΣFlo11A as obtained as snap shot by molecular dynamics analysis. The ScΣFlo11A-specific insert differing from ScFlo11A is shown in magenta. Aromatic surface residues functionally relevant in ScFlo11A (Figure 3—figure supplement 1), are shown in orange. Disulfide bonds are shown in yellow. (B) SCFS analysis for ScΣFlo11A, ScFlo11A variants and KpFlo11A (Figure 6—source data 1). (C) QCAM analysis for ScΣFlo11A and ScFlo11A variants.
-
Figure 6—source data 1
Single cell-cell adhesion forces determined by SCFS and presented in Figure 6.
- https://cdn.elifesciences.org/articles/55587/elife-55587-fig6-data1-v2.xlsx
Figure 6—figure supplement 1
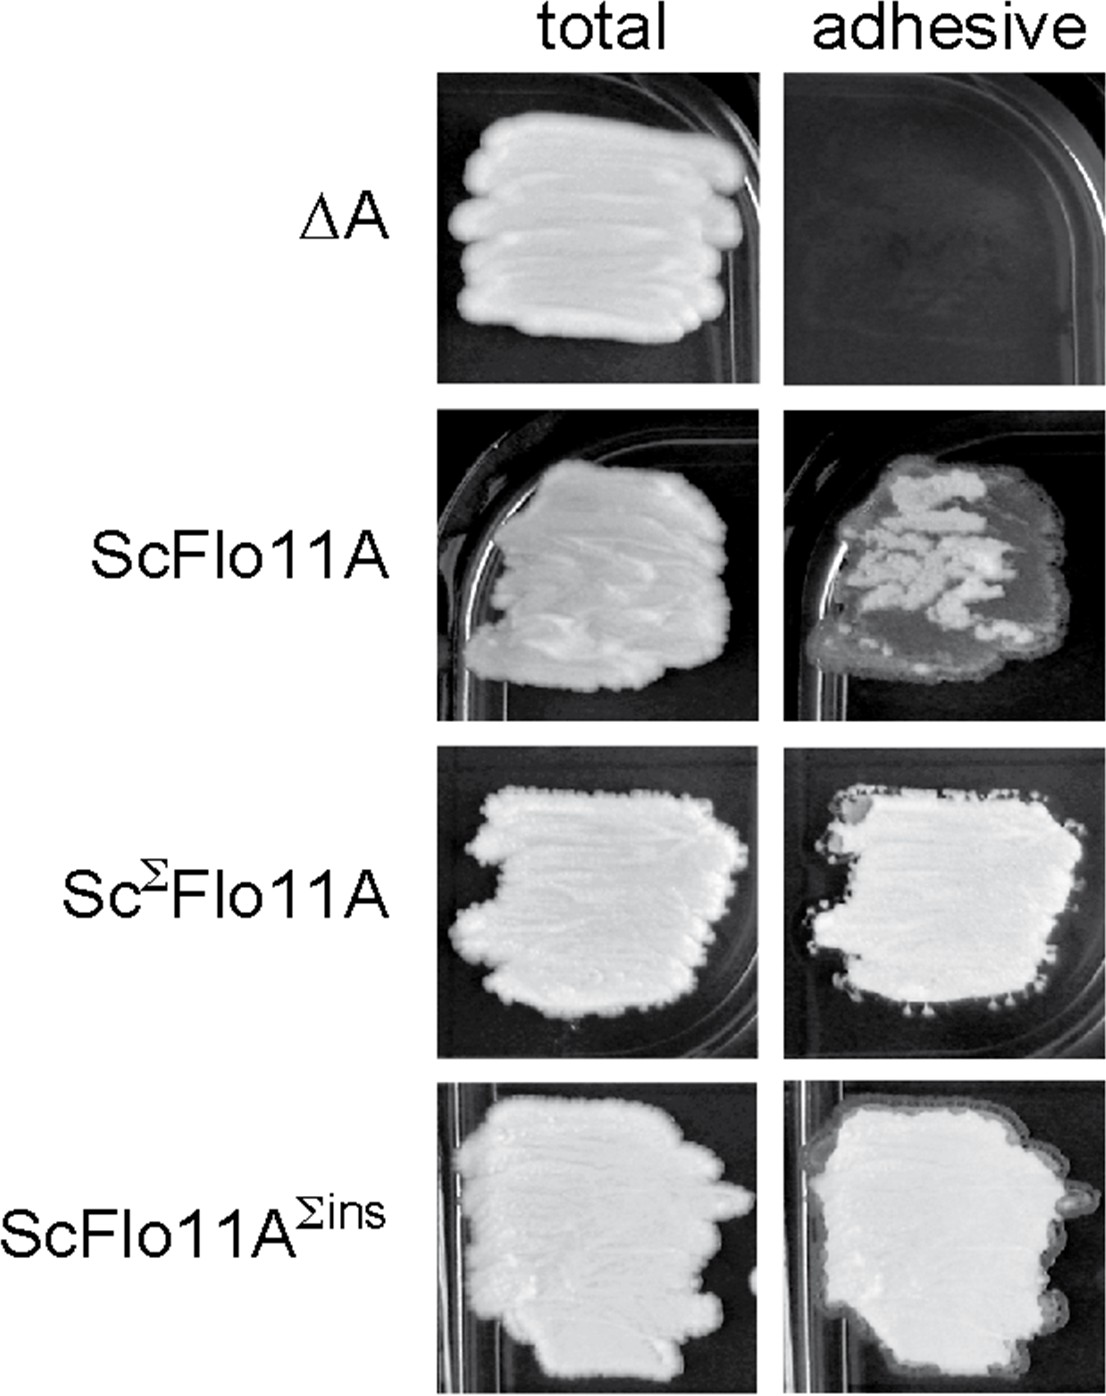
Functional analysis of ScΣFlo11A.
Biofilm formation of yeast strains expressing ScFlo11A, ScΣFlo11A or ScFlo11AΣins were measured on agar surfaces after 3 d of growth as previously described (Roberts and Fink, 1994). Images of biofilms were taken before (total) and after (adhesive) washing away of non-adhesive cells from the agar surface.
Figure 7
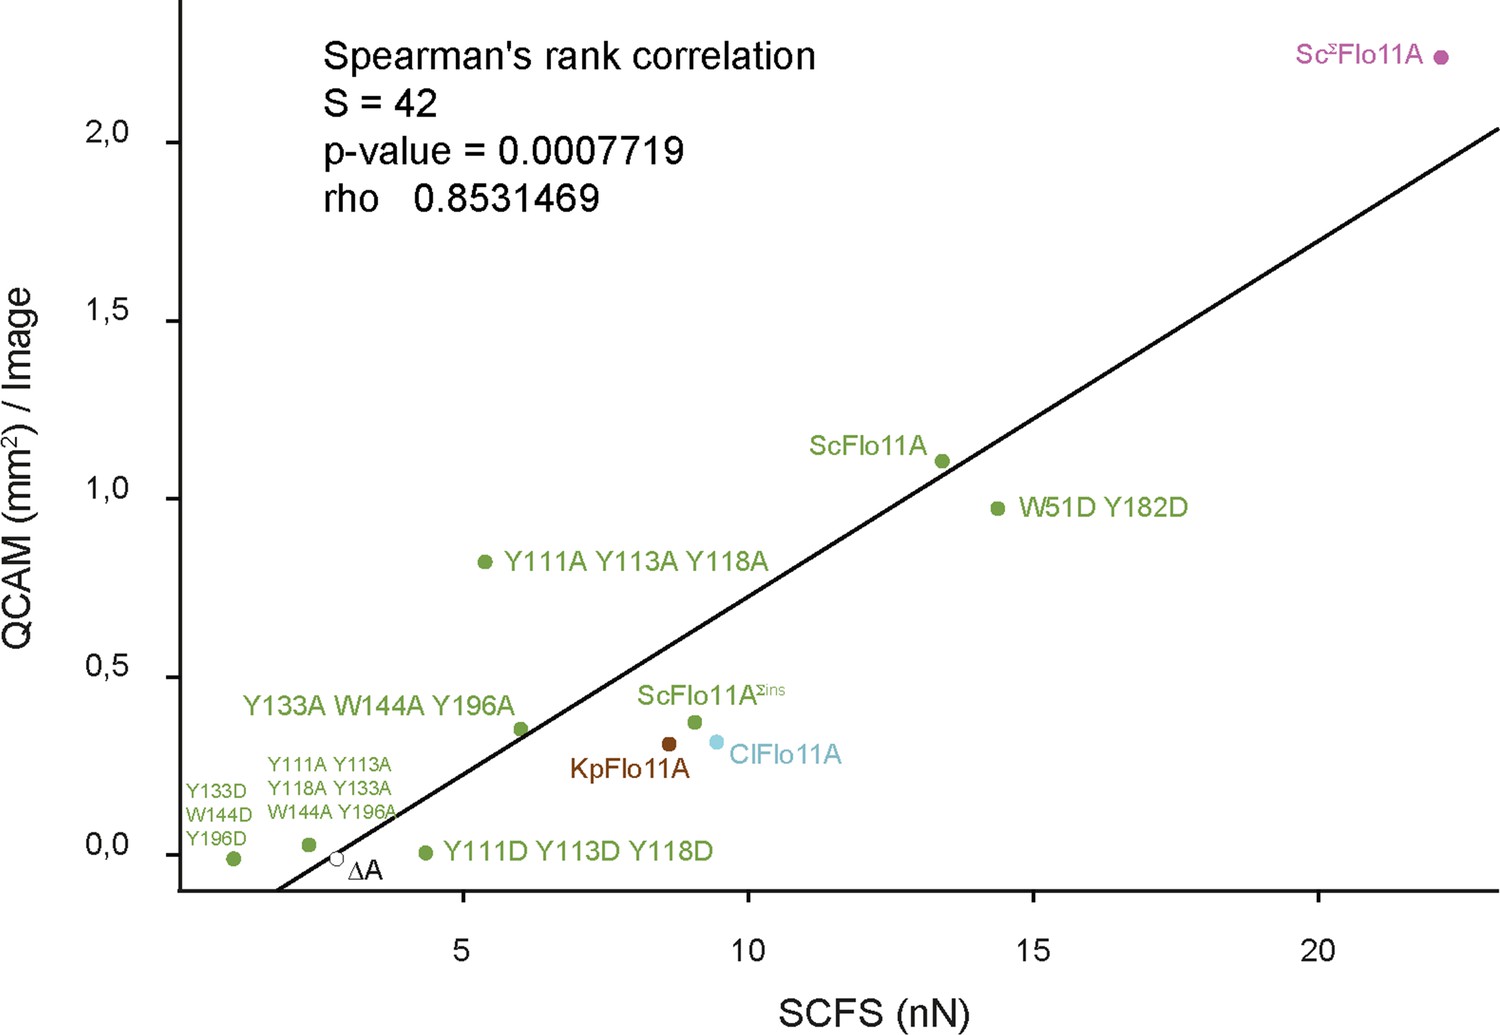
Correlation between SCFS and QCAM data.
Correlation between maximum adhesion forces obtained by SCFS analysis and total aggregate areas obtained by QCAM analysis was calculated by Spearman's rank correlation test. Dots show SCFS and QCAM data obtained for different Flo11A variants as indicated.
Figure 8
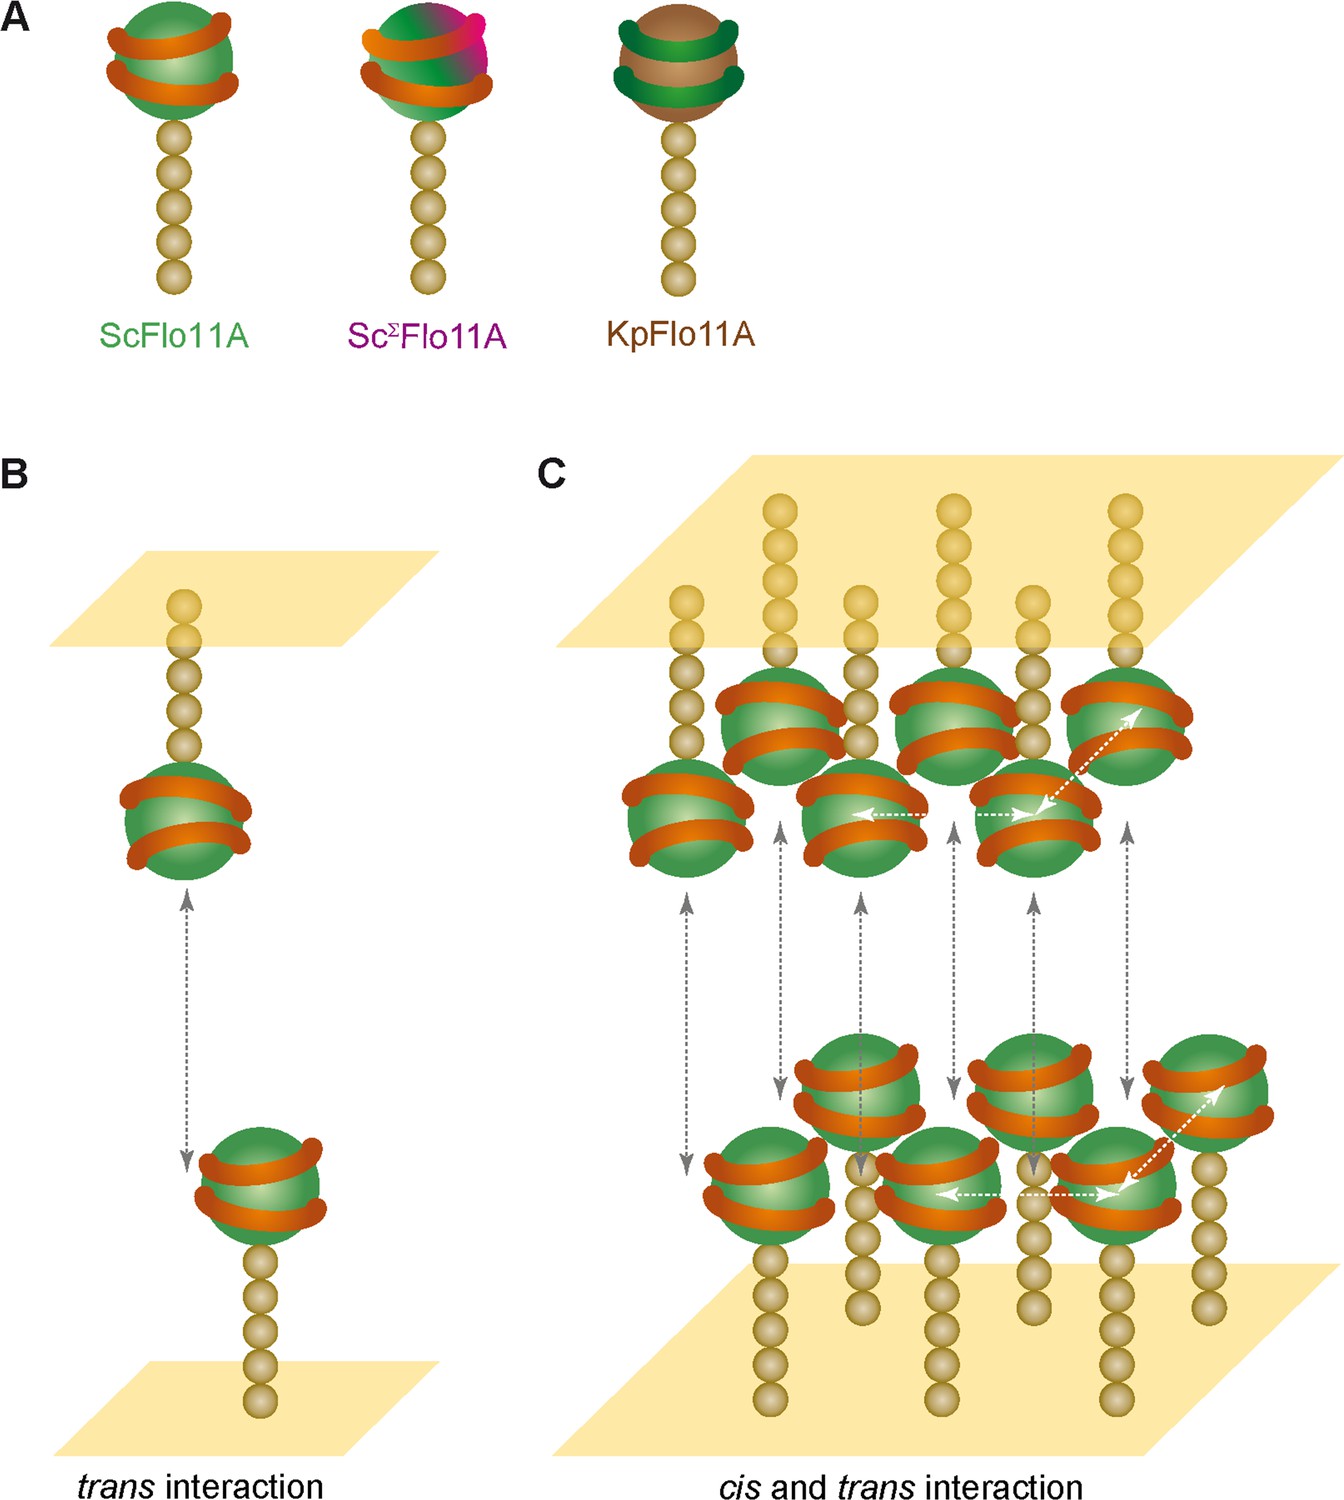
Model for kin discrimination by Flo11.
(A) Structural elements for Flo11-directed discrimination. Shown are ScFlo11A, ScΣFlo11A and KpFlo11A variants that differ either by the topology of the conserved aromatic bands shown as orange or green rings, respectively, or by an additional insertion shown in magenta. The Flo11BC domain is shown as beige spheres. (B) Model for bi-molecular Flo11A-Flo11A trans-interaction. Cell surfaces are shown in yellow and trans-interaction is indicated as grey, dotted arrow. (C) Model for interaction of Flo11A collectives by cis- and trans-interactions. Collective-forming cis-interactions are indicated as white, dotted arrows.
Tables
Key resources table
| Reagent type (species) or resource | Designation | Source or reference | Identifiers | Additional information |
|---|---|---|---|---|
| Gene (Saccharomycetales) | Flo11-type A domain sequences | various | See Supplementary file 1 | |
| Genetic reagent Saccharomyces cerevisiae | Flo11-type A domain variants carrying yeast strains | See Supplementary file 2 | ||
| Antibody | Rabbit polyclonal anti-ScFlo11A | (Kraushaar et al., 2015) | Previously produced in our lab (1:10.000) | |
| Antibody | Mouse monoclonal anti-STREP II Chromeo 488 | IBA Lifesciences, Göttingen, Germany | Cat# 2-1544-050 | (1:1.000) |
| Recombinant DNA reagent | Flo11-type A domain variants carrying plasmids | various | See Supplementary file 3 | |
| Sequence-based reagent | Primer Ampl_FLO11_wt_fw | This study | PCR primers | CTC AAA AAT CCA TAT ACG CAC ACT |
| Sequence-based reagent | Primer Ampl_FLO11_wt_BC_rev | This study | PCR primers | GTA GAG CTG GAT GGA GTT GG |
| Peptide, recombinant protein | ScFlo11A | (Kraushaar et al., 2015) | Previously produced in our lab | |
| Peptide, recombinant protein | KpFlo11A | This study | ||
| Commercial assay or kit | Amine coupling kit | GE Healthcare, Solingen, Germany | ||
| Software, algorithm | Matlab | MathWorks | RRID:SCR_001622 | See section ‘QCAM’ and ‘Competitive biofilm assay’ |
| Software, algorithm | GraphPad Prism, v7.0 | GraphPad Software, La Jolla, CA, USA | RRID:SCR_002798 | |
| Software, algorithm | XDS | (Kabsch, 2010) | RRID:SCR_015652 | |
| Software, algorithm | CCP4 | Collaborative Computational Project, Number 4, 1994 | RRID:SCR_007255 | |
| Software, algorithm | Phenix suite | (Adams et al., 2002) | RRID:SCR_014224 | |
| Software, algorithm | Coot | (Emsley et al., 2010) | RRID:SCR_014222 | |
| Software, algorithm | Refmac5 | (Murshudov et al., 2011) | RRID:SCR_014225 | |
| Software, algorithm | PyMOL v1.8.0.1 | (Delano, 2002) | RRID:SCR_000305 | |
| Software, algorithm | Biacore T100 evaluation software, v1.1 | GE Healthcare, Solingen, Germany | ||
| Software, algorithm | Clustal Omega web tool | (McWilliam et al., 2013) | RRID:SCR_001591 | |
| Software, algorithm | PRANK web tool | (Löytynoja and Goldman, 2010) | RRID:SCR_017228 | |
| Software, algorithm | FigTree v1.4.2 | http://tree.bio.ed.ac.uk | RRID:SCR_008515 | |
| Software, algorithm | STRIDE web server | (Heinig and Frishman, 2004) | ||
| Software, algorithm | Modeller 9v7 | (Sali and Blundell, 1993) | RRID:SCR_008395 |
Additional files
-
Supplementary file 1
Flo11A domain sequences.
- https://cdn.elifesciences.org/articles/55587/elife-55587-supp1-v2.docx
-
Supplementary file 2
Yeast strains.
- https://cdn.elifesciences.org/articles/55587/elife-55587-supp2-v2.docx
-
Supplementary file 3
Plasmids.
- https://cdn.elifesciences.org/articles/55587/elife-55587-supp3-v2.docx
-
Supplementary file 4
Crystal structure data collection, processing and refinement.
- https://cdn.elifesciences.org/articles/55587/elife-55587-supp4-v2.docx
-
Supplementary file 5
Structural analysis of KpFlo11A.
- https://cdn.elifesciences.org/articles/55587/elife-55587-supp5-v2.docx
-
Supplementary file 6
Quantification of Flo11A protein amounts.
- https://cdn.elifesciences.org/articles/55587/elife-55587-supp6-v2.docx
-
Transparent reporting form
- https://cdn.elifesciences.org/articles/55587/elife-55587-transrepform-v2.pdf
Download links
A two-part list of links to download the article, or parts of the article, in various formats.
Downloads (link to download the article as PDF)
Open citations (links to open the citations from this article in various online reference manager services)
Cite this article (links to download the citations from this article in formats compatible with various reference manager tools)
Kin discrimination in social yeast is mediated by cell surface receptors of the Flo11 adhesin family
eLife 9:e55587.
https://doi.org/10.7554/eLife.55587


