Biodiversity mediates the effects of stressors but not nutrients on litter decomposition
- German Centre for Integrative Biodiversity Research (iDiv) Halle-Jena-Leipzig, Germany
- Institute of Biology, Leipzig University, Germany
- Research Unit of Environmental and Evolutionary Biology, Namur Institute of Complex Systems, and Institute of Life, Earth, and the Environment, University of Namur, Belgium
Figures
Figure 1

Schematic representation of the structural hypotheses tested in this study.
Green arrows depict expected positive effects, red arrows represent negative effects. Stressors and nutrients are hypothesized to decrease decomposer diversity. The response of decomposers diversity to environmental change drivers determines the response of decomposition (Srivastava et al., 2009). Nutrients are hypothesized to increase decomposer abundance. Stressors and nutrients can affect litter decomposition independent of changes in decomposer diversity and abundance, especially through changes in physiological activity (De Laender et al., 2016; Giling et al., 2019).
Figure 2
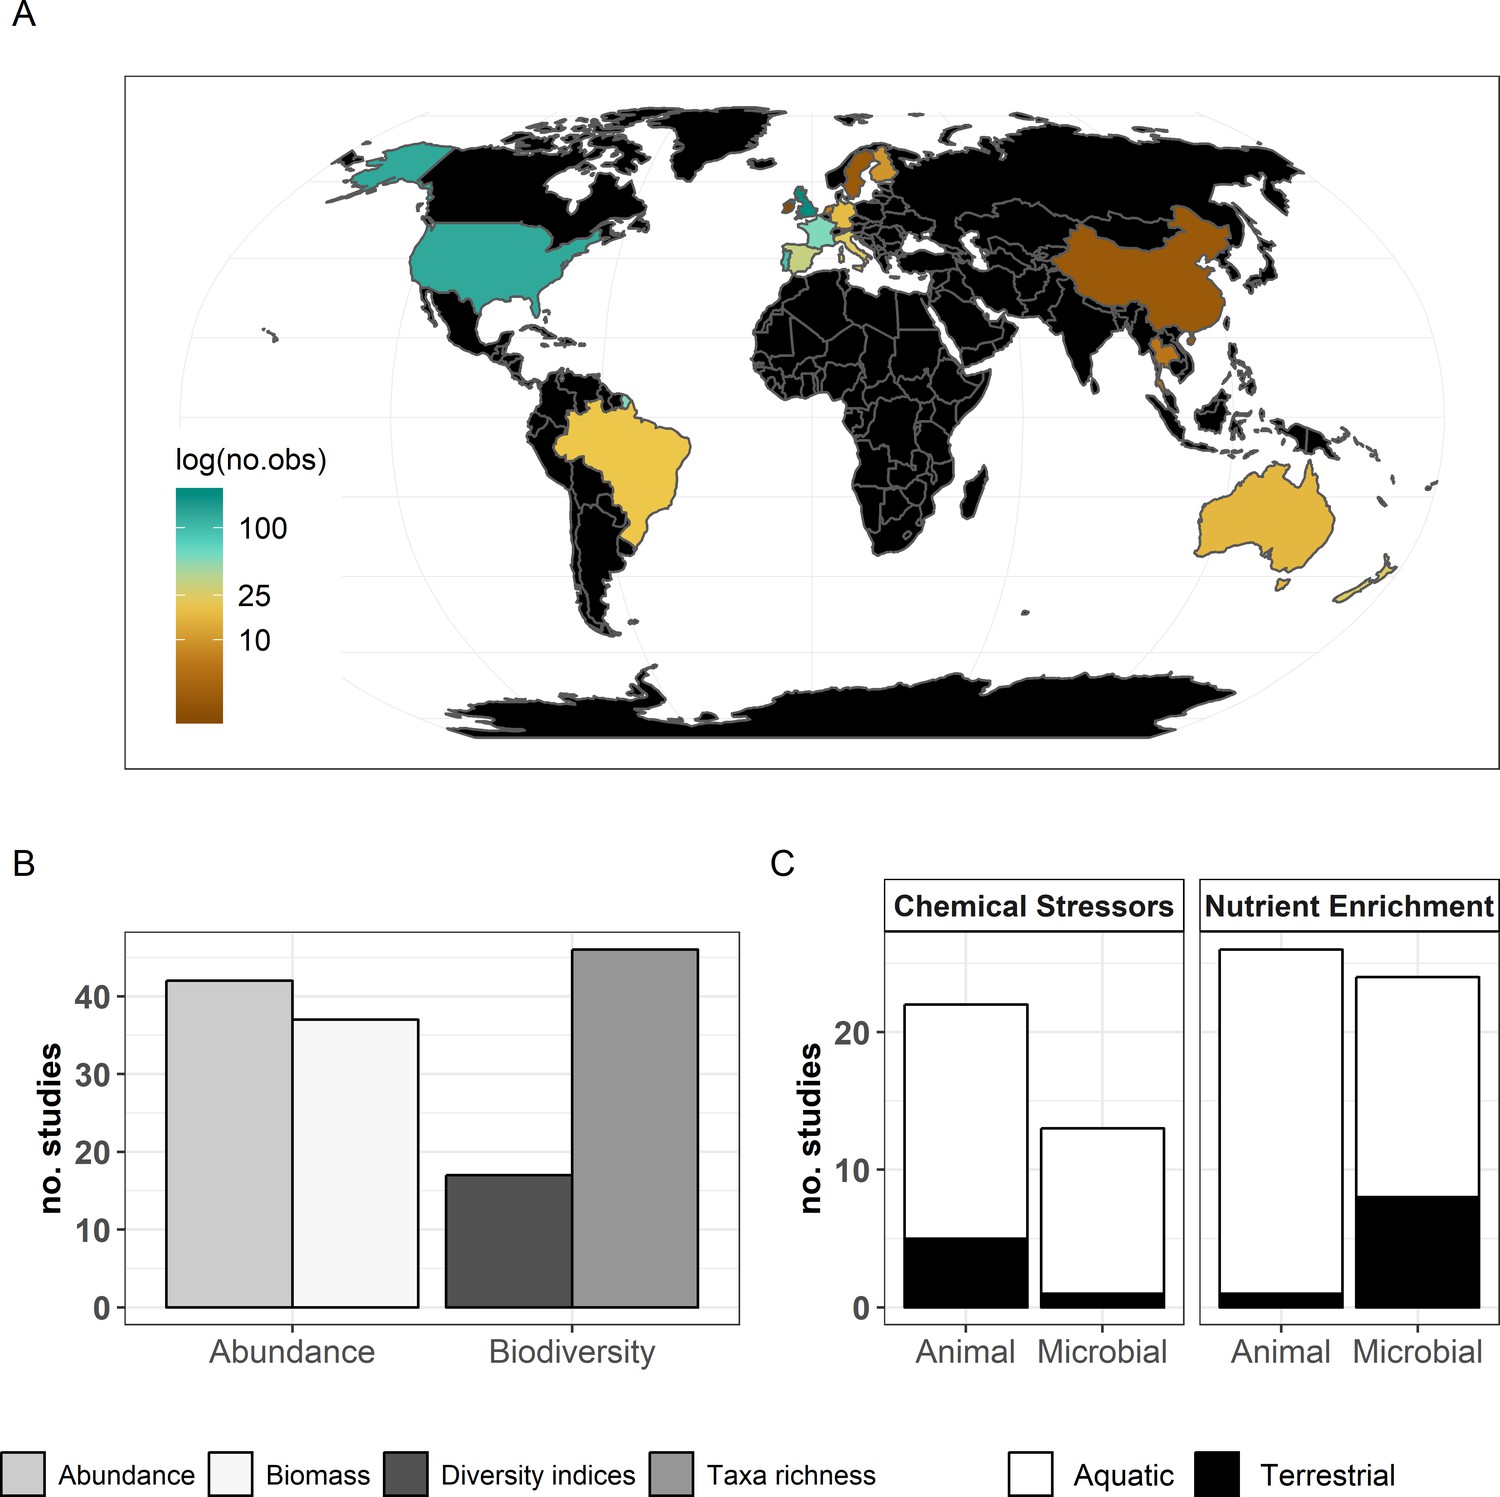
Description of the data used in the present meta-analysis.
(A) Countries represented and corresponding number of observations, (B) decomposer diversity and abundance metrics covered, and (C) ecosystem types and decomposer taxonomic groups (animals: soil micro-, meso-, macro-fauna, stream macroinvertebrates; and microbial decomposers: fungi and bacteria) represented.
Figure 3

Grand mean effect sizes of chemical stressors and nutrient enrichment on decomposer diversity (taxa richness and diversity indices), abundance (density and biomass), and litter decomposition.
Effect sizes are z-transformed correlation coefficients. Error bars show 95% confidence intervals. Numbers in parentheses indicate number of studies and observations, respectively. Symbols show the significance level for the comparison between mean effect size and zero (***p<0.001; *p<0.05). For full model results, see Appendix 2—table 2.
Figure 4

Relationship between the responses of decomposition and decomposer diversity and abundance to chemical stressors and nutrient enrichment.
Variables are effect sizes (z-transformed correlation coefficients) of stressors or nutrients on litter decomposition and on animal and microbial decomposer diversity (left panels) or abundance/biomass (right panels). Gray symbols are individual observations of effect sizes; Colored symbols indicate mean effect size on diversity or abundance across individual observations for a unique litter decomposition measurement (see methods). Lines represent meta-regressions between effect sizes for decomposition and decomposers, where solid lines are statistically significant (p<0.05), dashed lines are non-significant (p>0.05), and thin lines depict the regression's confidence interval. QM and p represent the model heterogeneity and p-values of the meta-regressions, respectively, with sample size (number of studies; number of observations).
Figure 5
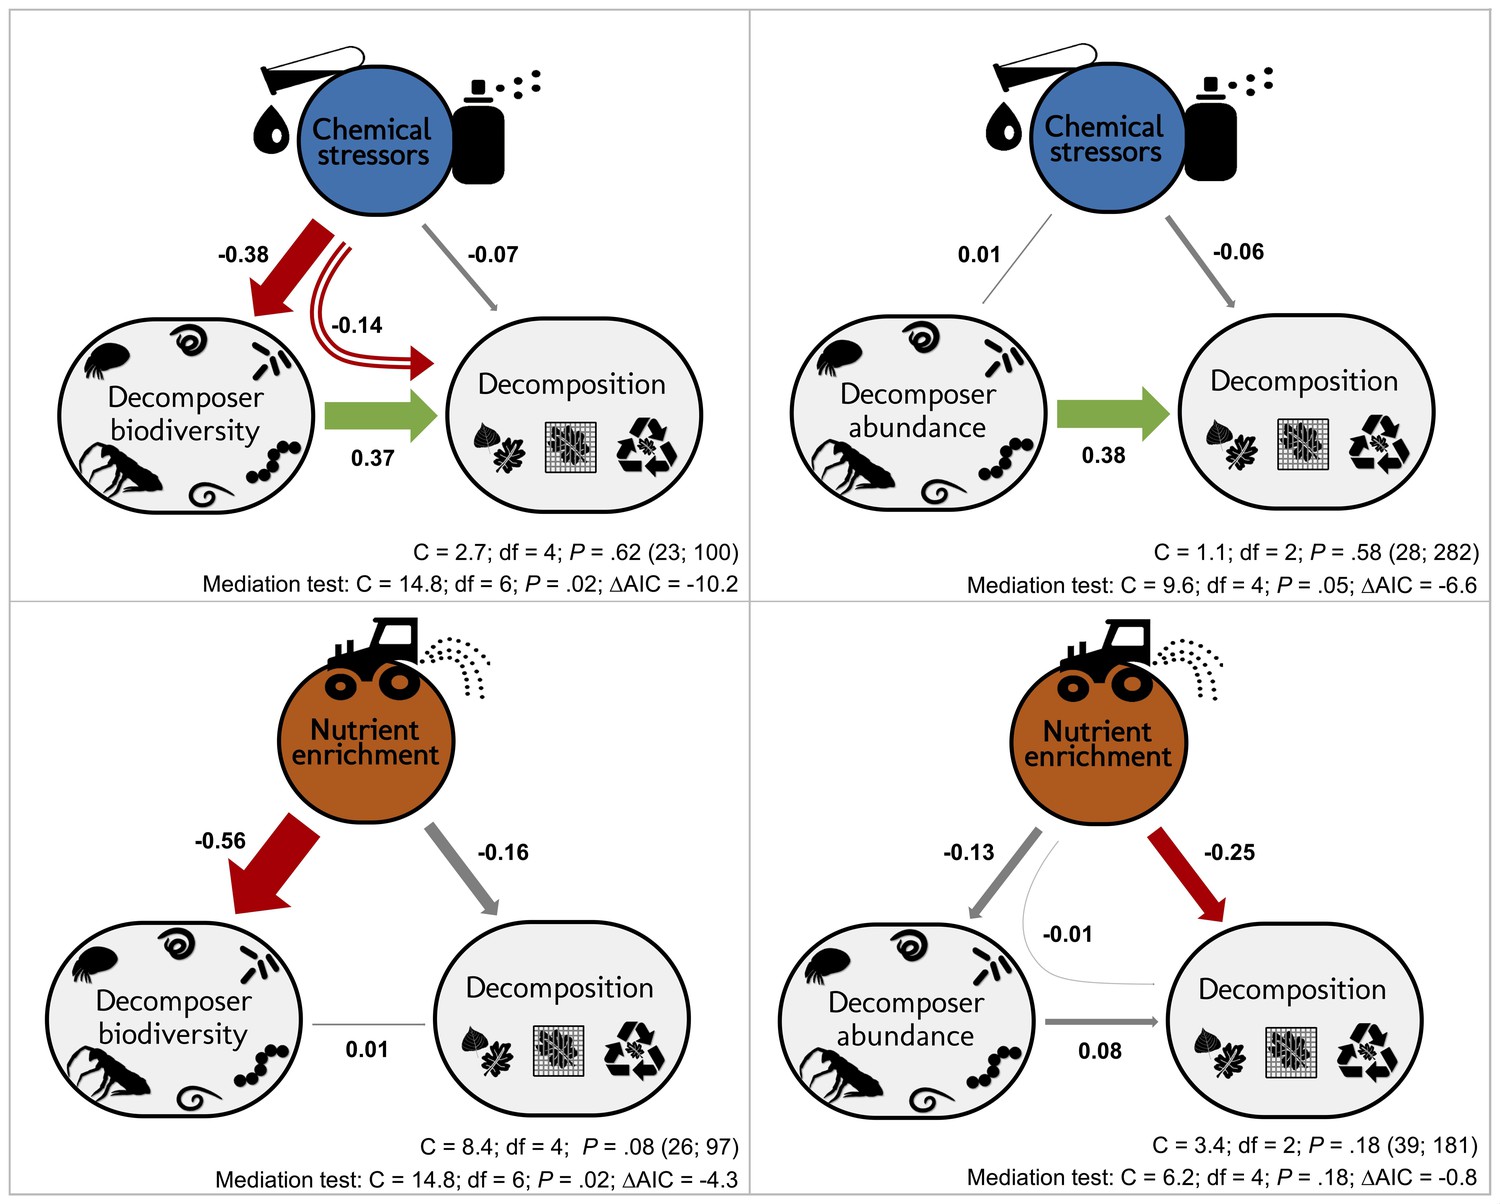
Decomposer diversity and abundance explained litter decomposition response to chemical stressors but not to nutrient enrichment.
Structural equation models investigating decomposer diversity- or abundance-mediated effects of chemical stressors and nutrient enrichment on litter decomposition across 69 studies. Arrows represent relationships between stressor or nutrient intensity levels, and effect sizes of stressors or nutrients on litter decomposition and on decomposer diversity (taxa richness, Shannon diversity, or evenness: left panels) or abundance and biomass (right panels). Values along the arrows are standardized path coefficients. Green, red, and gray arrows indicate positive, negative, and non-significant relationships, respectively. Curved arrows depict the indirect effects of stressors or nutrients on decomposition as mediated by diversity or abundance. Arrow widths are scaled relative to the magnitude of standardized path coefficients. C statistic, P-value (P<0.05 indicate poor model fit), and sample sizes (number of studies; number of observations). Results of mediation tests: comparison with models omitting the path from diversity or abundance to decomposition (ΔAIC < −2 indicates that reduced models were not consistent with the data).
Figure 6
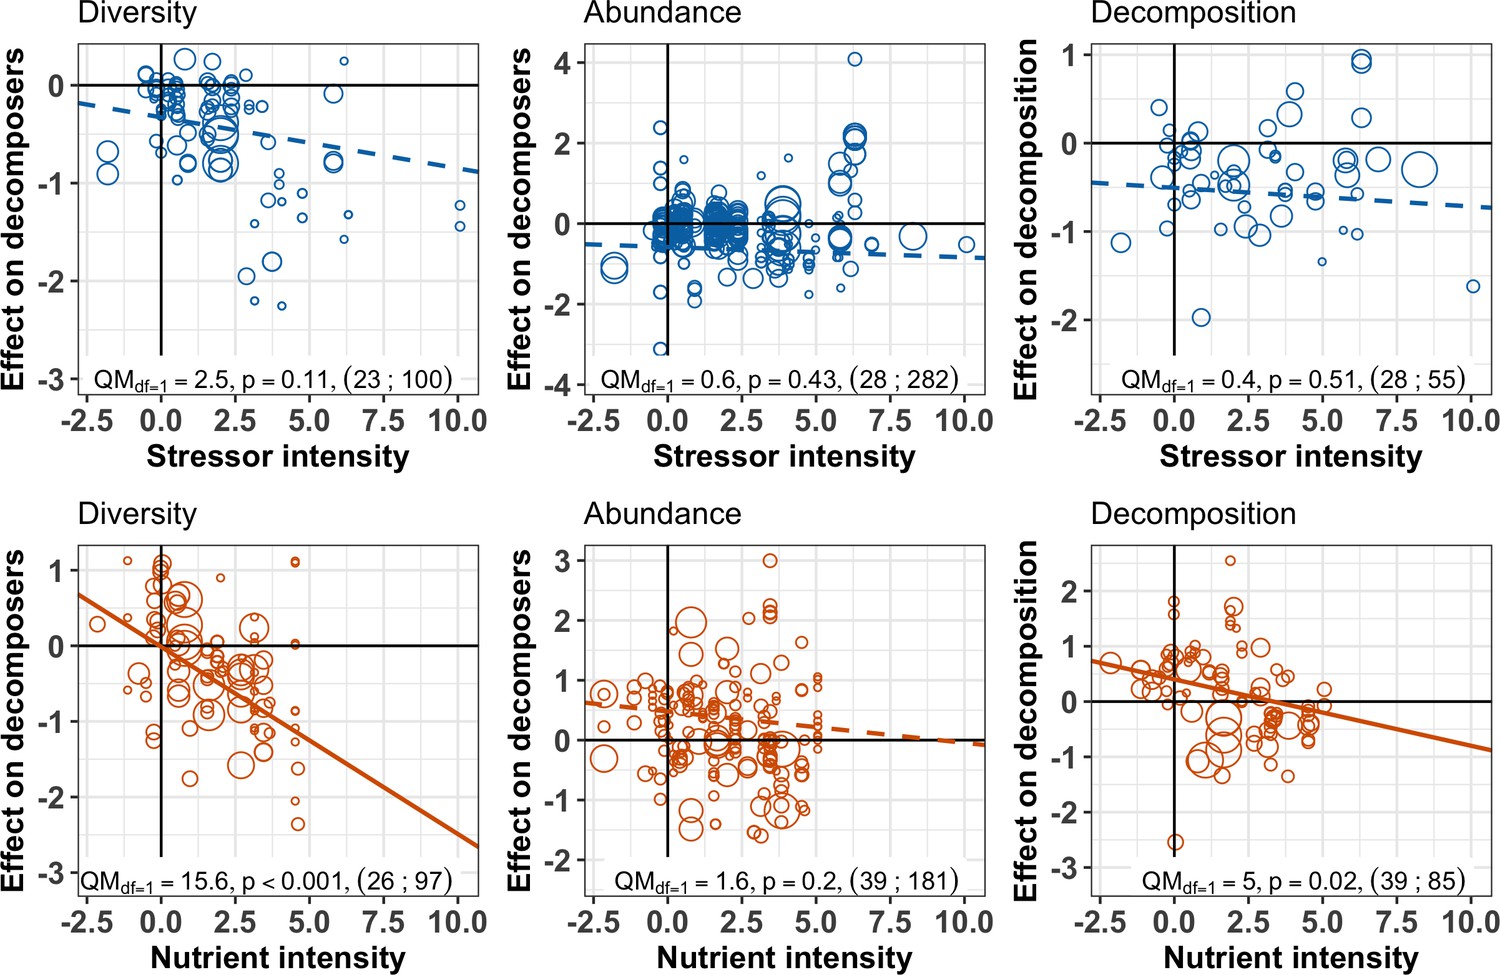
Decomposer and decomposition responses to the intensity levels of chemical stressors and nutrient enrichment.
Values are effect sizes (z-transformed correlation coefficients). Stressor or nutrient intensity represents the standardized level of environmental change in the treatment with the highest level (values < 0: observed level below quality criteria considered to be safe for the environment; values > 0: observed level above quality criteria). Point size is proportional to the inverse of the variance in effect size. Lines are the slopes and 95% confidence intervals from bivariate meta-regressions, with associated QM statistics, p-value and sample size (number of studies; number of observations).
Figure 7
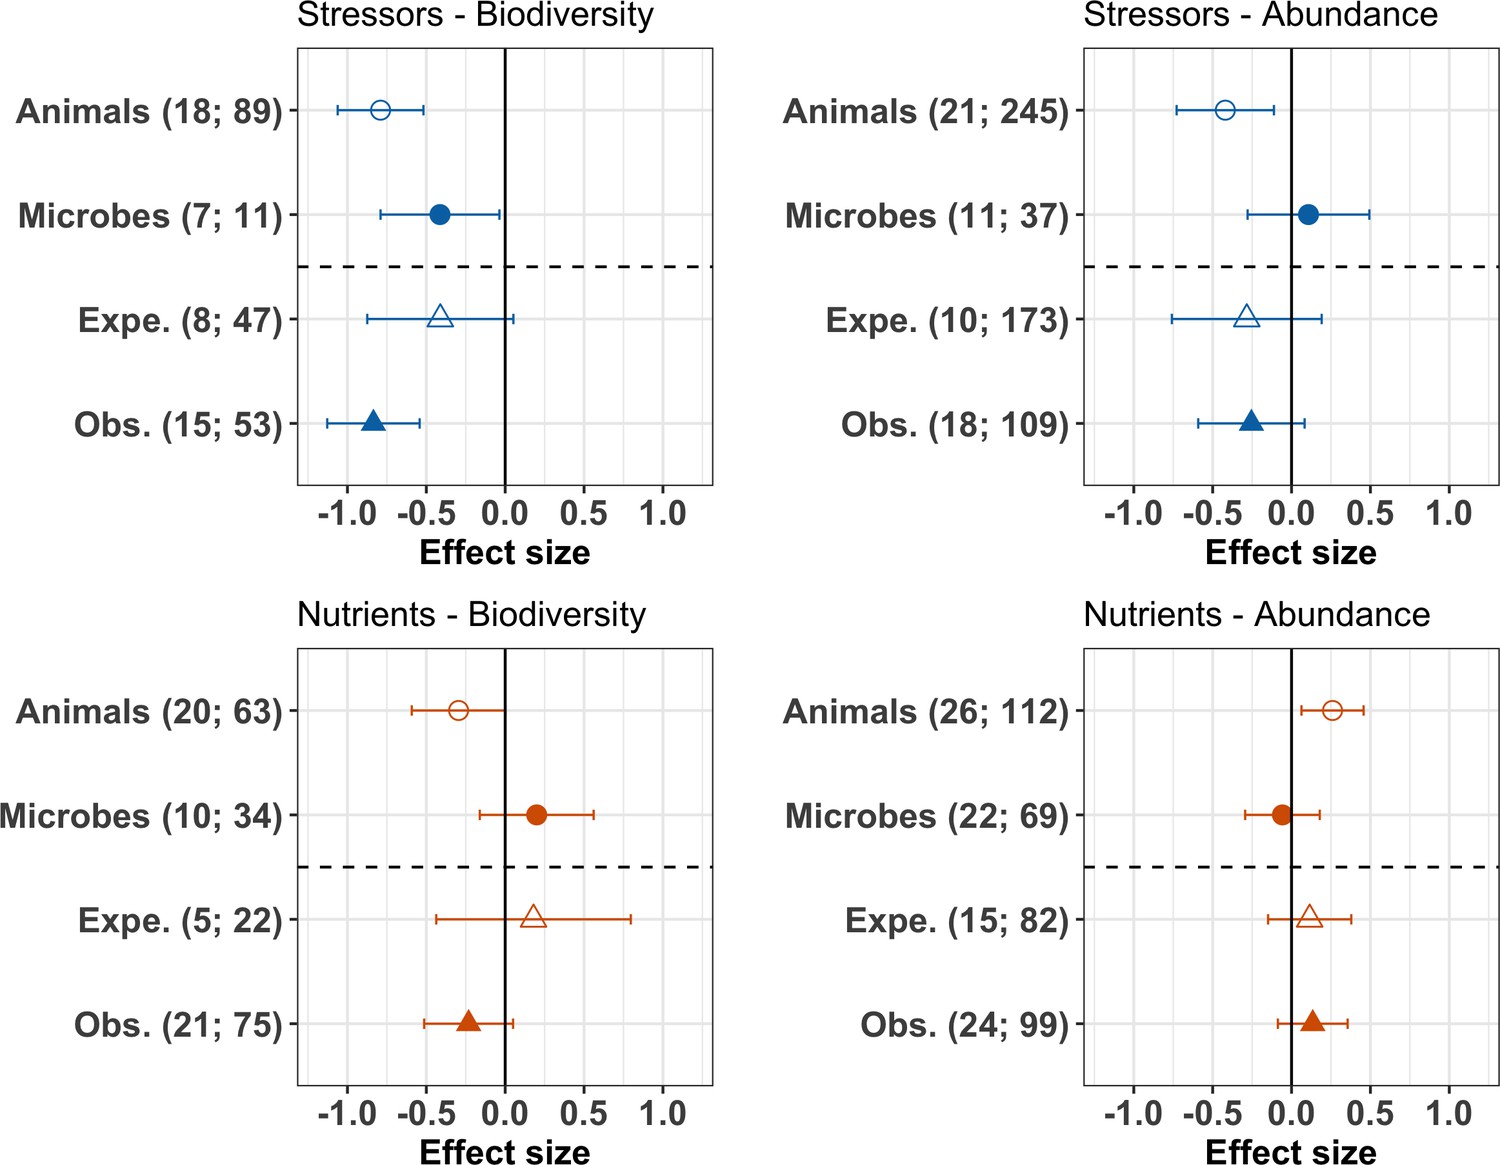
Moderator effects on decomposer diversity and abundance responses to chemical stressors and nutrient enrichment.
Responses of decomposer diversity (taxa richness and diversity indices) and abundance (densities and biomass) to stressors and nutrients according to the taxonomic group (animals and microbes) and study type (Expe. = experimental; Obs. = observational studies). Values are mean effect sizes (z-transformed correlation coefficients) and 95% confidence intervals derived from meta-analytic models. Sample sizes are reported for each moderator: (number of studies; number of observations).
Appendix 1—figure 1
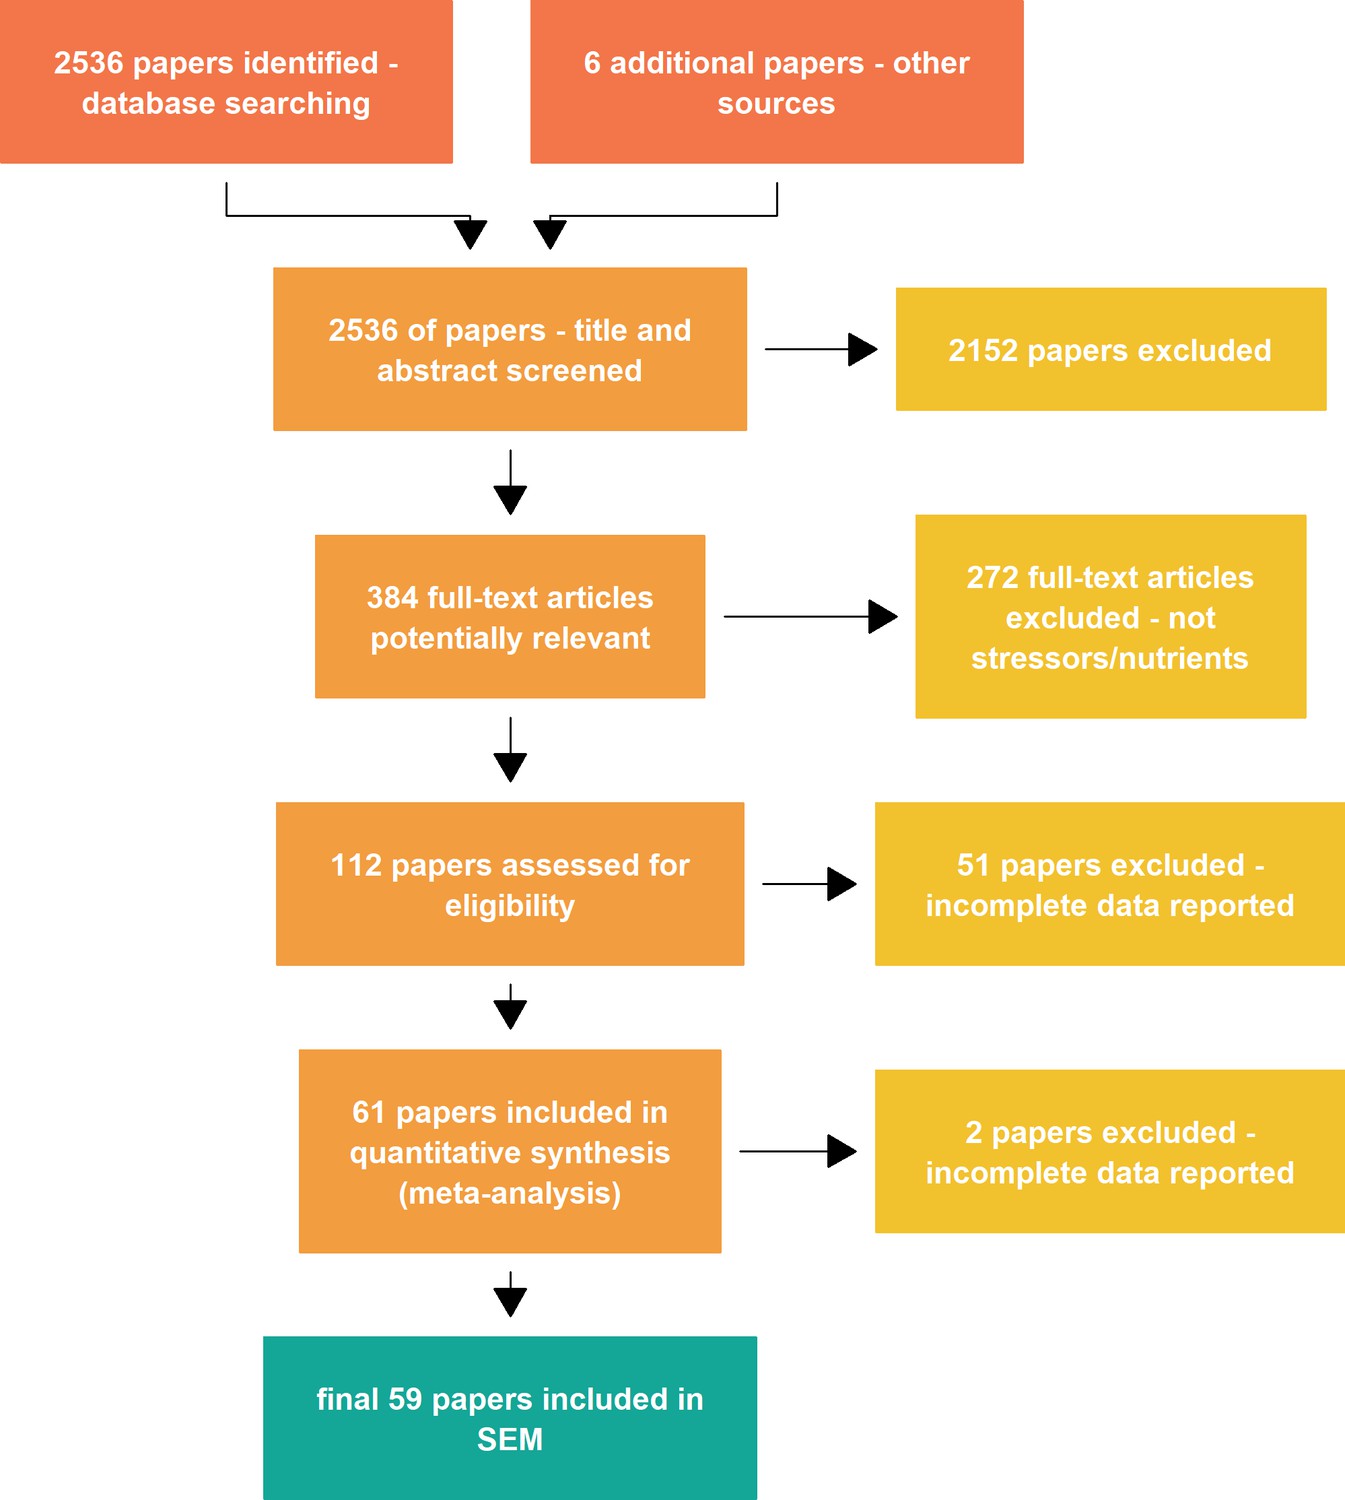
PRISMA plot describing the data collection steps of the meta-analysis.
SEM = structural equation modeling.
Appendix 2—figure 1
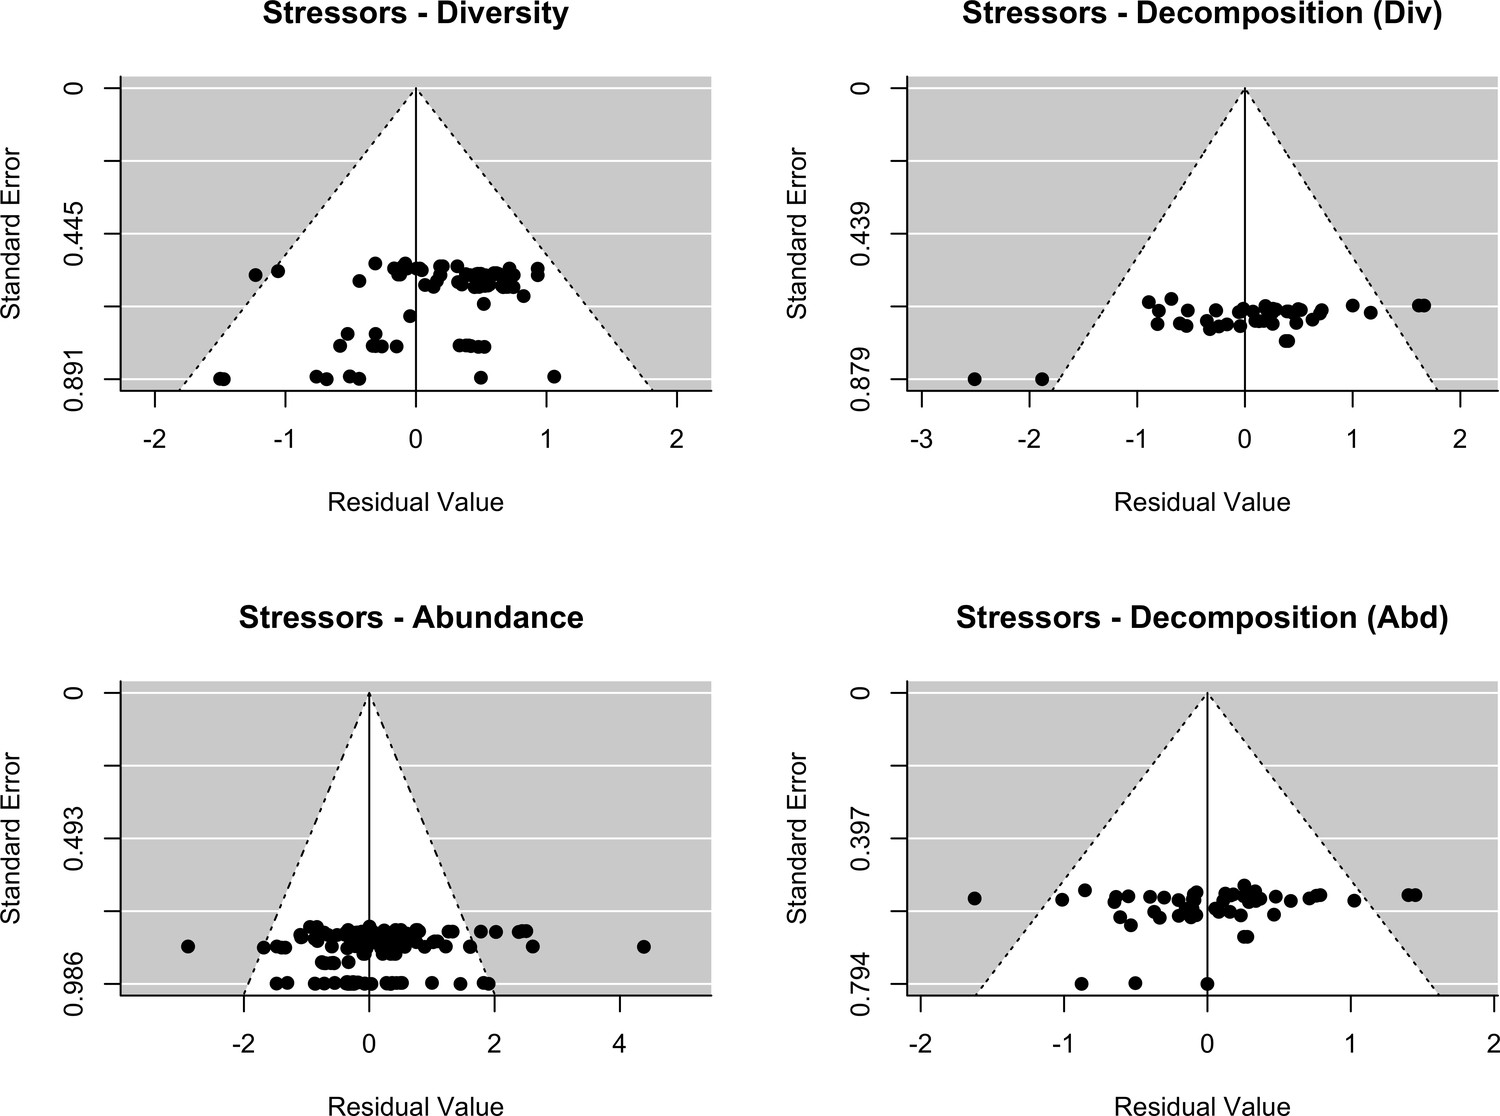
Assessment of publication bias.
Stressors: Funnel plots of each response variables (decomposer diversity, abundance and decomposition) in the two datasets (stressors - diversity and stressors - abundance). Meta-analytic models included the effect of stressor intensity (standardized levels) as a covariate.
Appendix 2—figure 2
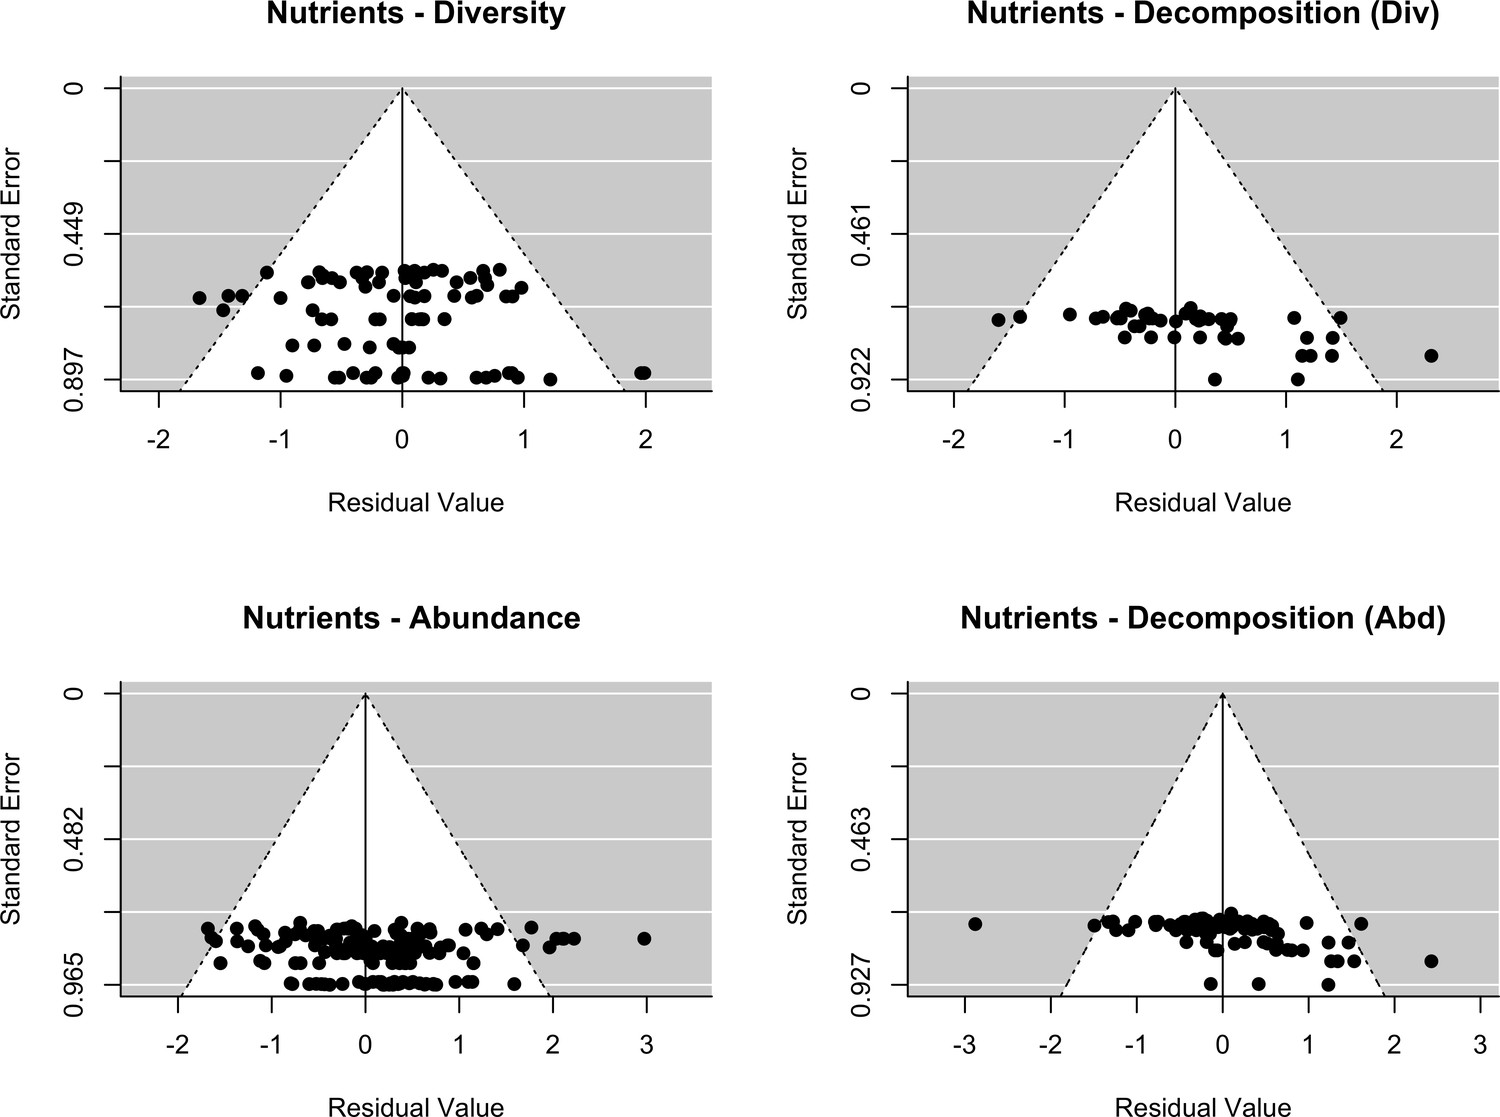
Assessment of publication bias.
Nutrients: Funnel plots of each response variables (decomposer diversity, abundance and decomposition) in the two datasets (stressors - diversity and stressors - abundance). Meta-analytic models included the effect of nutrient intensity (standardized levels) as a covariate.
Tables
Appendix 1—table 1
Environmental quality criteria for stressors and nutrients.
Quality criteria were used to standardized the intensity levels of the different chemical stressors across studies included in the meta-analysis.
| System | Chemical or nutrient | Unit1 | Unit2 | Quality criteria | Citation |
|---|---|---|---|---|---|
| aquatic | fungicide: pyrimethanil | µg/l | - | 0.69 | Abelho M, Martins TF, Shinn C, Moreira-Santos M, Ribeiro R. 2016. Effects of the fungicide pyrimethanil on biofilm and organic matter processing in outdoor lentic mesocosms. Ecotoxicology 25:121–131. |
| aquatic | fungicide: tebuconazole | µg/l | - | 0.10 | https://echa.europa.eu/documents/10162/41e9d7aa-4559-f904-9cb5-0a0d5f0d6445 |
| aquatic | As | µg/l | - | 13.00 | https://echa.europa.eu/brief-profile/-/briefprofile/100.028.316 |
| aquatic | Al | µg/l | - | 87.00 | https://www.govinfo.gov/content/pkg/FR-2018-12-21/pdf/2018-27745.pdf |
| aquatic | Cu | µg/l | - | 10.10 | https://echa.europa.eu/brief-profile/-/briefprofile/100.124.825 |
| aquatic | Zn | µg/l | - | 20.60 | https://echa.europa.eu/brief-profile/-/briefprofile/100.028.341 |
| aquatic | Fe | µg/l | - | 1000.00 | https://www.epa.gov/wqc/national-recommended-water-quality-criteria-aquatic-life-criteria-table |
| aquatic | Mn | µg/l | - | 1000.00 | https://www.epa.gov/wqc/national-recommended-water-quality-criteria-aquatic-life-criteria-table |
| aquatic | Hg | µg/l | - | 0.06 | https://echa.europa.eu/brief-profile/-/briefprofile/100.028.278 |
| aquatic | Cd | µg/l | - | 0.19 | https://echa.europa.eu/brief-profile/-/briefprofile/100.028.320 |
| aquatic | insecticide: chlorpyrifos | µg/l | - | 0.08 | https://www.epa.gov/wqc/national-recommended-water-quality-criteria-aquatic-life-criteria-table |
| aquatic | phenanthrene | µg/l | - | 51.40 | Wu, J. Y., Yan, Z. G., Liu, Z. T., Liu, J. D., Liang, F., Wang, X. N., & Wang, W. L. (2015). Development of water quality criteria for phenanthrene and comparison of the sensitivity between native and non-native species. Environmental Pollution, 196, 141-146. |
| aquatic | Zn | mg/kg | - | 117.80 | https://echa.europa.eu/brief-profile/-/briefprofile/100.028.341 |
| aquatic | Cd | mg/kg | - | 1.80 | https://echa.europa.eu/brief-profile/-/briefprofile/100.028.320 |
| aquatic | Hg | mg/kg | - | 9.30 | https://echa.europa.eu/brief-profile/-/briefprofile/100.028.278 |
| aquatic | Pb | mg/kg | - | 186.00 | https://echa.europa.eu/brief-profile/-/briefprofile/100.028.273 |
| terrestrial | Cu | mg/kg | - | 106.35 | https://echa.europa.eu/brief-profile/-/briefprofile/100.124.825 |
| terrestrial | Zn | mg/kg | - | 35.60 | https://echa.europa.eu/brief-profile/-/briefprofile/100.028.341 |
| terrestrial | Ni | mg/kg | - | 29.90 | https://echa.europa.eu/brief-profile/-/briefprofile/100.028.283 |
| terrestrial | Mn | mg/kg | - | 3.40 | https://echa.europa.eu/brief-profile/-/briefprofile/100.028.277 |
| terrestrial | Hg | µg/kg | - | 22.00 | https://echa.europa.eu/brief-profile/-/briefprofile/100.028.278 |
| terrestrial | Pb | mg/kg | - | 212.00 | https://echa.europa.eu/brief-profile/-/briefprofile/100.028.273 |
| terrestrial | Cd | mg/kg | - | 0.90 | https://echa.europa.eu/brief-profile/-/briefprofile/100.028.320 |
| terrestrial | insecticide: chlorpyrifos | kg/ha | - | 1.25 | Iwai CB, Noller B. 2010. Ecotoxicological assessment of diffuse pollution using biomonitoring tool for sustainable land use in Thailand. Journal of Environmental Sciences 22:858–863. |
| terrestrial | insecticide: endosulfan | kg/ha | - | 1.25 | Iwai CB, Noller B. 2010. Ecotoxicological assessment of diffuse pollution using biomonitoring tool for sustainable land use in Thailand. Journal of Environmental Sciences 22:858–863. |
| terrestrial | herbicide: atrazine | kg/ha | - | 1.88 | Iwai CB, Noller B. 2010. Ecotoxicological assessment of diffuse pollution using biomonitoring tool for sustainable land use in Thailand. Journal of Environmental Sciences 22:858–863. |
| terrestrial | insecticide: carbofuran | kg/ha | - | 31.25 | Iwai CB, Noller B. 2010. Ecotoxicological assessment of diffuse pollution using biomonitoring tool for sustainable land use in Thailand. Journal of Environmental Sciences 22:858–863. |
| aquatic | pesticide mixture | arbitrary | - | 1.00 | Talk A. 2016. Effects of multiple butLow pesticide loads on aquatic fungal communities colonizing leaf litter. Journal of EnvironmentalSciences 46:116–125. |
| terrestrial | herbicide: glyphosate | kg/ha | - | 4.32 | European Food Safety Authority (EFSA). Conclusion on the peer review of the pesticide risk assessment of the active substance glyphosate. EFSA Journal 13, (2015). |
| terrestrial | herbicide: simazine | kg/ha | - | 0.10 | https://ec.europa.eu/food/plant/pesticides/eu-pesticides-database/public/?event = activesubstance.detail and language = EN and selectedID = 1853 |
| aquatic | pesticide mixture | sum or max of TU (toxic units) | - | −3.50 | Schäfer, R. B., Caquet, T., Siimes, K., Mueller, R., Lagadic, L., & Liess, M. (2007). Effects of pesticides on community structure and ecosystem functions in agricultural streams of three biogeographical regions in Europe. Science of the Total Environment, 382(2-3), 272-285. |
| aquatic | DIN | mg/l | N | 3.05 | Ministère de l’Environnement, de l’Énergie et de la Mer. Guide technique Relatif à l’évaluation de l’état des eaux de surface continen- tales (cours d’eau, canaux, plans d’eau). (2016). |
| aquatic | NH4+ | mg/l | NH4 | 0.10 | Ministère de l’Environnement, de l’Énergie et de la Mer. Guide technique Relatif à l’évaluation de l’état des eaux de surface continen- tales (cours d’eau, canaux, plans d’eau). (2016). |
| aquatic | NO3 | mg/l | NO3 | 10.00 | Ministère de l’Environnement, de l’Énergie et de la Mer. Guide technique Relatif à l’évaluation de l’état des eaux de surface continen- tales (cours d’eau, canaux, plans d’eau). (2016). |
| aquatic | NO2 | mg/l | NO2 | 0.10 | Ministère de l’Environnement, de l’Énergie et de la Mer. Guide technique Relatif à l’évaluation de l’état des eaux de surface continen- tales (cours d’eau, canaux, plans d’eau). (2016). |
| aquatic | Total_N | mg/l | N | 0.67 | US EPA, O. Water Quality Criteria. US EPA (2013). Available at: https://www.epa.gov/wqc. (Accessed: 7th January 2019) |
| aquatic | SRP | mg/l | PO43 | 0.10 | Guide technique Relatif à l’évaluation de l’état des eaux de surface continen- tales (cours d’eau, canaux, plans d’eau). (Ministère de l’Environnement, de l’Énergie et de la Mer, 2016). |
| aquatic | Total_P | mg/l | P | 0.05 | Guide technique Relatif à l’évaluation de l’état des eaux de surface continen- tales (cours d’eau, canaux, plans d’eau). (Ministère de l’Environnement, de l’Énergie et de la Mer, 2016). |
| terrestrial | N deposition | kg/ha/yr | N | 20.00 | Pardo, L.H., Fenn, M.E., Goodale, C.L., Geiser, L.H., Driscoll, C.T., Allen, E.B., Baron, J.S., Bobbink, R., Bowman, W.D., Clark, C.M., Emmett, B., Gilliam, F.S., Greaver, T.L., Hall, S.J., Lilleskov, E.A., Liu, L., Lynch, J.A., Nadelhoffer, K.J., Perakis, S.S., Robin-Abbott, M.J., Stoddard, J.L., Weathers, K.C. and Dennis, R.L. (2011), Effects of nitrogen deposition and empirical nitrogen critical loads for ecoregions of the United States. Ecological Applications, 21: 3049-3082. doi:10.1890/10-2341.1; derived critical loads (i.e. level of deposition below which no detrimental ecological effect occurs over the long term according to current knowledge) from empirical data for various (plant) species and ecosystems |
| terrestrial | P fertilization | kg/ha/yr | P | 35.00 | Amery, F., & Schoumans, O. F. (2014). Agricultural phosphorus legislation in Europe. Institute for Agricultural and Fisheries Research (ILVO). |
Appendix 2—table 1
Assessment of publication bias.
Results from Egger’s regressions showing the intercepts, standard error (SE) and p-value of regressions between standard normal deviate of each response variable (effect sizes) and the inverse of their standard errors. Models also included stressor or nutrient intensity as a covariate.
| Dataset | Variable | Publication bias p | Publication bias | Intercept | SE |
|---|---|---|---|---|---|
| Stressors - Biodiv | Biodiversity | 0.10 | no | −1.36 | 0.83 |
| Stressors - Biodiv | Decomposition | 0.58 | no | −1.07 | 1.94 |
| Stressors - Abdc | Abundance | 0.14 | no | −1.49 | 1.02 |
| Stressors - Abdc | Decomposition | 0.68 | no | −0.67 | 1.60 |
| Nutrients - Biodiv | Biodiversity | 0.37 | no | 0.76 | 0.86 |
| Nutrients - Biodiv | Decomposition | 0.19 | no | 3.35 | 2.55 |
| Nutrients - Abdc | Abundance | 0.08 | no | 1.21 | 0.70 |
| Nutrients - Abdc | Decomposition | <0.001 | pub. bias | 5.31 | 1.45 |
Appendix 2—table 2
First level meta-analysis comparing the effects of chemical stressors and nutrient enrichment.
Results of Wald-type chi-square tests comparing the grand mean effect sizes of the three response variables (decomposer diversity, abundance and litter decomposition) between chemical stressors and nutrient enrichment.
| Response | QM | Df | N | p-value |
|---|---|---|---|---|
| Diversity | 25.65 | 2 | 174 | <0.001 |
| Abundance | 7.92 | 2 | 424 | 0.019 |
| Litter decomposition | 17.61 | 2 | 165 | <0.001 |
Appendix 2—table 3
Summary table of structural equation modelling (SEM) analysis.
Unstandardized path coefficients from SEMs for the four datasets: Stressors - Biodiversity (Biodiv), Stressors - Abundance (Abdc), Nutrients - Biodiversity and Nutrients, Abundance. SEMs also incorporated categorical predictors (study type, taxonomic group and diversity metric, see Materials and methods).
| Dataset | Response | Predictor | Estimate | SE | Crit.value | Df | p-Value |
|---|---|---|---|---|---|---|---|
| Stressors - Biodiv | Decomposition | Diversity | 0.42 | 0.17 | 2.50 | 19 | 0.022 |
| Stressors - Biodiv | Decomposition | Stressor intensity | −0.02 | 0.04 | −0.47 | 19 | 0.643 |
| Stressors - Biodiv | Diversity | Stressor intensity | −0.10 | 0.04 | −2.44 | 18 | 0.025 |
| Stressors - Abdc | Decomposition | Abundance | 0.24 | 0.08 | 2.97 | 25 | 0.007 |
| Stressors - Abdc | Decomposition | Stressor intensity | −0.01 | 0.03 | −0.41 | 25 | 0.683 |
| Stressors - Abdc | Abundance | Stressor intensity | 0.00 | 0.05 | 0.03 | 25 | 0.977 |
| Nutrients - Biodiv | Decomposition | Diversity | 0.01 | 0.11 | 0.06 | 20 | 0.951 |
| Nutrients - Biodiv | Decomposition | Nutrient intensity | −0.08 | 0.06 | −1.21 | 20 | 0.239 |
| Nutrients - Biodiv | Diversity | Nutrient intensity | −0.25 | 0.07 | −3.51 | 19 | 0.002 |
| Nutrients - Abdc | Decomposition | Abundance | 0.08 | 0.10 | 0.76 | 44 | 0.451 |
| Nutrients - Abdc | Decomposition | Nutrient intensity | −0.12 | 0.05 | −2.16 | 44 | 0.037 |
| Nutrients - Abdc | Abundance | Nutrient intensity | −0.06 | 0.06 | −1.00 | 44 | 0.321 |
Appendix 2—table 4
Main effects of categorical predictors on decomposer diversity, abundance and decomposition in the four datasets: Stressors - Biodiversity (Biodiv), Stressors - Abundance (Abdc), Nutrients - Biodiversity and Nutrients, Abundance.
Results are QM statistics and associated p-values of the second-level meta-analyses.
| Dataset | Response | Predictor | QM | p-value |
|---|---|---|---|---|
| Stressors - Biodiv | Diversity | Taxonomic group | 4.80 | 0.028 |
| Stressors - Abdc | Abundance | Taxonomic group | 10.10 | 0.001 |
| Nutrients - Biodiv | Diversity | Taxonomic group | 12.77 | <0.001 |
| Nutrients - Abdc | Abundance | Taxonomic group | 4.53 | 0.033 |
| Stressors - Biodiv | Diversity | Study type | 1.89 | 0.169 |
| Stressors - Abdc | Abundance | Study type | 0.92 | 0.338 |
| Nutrients - Biodiv | Diversity | Study type | 0.24 | 0.625 |
| Nutrients - Abdc | Abundance | Study type | 0.98 | 0.323 |
| Stressors - Biodiv | Diversity | Diversity metric | 1.67 | 0.196 |
| Nutrients - Biodiv | Diversity | Diversity metric | 2.35 | 0.125 |
| Stressors - Biodiv | Decomposition | Study type | 0.16 | 0.693 |
| Stressors - Abdc | Decomposition | Study type | 1.85 | 0.174 |
| Nutrients - Biodiv | Decomposition | Study type | 2.69 | 0.101 |
| Nutrients - Abdc | Decomposition | Study type | 0.18 | 0.674 |
Appendix 3—table 1
Results of mediation tests from structural equation modeling (SEM) analysis based on data without approximated standard deviations.
C statistic and associated p-value for SEM without the path from biodiversity or abundance to decomposition for the four datasets: Stressors - Diversity, Stressors - Abundance, Nutrients - Diversity and Nutrients - Abundance. ΔAIC is the difference in AIC score between models with and without biodiversity- or abundance-mediated effects.
| Dataset | C statistic | Df | p-value | AIC | No. of studies | N |
|---|---|---|---|---|---|---|
| Stressors, Biodiv | 12.42 | 6 | 0.053 | −8.32 | 16 | 58 |
| Stressors, Abdc | 10.15 | 4 | 0.038 | −6.82 | 23 | 216 |
| Nutrient, Biodiv | 13.33 | 6 | 0.038 | −1.46 | 21 | 67 |
| Nutrient, Abdc | 3.82 | 4 | 0.432 | −0.12 | 32 | 127 |
Appendix 3—table 2
Summary table of structural equation modeling (SEM) analysis based on data without approximated standard deviations.
Standardized (Std.est.) and unstandardized estimate (Est.) path coefficients from SEMs for the four datasets.
| Dataset | Response | Predictor | Std.est. | Est. | SE | Crit.value | Df | p-value |
|---|---|---|---|---|---|---|---|---|
| Stress., Biodiv | Decomposition | Diversity | 0.52 | 0.50 | 0.16 | 3.16 | 12 | 0.008 |
| Stres., Biodiv | Decomposition | Stressor intensity | −0.26 | −0.05 | 0.03 | −1.54 | 12 | 0.148 |
| Stress., Biodiv | Diversity | Stressor intensity | −0.39 | −0.08 | 0.04 | −1.89 | 11 | 0.085 |
| Stress., Abdc | Decomposition | Abundance | 0.40 | 0.27 | 0.09 | 2.91 | 19 | 0.009 |
| Stress., Abdc | Decomposition | Stressor intensity | −0.11 | −0.02 | 0.03 | −0.77 | 19 | 0.450 |
| Stress., Abdc | Abundance | Stressor intensity | 0.08 | 0.03 | 0.06 | 0.46 | 19 | 0.649 |
| Nut., Biodiv | Decomposition | Diversity | −0.04 | −0.04 | 0.12 | −0.35 | 10 | 0.732 |
| Nut., Biodiv | Decomposition | Nutrient intensity | −0.31 | −0.14 | 0.09 | −1.52 | 10 | 0.161 |
| Nut., Biodiv | Diversity | Nutrient intensity | −0.49 | −0.23 | 0.10 | −2.39 | 9 | 0.040 |
| Nut., Abdc | Decomposition | Abundance | 0.05 | 0.04 | 0.13 | 0.33 | 29 | 0.742 |
| Nut., Abdc | Decomposition | Nutrient intensity | −0.26 | −0.12 | 0.06 | −1.91 | 29 | 0.066 |
| Nut., Abdc | Abundance | Nutrient intensity | −0.20 | −0.10 | 0.07 | −1.40 | 29 | 0.173 |
Appendix 3—table 3
Results of mediation tests from structural equation modeling (SEM) analysis based on data excluding extreme values of effect sizes.
C statistic and associated p-value for SEM without the path from biodiversity or abundance to decomposition for the four datasets: Stressors - Diversity, Stressors - Abundance, Nutrients - Diversity and Nutrients - Abundance. ΔAIC is the difference in AIC score between models with and without biodiversity- or abundance-mediated effects.
| Dataset | C statistic | Df | p-value | AIC | No. of studies | N |
|---|---|---|---|---|---|---|
| Stressors, Biodiv | 10.18 | 6 | 0.117 | −6.71 | 22 | 94 |
| Stressors, Abdc | 7.39 | 4 | 0.117 | −4.23 | 27 | 254 |
| Nutrient, Biodiv | 14.80 | 6 | 0.022 | −4.85 | 26 | 93 |
| Nutrient, Abdc | 2.74 | 4 | 0.603 | 0.15 | 35 | 159 |
Appendix 3—table 4
Summary table of structural equation modelling (SEM) analysis based on data excluding extreme values of effect sizes.
Standardized (Std.est.) and unstandardized estimate (Est.) path coefficients from SEMs for the four datasets.
| Dataset | Response | Predictor | Std.est. | Est. | SE | Crit.value | Df | p-value |
|---|---|---|---|---|---|---|---|---|
| Stress., Biodiv | Decomposition | Diversity | 0.41 | 0.40 | 0.18 | 2.20 | 18 | 0.041 |
| Stress., Biodiv | Decomposition | Stressor intensity | −0.04 | −0.01 | 0.04 | −0.24 | 18 | 0.814 |
| Stress., Biodiv | Diversity | Stressor intensity | −0.44 | −0.10 | 0.04 | −2.75 | 17 | 0.014 |
| Stress., Abdc | Decomposition | Abundance | 0.30 | 0.24 | 0.11 | 2.24 | 23 | 0.035 |
| Stress., Abdc | Decomposition | Stressor intensity | 0.05 | 0.01 | 0.03 | 0.35 | 23 | 0.731 |
| Stress., Abdc | Abundance | Stressor intensity | 0.00 | 0.00 | 0.04 | −0.02 | 23 | 0.980 |
| Nut., Biodiv | Decomposition | Diversity | 0.00 | 0.00 | 0.11 | 0.02 | 19 | 0.986 |
| Nut., Biodiv | Decomposition | Nutrient intensity | −0.18 | −0.08 | 0.06 | −1.30 | 19 | 0.210 |
| Nut., Biodiv | Diversity | Nutrient intensity | −0.53 | −0.24 | 0.07 | −3.36 | 18 | 0.003 |
| Nut., Abdc | Decomposition | Abundance | 0.00 | 0.00 | 0.09 | 0.04 | 37 | 0.968 |
| Nut., Abdc | Decomposition | Nutrient intensity | −0.38 | −0.13 | 0.04 | −3.26 | 37 | 0.002 |
| Nut., Abdc | Abundance | Nutrient intensity | −0.24 | −0.09 | 0.05 | −1.73 | 37 | 0.092 |
Appendix 3—table 5
Results of mediation tests from structural equation modeling (SEM) analysis based on data using log-response ratio as an effect size.
C statistic and associated p-value for SEM without the path from biodiversity or abundance to decomposition for the four datasets: Stressors - Diversity, Stressors - Abundance, Nutrients - Diversity and Nutrients - Abundance. ΔAIC is the difference in AIC score between models with and without biodiversity- or abundance-mediated effects.
| Dataset | C statistic | Df | p-value | AIC | No. of studies | N |
|---|---|---|---|---|---|---|
| Stressors, Biodiv | 4.11 | 6 | 0.662 | −0.02 | 22 | 70 |
| Stressors, Abdc | 5.59 | 4 | 0.232 | −2.22 | 37 | 150 |
| Nutrient, Biodiv | 8.03 | 6 | 0.236 | −2.08 | 14 | 78 |
| Nutrient, Abdc | 3.41 | 4 | 0.492 | −0.44 | 21 | 307 |
Appendix 3—table 6
Summary table of structural equation modeling (SEM) analysis based on data using log-response ratio as an effect size.
Standardized (Std.est.) and unstandardized estimate (Est.) path coefficients from SEMs for the four datasets.
| Dataset | Response | Predictor | Std.est | Est. | SE | Crit.value | Df | p-value |
|---|---|---|---|---|---|---|---|---|
| Stress., Biodiv | Decomposition | Diversity | 0.18 | 0.12 | 0.15 | 0.80 | 15 | 0.437 |
| Stress., Biodiv | Decomposition | Stressor intensity | −0.24 | −0.05 | 0.04 | −1.47 | 15 | 0.163 |
| Stress., Biodiv | Diversity | Stressor intensity | −0.35 | −0.12 | 0.03 | −4.17 | 15 | 0.001 |
| Stress., Abdc | Decomposition | Abundance | 0.14 | 0.04 | 0.05 | 0.86 | 28 | 0.396 |
| Stress., Abdc | Decomposition | Stressor intensity | 0.09 | 0.02 | 0.04 | 0.55 | 28 | 0.586 |
| Stress., Abdc | Abundance | Stressor intensity | −0.14 | −0.11 | 0.11 | −1.03 | 28 | 0.312 |
| Nut., Biodiv | Decomposition | Diversity | 0.29 | 0.19 | 0.10 | 1.80 | 14 | 0.094 |
| Nut., Biodiv | Decomposition | Nutrient intensity | −0.15 | −0.07 | 0.08 | −0.96 | 14 | 0.352 |
| Nut., Biodiv | Diversity | Nutrient intensity | −0.20 | −0.16 | 0.07 | −2.11 | 14 | 0.054 |
| Nut., Abdc | Decomposition | Abundance | 0.06 | 0.04 | 0.06 | 0.59 | 42 | 0.559 |
| Nut., Abdc | Decomposition | Nutrient intensity | −0.36 | −0.16 | 0.05 | −3.08 | 42 | 0.004 |
| Nut., Abdc | Abundance | Nutrient intensity | −0.01 | 0.00 | 0.08 | −0.08 | 42 | 0.935 |
Additional files
Download links
A two-part list of links to download the article, or parts of the article, in various formats.
Downloads (link to download the article as PDF)
Open citations (links to open the citations from this article in various online reference manager services)
Cite this article (links to download the citations from this article in formats compatible with various reference manager tools)
Biodiversity mediates the effects of stressors but not nutrients on litter decomposition
eLife 9:e55659.
https://doi.org/10.7554/eLife.55659


