MicroRNAs of the miR-17~92 family maintain adipose tissue macrophage homeostasis by sustaining IL-10 expression
- Institute for Immunology and School of Medicine, Tsinghua University, China
- Tsinghua-Peking Centre for Life Sciences, China
- Beijing Key Laboratory for Immunological Research on Chronic Diseases, China
- Division of Infectious Diseases, Allergy and Immunology, Department of Internal Medicine, Saint Louis University School of Medicine, Saint Louis University, United States
Figures
Figure 1 with 3 supplements

miR-17~92 family miRNAs protect mice from obesity.
(A) A representative photograph (left panel) and body weight (right panel) of the Lyz2-Cre (WT) and miR-106a~363−/− miR-106b~25−/− miR-17~92flox/flox Lyz2-Cre (TKO) mice at the age of 30 weeks, n = 14–16 per group. (B and C) Visceral adipose tissue (VAT) weight (B) and VAT percentage of body weight (C) of WT and TKO mice at the age of 30 weeks. (D and E) Total adipose tissue weight (D) and its percentage of body weight (E) of WT and TKO mice were measured by scanning the whole mice with magnetic resonance imaging (MRI) machine at the age of 30 weeks. (F–J) WT and TKO mice were fed with a high-fat diet (HFD) and were sacrificed on 13–20 weeks post HFD. Body weight of each mouse was measured weekly, n = 8 per group (F); VAT weight (G), VAT percentage of body weight (H), total adipose tissue weight (I), and its percentage of body weight (J) were measured. (K–O) C57BL/6J mice were irradiated and transferred with WT (WT → WT) or TKO (TKO → WT) bone marrows (BMs). Then these BM chimeras were fed with an HFD and were sacrificed on 16–28 weeks post HFD. Body weight of each mouse was measured weekly, n = 7–8 per group (K); VAT weight (L), VAT percentage of body weight (M), total adipose tissue weight (N), and its percentage of body weight (O) were measured. *p<0.05, **p<0.01, ***p<0.001, and ****p<0.0001 (unpaired Student’s t-test). Data are pooled from four (A–C), two (D, E, F, K, L, and M), or five (G and H) independent experiments (mean ± s.e.m.), or are representative of one independent experiment (I, J, N, and O).
Figure 1—figure supplement 1
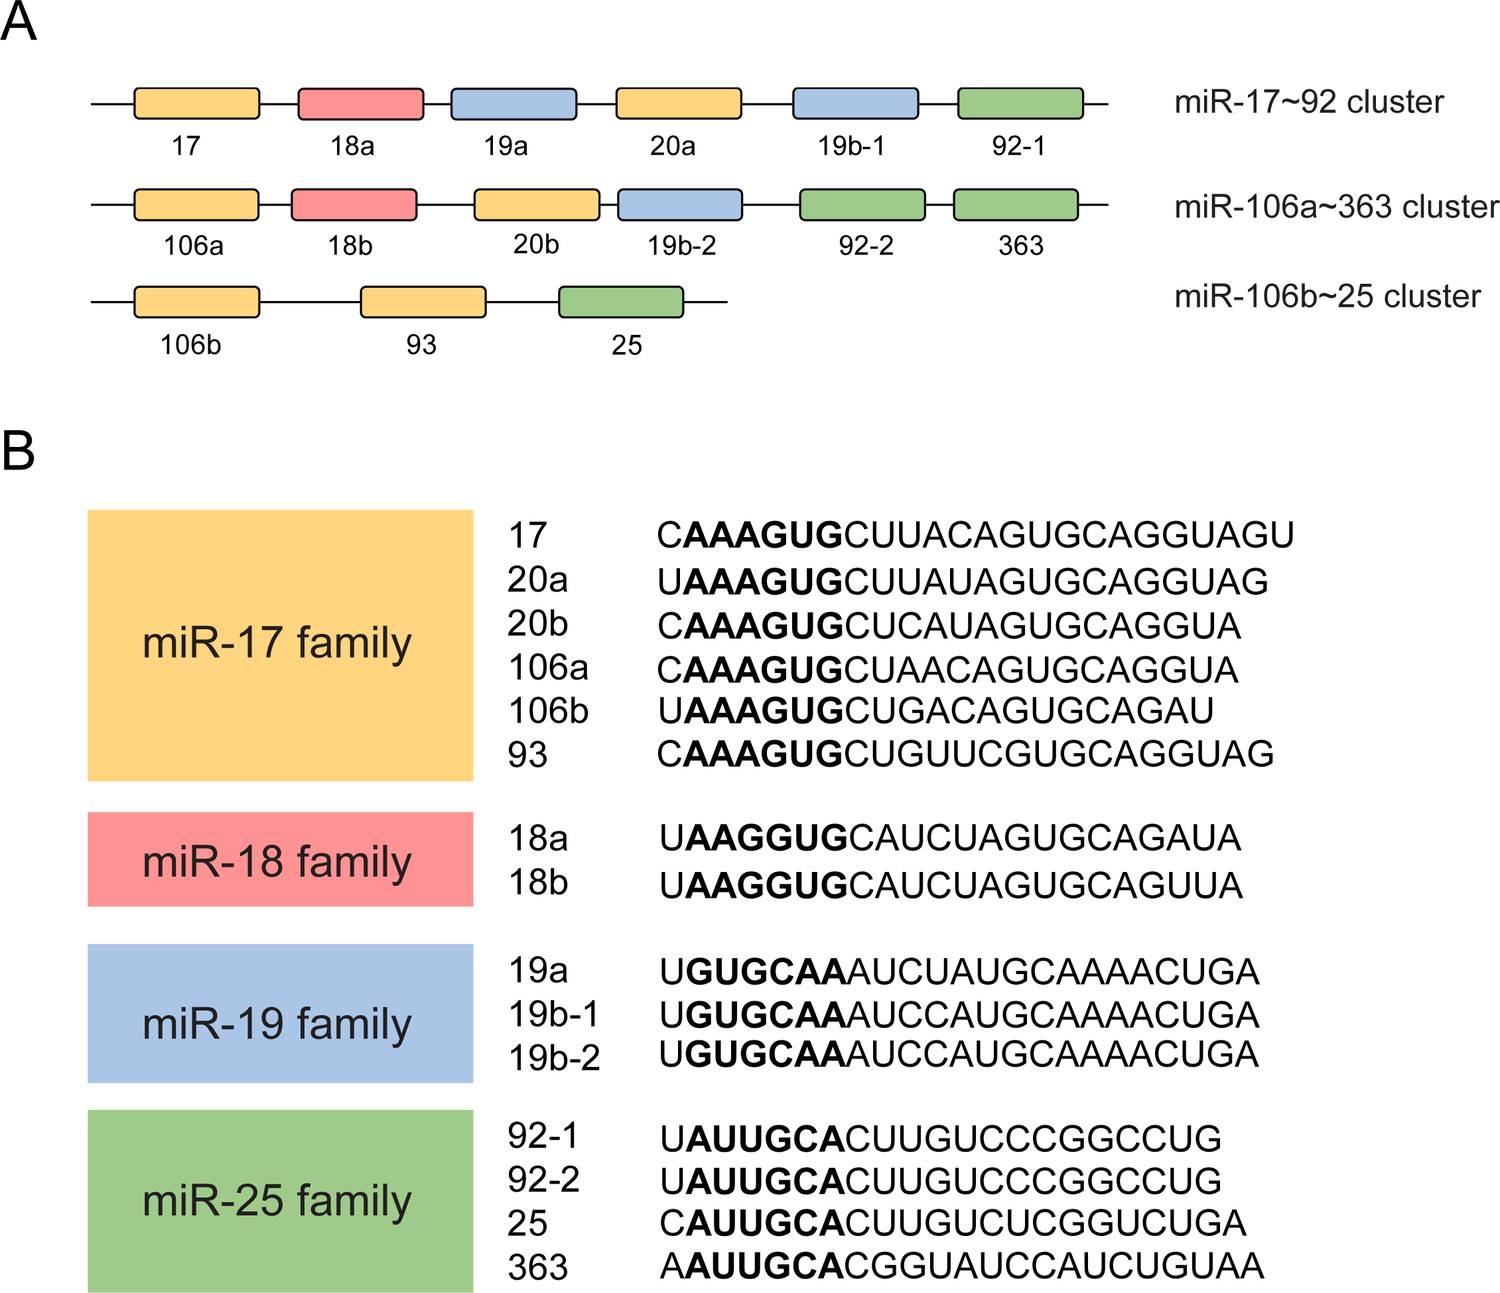
Schematic representation of the miR-17~92 family miRNAs.
(A and B) Schematic representation of three miRNA clusters of miR-17~92 family miRNAs (A) and their target sequences (B). The mature miRNAs in different families are shown in different colors. Yellow: members of the miR-17 family; Red: members of the miR-18 family; Blue: members of the miR-19 family; Green: members of the miR-25 family. The ‘seed region’ of each mature miRNA is shown in bold format.
Figure 1—figure supplement 2

The miR-17~92 family miRNAs are efficiently deleted in TKO BMDMs.
(A–C) qPCR analysis of various mature miRNAs (horizontal axes) in the miR-17~92 cluster (A), miR-106a~363 cluster (B), and miR-106b~25 cluster (C) in Lyz2-Cre (WT) and miR-106a~363−/− miR-106b~25−/− miR-17~92flox/flox Lyz2-Cre (TKO) BMDMs; results are presented as relative expression normalized to the control small RNA U6. Data are representative of two independent experiments (mean + s.d.).
Figure 1—figure supplement 3
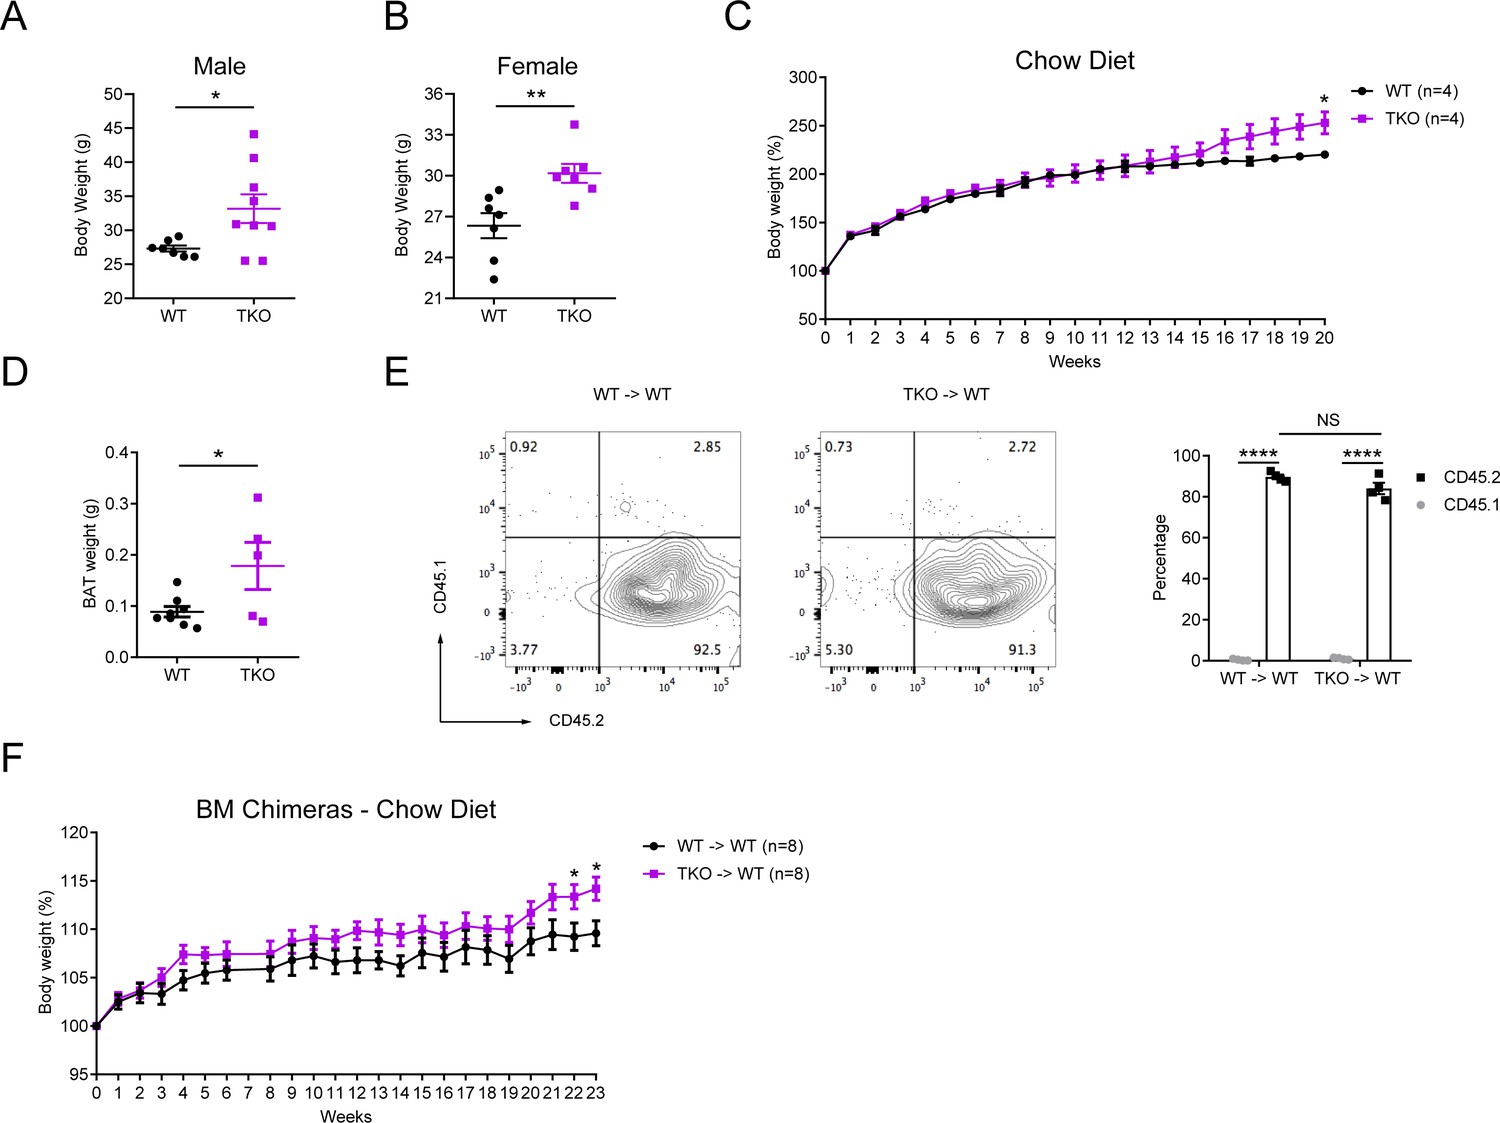
miR-17~92 family miRNAs play an important role in protection of mice from obesity.
(A–B) Body weights of the Lyz2-Cre (WT) and TKO male (A) or female (B) mice at the age of 30 weeks (n = 7–9 per group). (C) Body weights of WT and TKO mice fed with regular chow diet, n = 4 per group. (D) Brown adipose tissue (BAT) weights of WT and TKO mice at the age of 30 weeks. (E) CD45.1 mice were irradiated and transferred with 106 donor bone marrow (BM) cells from WT (WT → WT) or TKO (TKO → WT) mice. Six weeks post BM transfer, CD45.1 and CD45.2 expression on adipose tissue macrophages (ATMs) was analyzed by flow cytometry. One representative experiment was shown in the left panel and cumulative data were shown in the right panel (n = 4 per group). (F) Body weights of chimeric mice transferred with WT (WT → WT) or TKO (TKO → WT) BMs fed with regular chow diet (n = 8 per group). Each symbol represents an individual mouse. *p<0.05, **p<0.01 and ****p<0.0001 (unpaired Student’s t-test). Data are representative or are pooled from two (A, B, D, and E) or one (C and F) independent experiments (mean ± sem).
Figure 2 with 4 supplements
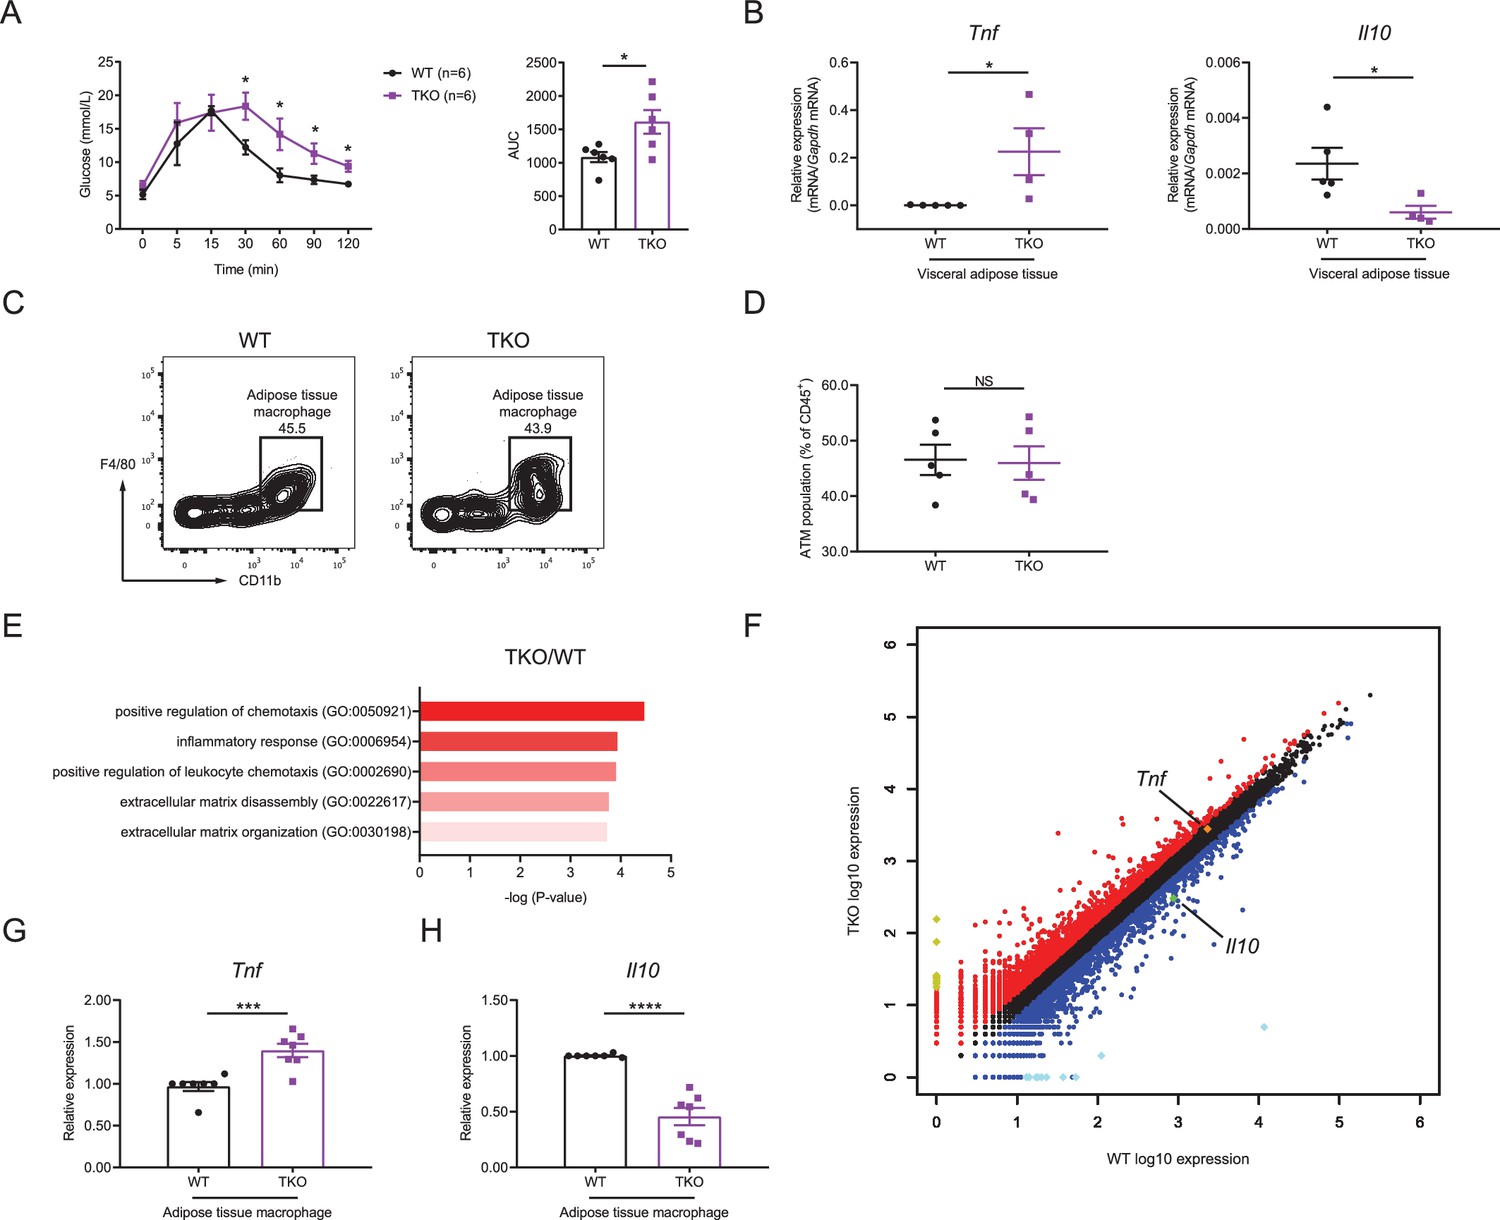
miR-17~92 family miRNAs maintain adipose tissue macrophage (ATM) homeostasis.
(A) Glucose tolerance test in WT and TKO mice (left panel); area under curve (AUC) of left panel (right panel), n = 6 per group. (B) qPCR analysis of Tnf and Il10 mRNA in visceral adipose tissue of WT and TKO mice. (C and D) Flow cytometry of ATM population in WT and TKO mice. (C) A representative figure showing the ATM population of CD45+ cells; (D) cumulative quantification of ATM population as in (C). (E and F) ATMs were sorted from WT and TKO mice fed with regular chow diet, RNA samples of ATMs were extracted and pooled from two mice, and genome-wide RNA profiling analyses were performed. (E) Gene ontology (GO) analysis of WT and TKO ATM RNA-seq datasets showing the enriched GO terms in TKO ATMs; (F) RNA-seq analysis showing RNA expression in TKO ATMs versus those in WT cells. RNAs upregulated in TKO ATMs were colored red, whereas RNAs downregulated were colored blue, gene Tnf was pointed out and colored orange, and gene Il10 was pointed out and colored green. Top 10 upregulated genes (Ighg2b, Gm11843, Dcdc2a, Mmp7, Slc38a5, Tenm2, Cdh16, Ptn, Ighv1-42, and Nanp) were colored yellow and top 10 downregulated genes (Csf2ra, Zfp125, Cxcl5, Ighv14-3, Igkv4-59, Igkv6-20, Igkv16-104, Fth-ps2, Igkv4-91, and B230303A05Rik) were colored bright blue. (G and H) qPCR analysis of Tnf (G) and Il10 (H) mRNA in ATMs of WT and TKO mice. Results were shown as relative expression normalized to those expressions in one WT mice of each experiment. NS, not significant (p>0.05); *p<0.05, ***p<0.001, and ****p<0.0001 (unpaired Student’s t-test). Data are representative of three independent experiments (C) or are pooled from two (A), three (B and D), or five (G and H) independent experiments (mean ± sem).
Figure 2—figure supplement 1
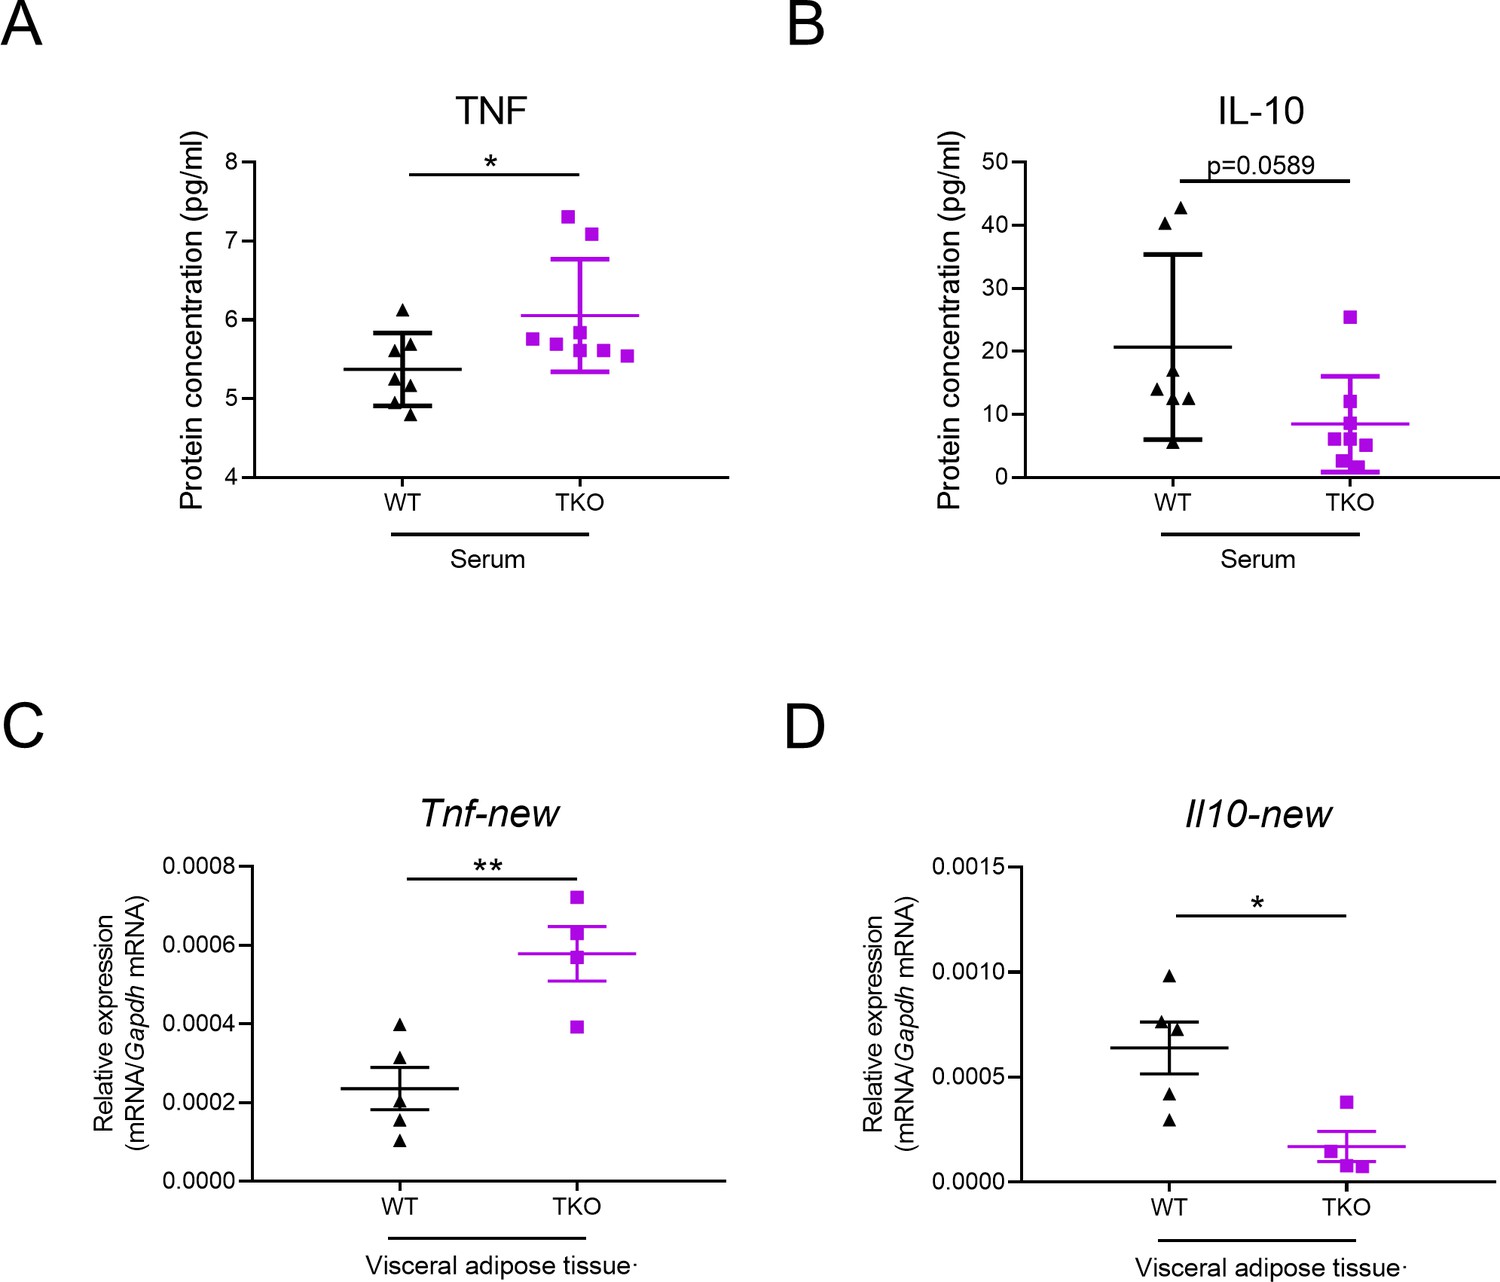
miR-17~92 family miRNAs inhibit TNF and promote IL-10 expression in adipose tissue.
(A and B) Protein levels of TNF (A) and IL-10 (B) in serum of WT and TKO mice measured by ELISA. (C and D) qPCR analysis of Tnf (C) and Il10 (D) mRNA with additional primer pairs in WT and TKO adipose tissues. *p<0.05, **p<0.01 (unpaired Student’s t-test). Data are pooled from three (A–D) independent experiments (mean ± s.e.m.).
Figure 2—figure supplement 2
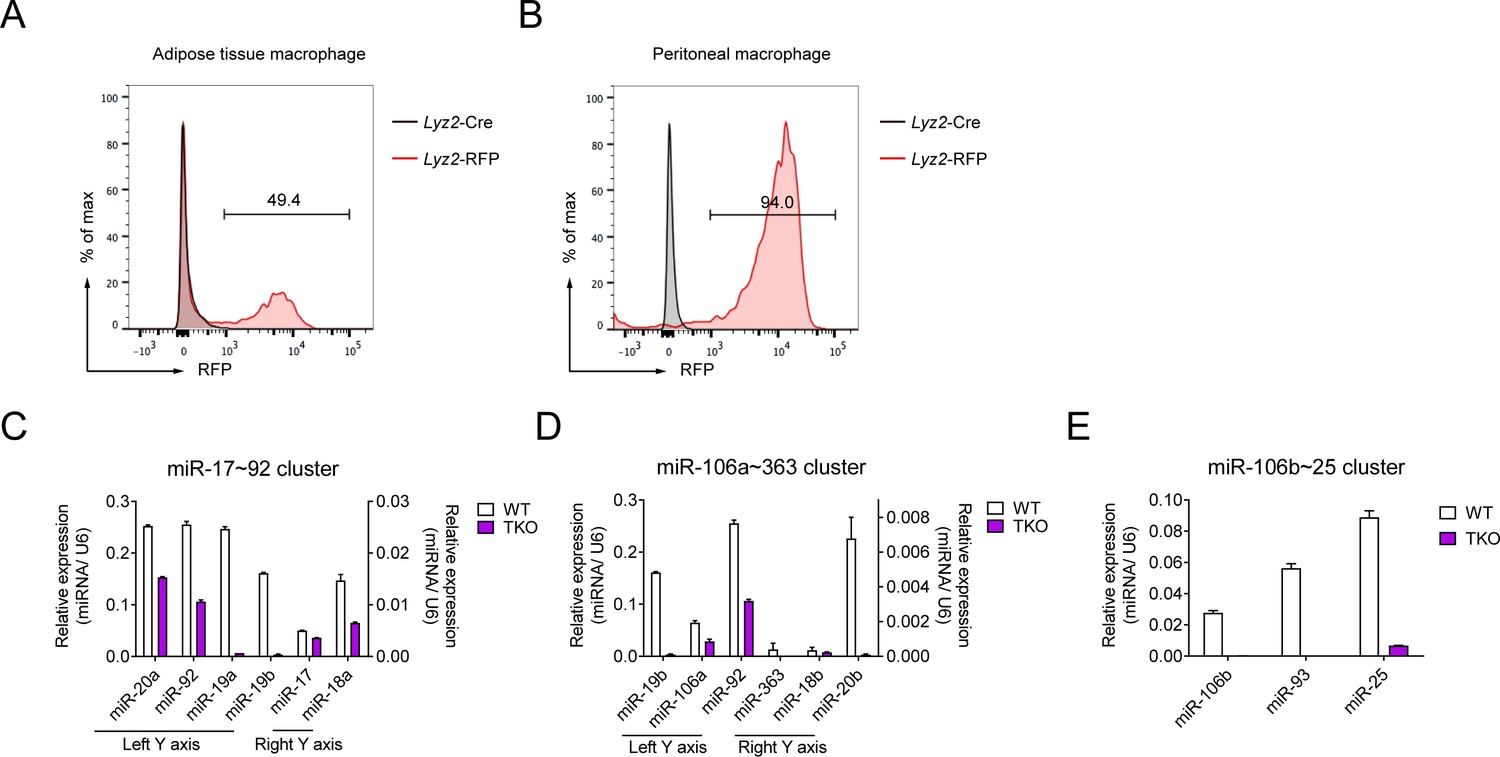
The miR-17~92 family miRNAs are efficiently deleted in TKO adipose tissue macrophages (ATMs).
(A and B) Flow cytometry analysis of RFP expression in ATMs (A) and peritoneal macrophages (B, positive control) from Lyz2-Cre and Lyz2-RFP mice. (C–E) qPCR analysis of various mature miRNAs (horizontal axes) in the miR-17~92 cluster (C), miR-106a~363 cluster (D), and miR-106b~25 cluster (E) in Lyz2-Cre (WT) andTKO ATMs; results are presented as relative expression normalized to the control small RNA U6. Data are representative of two independent experiments (mean + s.d.).
Figure 2—figure supplement 3
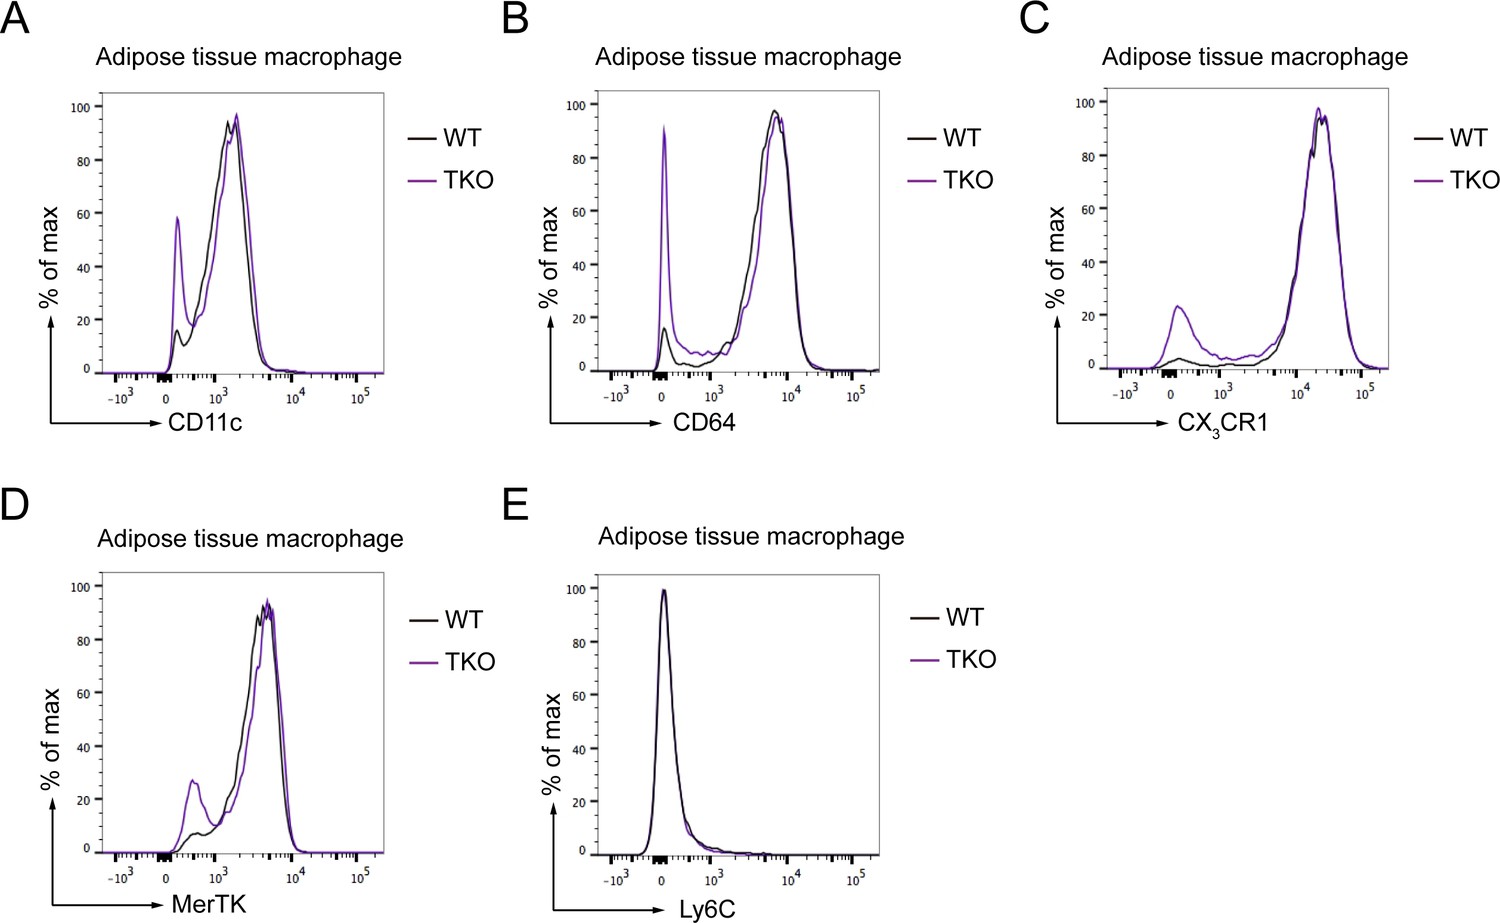
The adipose tissue macrophage (ATM) populations are not changed in TKO mice.
(A–E) Flow cytometry analysis of CD11c (A), CD64 (B), CX3CR1 (C), MerTK (D), and Ly6C (E) expression in ATMs from Lyz2-Cre (WT) and TKO mice. Data are representative of two independent experiments.
Figure 2—figure supplement 4
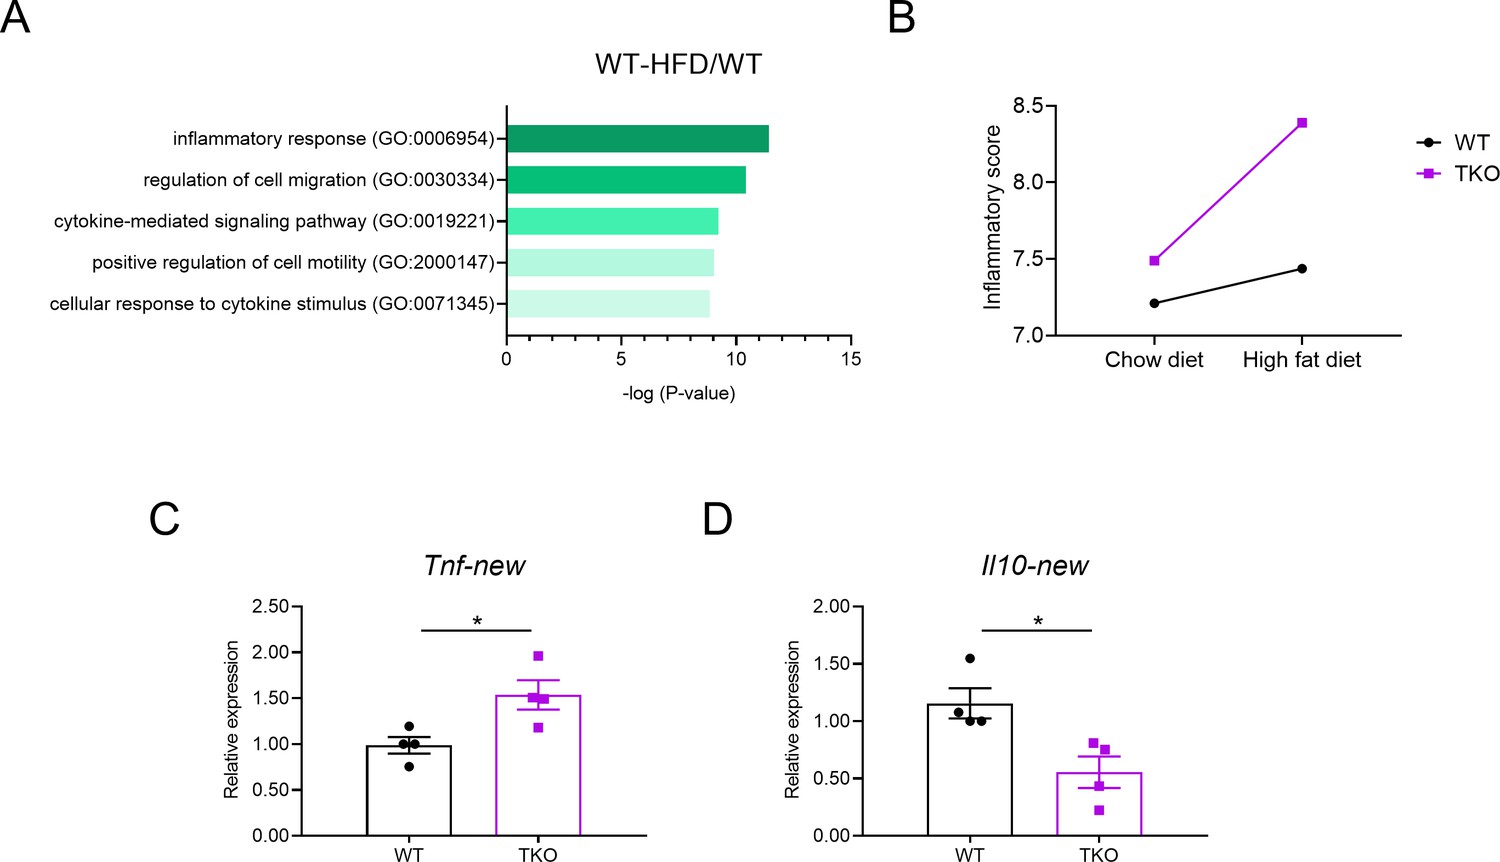
Adipose tissue macrophages (ATMs) in TKO mice are more inflammatory.
(A and B) WT and TKO mice were fed with regular chow diet or high-fat diet (HFD) for 8 weeks; ATMs were sorted for a genome-wide RNA profiling analysis. (A) Gene ontology analysis of RNA-seq datasets of ATMs from WT mice fed with chow diet or HFD. (B) Inflammatory score of WT and TKO mice fed with chow diet or HFD. Inflammatory score = sum of log (FPKM+1) of representative pro-inflammatory genes (Tnf, Il6, Cxcl1, Ccl2, and Ccl8) − sum of log (FPKM+1) of representative anti-inflammatory genes (Il10, Il4, Il5, and Il13). (C and D) qPCR analysis of Tnf (C) and Il10 (D) mRNA with an additional set of primers in WT and TKO ATMs. *p<0.05 (unpaired Student’s t-test). Data are representative of one (A and B) or are pooled from two (C and D) independent experiments (mean ± s.e.m.).
Figure 3 with 1 supplement

miR-17~92 family miRNAs balance the production of TNF and IL-10 in macrophages.
(A and B) qPCR analysis of Tnf (A) and Il10 (B) mRNA in WT and TKO BMDMs without stimulation. (C and D) qPCR analysis of Tnf (C) and Il10 (D) mRNA in WT and TKO BMDMs stimulated for the indicated periods with LPS. (E and F) ELISA of TNF (E) and IL-10 (F) in supernatants from WT and TKO BMDMs stimulated for the indicated periods with LPS. (G) ELISA of TNF in supernatants from WT and TKO BMDMs pre-treated 1 hr with indicated dose of IL-10 and then stimulated with LPS for 6 hr. (H) WT and TKO mice were injected with PBS or anti-TNF (10 mg/kg) weekly and were fed with a high-fat diet. Body weight of each mice was measured weekly. NS, not significant (p>0.05); *p<0.05, **p<0.01, and ***p<0.001 (paired Student’s t-test and two-way ANOVA). Data are representative of or are pooled from five (A–D), four (E and F), three (G), or one (H) independent experiments (mean + s.d. in A–G and mean ± sem in H).
Figure 3—figure supplement 1
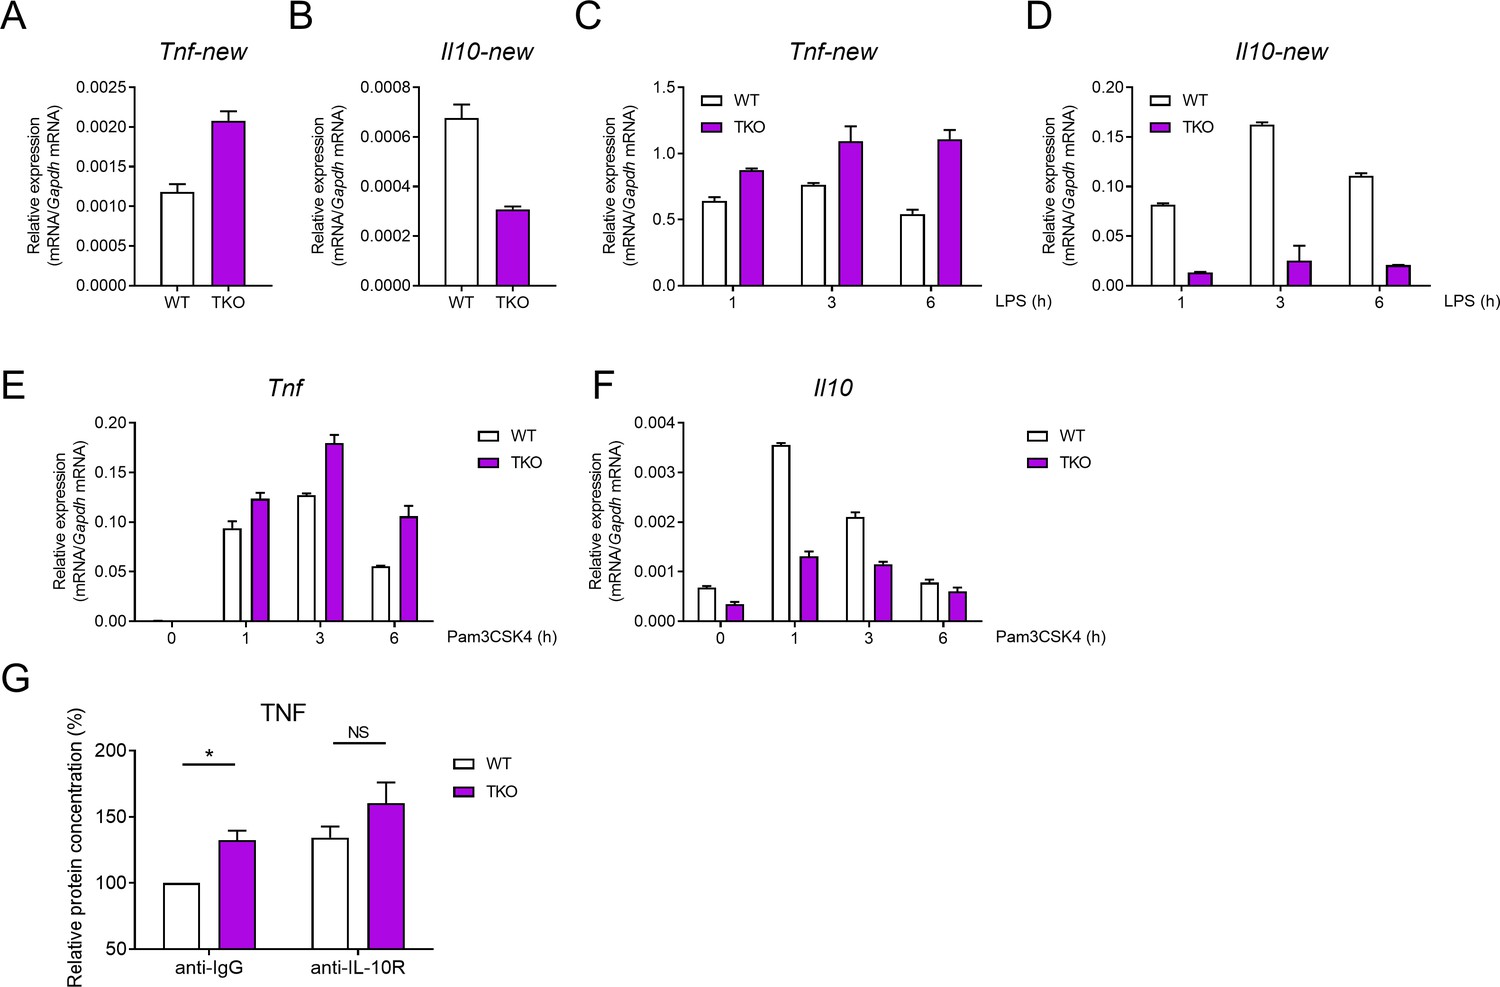
miR-17~92 family miRNAs regulate the production of TNF and IL-10 in macrophages.
(A and B) qPCR analysis of Tnf (A) and Il10 (B) mRNA with an additional set of primers in WT and TKO BMDMs without stimulation. (C and D) qPCR analysis of Tnf (C) and Il10 (D) mRNA with an additional set of primers in WT and TKO BMDMs stimulated for the indicated periods with LPS. (E and F) qPCR analysis of Tnf (E) and Il10 (F) mRNA in WT and TKO BMDMs stimulated for the indicated periods with Pam3CSK4. (G) ELISA of TNF in supernatants from WT and TKO BMDMs pre-treated 0.5 hr with anti-IL-10R or anti-IgG (2 μg/ml) and then stimulated with LPS for 6 hr. NS, not significant (p>0.05); *p<0.05 (paired Student’s t-test). Data are representative of five (A–D) or two (E and F) (mean + s.d.) or are pooled from four (G) independent experiments (mean + s.e.m.).
Figure 4
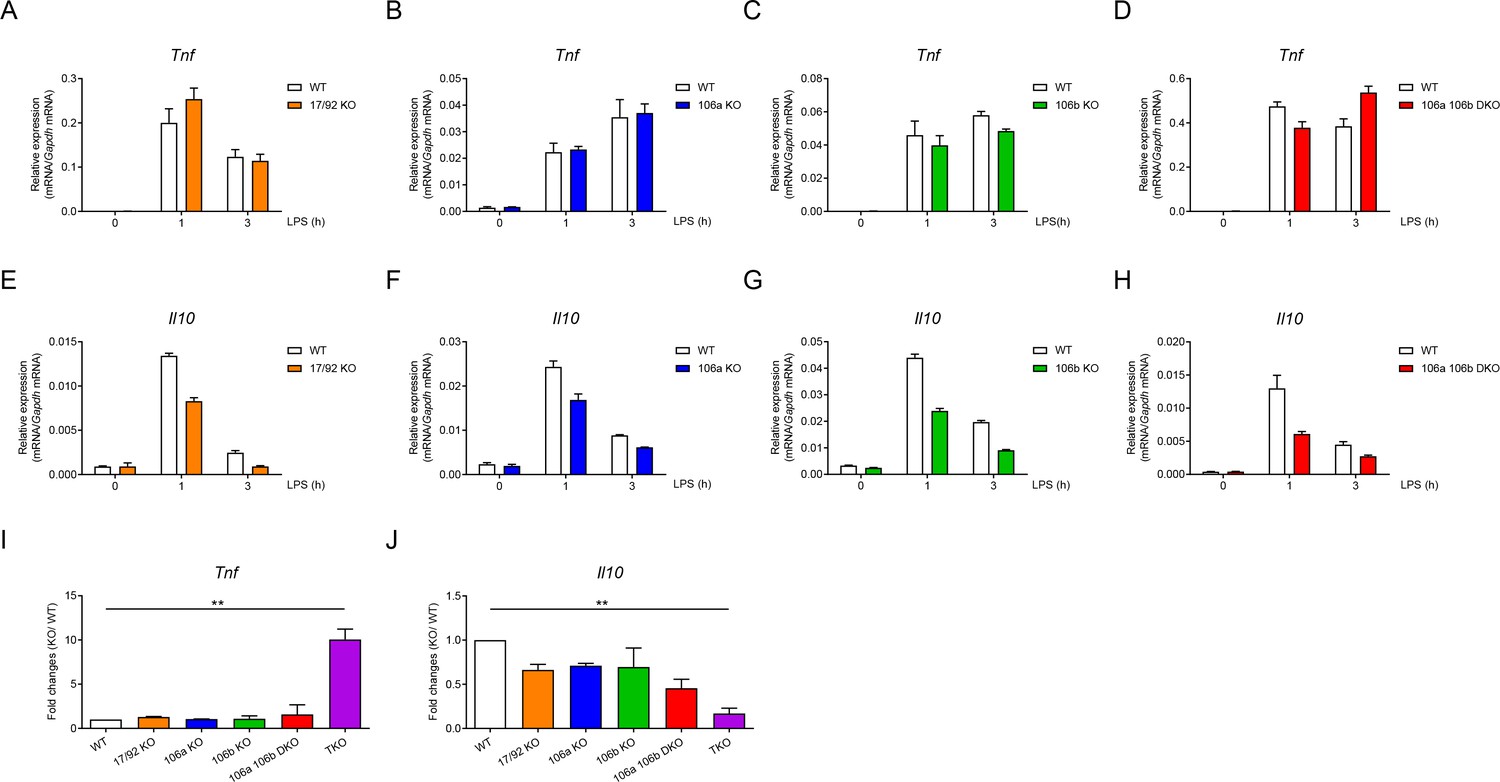
Three clusters of miR-17~92 family miRNAs regulate the expression of TNF and IL-10 collectively in macrophages.
(A–D) qPCR analysis of Tnf mRNA in WT and miR-17~92flox/flox Lyz2-Cre (17/92 KO) (A), miR-106a~363−/− (106a KO) (B), miR-106b~25−/− (106b KO) (C), or miR-106a~363−/− miR-106b~25−/− (106a 106b DKO) (D) BMDMs stimulated for the indicated periods with LPS. (E–H) qPCR analysis of Il10 mRNA in WT and 17/92 KO (E), 106a KO (F), 106b KO (G), or 106a 106b DKO (H) BMDMs stimulated for the indicated periods with LPS. (I and J) qPCR analysis of Tnf (I) and Il10 (J) mRNA in WT and various knockout (horizontal axes) BMDMs stimulated for 1 hr with LPS; results are presented relative to those of LPS-stimulated WT BMDMs. **p<0.01 (paired Student’s t-test). Data are representative of two (A–C and E–G) or three (D and H) independent experiments or are pooled from two to three (I and J) independent experiments (mean + s.d.).
Figure 5 with 4 supplements
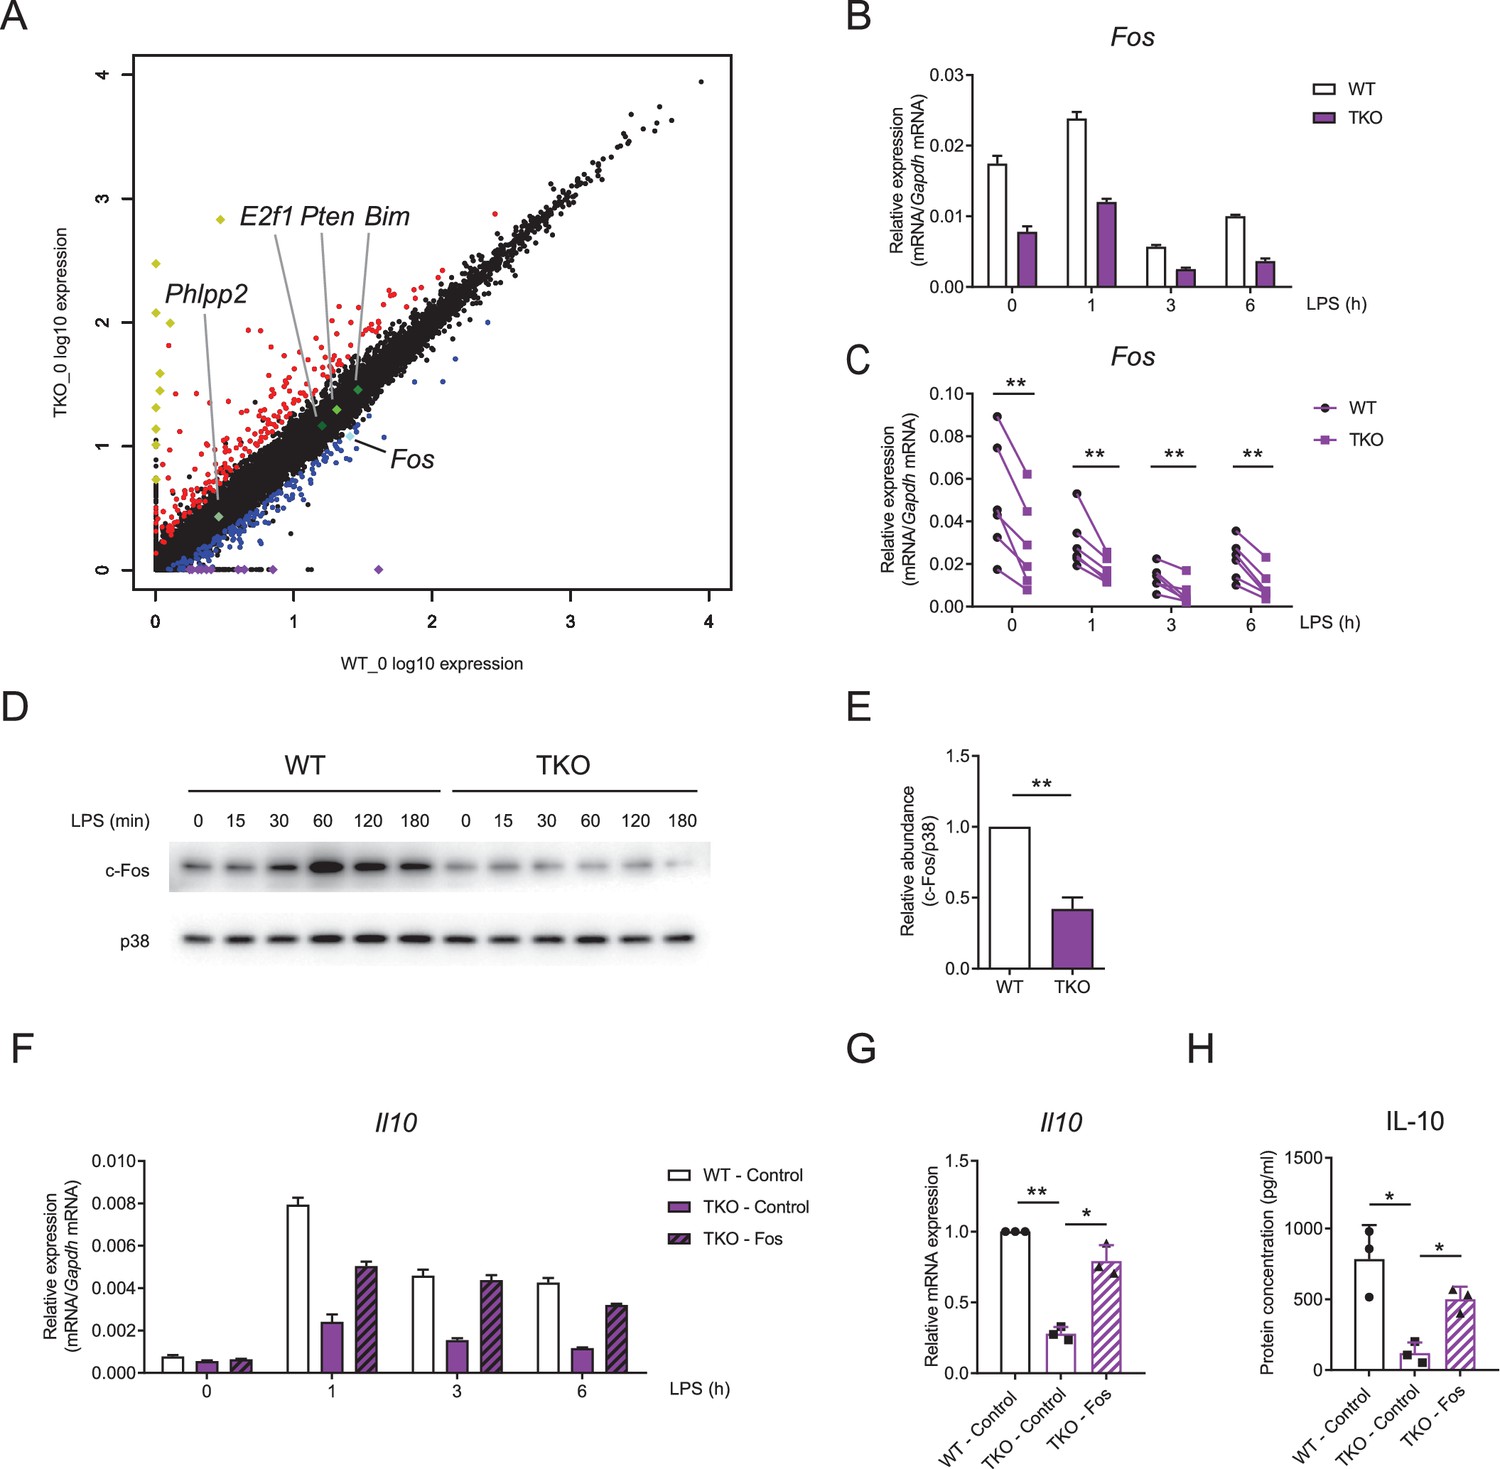
miR-17~92 family miRNAs promote the expression of Fos in macrophages.
(A) RNA-seq analysis showing RNA expression in TKO BMDMs versus those in WT cells. RNAs upregulated in TKO BMDMs were colored red, whereas RNAs downregulated were colored blue, gene Fos was pointed out and colored bright blue, and genes Phlpp2, E2f1, Pten, and Bim were pointed out and colored green. Top 10 upregulated genes (Atp6v0c-ps2, Hmga1-rs1, H2-Q6, H2-Ea-ps, Gm8580, Gm8909, Sap25, LOC547349, H2–l, and H2–Q10) were colored yellow and top 10 downregulated genes (Mir8114, 0610010B08Rik, Gm14430, Gm8615, Asb4, Gm14305, 6230416C02Rik, Gm38431, Pira7, and Cpt1b) were colored purple. (B and C) qPCR analysis of Fos mRNA in WT and TKO BMDMs stimulated for the indicated periods with LPS. (D) Immunoblotting analysis of c-Fos ad p38 (loading control) in whole-cell lysates of WT and TKO BMDMs treated for the indicated periods with LPS. (E) Quantifications of c-Fos protein abundance in unstimulated condition in (D) by densitometry from four independent experiments. (F) qPCR analysis of Il10 mRNA in WT and TKO BMDMs transfected with control or Fos overexpression vector and stimulated for the indicated periods with LPS. (G) Cumulative results from three independent experiments of Il10 levels in LPS-stimulated 6 hr results as in (F), normalized to mRNA expression in control vector transfected WT cells. (H) ELISA of IL-10 in supernatants from WT and TKO BMDMs transfected with control or Fos overexpression vector and stimulated with LPS for 12 hr. *p<0.05 and **p<0.01 (paired Student’s t-test). Data are representative of six (B), four (D), or three (F) independent experiments or are pooled from six (C), four (E), or three (G and H) independent experiments (mean + s.d.).
Figure 5—figure supplement 1

The regulation of TNF and IL-10 by miR-17~92 family miRNAs is independent of PTEN.
(A and B) qPCR analysis of Tnf (A) and Il10 (B) mRNA in WT and TKO BMDMs stimulated with or without LPS for 3 hr in the presence or absence of a PTEN inhibitor SF1670 (2 μM). Data are representative of three independent experiments (mean + s.d.).
Figure 5—figure supplement 2

miR-17~92 family miRNAs sustain Fos expression in TKO BMDMs.
(A and B) The whole immunoblots of c-Fos (A) and p38 (B) in whole-cell lysates of WT and TKO BMDMs treated for the indicated periods with LPS.
Figure 5—figure supplement 3
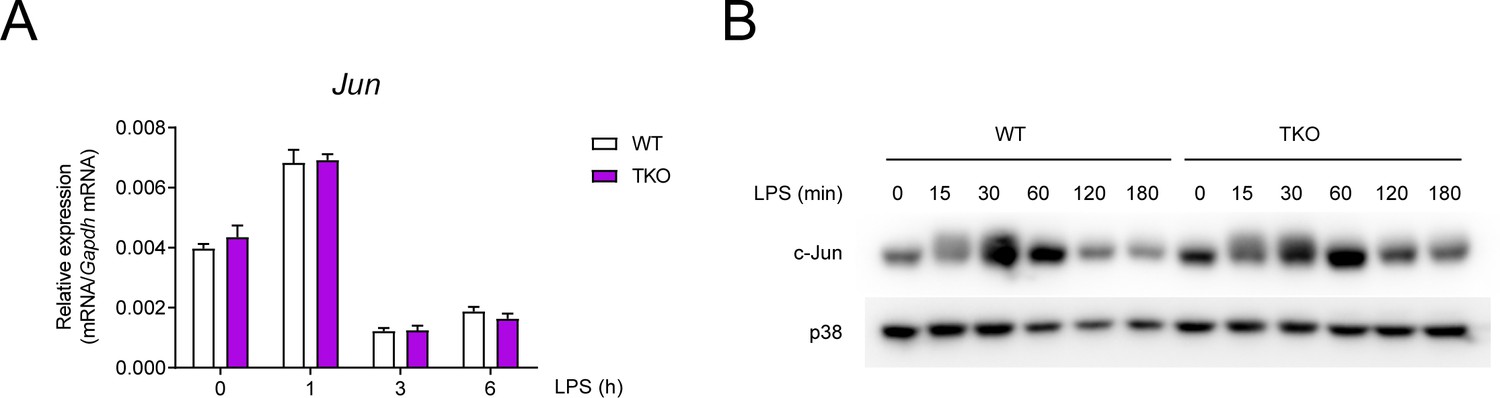
The expression of Jun is comparable between WT and TKO BMDMs.
(A) qPCR analysis of Jun mRNA in WT and TKO BMDMs stimulated for the indicated periods with LPS. (B) Immunoblotting analysis of c-Jun and p38 (loading control) in whole-cell lysates of WT and TKO BMDMs treated for the indicated periods with LPS. Data are representative of two independent experiments (mean + s.d.).
Figure 5—figure supplement 4
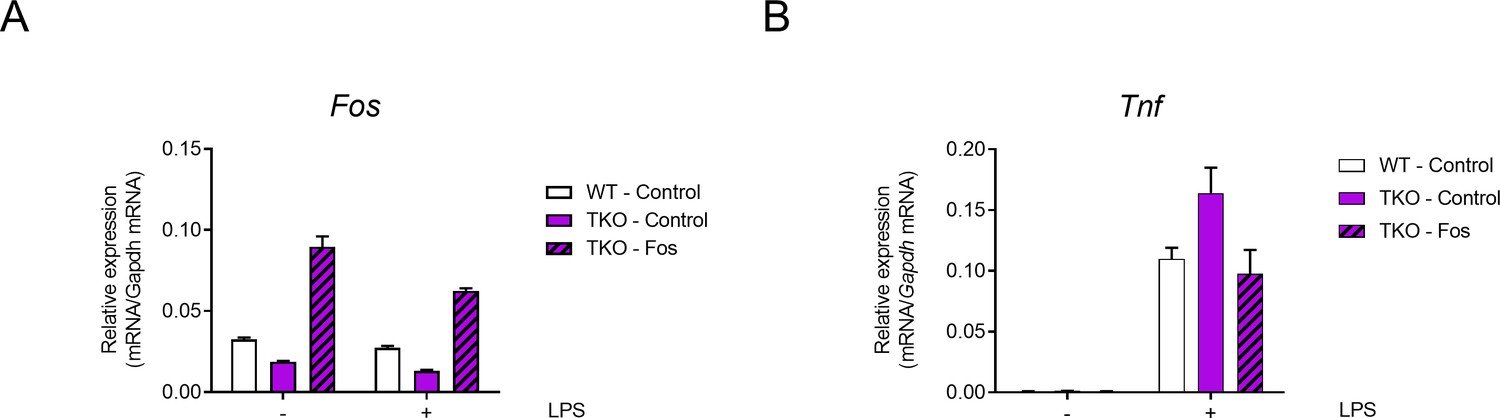
Overexpression of Fos reduces the expression of TNF in TKO BMDMs.
(A and B) qPCR analysis of Fos (A) and Tnf (B) mRNA in WT and TKO BMDMs transfected with control or Fos overexpression vector and stimulated with or without LPS for 6 hr. Data are representative of three independent experiments (mean + s.d.).
Figure 6 with 3 supplements
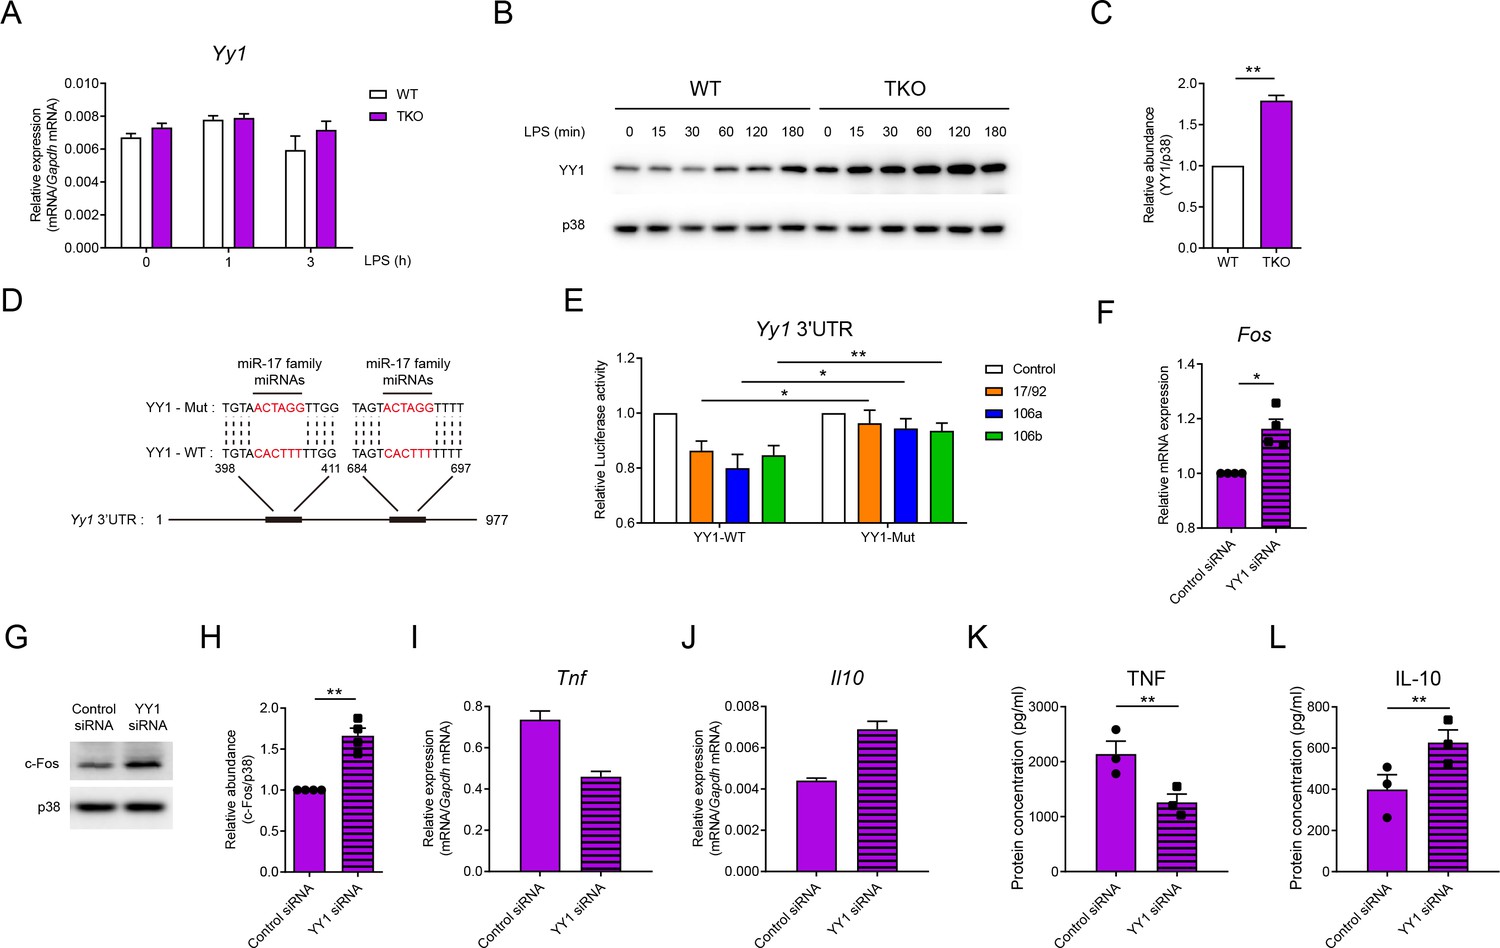
miR-17~92 family miRNAs target YY1 to promote Fos expression in macrophages.
(A) qPCR analysis of Yy1 mRNA in WT and TKO BMDMs stimulated for the indicated periods with LPS. (B) Immunoblotting analysis of YY1 and p38 (loading control) in whole-cell lysates of WT and TKO BMDMs treated for the indicated periods with LPS. (C) Quantifications of YY1 protein abundance in unstimulated condition in (B) by densitometry from three independent experiments. (D) Schematic illustration of predicted binding sites of miR-17 family miRNAs (red) in wild-type (YY1-WT) or mutated (YY1-Mut) Yy1 3′ untranslated region (UTR). (E) Luciferase reporter assays of Rluc gene expression containing the wild-type or mutated binding sites (as in D) in Yy1 3′UTR in 293 T cells co-transfected with the luciferase reporter vector and negative control (Control), miR-17~92 cluster (17/92), miR-106a~363 cluster (106a), or miR-106b~25 cluster (106b) miRNAs overexpression vector. Results are presented as Rluc/Luc activity ratio and are normalized to values in the control vector group. (F) qPCR analysis of Fos mRNA in TKO BMDMs transfected with control or YY1 short interfering RNAs (siRNAs), normalized to mRNA expression in control siRNA transfected cells. (G) Immunoblotting analysis of c-Fos and p38 (loading control) in whole-cell lysates of TKO BMDMs transfected with control or YY1 siRNAs. (H) Quantifications of c-Fos protein abundance in (G) by densitometry from four independent experiments. (I and J) qPCR analysis of Tnf (I) and Il10 (J) mRNA in TKO BMDMs transfected with control or YY1 siRNAs and stimulated with LPS for 1 hr. (K and L) ELISA of TNF (K) and IL-10 (L) in supernatants from TKO BMDMs transfected with control or YY1 siRNAs and stimulated with LPS for 6 hr. *p<0.05 and **p<0.01 (paired Student’s t-test). Data are representative of three (A, B, I, and J) or four (G) independent experiments or are pooled from three (C, K, and L), six (E), or four (F and H) independent experiments (mean + s.e.m.).
Figure 6—figure supplement 1
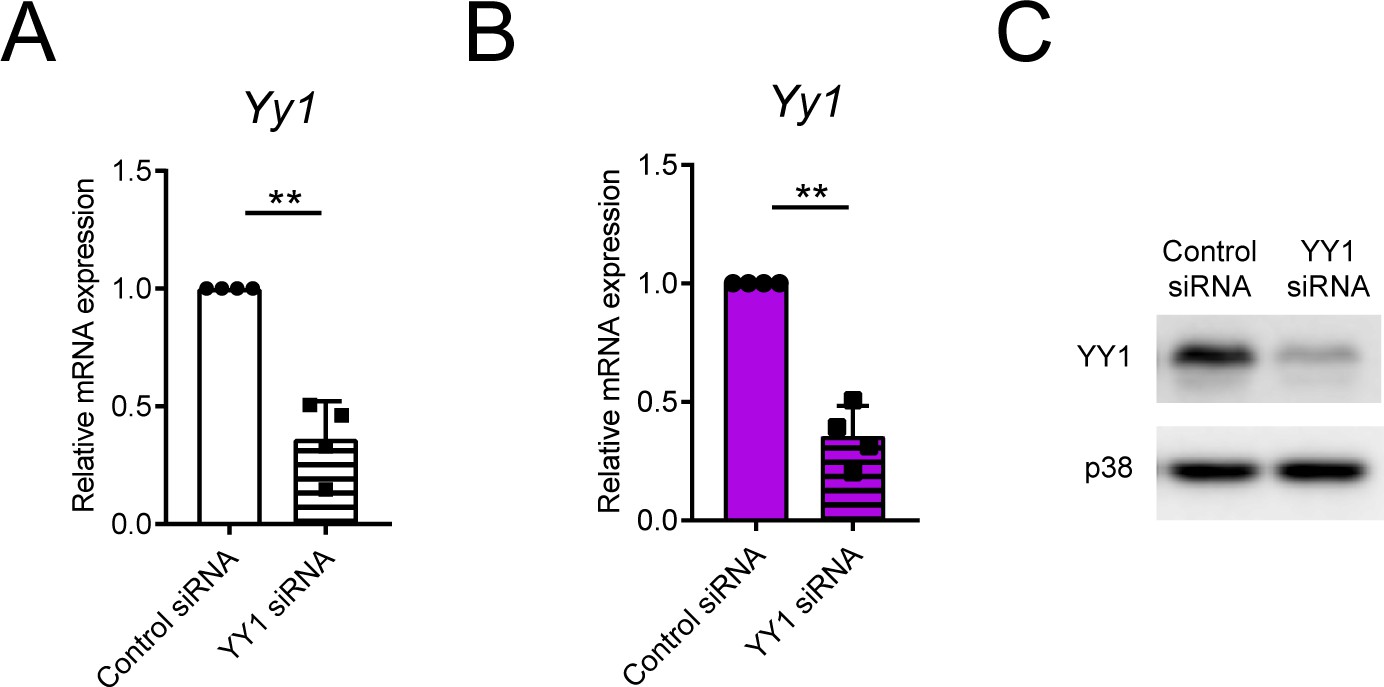
YY1 expression is efficiently knocked down by RNA interference.
(A) qPCR analysis of Yy1 in WT BMDMs transfected with control or YY1 siRNAs, normalized to mRNA expression in control siRNA transfected cells. (B and C) qPCR analysis of Yy1 (B) and immunoblotting analysis of YY1 and p38 (loading control, C) in TKO BMDMs transfected with control or YY1 siRNAs, qPCR results were normalized to mRNA expression in control siRNA transfected cells. **p<0.01 (paired Student’s t-test). Data are pooled from (A) or are representative of (B) four independent experiments (mean + s.d.).
Figure 6—figure supplement 2
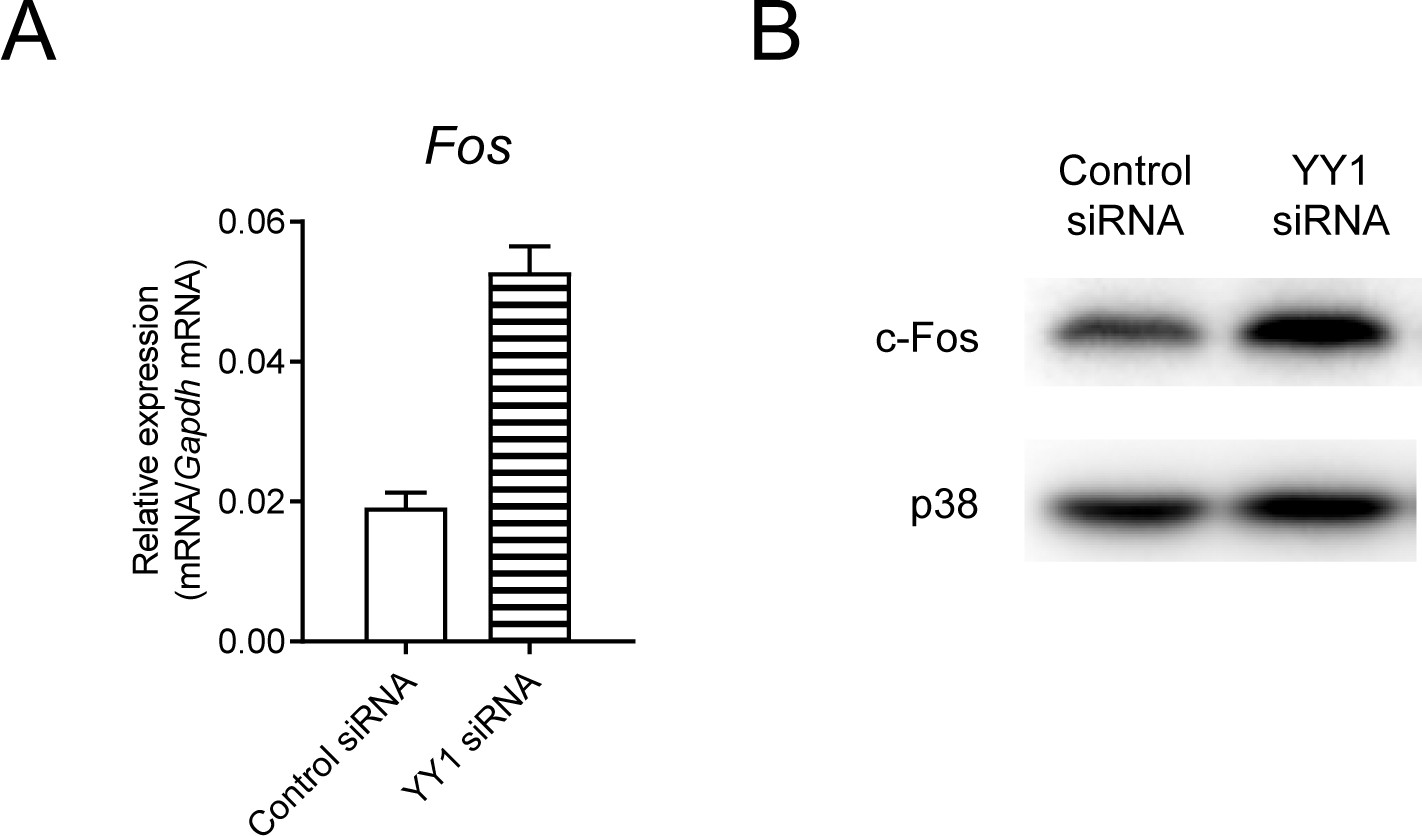
Fos is upregulated after knocking down YY1 in WT BMDMs.
(A and B) qPCR analysis of Fos (A) and immunoblotting analysis of c-Fos and p38 (loading control, B) in WT BMDMs transfected with control or YY1 siRNAs. Data are representative of two independent experiments (mean + s.d.).
Figure 6—figure supplement 3
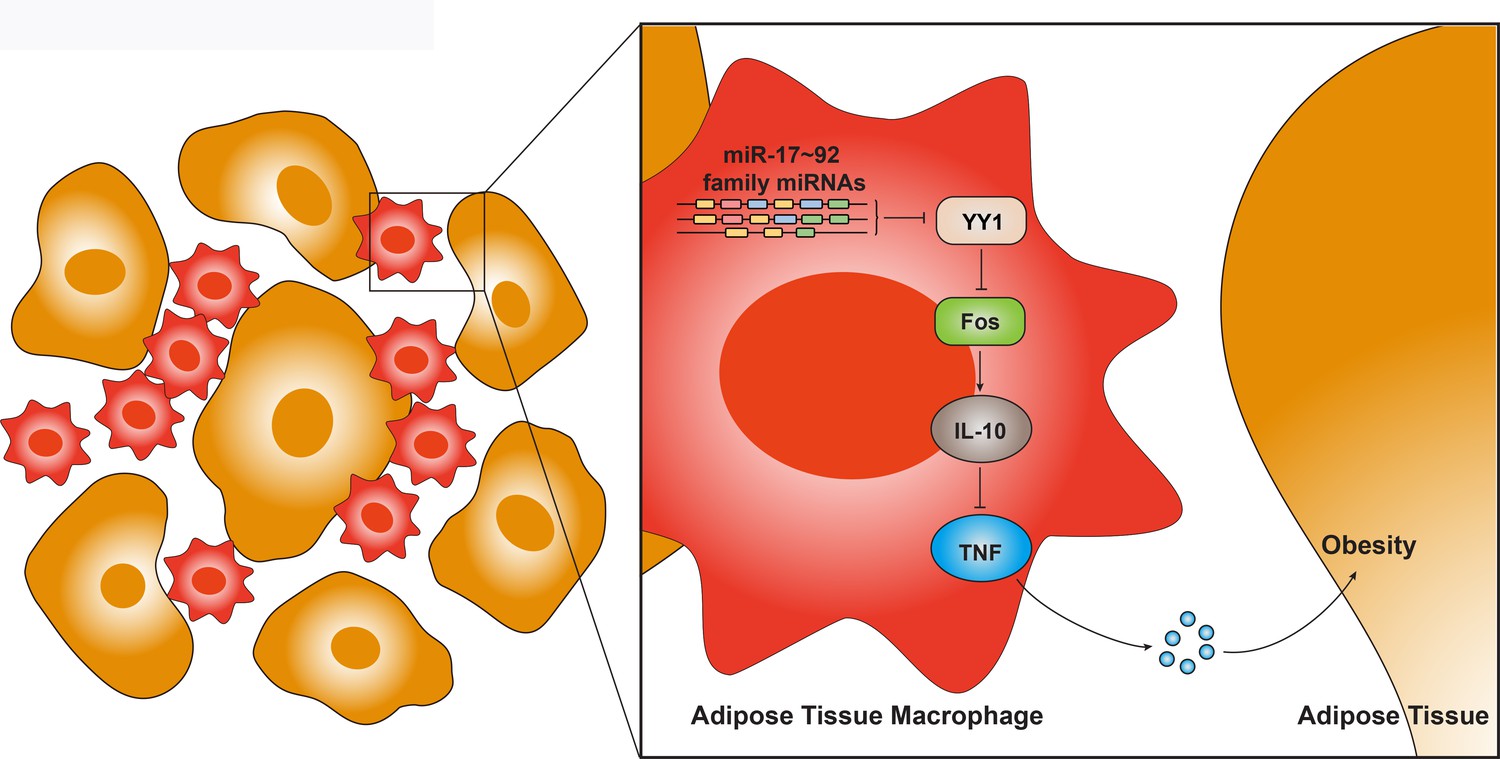
A model depicting functions and mechanisms of action of miR-17~92 family miRNAs in adipose tissue macrophages.
MicroRNAs of miR-17~92 family target YY1 to release its repression on Fos, allowing optimal production of IL-10 and subsequently repress production of TNF, thus inhibiting chronic inflammation such as obesity. Overall, miR-17~92 family miRNAs act as crucial regulators of the balance between pro- and anti-inflammatory cytokines in macrophages to maintain adipose tissue homeostasis.
Tables
Key resources table
| Reagent type (species) or resource | Designation | Source or reference | Identifiers | Additional information |
|---|---|---|---|---|
| Genetic reagent (Mus. musculus) | Lyz2-Cre | The Jackson Laboratory | Stock No: 004781 | |
| Genetic reagent (Mus. musculus) | C57BL/6J | The Jackson Laboratory | Stock No: 000664 | |
| Genetic reagent (Mus. musculus) | miR-106a~363−/− (Mirc2−/−) | The Jackson Laboratory | Stock No: 008461 | |
| Genetic reagent (Mus. musculus) | miR-106b~25−/−(Mirc3−/−) | The Jackson Laboratory | Stock No: 008460 | |
| Genetic reagent (Mus. musculus) | miR-17~92flox/flox (Mirc1flox/flox) | The Jackson Laboratory | Stock No: 008458 | |
| Genetic reagent (Mus. musculus) | miR-106a~363−/− miR-106b~25−/− (Mirc2−/− Mirc3−/−) | This paper | N/A | |
| Genetic reagent (Mus. musculus) | miR-106a~363−/−miR-106b~25−/−miR-17~92flox/flox Lyz2-Cre (Mirc2−/− Mirc3−/− Mirc1flox/flox Lyz2-Cre) | This paper | N/A | |
| Genetic reagent (Mus. musculus) | CD45.1 | Gift from Dr. Yan Shi, Tsinghua University | N/A | |
| Genetic reagent (Mus. musculus) | Lyz2-RFP | Gift from Dr. Yuncai Liu, Tsinghua University | N/A | |
| Cell line (Homo sapiens) | 293T | ATCC | ACS-4500 | |
| Antibody | Anti-mouse F4/80-APC (rat monoclonal) | eBioscience | Cat# 17-4801-82, RRID:AB_2784648 | 1:400 |
| Antibody | Anti-mouse CD45-APC/Cy7 (rat monoclonal) | BioLegend | Cat# 103116, RRID:AB_312981 | 1:400 |
| Antibody | Anti-mouse CD11b-PerCP-Cy5.5 (rat monoclonal) | eBioscience | Cat# 45-0112-82, RRID:AB_953558 | 1:400 |
| Antibody | Anti-mouse Mer-BV605 (rat monoclonal) | BD Biosciences | Cat# 747894 | 1:400 |
| Antibody | Anti-mouse CD64-PE (mouse monoclonal) | BioLegend | Cat# 139304, RRID:AB_10612740 | 1:200 |
| Antibody | Anti-mouse CD11c-FITC (hamster monoclonal) | BD Biosciences | Cat# 553801, RRID:AB_395060 | 1:400 |
| Antibody | Anti-mouse CX3CR1-PE/Cy7 (mouse monoclonal) | BioLegend | Cat# 149015, RRID:AB_2565699 | 1:400 |
| Antibody | Anti-mouse Ly6C-Alexa Fluor 700 (rat monoclonal) | BioLegend | Cat# 128024, RRID:AB_10643270 | 1:400 |
| Antibody | Anti-mouse CD45.1-BV421(mouse monoclonal) | BioLegend | Cat# 110732, RRID:AB_2562563 | 1:400 |
| Antibody | Anti-mouse CD45.2-PE/Cy7 (mouse monoclonal) | eBioscience | Cat# 25-0454-80, RRID:AB_2573349 | 1:400 |
| Antibody | p38α (C-20) (rabbit polyclonal) | Santa Cruz Biotechnology | Cat# sc-535, RRID:AB_632138 | 1:1000 |
| Antibody | c-Fos Antibody (4) (rabbit polyclonal) | Santa Cruz Biotechnology | Cat# sc-52, RRID:AB_2106783 | 1:1000 |
| Antibody | c-Jun (60A8) (rabbit monoclonal) | Cell Signaling Technology | Cat# 9165, RRID:AB_2130165 | 1:1000 |
| Antibody | YY1 antibody [EPR4652] (rabbit monoclonal) | Abcam | Cat# ab109237, RRID:AB_10890662 | 1:1000 |
| Antibody | Anti-mouse IL-10R (rat monoclonal) | Bio X Cell | Cat# BE0050, RRID:AB_1107611 | |
| Antibody | Rat IgG1 isotype control (rat monoclonal) | Bio X Cell | Cat# BE0088, RRID:AB_1107775 | |
| Antibody | Anti-mouse TNFα (rat monoclonal) | Bio X Cell | Cat# BP0058, RRID:AB_1107764 | |
| Recombinant DNA reagent | psiCHECK-2-YY1-WT (plasmid) | This paper | N/A | |
| Recombinant DNA reagent | psiCHECK-2-YY1-Mut (plasmid) | This paper | N/A | |
| Sequence-based reagent | YY1 siRNA | GenePharma | N/A | GAACUCACCUCCUGAUUAU (sense), AUAAUCAGGAGGUGAGUUC (antisense) |
| Sequence-based reagent | Primers for qPCR | This paper | N/A | see Supplementary file 1 |
| Peptide, recombinant protein | Recombinant Murine IL-10 | PeproTech | Cat# 210–10 | |
| Commercial assay or kit | Total RNA Miniprep Purification Kit | GeneMark | TR01-150 | |
| Commercial assay or kit | Mouse TNF ELISA Set | BD Biosciences | Cat# 555268 | |
| Commercial assay or kit | IL-10 ELISA Kit | BioLegend | Cat# 431414 | |
| Commercial assay or kit | TaqMan microRNA Reverse Transcription Kit | Applied Biosystems | Cat# 4366596 | |
| Commercial assay or kit | TaqMan MicroRNA assays | Applied Biosystems | Cat# 4427975 | |
| Commercial assay or kit | Dual-Luciferase Reporter Assay System | Promega | Cat# E1910 | |
| Chemical compound, drug | SF1670 | Selleck | Cat# S7310 | |
| Chemical compound, drug | LPS-EB (LPS from E. coli O111:B4) | InvivoGen | Cat# tlrl-eblps | |
| Chemical compound, drug | Pam3CSK4 | InvivoGen | Cat# tlrl-pms | |
| Chemical compound, drug | Lipofectamine 2000 Transfection Reagent | Invitrogen | Cat# 11668027 | |
| Chemical compound, drug | TransIT-TKO Transfection Reagent | Mirus | Cat# MIR2150 | |
| Software, algorithm | GraphPad Prism | GraphPad Software | RRID:SCR_002798 | |
| Software, algorithm | FlowJo(v10.0.7) | FlowJo | RRID:SCR_008520 | |
| Software, algorithm | Image J (v1.52a) | https://imagej.nih.gov/ij/index.html | RRID:SCR_003070 |
Additional files
-
Supplementary file 1
Primers used in this study.
- https://cdn.elifesciences.org/articles/55676/elife-55676-supp1-v3.docx
-
Supplementary file 2
Yy1 3′UTR cloned fragments with miR-17 family miRNAs binding sites for luciferase reporter assays.
- https://cdn.elifesciences.org/articles/55676/elife-55676-supp2-v3.docx
-
Transparent reporting form
- https://cdn.elifesciences.org/articles/55676/elife-55676-transrepform-v3.docx
Download links
A two-part list of links to download the article, or parts of the article, in various formats.
Downloads (link to download the article as PDF)
Open citations (links to open the citations from this article in various online reference manager services)
Cite this article (links to download the citations from this article in formats compatible with various reference manager tools)
MicroRNAs of the miR-17~92 family maintain adipose tissue macrophage homeostasis by sustaining IL-10 expression
eLife 9:e55676.
https://doi.org/10.7554/eLife.55676


