Post-tetanic potentiation lowers the energy barrier for synaptic vesicle fusion independently of Synaptotagmin-1
- Department of Functional Genomics, Clinical Genetics, Center for Neurogenomics and Cognitive Research, Amsterdam University Medical Center- Location VUmc, Netherlands
- Department of Functional Genomics, Center for Neurogenomics and Cognitive Research, VU University Amsterdam, Netherlands
Figures
Figure 1 with 2 supplements
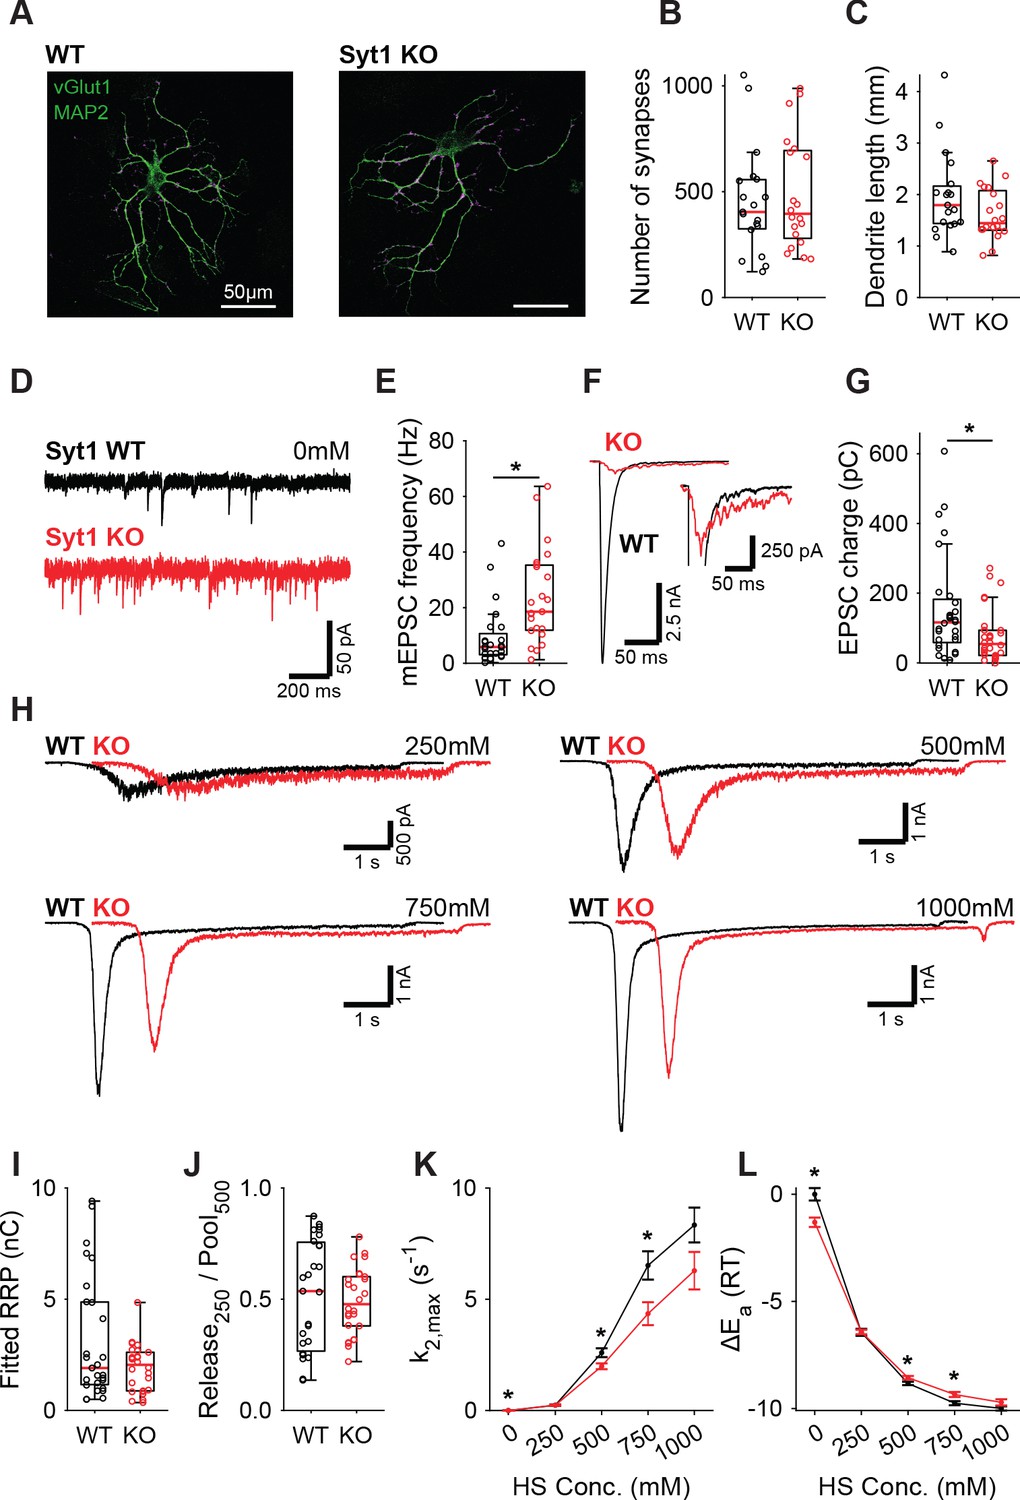
Increased spontaneous release in Syt1 KO does not correspond to a decrease in the fusion energy barrier.
(A) Representative examples of WT and Syt1 KO neurons with vGlut (magenta) stained as a synapse marker and MAP2 (green) as a dendrite marker. (B) Boxplots of number of synapses, and (C) dendrite length per neuron in WT and Syt1 KO. (D) Representative traces of spontaneous release (0 mM HS), and (E) boxplot of spontaneous frequency in WT and Syt1 KO. (F) Representative traces of AP-evoked release in WT and Syt1 KO, overlaid, full view (left) and zoomed to the amplitude of Syt1 KO. (G) Boxplot of charge transferred during the first evoked EPSC. (H) Representative traces of HS-induced release in WT and Syt1 KO overlaid with 1 s offset, at 250 mM, 500 mM, 750 mM, and 1000 mM HS, and boxplots of (I) RRP charge estimated from 500 mM HS, (J) depleted RRP fraction at 250 mM HS in WT and Syt1 KO. (K) Plots (mean ± S.E.M.) of maximal HS release rates, and (L) change in the fusion energy barrier at different HS concentrations for WT and Syt1 KO. (*p<0.05, Wilcoxon rank sum test).
-
Figure 1—source data 1
Statistics overview.
- https://cdn.elifesciences.org/articles/55713/elife-55713-fig1-data1-v2.xlsx
Figure 1—figure supplement 1

Reduced number of docked vesicles in hippocampal Syt1 KO autaptic synapses.
(A) Representative examples of electron microscopy images of WT and Syt1 KO synapses. (B) Boxplots of docked vesicles per synapses, (C) active zone (AZ) length in nm, (D) docked vesicles per nm AZ, and (E) total number of vesicles per synapse in WT and Syt1 KO. (*p<0.05, Wilcoxon rank sum test).
-
Figure 1—figure supplement 1—source data 1
Statistics overview.
- https://cdn.elifesciences.org/articles/55713/elife-55713-fig1-figsupp1-data1-v2.xlsx
Figure 1—figure supplement 2
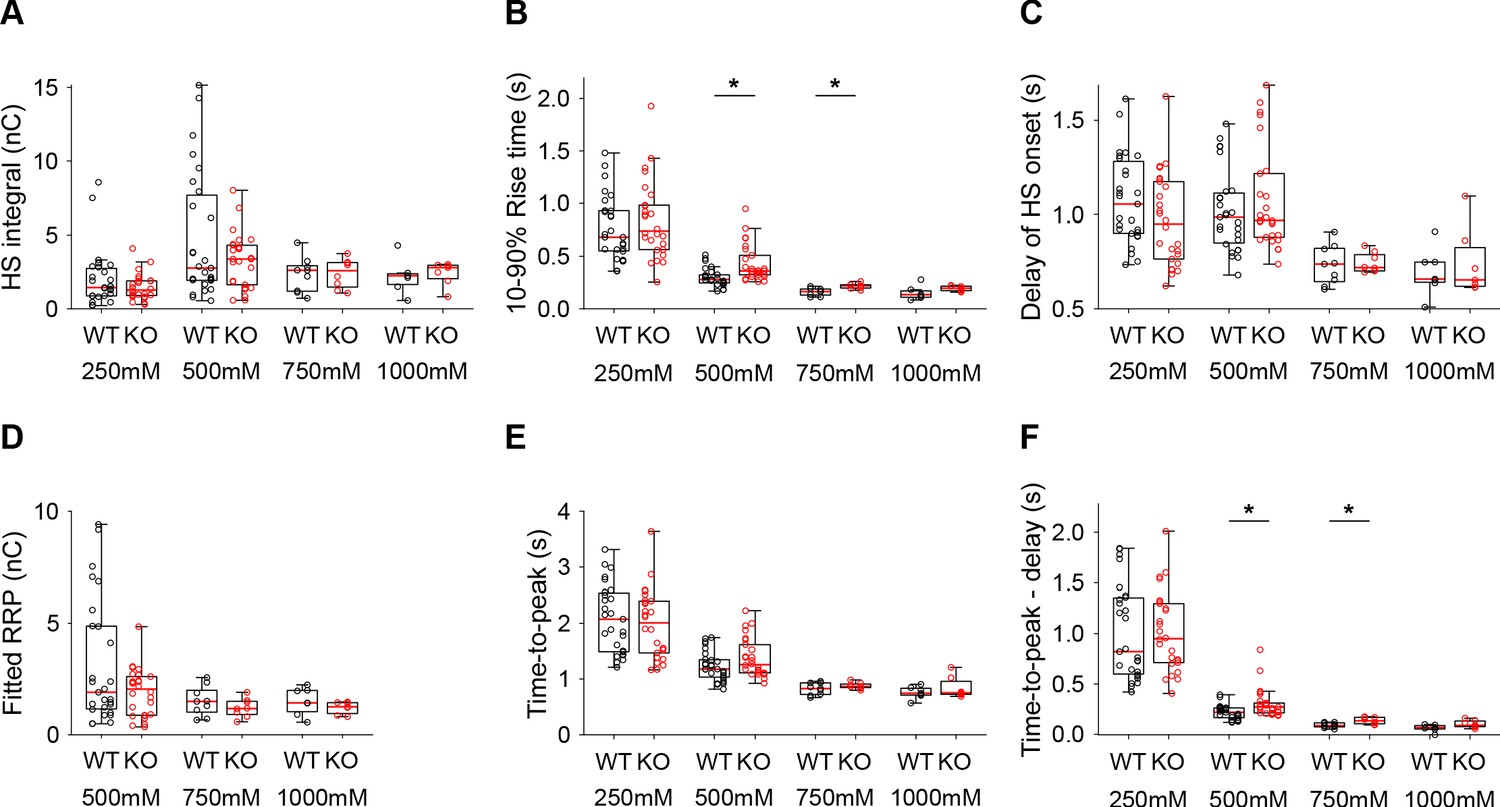
Additional HS parameters from WT and Syt1 KO neurons.
(A) Integral of current from HS-induced release at different concentrations. (B) 10–90% rise time of peak HS-induced current. (C) Time delay after application of HS before onset of release. (D) Model-derived RRP values from depleting HS stimulations. (E) Time from start of HS application till peak HS-induced current. (F) Time from start of HS application till peak HS-induced current, corrected for the delay in release onset after HS application. All panels comparing WT and Syt1 KO (*p<0.05, Wilcoxon rank sum test).
-
Figure 1—figure supplement 2—source data 1
Statistics overview.
- https://cdn.elifesciences.org/articles/55713/elife-55713-fig1-figsupp2-data1-v2.xlsx
Figure 2 with 2 supplements

Syt1 9Pro mutation increases spontaneous release independent of the fusion energy barrier.
(A) Representative traces of spontaneous release (0 mM HS), and (B) boxplot of spontaneous frequency in Syt1 WT and Syt1 9Pro expressing synapses. (C) Representative traces of AP-evoked release in Syt1 WT and Syt1 9Pro, overlaid with 20 ms offset, and (D) boxplot of charge transferred during the first evoked EPSC. (E) Representative traces of HS-induced release in Syt1 WT and Syt1 9Pro, overlaid with 1 s offset, at 250 mM and 500 mM HS, and boxplots of (F) RRP charge estimated from 500 mM HS, (G) depleted RRP fraction at 250 mM HS in Syt1 WT and Syt1 9Pro. (H) Plots (mean ± S.E.M.) of maximal HS release rates, and (I) change in the fusion energy barrier at different HS concentrations for Syt1 WT and Syt1 9Pro. (*p<0.05, Wilcoxon rank sum test).
-
Figure 2—source data 1
Statistics overview.
- https://cdn.elifesciences.org/articles/55713/elife-55713-fig2-data1-v2.xlsx
Figure 2—figure supplement 1
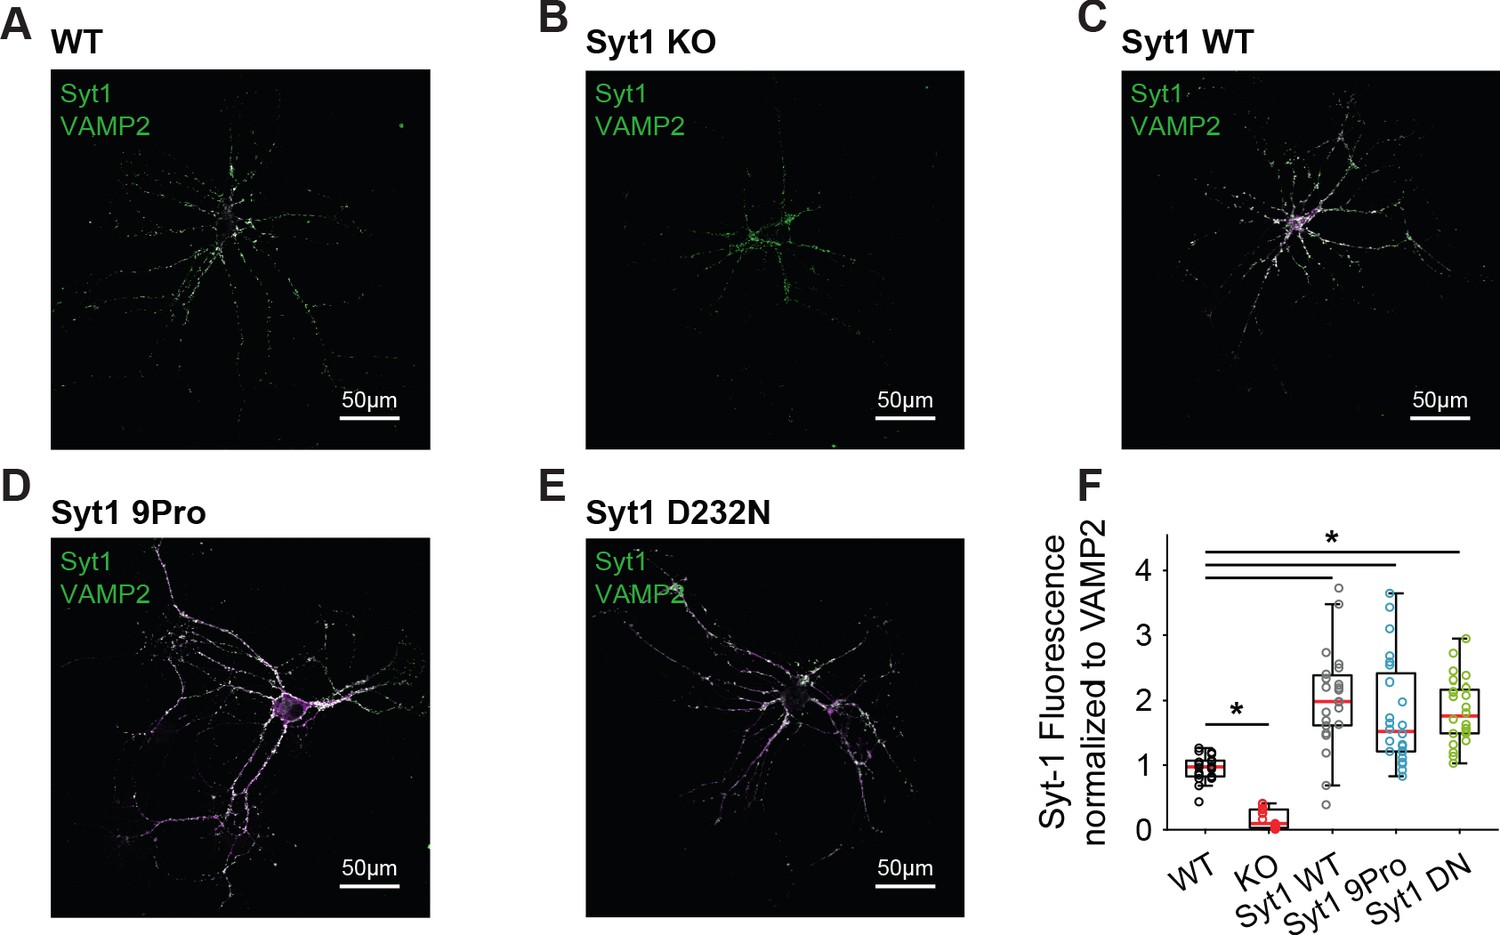
Synaptic expression of Syt1 WT and mutant rescue constructs exceeds endogenous levels.
Representative examples of (A) WT, (B) Syt1 KO, (C) Syt1 WT expressing, (D) Syt1 9Pro expressing, and (E) Syt1 D232N expressing autapses stained for Syt1 (magenta) and the synaptic marker VAMP2 (green). (F) Boxplots of Syt1 fluorescent intensity, normalized to VAMP2 intensity. (*p<0.05, Wilcoxon rank sum test).
-
Figure 2—figure supplement 1—source data 1
Statistics overview.
- https://cdn.elifesciences.org/articles/55713/elife-55713-fig2-figsupp1-data1-v2.xlsx
Figure 2—figure supplement 2
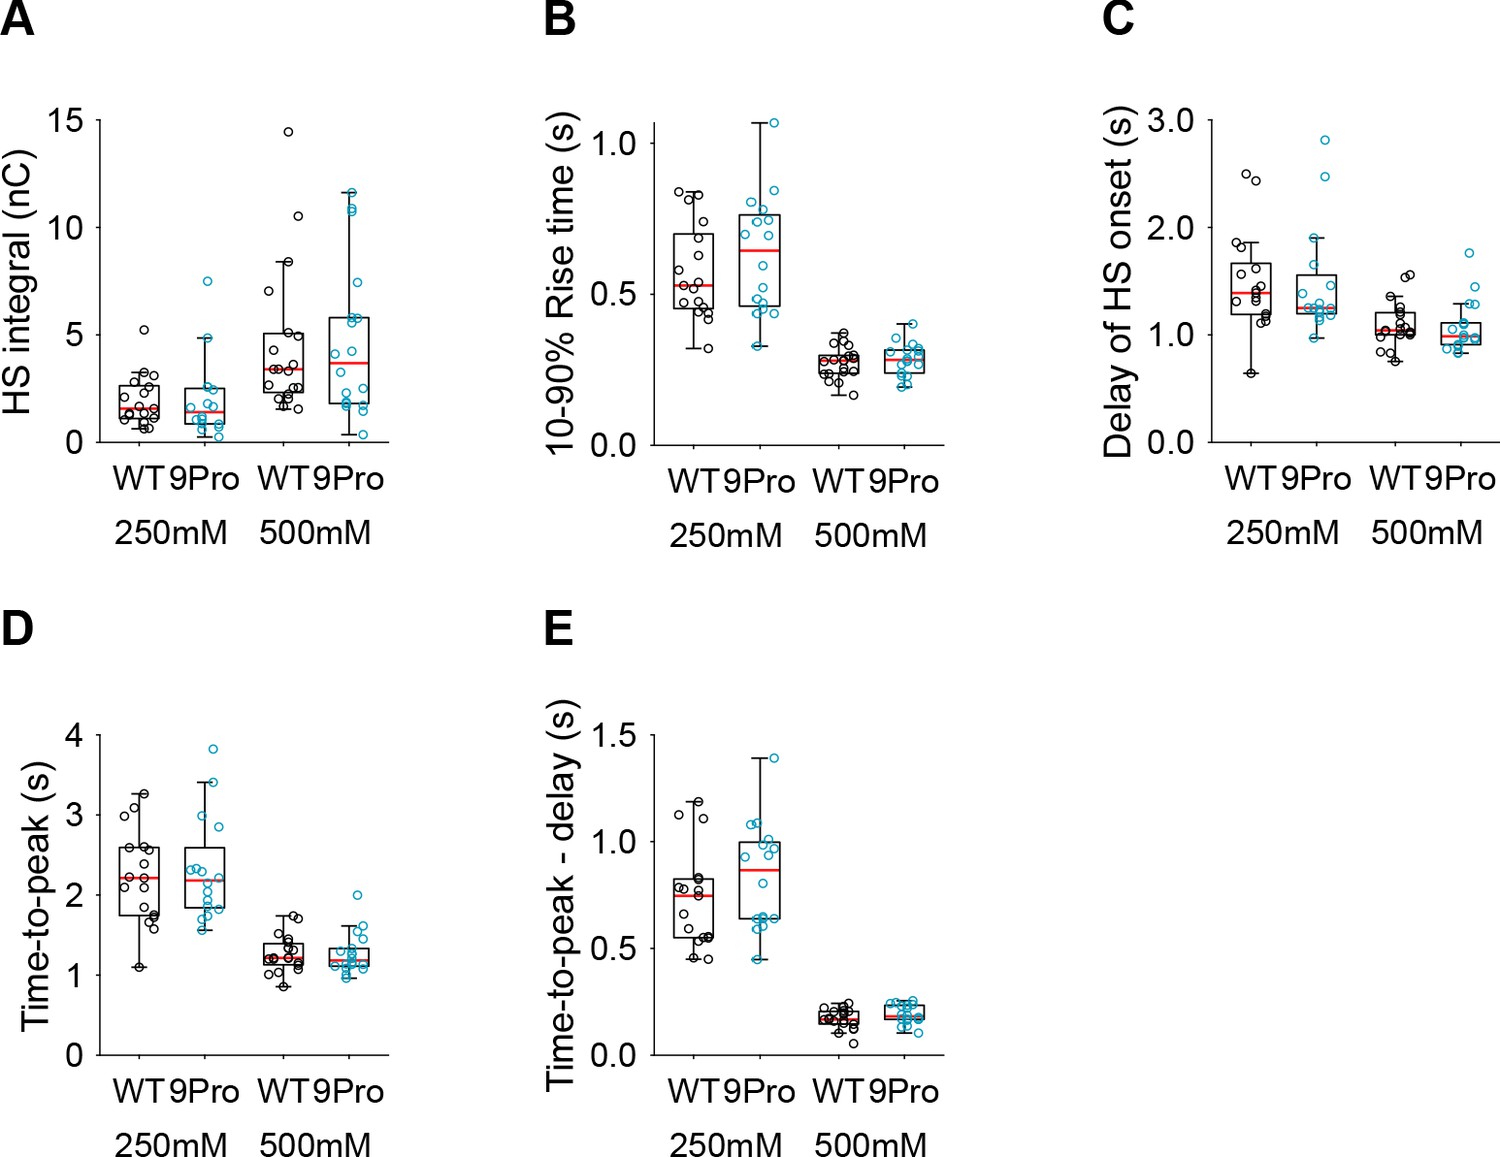
Additional HS parameters from Syt1 WT and Syt1 9Pro expressing neurons.
(A) Integral of current from HS-induced release at different concentrations. (B) 10–90% rise time of peak HS-induced current. (C) Time delay after application of HS before onset of release. (D) Time from start of HS application till peak HS-induced current. (E) Time from start of HS application till peak HS-induced current, corrected for the delay in release onset after HS application. All panels comparing Syt1 WT and Syt1 9Pro (*p<0.05, Wilcoxon rank sum test).
-
Figure 2—figure supplement 2—source data 1
Statistics overview.
- https://cdn.elifesciences.org/articles/55713/elife-55713-fig2-figsupp2-data1-v2.xlsx
Figure 3 with 3 supplements
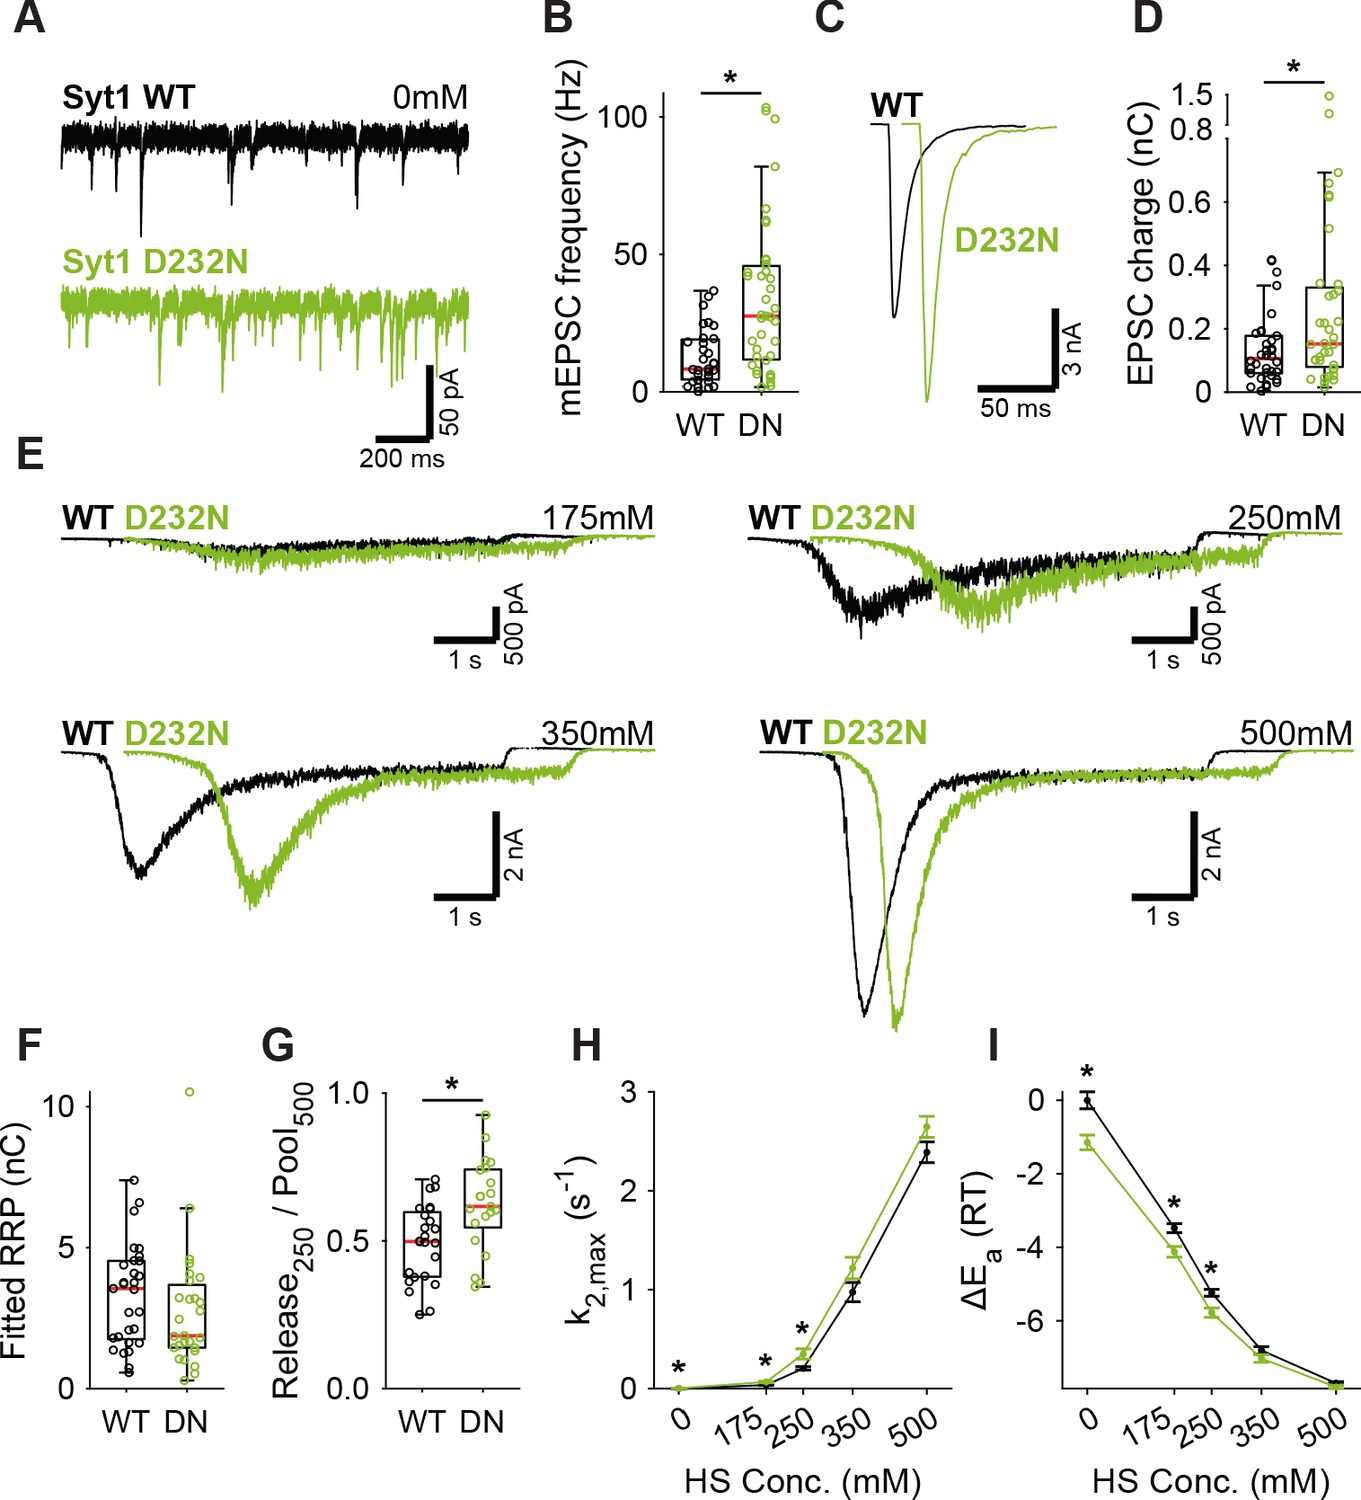
A decreased energy barrier increases vesicle fusion in Syt1 D232N expressing synapses.
(A) Representative traces of spontaneous release (0 mM HS), and (B) boxplot of spontaneous frequency in Syt1 WT and Syt1 D232N expressing synapses. (C) Representative traces of AP-evoked release in Syt1 WT and Syt1 D232N, overlaid with 20 ms offset, and (D) boxplot of charge transferred during the first evoked EPSC. (E) Representative traces of HS-induced release in Syt1 WT and Syt1 D232N, overlaid with 1 s offset, at 175 mM, 250 mM, 350 mM, and 500 mM HS, and boxplots of (F) RRP charge estimated from 500 mM HS, (G) depleted RRP fraction at 250 mM HS in Syt1 WT and Syt1 D232N. (H) Plots (mean ± S.E.M.) of maximal HS release rates, and (I) change in the fusion energy barrier at different HS concentrations for Syt1 WT and Syt1 D232N. (*p<0.05, Wilcoxon rank sum test).
-
Figure 3—source data 1
Statistics overview.
- https://cdn.elifesciences.org/articles/55713/elife-55713-fig3-data1-v2.xlsx
Figure 3—figure supplement 1
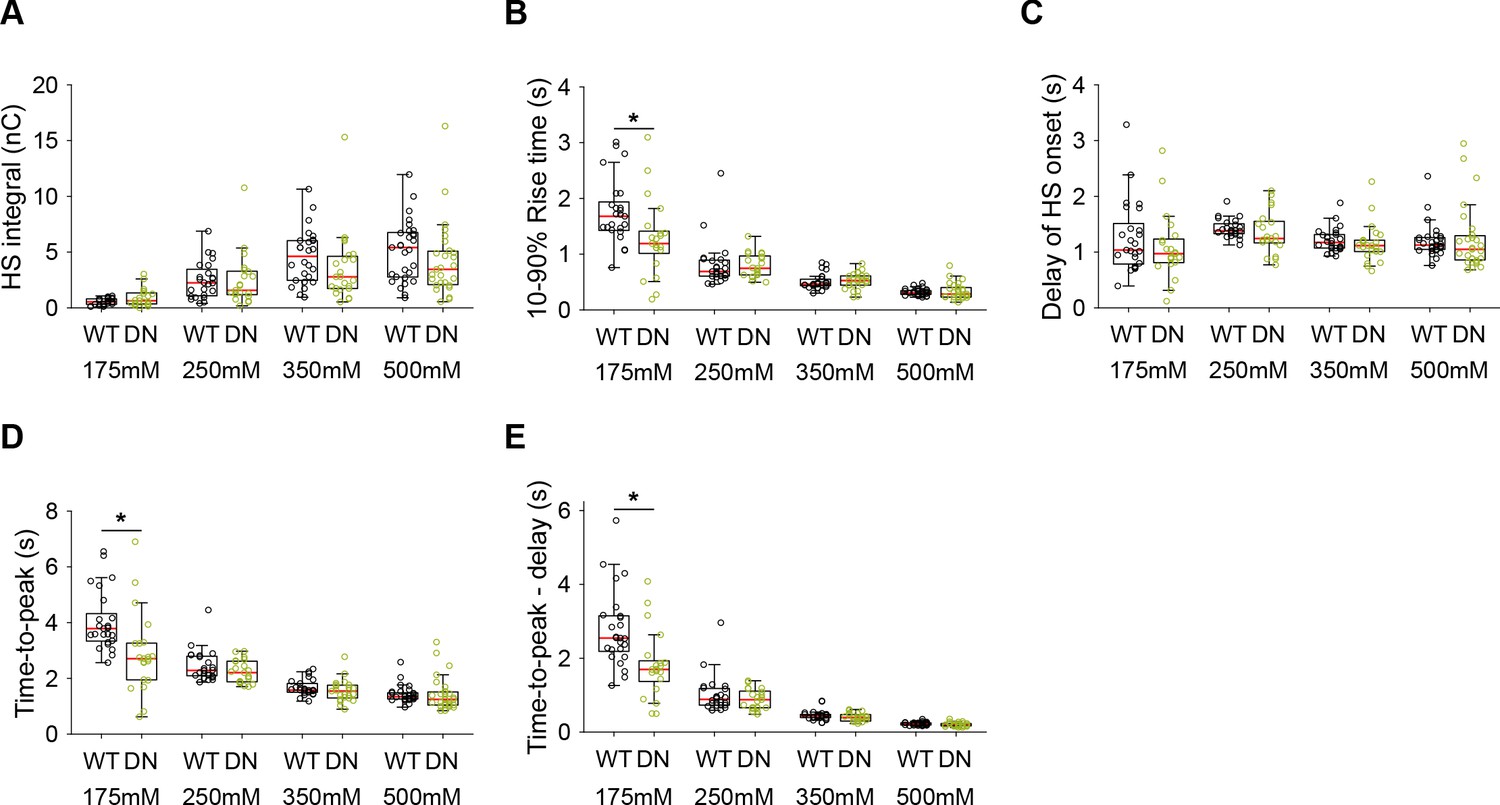
Additional HS parameters from Syt1 WT and Syt1 D232N expressing neurons.
(A) Integral of current from HS-induced release at different concentrations. (B) 10–90% rise time of peak HS-induced current. (C) Time delay after application of HS before onset of release. (D) Time from start of HS application till peak HS-induced current. (E) Time from start of HS application till peak HS-induced current, corrected for the delay in release onset after HS application. All panels comparing Syt1 WT and Syt1 D232N (*p<0.05, Wilcoxon rank sum test).
-
Figure 3—figure supplement 1—source data 1
Statistics overview.
- https://cdn.elifesciences.org/articles/55713/elife-55713-fig3-figsupp1-data1-v2.xlsx
Figure 3—figure supplement 2
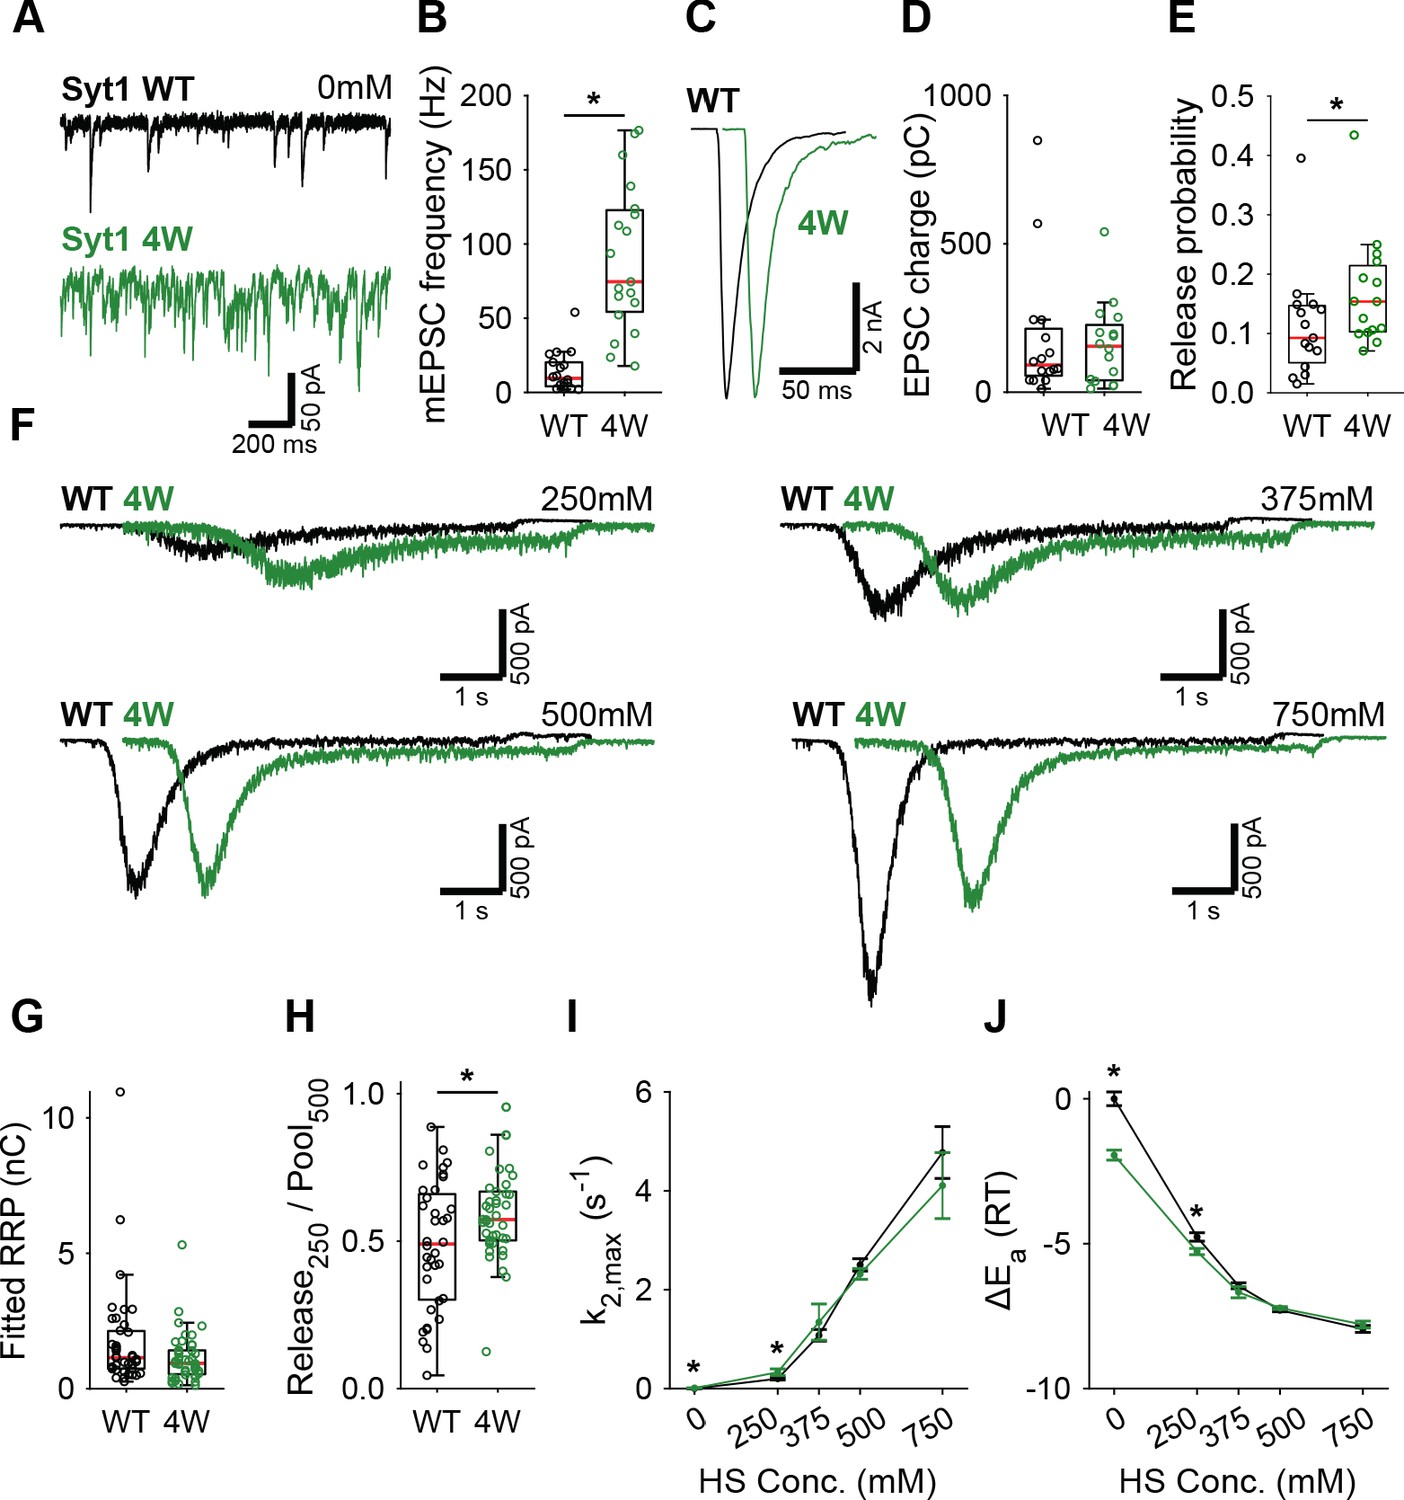
Syt1 4W mutation increases HS release rates only at low concentration.
(A) Representative traces of spontaneous release (0 mM HS), and (B) boxplot of spontaneous frequency in Syt1 WT and Syt1 4W expressing synapses. (C) Representative traces of AP-evoked release in Syt1 WT and Syt1 4W, overlaid with 20 ms offset, and (D) boxplots of charge transferred during the first evoked EPSC and (E) release probability calculated by dividing the EPSC charge by the HS-derived RRP charge (G). (F) Representative traces of HS-induced release in Syt1 WT and Syt1 4W, overlaid with 1 s offset, at 250 mM, 375 mM, 500 mM, and 750 mM HS, and boxplots of (G) RRP charge estimated from 500 mM HS, (H) depleted RRP fraction at 250 mM HS in Syt1 WT and Syt1 4W. (I) Plots (mean ± S.E.M.) of maximal HS release rates, and (J) change in the fusion energy barrier at different HS concentrations for Syt1 WT and Syt1 4W. (*p<0.05, Wilcoxon rank sum test).
-
Figure 3—figure supplement 2—source data 1
Statistics overview.
- https://cdn.elifesciences.org/articles/55713/elife-55713-fig3-figsupp2-data1-v2.xlsx
Figure 3—figure supplement 3
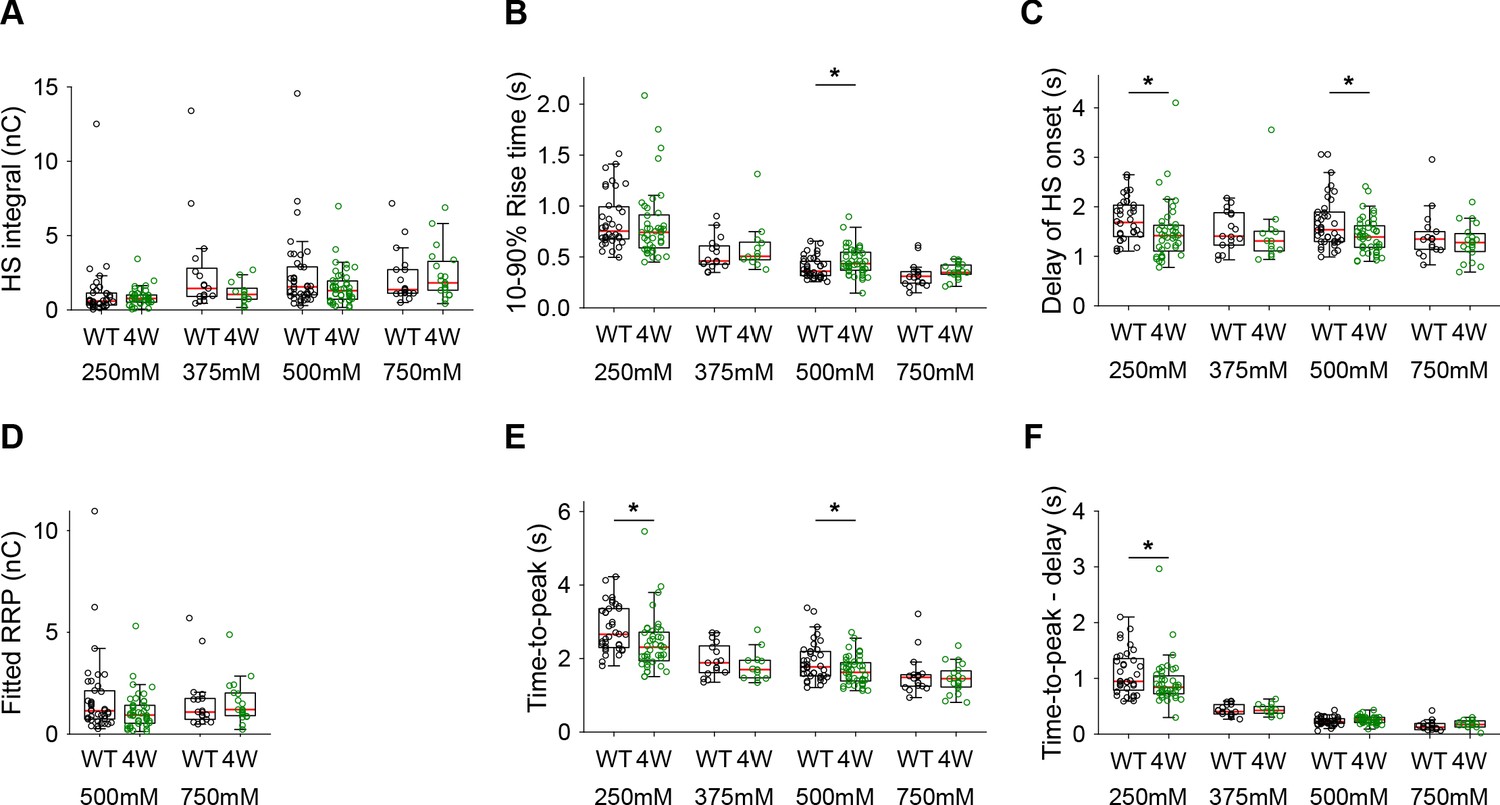
Additional HS parameters from Syt1 WT and Syt1 4W expressing neurons.
(A) Integral of current from HS-induced release at different concentrations. (B) 10–90% rise time of peak HS-induced current. (C) Time delay after application of HS before onset of release. (D) Model -derived RRP values from depleting HS stimulations. (E) Time from start of HS application till peak HS-induced current. (F) Time from start of HS application till peak HS-induced current, corrected for the delay in release onset after HS application. All panels comparing Syt1 WT and Syt1 4W (*p<0.05, Wilcoxon rank sum test).
-
Figure 3—figure supplement 3—source data 1
Statistics overview.
- https://cdn.elifesciences.org/articles/55713/elife-55713-fig3-figsupp3-data1-v2.xlsx
Figure 4 with 1 supplement
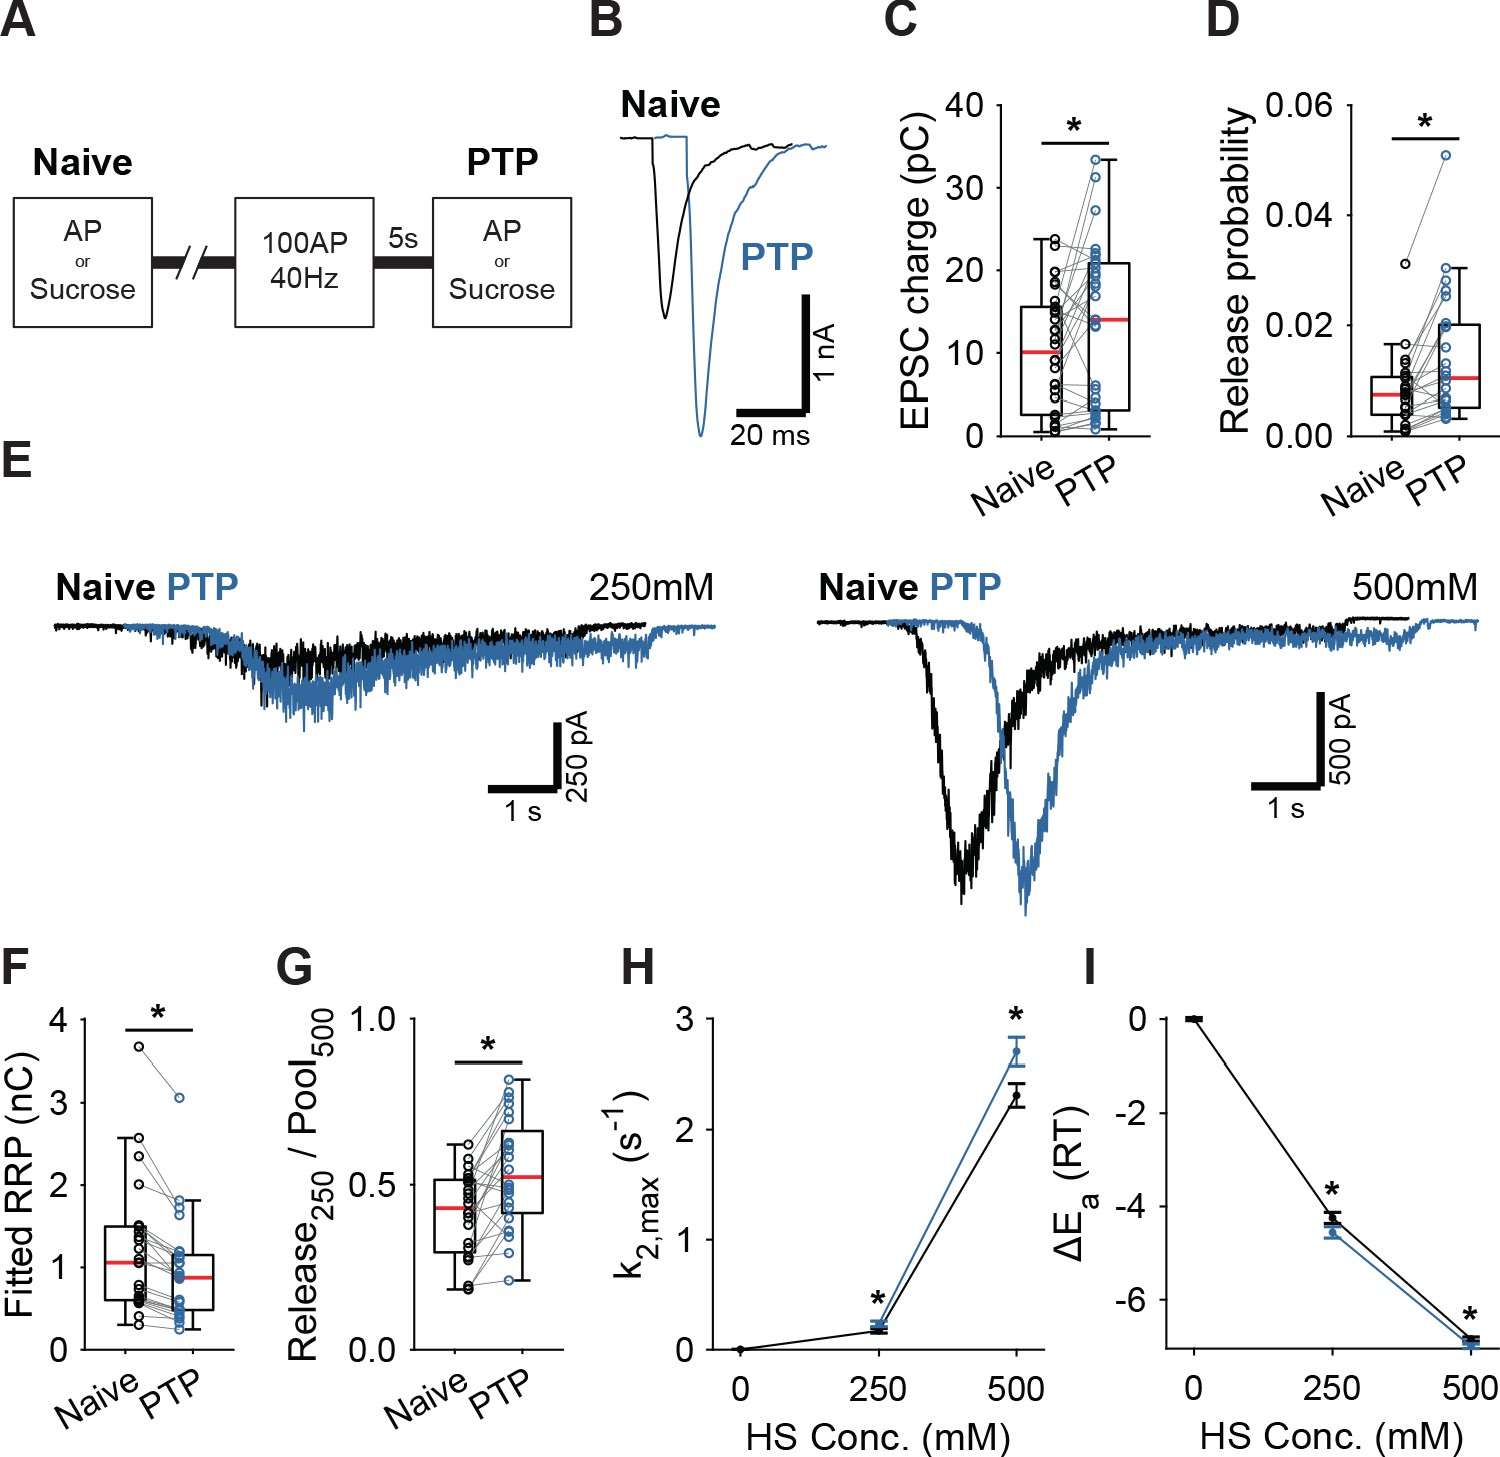
Post-tetanic potentiation causes a decrease in the fusion energy barrier.
(A) Overview of protocol used to induce PTP. (B) Representative traces of AP-evoked release before (Naive) and after PTP in WT synapses, overlaid with 10 ms offset, and (C) boxplots of charge transferred during the first evoked EPSC and (D) release probability calculated by dividing the EPSC charge by the HS-derived RRP charge (F). (E) Representative traces of HS-induced release before and after PTP, overlaid with 1 s offset, at 250 mM and 500 mM HS, and boxplots of (F) RRP charge estimated from 500 mM HS, and (G) depleted RRP fraction at 250 mM HS before (Naive) and after PTP. (H) Plots (mean ± S.E.M.) of maximal HS release rates, and (I) change in the fusion energy barrier at different HS concentrations before (Naive) and after PTP. (*p<0.05, Wilcoxon signed-rank test).
-
Figure 4—source data 1
Statistics overview.
- https://cdn.elifesciences.org/articles/55713/elife-55713-fig4-data1-v2.xlsx
Figure 4—figure supplement 1
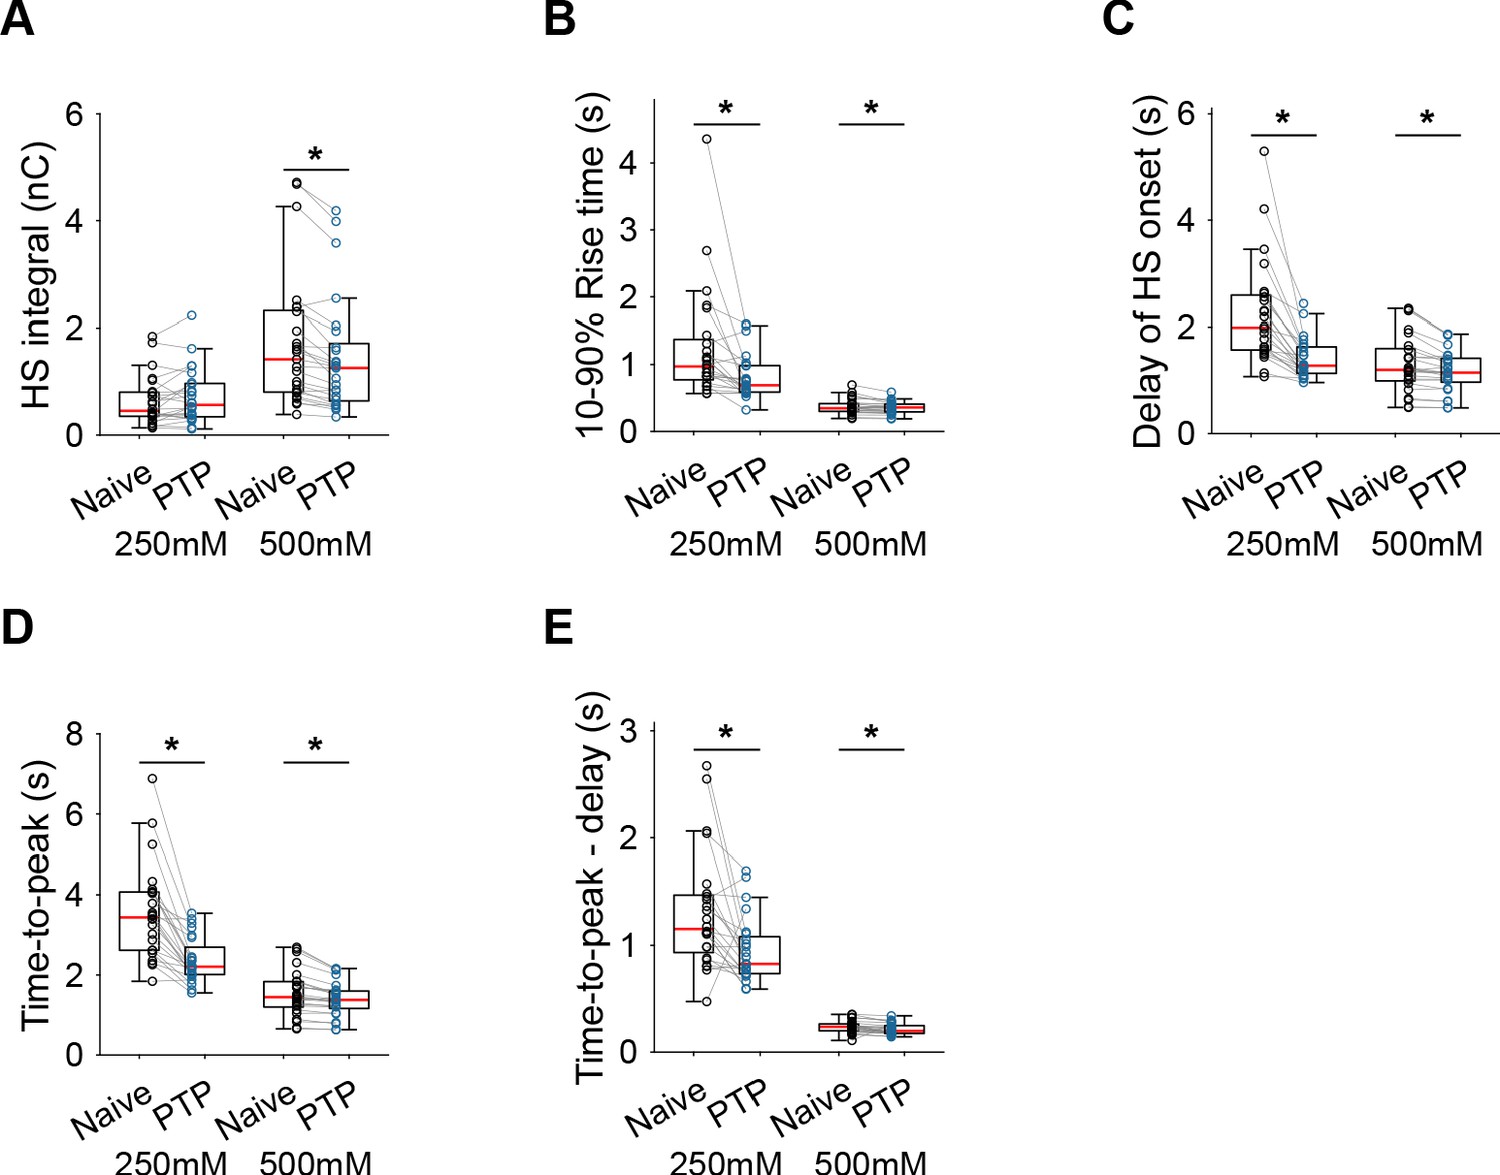
Additional HS parameters before and after PTP in WT neurons.
(A) Integral of current from HS-induced release at different concentrations. (B) 10–90% rise time of peak HS-induced current. (C) Time delay after application of HS before onset of release. (D) Time from start of HS application till peak HS-induced current. (E) Time from start of HS application till peak HS-induced current, corrected for the delay in release onset after HS application. All panels comparing before (Naive) and after PTP in WT (*p<0.05, Wilcoxon signed-rank test).
-
Figure 4—figure supplement 1—source data 1
Statistics overview.
- https://cdn.elifesciences.org/articles/55713/elife-55713-fig4-figsupp1-data1-v2.xlsx
Figure 5 with 1 supplement
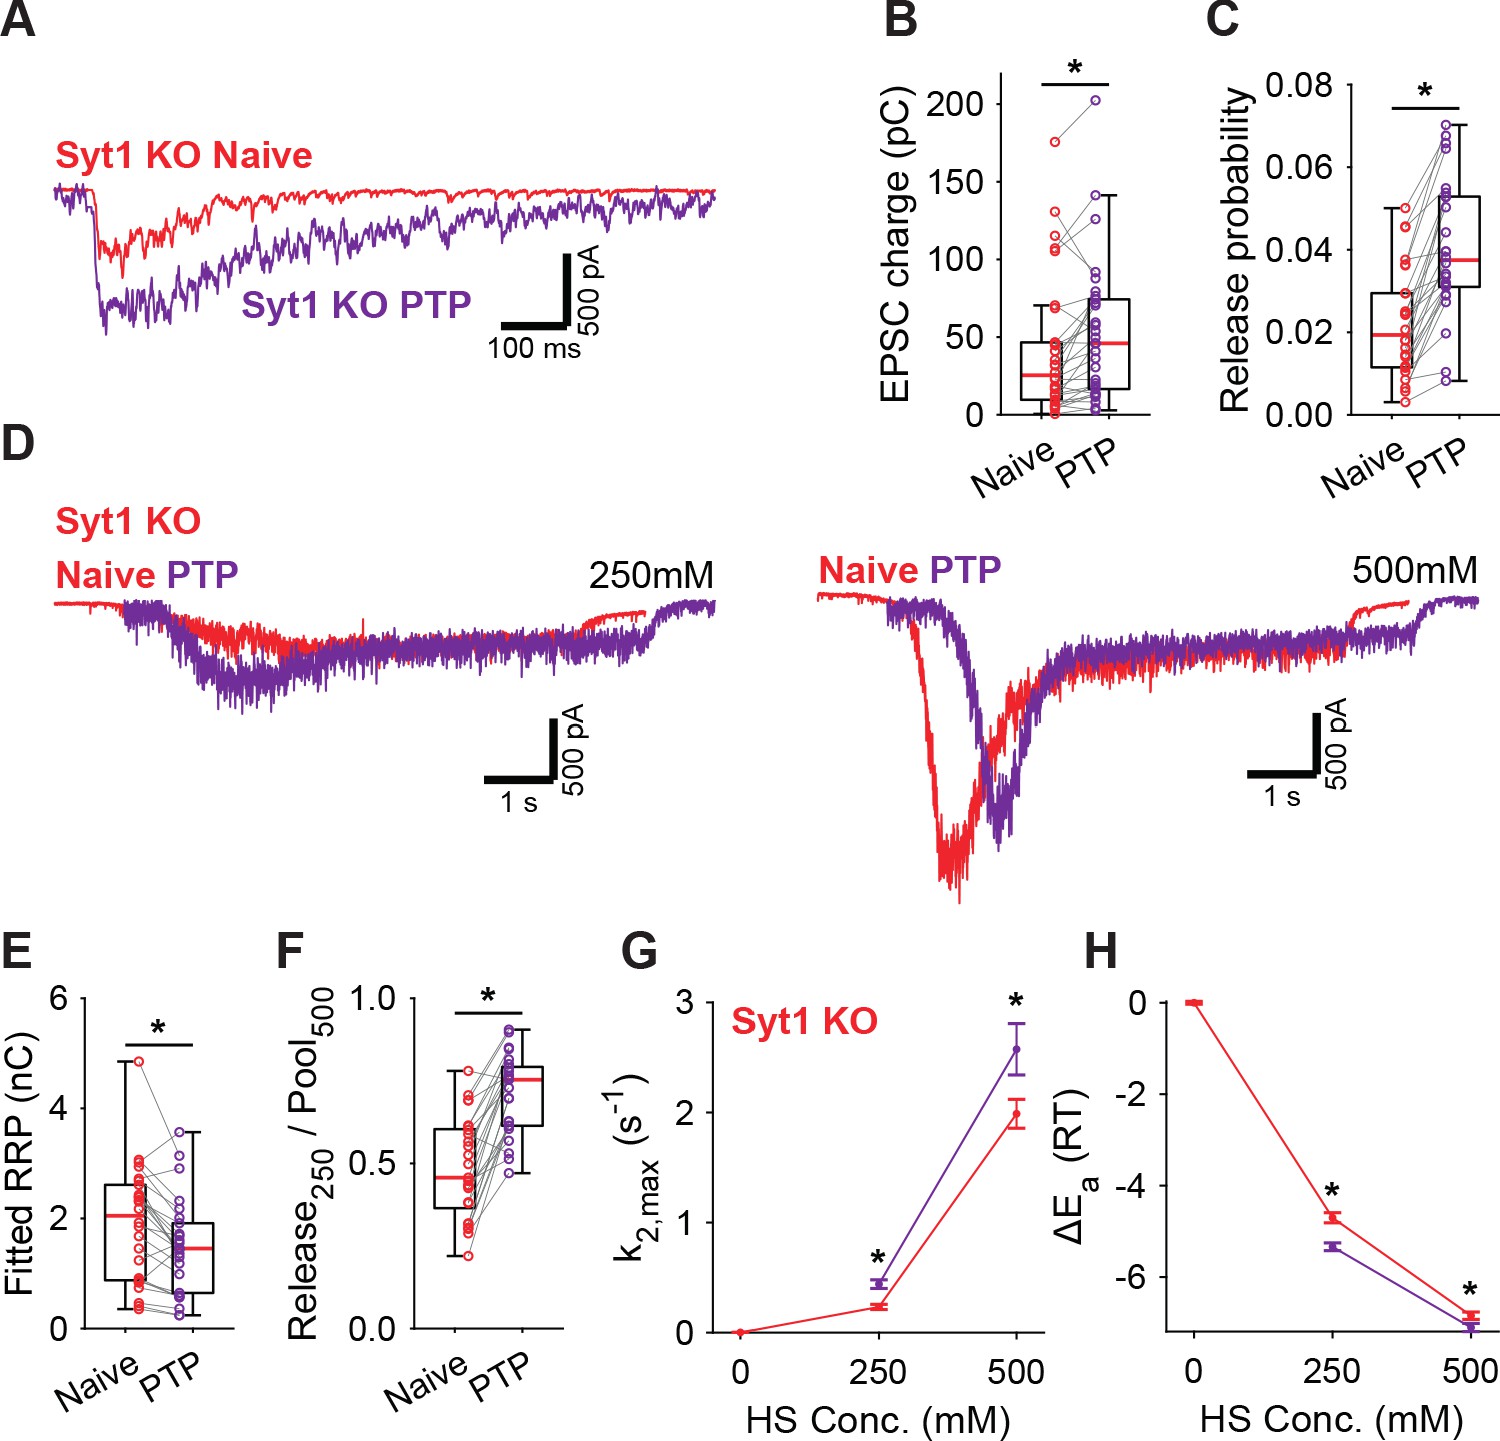
Post-tetanic potentiation decreases the fusion energy barrier independent of Syt1.
(A) Representative traces of AP-evoked release before (Naive) and after PTP in Syt1 KO synapses, overlaid, and (B) boxplots of charge transferred during the first evoked EPSC and (C) release probability calculated by dividing the EPSC charge by the HS-derived RRP charge (E). (D) Representative traces of HS-induced release before and after PTP, overlaid with 1 s offset, at 250 mM and 500 mM HS, and boxplots of (E) RRP charge estimated from 500 mM HS, and (F) depleted RRP fraction at 250 mM HS before (Naive) and after PTP. (G) Plots (mean ± S.E.M.) of maximal HS release rates, and (H) change in the fusion energy barrier at different HS concentrations before (Naive) and after PTP. (*p<0.05, Wilcoxon signed-rank test).
-
Figure 5—source data 1
Statistics overview.
- https://cdn.elifesciences.org/articles/55713/elife-55713-fig5-data1-v2.xlsx
Figure 5—figure supplement 1
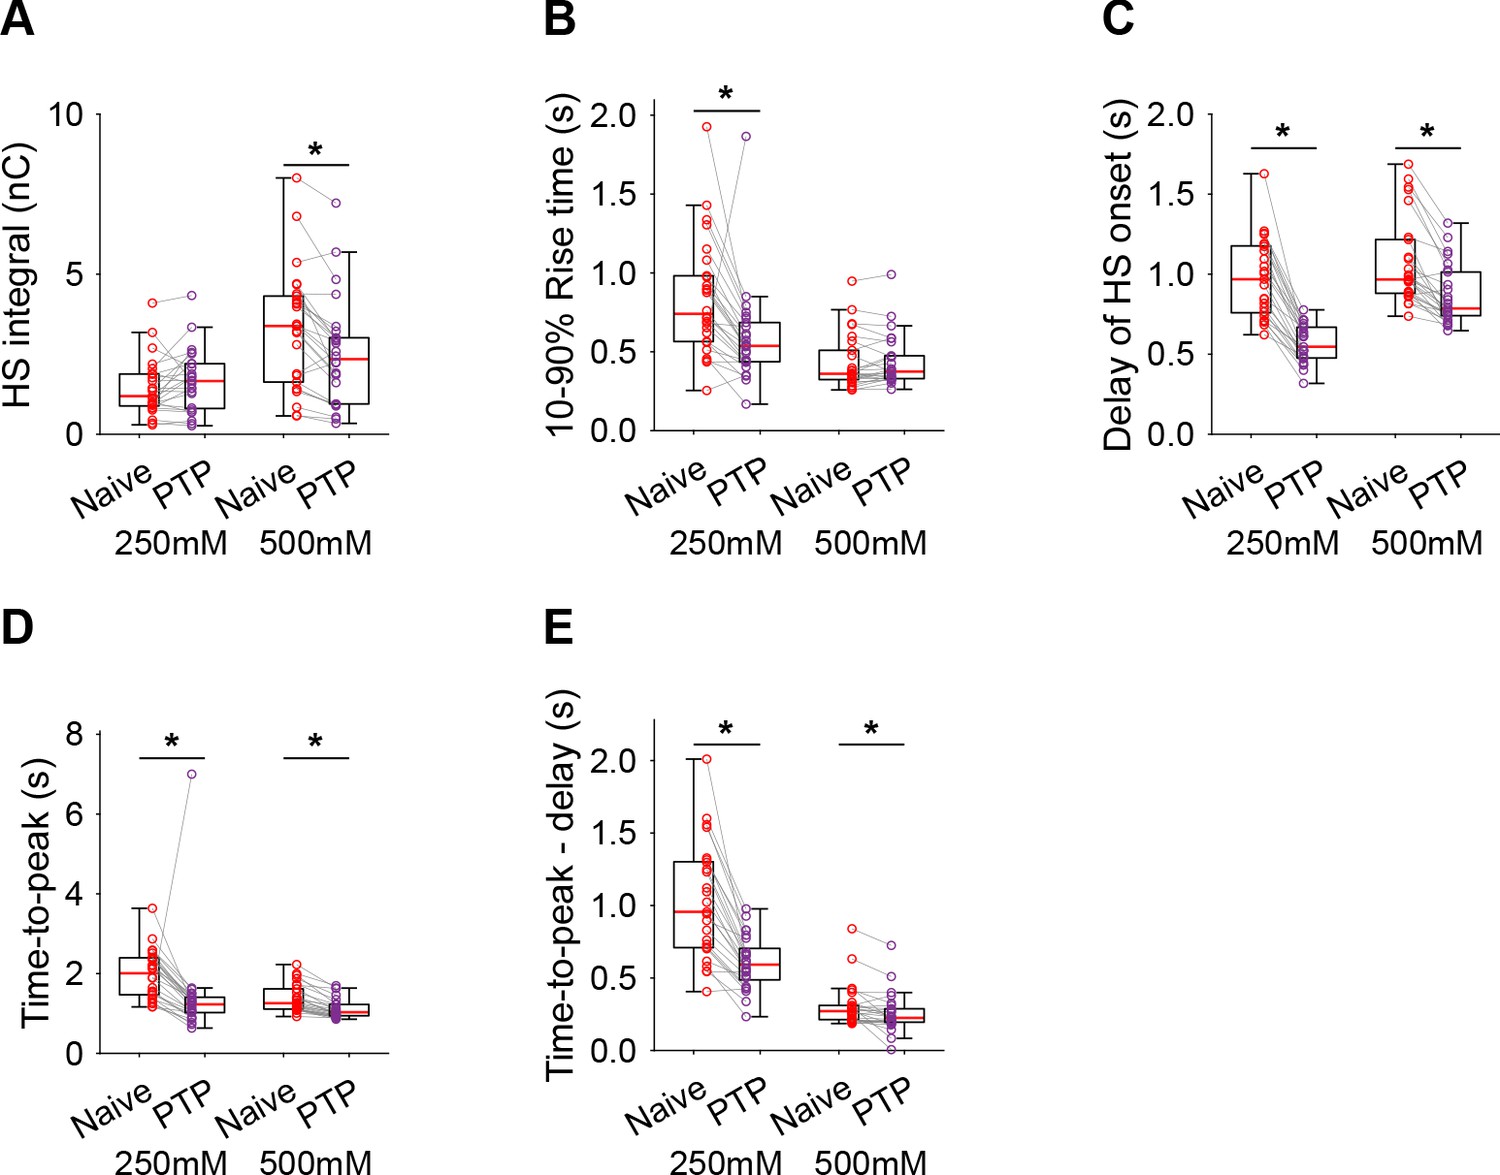
Additional HS parameters before and after PTP in Syt1 KO neurons.
(A) Integral of current from HS-induced release at different concentrations. (B) 10–90% rise time of peak HS-induced current. (C) Time delay after application of HS before onset of release. (D) Time from start of HS application till peak HS-induced current. (E) Time from start of HS application till peak HS-induced current, corrected for the delay in release onset after HS application. All panels comparing before (Naive) and after PTP in Syt1 KO (*p<0.05, Wilcoxon signed-rank test).
-
Figure 5—figure supplement 1—source data 1
Statistics overview.
- https://cdn.elifesciences.org/articles/55713/elife-55713-fig5-figsupp1-data1-v2.xlsx
Figure 6 with 1 supplement
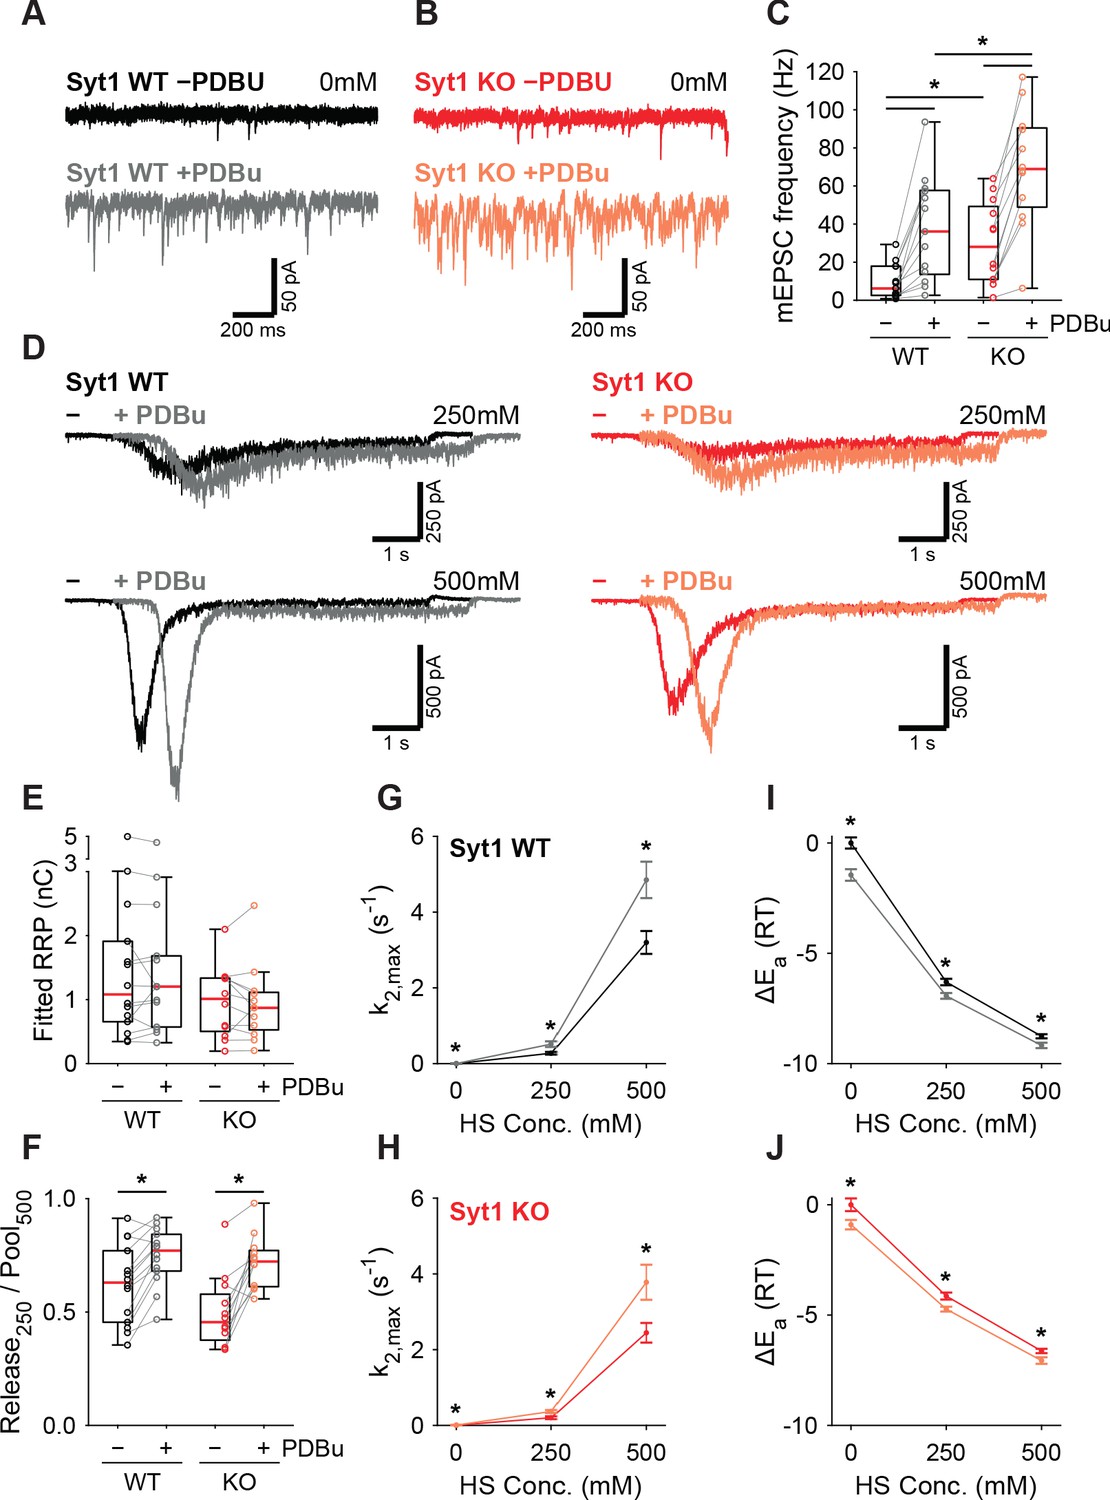
PDBu increases vesicles fusion by lowering the energy barrier in the presence or absence of Syt1.
Representative traces of spontaneous release (0 mM HS) before (−PDBu; top) and after (+PDBu; bottom bath application of PDBu in WT (A) and Syt1 KO (B) synapses). (C) Boxplots of spontaneous release frequency in WT and Syt1 KO before and after PDBu. (D) Representative traces of HS-induced release at 250 mM and 500 mM HS, and boxplots of (E) RRP charge estimated from 500 mM HS, (F) depleted RRP fraction at 250 mM HS in WT and Syt1 KO before and after PDBu. (G,H) Plots (mean ± S.E.M.) of maximal HS release rates, and (I,J) change in the fusion energy barrier at different HS concentrations before and after PDBu, for WT (G,I) and Syt1 KO (H,J). (*p<0.05, Wilcoxon rank sum test for independent and Wilcoxon signed-rank test for paired samples).
-
Figure 6—source data 1
Statistics overview.
- https://cdn.elifesciences.org/articles/55713/elife-55713-fig6-data1-v2.xlsx
Figure 6—figure supplement 1
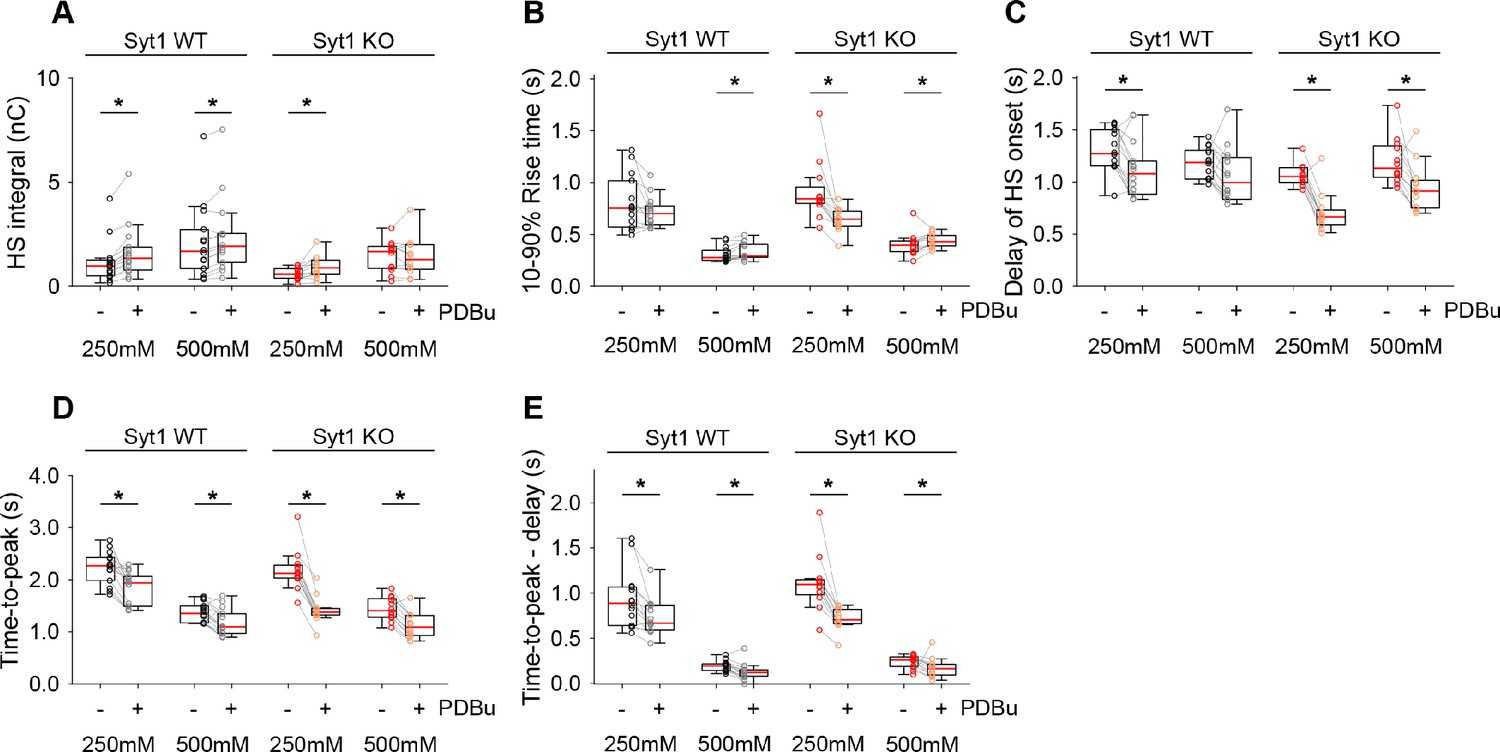
Additional HS parameters before and after PDBu in Syt1 WT and KO neurons.
(A) Integral of current from HS-induced release at different concentrations. (B) 10–90% rise time of peak HS-induced current. (C) Time delay after application of HS before onset of release. (D) Time from start of HS application till peak HS-induced current. (E) Time from start of HS application till peak HS-induced current, corrected for the delay in release onset after HS application. All panels comparing before (-) and after (+) PDBu (*p<0.05, Wilcoxon signed-rank test).
-
Figure 6—figure supplement 1—source data 1
Statistics overview.
- https://cdn.elifesciences.org/articles/55713/elife-55713-fig6-figsupp1-data1-v2.xlsx
Figure 7 with 1 supplement
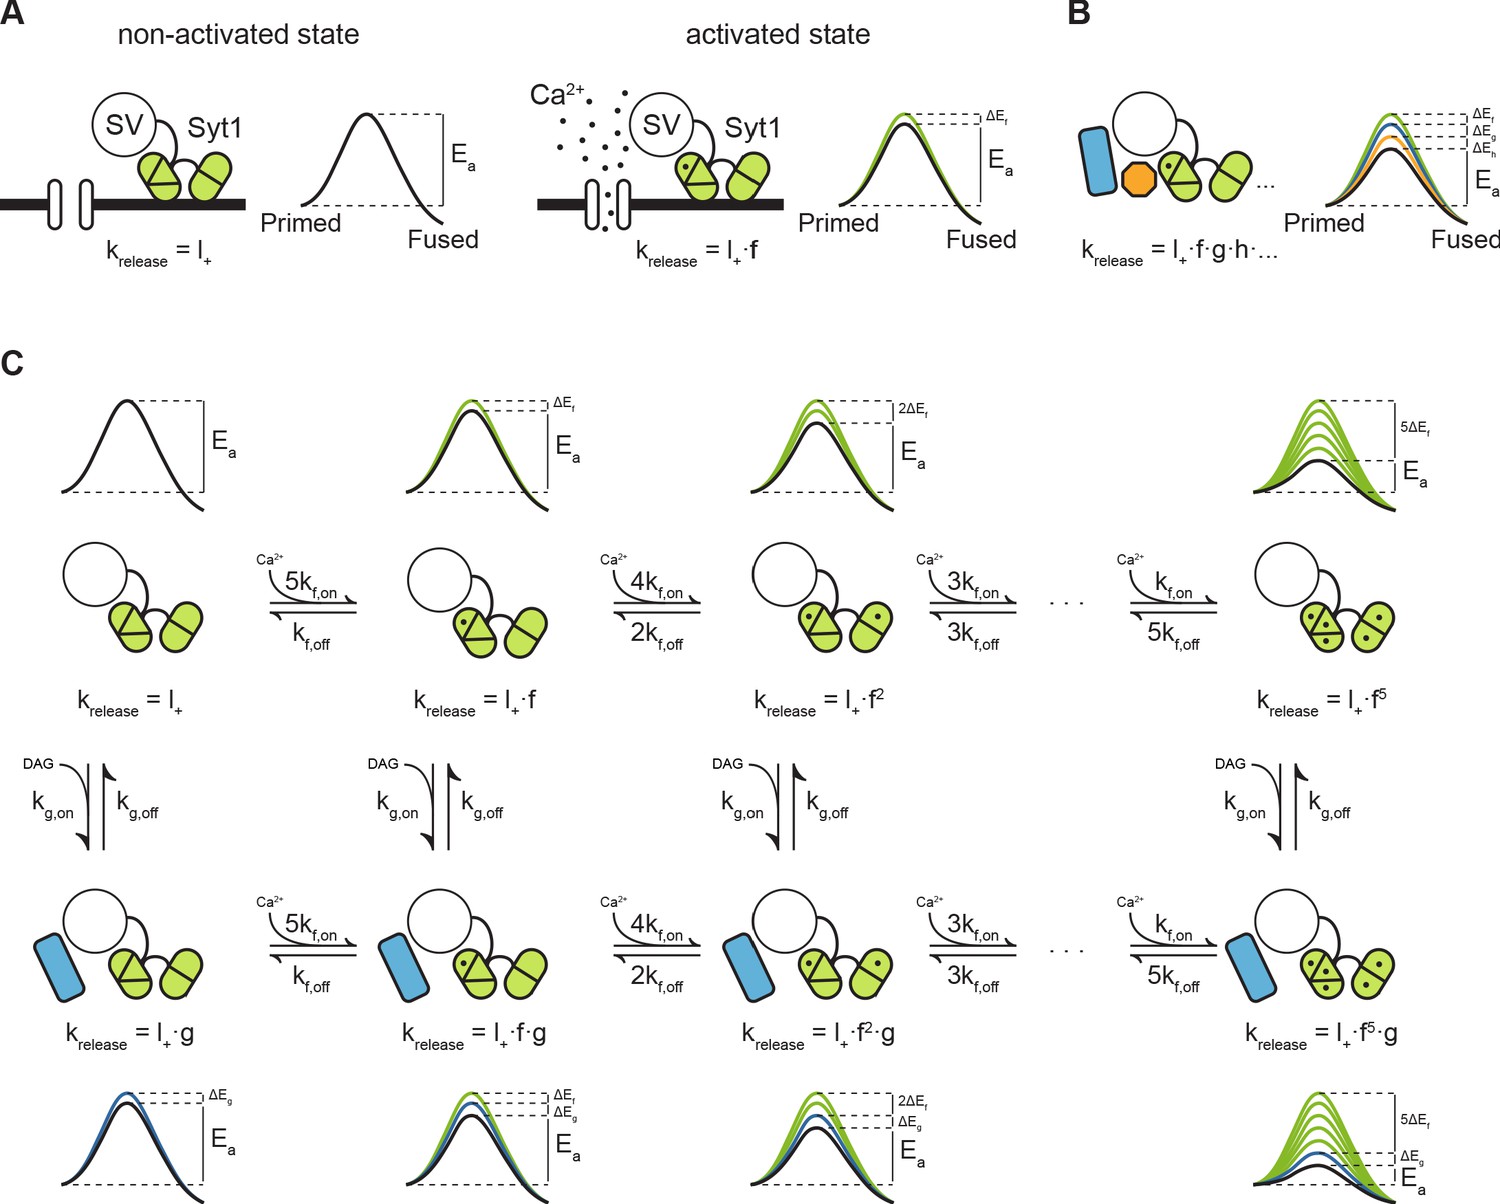
Modulation of the energy barrier through multiple sensors and activation states.
(A) Fusion sensors in the non-activated state do not affect the fusion energy barrier (), release rates (krelease) correspond to the energy barrier in the ground state (; left). Upon activation by Ca2+, Syt1 lowers the fusion energy barrier (), multiplying release rates (;right). (B) Multiple sensors in the activated state, each with separate additive effects on the energy barrier, provide multiplicative effects on release rates. (C) Binding of multiple Ca2+ ions to Syt1 up to a maximum of 5, may be represented as multiple activation states additively lowering the energy barrier and multiplying release rates (top row). Additional activation of a second sensor () by DAG further expands the total number of states (bottom row), providing additional release pathways and increasing potential for plasticity.
Figure 7—figure supplement 1
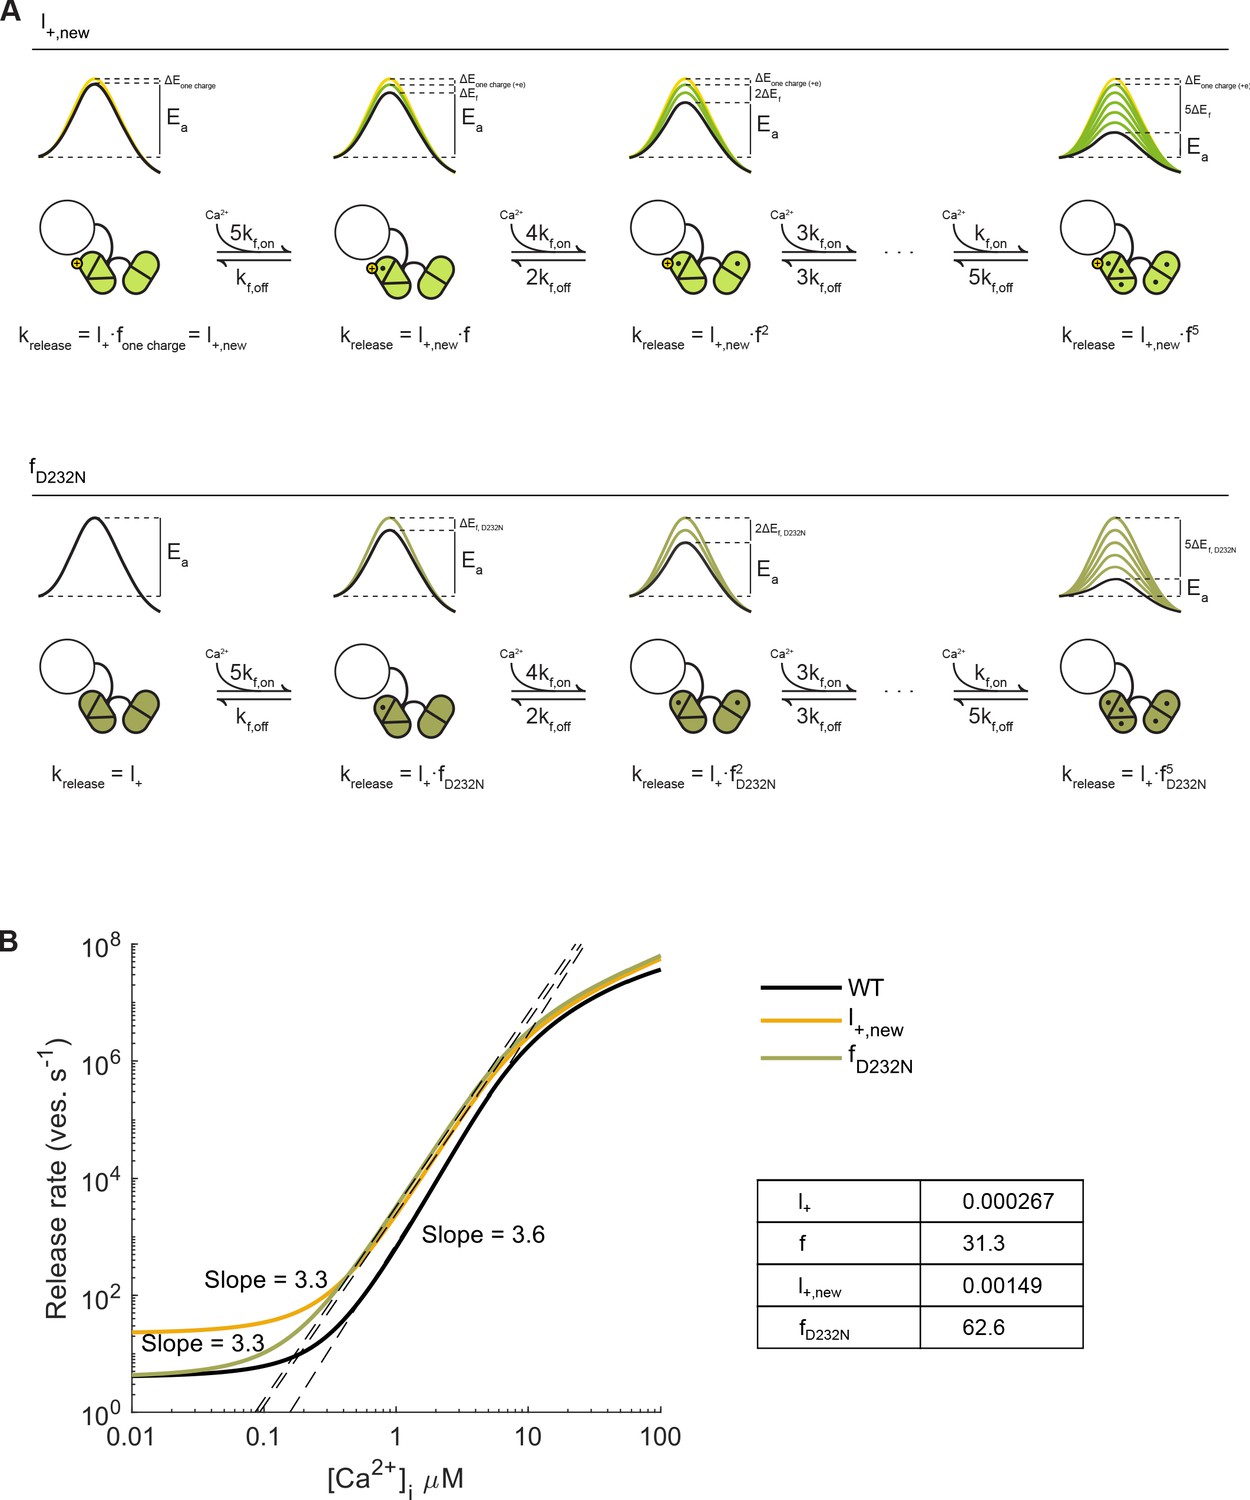
Syt1 D232N as a permanently activated sensor acting on the energy barrier.
(A) Two scenarios for increased Ca2+ sensitivity in Syt1 D232N: 1) Increased positive charge in Syt1 D232N lowers the ground state energy barrier, thereby increasing the basal fusion rate constant (, with half the efficacy of a single Ca2+ ion, to (first row). 2) Twofold increase in Ca2+-dependent SNARE binding in Syt1 D232N, increases the effect of Ca2+ binding on the fusion rate two-fold ( (second row). (B) Simulations with the allosteric model (Lou et al., 2005), reveal that both increased positive charge () and increased SNARE binding () lead to higher release rates, though only for was Ca2+-independent release also increased. Linear fits of the steepest part of the curves indicate no clear change in Ca2+-cooperativity compared to WT.
-
Figure 7—figure supplement 1—source data 1
Model parameter values.
- https://cdn.elifesciences.org/articles/55713/elife-55713-fig7-figsupp1-data1-v2.xlsx
Tables
Key resources table
| Reagent type (species) or resource | Designation | Source or reference | Identifiers | Additional information |
|---|---|---|---|---|
| Strain, strain background (M. musculus) | C57BL/6 | Charles River Laboratories | RRID:IMSR_CRL:27 | |
| Strain, strain background (M. musculus) | Synaptotagmin-1 KO | Geppert M, Goda Y, Hammer RE, Li C, Rosahl TW, Stevens CF, Südhof TC: Synaptotagmin I: a major Ca2+ sensor for transmitter release at a central synapse. Cell 1994, 79:717–27. | DOI:10.1016/0092-8674(94)90556-8 PMID:7954835 | |
| Transfected construct (M. musculus) | pSyn-Syt1-WT-2A-EGFP | Huson V, Boven MA van, Stuefer A, Verhage M, Cornelisse LN, van Boven MA, Stuefer A, Verhage M, Cornelisse LN, Boven MA van, et al.: Synaptotagmin-1 enables frequency coding by suppressing asynchronous release in a temperature dependent manner. Sci Rep 2019, 9:11341. | DOI:10.1038/s41598-019-47487-9 PMID:31383906 | |
| Transfected construct (M. musculus) | pLOXSyn-Syt1-9Pro-Syn-GFP | Liu H, Bai H, Xue R, Takahashi H, Edwardson JM, Chapman ER: Linker mutations reveal the complexity of synaptotagmin one action during synaptic transmission. Nat Neurosci 2014, 17:670–7. | DOI:10.1038/nn.3681 PMID:24657966 | |
| Transfected construct (M. musculus) | pSyn-Syt1(D232N)-IRES-EGFP | This paper | Generated in-house with Quickchange (Stratagene). Construct available upon request. | |
| Transfected construct (M. musculus) | pSyn-Syt1(M173W,F234W,V304W,I367W)-IRES-EGFP | This paper | Generated in-house with Quickchange (Stratagene). Construct available upon request. | |
| Antibody | anti-MAP2 polyclonal chicken | Abcam | Cat#: ab5392 RRID:AB_2138153 | (1:10 000) |
| Antibody | anti-VGLUT1 polyclonal rabbit | Synaptic Systems | Cat#: 135 302 RRID:AB_887877 | (1:500) |
| Antibody | anti-VGLUT1 polyclonal guinea pig | Millipore | Cat#: AB5905 RRID:AB_2301751 | (1:5000) |
| Antibody | anti-VAMP2 monoclonal mouse | Synaptic Systems | Cat#: 104 211 RRID:AB_2782975 | (1:1000) |
| Antibody | anti-Synaptotagmin-1 polyclonal rabbit | T.C. Südhof, Stanford, CA | W855 | (1:1000) |
| Antibody | anti-GFP polyclonal chicken | AVES | Cat#: 1020 RRID:AB_10000240 | (1:2000) |
| Chemical compound, drug | BAPTA-AM | Sigma Aldrich | Cat#: A1076 | |
| Chemical compound, drug | Phorbol-12,13-dibutyrate (Calbiochem) | VWR | Cat#: 80055–388 | |
| Software, algorithm | MATLAB | Mathworks | RRID:SCR_001622 | Version R2020a |
| Software, algorithm | ImageJ/Fiji | Fiji (http://fiji.sc/) | RRID:SCR_002285 | Version 1.52 f |
| Software, algorithm | pClamp | Molecular Devices | RRID:SCR_011323 | Version 10.3 |
Additional files
Download links
A two-part list of links to download the article, or parts of the article, in various formats.
Downloads (link to download the article as PDF)
Open citations (links to open the citations from this article in various online reference manager services)
Cite this article (links to download the citations from this article in formats compatible with various reference manager tools)
Post-tetanic potentiation lowers the energy barrier for synaptic vesicle fusion independently of Synaptotagmin-1
eLife 9:e55713.
https://doi.org/10.7554/eLife.55713


