Axonal mechanisms mediating γ-aminobutyric acid receptor type A (GABA-A) inhibition of striatal dopamine release
- Cellular Neurophysiology Unit, National Institute of Neurological Disorders and Stroke, National Institutes of Health, United States
- Laboratory on Neurobiology of Compulsive Behaviors, National Institute of Alcohol Abuse and Alcoholism, National Institutes of Health, United States
Figures
Figure 1 with 1 supplement
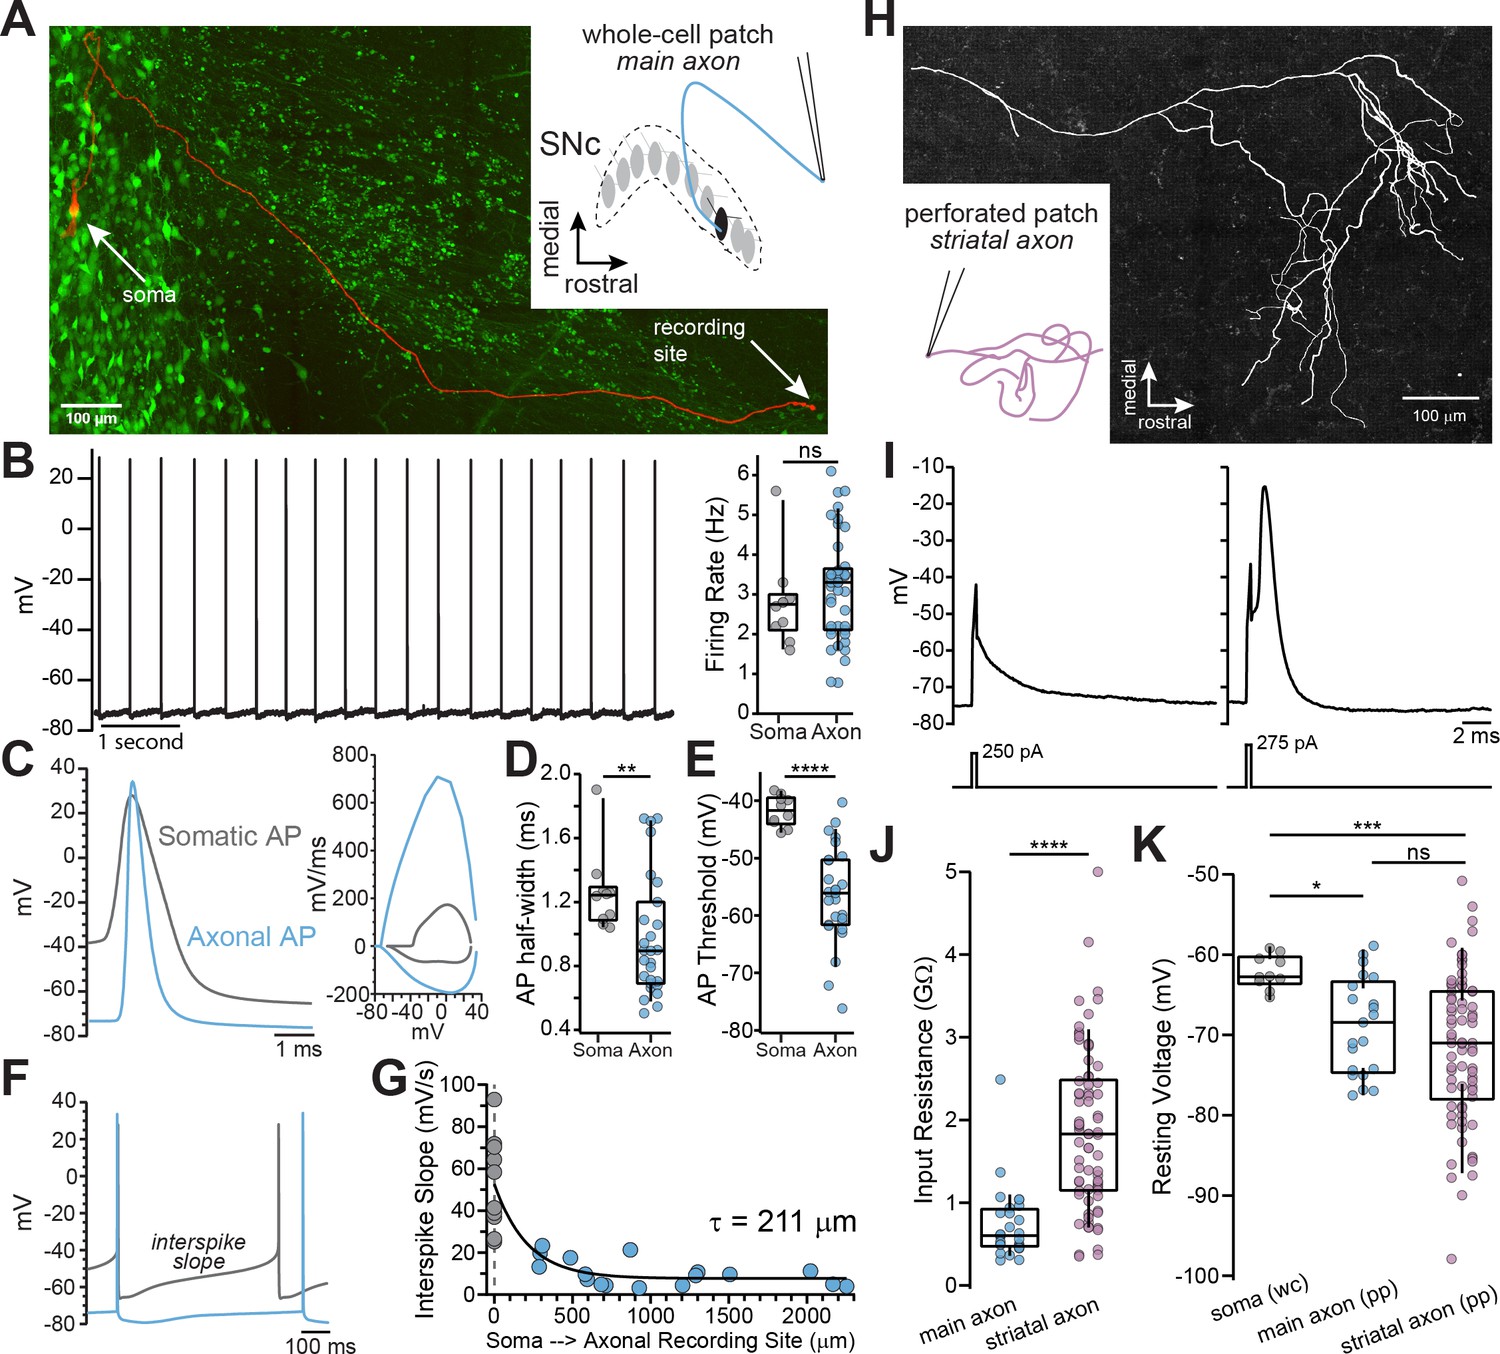
Whole-cell and perforated-patch recordings from dopamine neuron axons.
(A) Main axon recorded in whole-cell mode with a connected soma (filled with neurobiotin, imaged with streptavidin-Cy5, slice cleared with CUBIC, red); GFP driven by the TH promoter (green). (B) Trace of spontaneous action potentials recorded from a dopaminergic axon (left). Firing rate from somatic (n = 10) and axonal recordings (n = 41; p=0.298) (right). (C) Overlay of an axonal and somatic spike (left). Phase plot for a somatic and axonal action potential (right). (D) Half-peak widths from somatic (n = 10) and axonal (n = 27) APs (**p=0.008). (E) AP thresholds recorded from soma (n = 10) and axons (n = 26)(****p<0.0001). (F) Example traces of interspike voltage from obtained from axonal (blue) and somatic (gray) recordings. (G) Slope of interspike voltage plotted against recording distance between axonal recording site (blue) and soma (gray). (H) Post-hoc reconstruction of a patched striatal axon. (I) Trace of subthreshold depolarization (left) and axonal AP (right) evoked by 250 pA and 275 pA current injection. (J) Input resistance values for main axon (n = 28) and striatal axons (n = 74) APs (****p<0.0001). (K) Comparison of the mean interspike voltage between soma (n = 10) main axon (n = 21) and striatal axon, which was measured as the average resting membrane potential (n = 74) (*p=0.032; ***p=0.0007; ns p=0.87).
-
Figure 1—source data 1
Raw values used for plots in Figure 1.
- https://cdn.elifesciences.org/articles/55729/elife-55729-fig1-data1-v1.xlsx
Figure 1—video 1
Animated rotating movie of a striatal filled axon.
Reconstructed in Neurolucida.
Figure 2
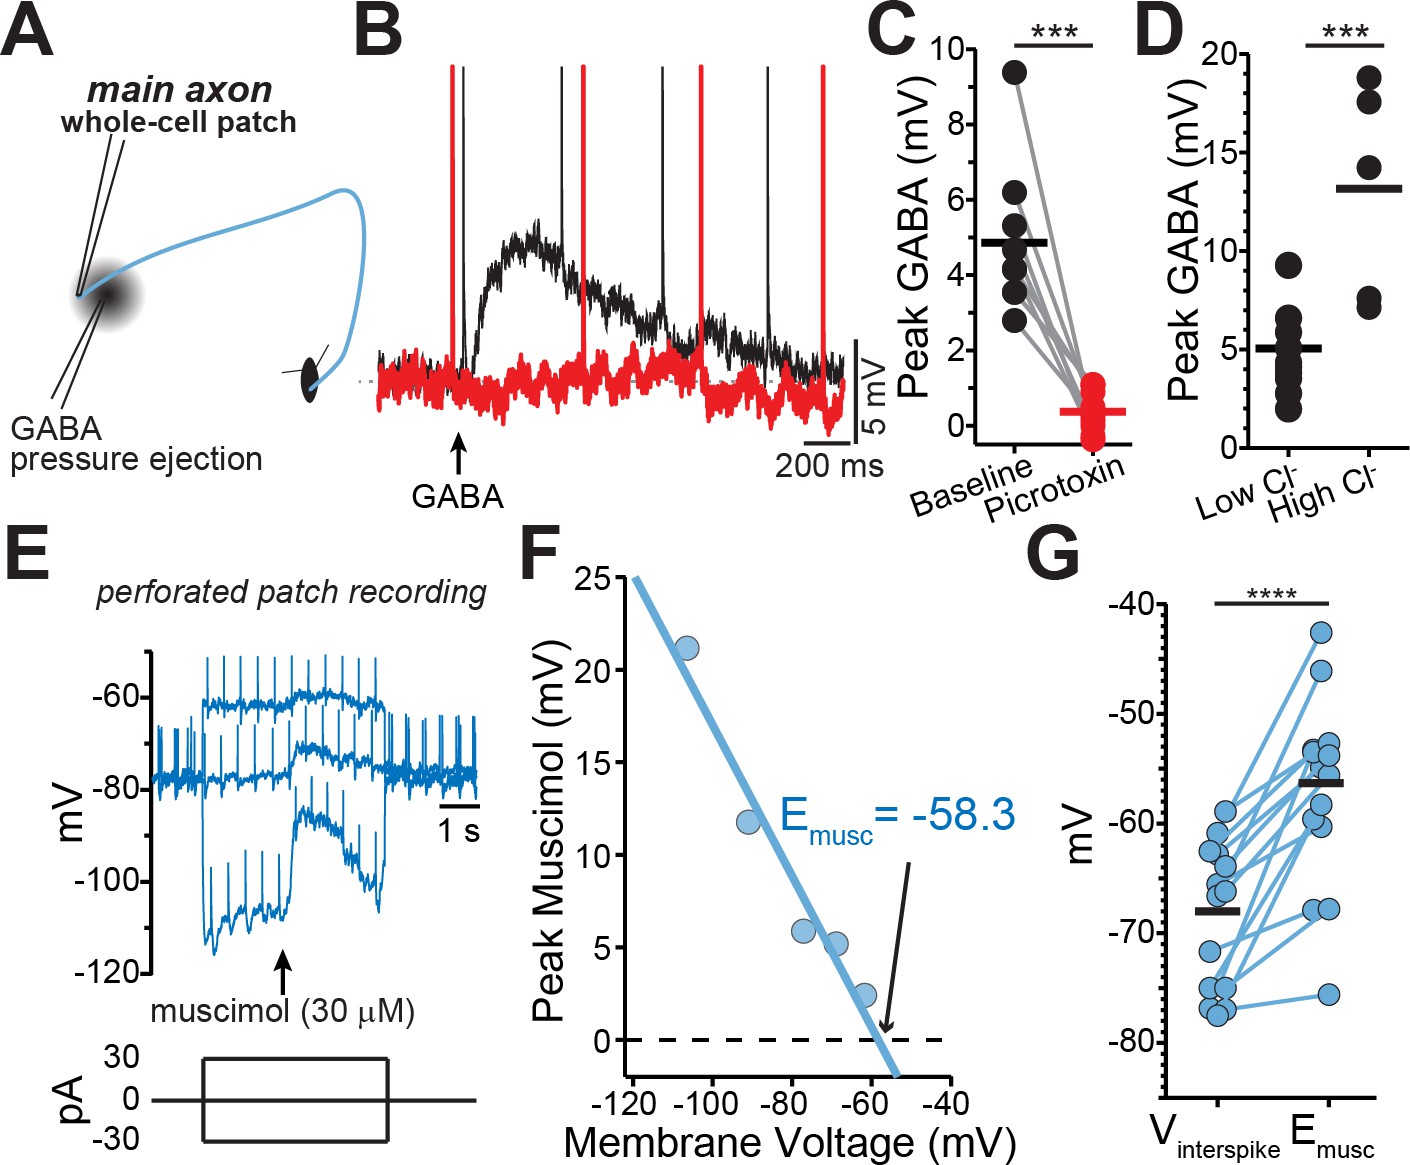
GABA-A receptors located on the axons of dopaminergic neuron are depolarizing.
(A) Schematic of experimental setup. (B) Example traces of pressure ejection of GABA onto the axon in control (black) and after application of picrotoxin (red). (C) Peak of amplitude of GABA-evoked depolarization in control and after picrotoxin (n = 9; ***p=0.0003). (D) Peak amplitude of GABA-evoked depolarization recorded with low (n = 5) or high (n = 10) chloride internal solutions (***p=0.0008). (E) Example traces overlaid from three different current injections. Timing of muscimol puff application indicated by arrow. (F) Peak of the muscimol-evoked depolarization plotted against the average interspike voltage. Fitted line was used to determine the reversal potential. (G) Paired values indicating mean interspike voltage (Vinterspike) and muscimol reversal potential (Emusc) in individual axons (n = 15; ****p<0.0001).
-
Figure 2—source data 1
Raw values used for plots in Figure 2.
- https://cdn.elifesciences.org/articles/55729/elife-55729-fig2-data1-v1.xlsx
Figure 3 with 1 supplement
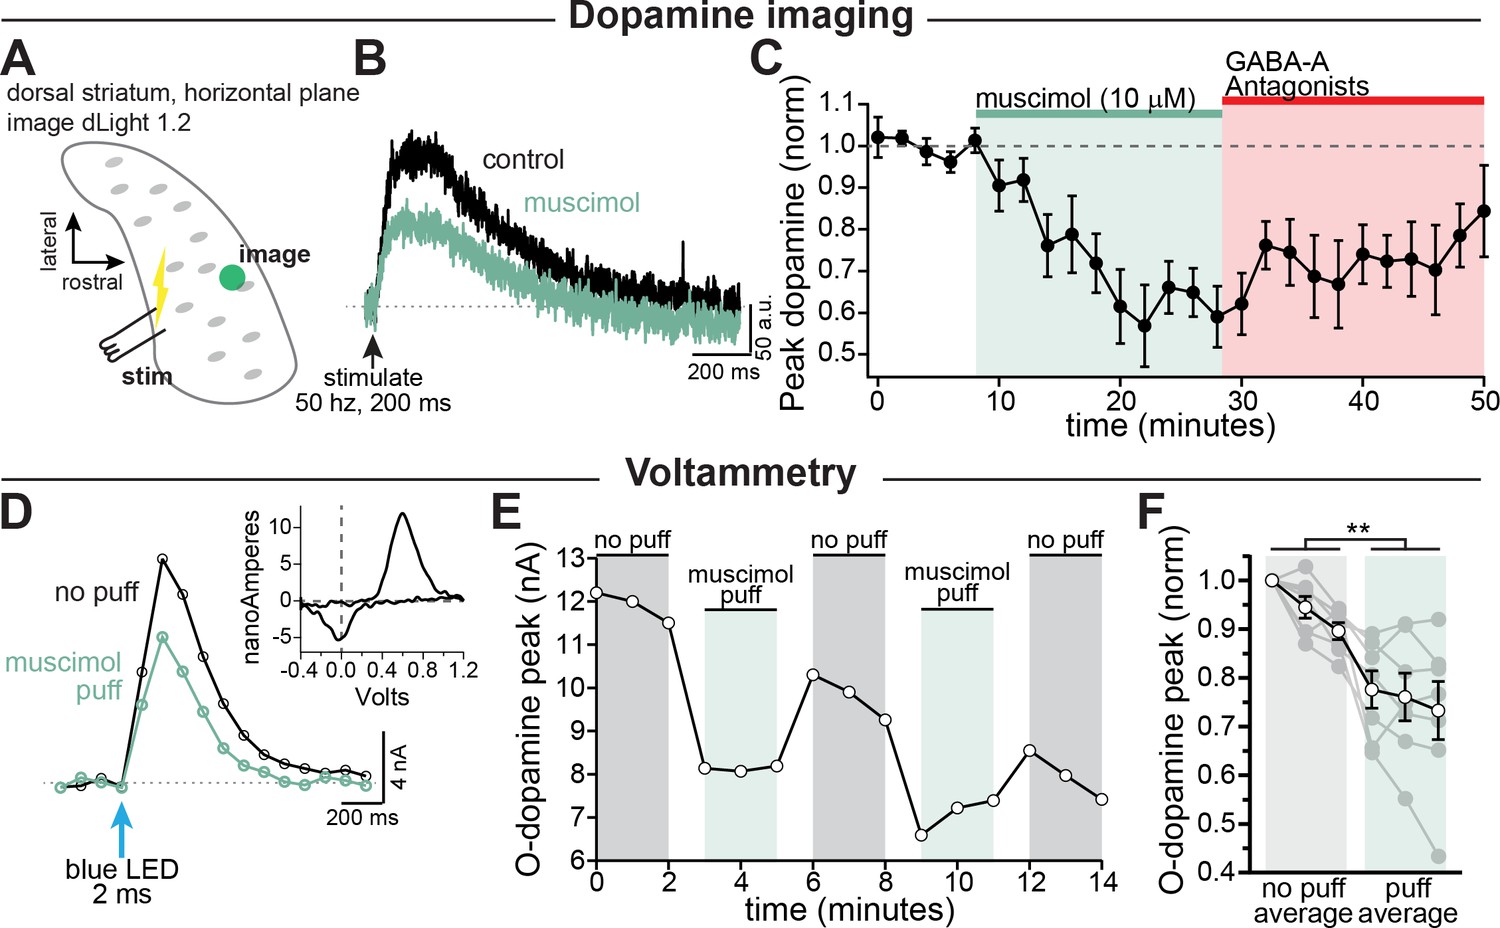
GABA-A receptor mediated inhibition of striatal dopamine release.
(A–C) Imaging dopamine release in the dorsal medial striatum using dLight 1.2. (A) Experimental setup diagram. (B) Example traces of bulk dopamine release following electrical stimulation in control (black) and during muscimol bath application (green). (C) Group data showing the time course of muscimol application on dopamine release peak amplitude measured distal to the site of stimulation (average 1054 µm, n = 9; p=0.0008). (D–F) Voltammetry experiments using opsin-evoked dopamine release (DAT-Cre injected with CoChR in SNc). (D) Example voltammetry signal of dopamine in control (black) and during muscimol puff (green). Inset: example current-voltage plot of FSCV signal. (E) Time course of opsin-evoked dopamine release in an example experiment. (F) Summary data showing the main effect of muscimol puff on dopamine release measured with voltammetry. Closed symbols indicate individual experiments and open symbols indicate averaged data (p=0.004; n = 7). All experiments in (A–C) were done in the presence of hexamethonium chloride (200 µM), sulpiride (1 µM), atropine (30 nM), and CGP 55845 (200 nM) to block nAChRs, D2Rs, mAChRs, and GABA-BRs respectively.
-
Figure 3—source data 1
Raw values used for plots in Figure 3 and Figure 3—figure supplement 1.
- https://cdn.elifesciences.org/articles/55729/elife-55729-fig3-data1-v1.xlsx
Figure 3—figure supplement 1
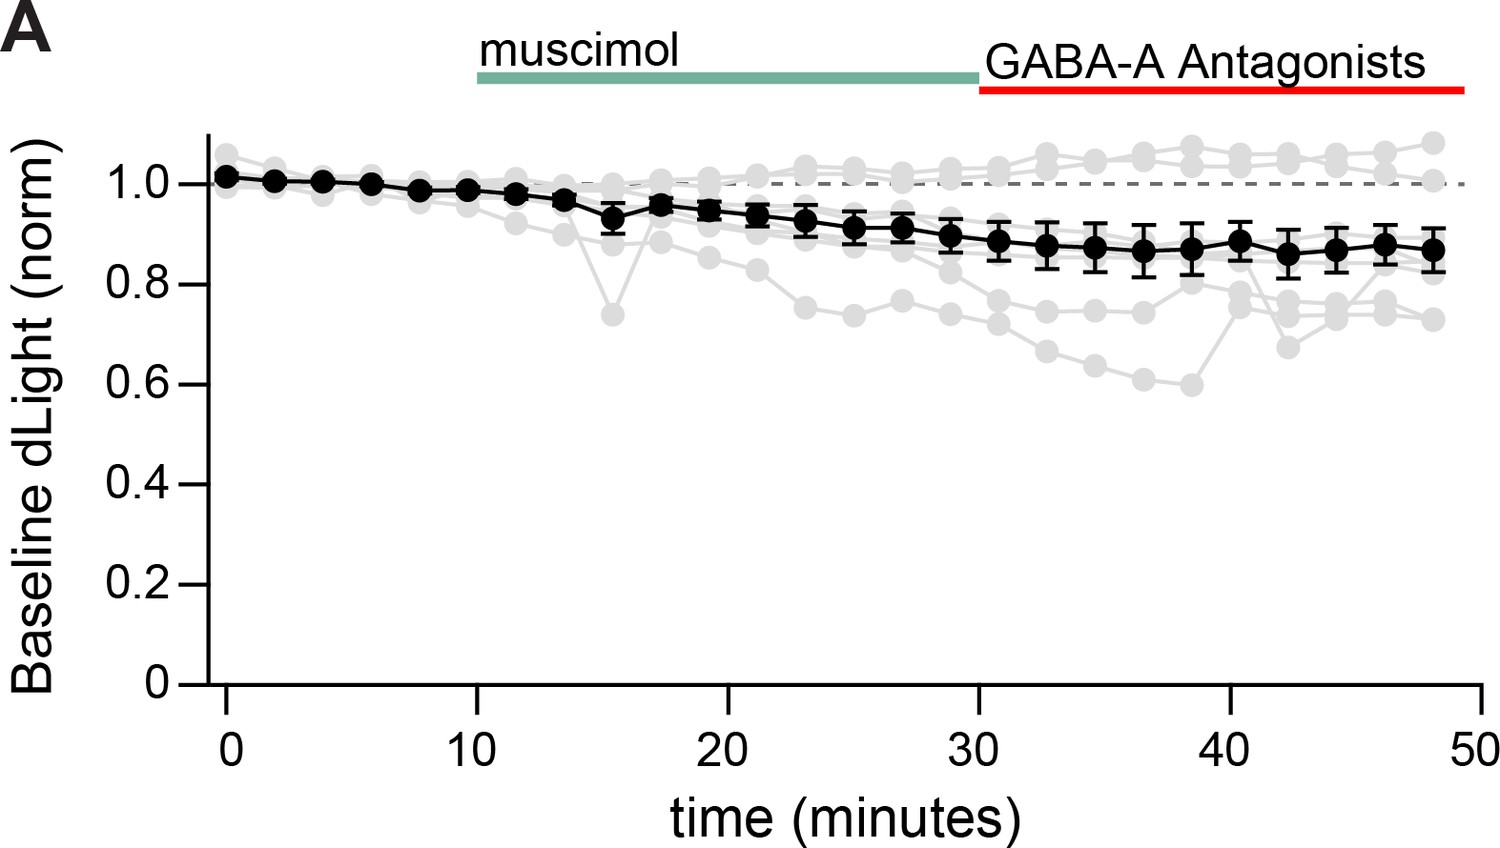
GABA-A acitvation does not affect baseline dLight levels.
(A) Bath perfusion of muscimol did not significantly alter the pre-stimulation (baseline) dLight signal.
Figure 4
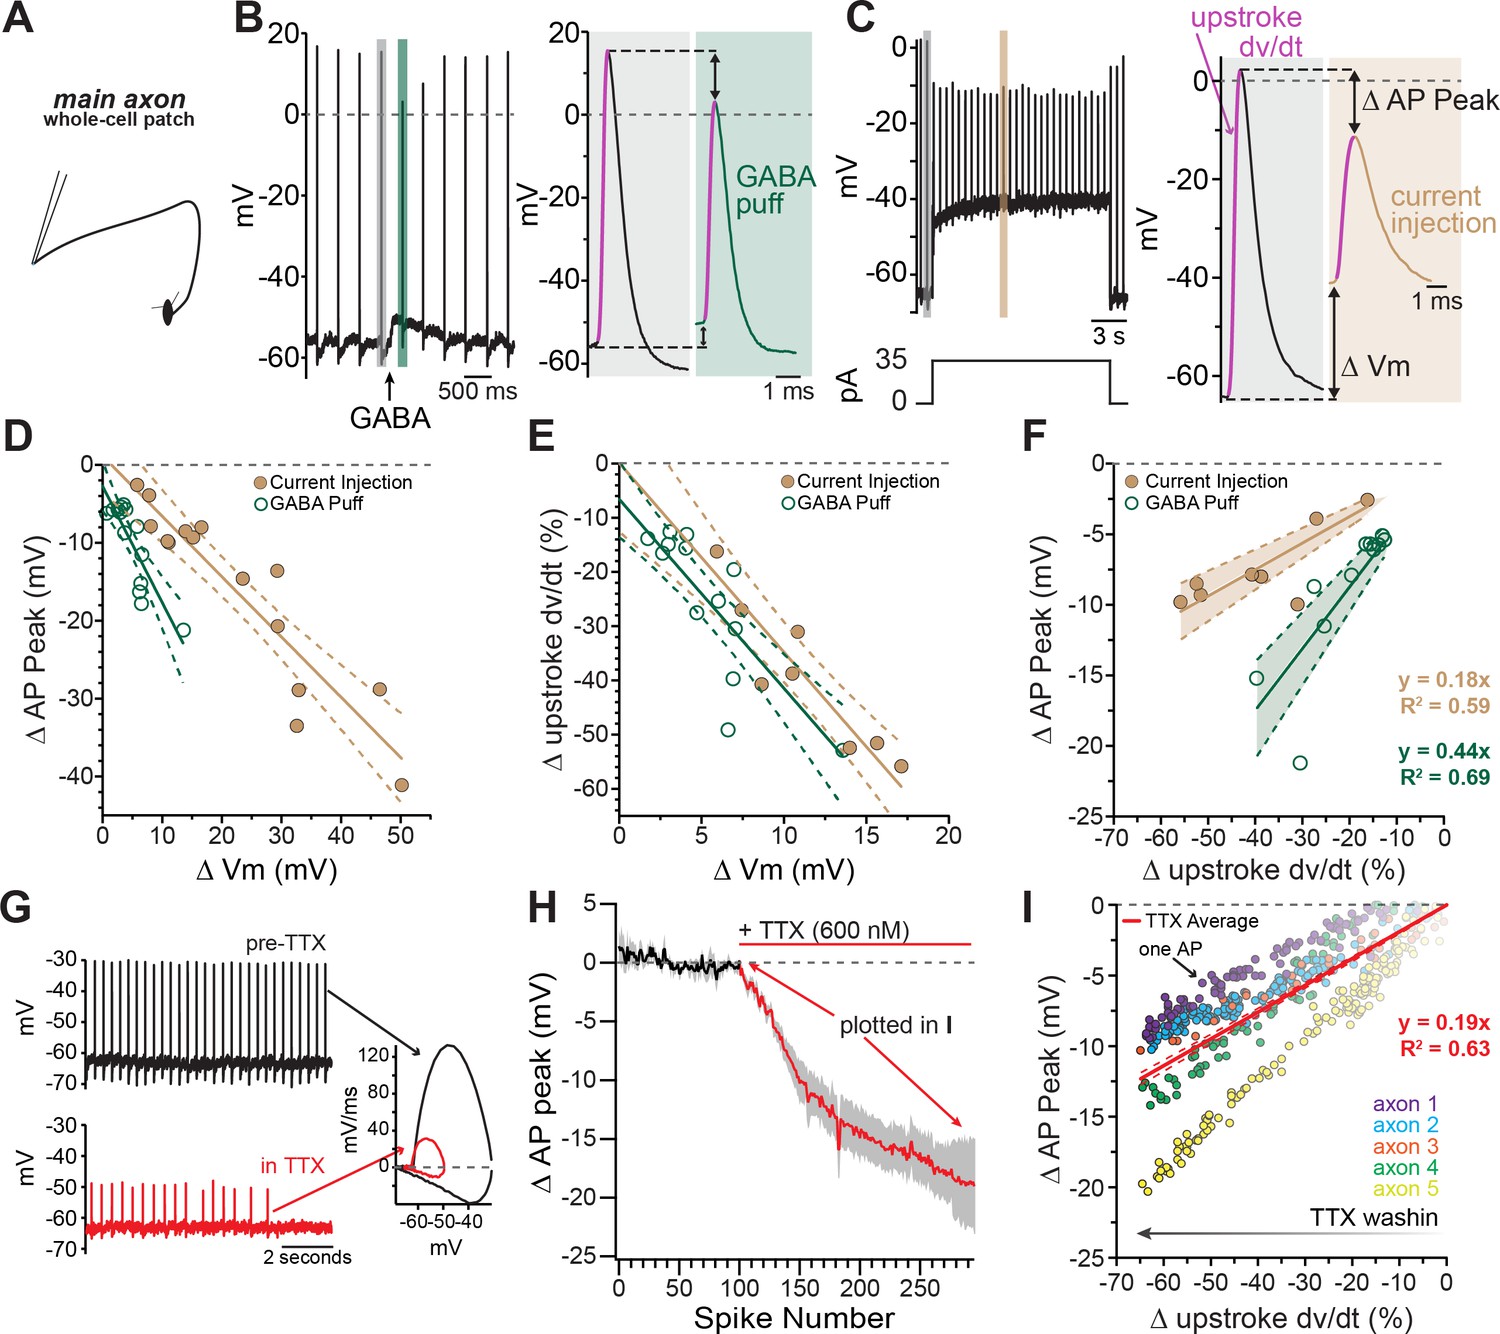
Axonal GABA-A receptors inhibit excitability through a combination of sodium channel inactivation and shunting.
(A) Schematic of the experimental setup for this figure. Whole-cell recordings were made from the main, connected, axons of dopamine neurons. (B) Example axonal recording showing the effect of a brief GABA pressure ejection. Control (gray) and GABA (green) traces magnified. B, right: Control action potential in black and GABA-affected action potential in green. (C) Similar experiment to B, except demonstrating the effect current injection on spike properties as opposed to GABA application. Purple line on AP upstroke denotes area of measurement for rate of rise, arrows denoting measurement of change in AP peak and change in membrane potential. (D) Effect of the amount of baseline depolarization on the decrease in peak AP amplitude, compared between GABA (green; n = 14) and current injection (tan; n = 15) (*p=0.047). (E) Effect of the amount of baseline depolarization on the normalized decrease in rate of AP upstroke, compared between GABA (green; n = 11) and current injection (tan; n = 10) (ns p=0.564). (F) A plot showing the relationship between decrease in rate of AP rise and decrease in AP peak, for injection of current (brown; n = 8) and a brief pressure ejection of GABA (green; n = 11). (G) Example axonal recording showing spontaneously firing action potentials before the application of TTX (top, black) and after TTX bath perfusion, just before the action potentials cease (bottom, red), inset: Example phase plots for axonal action potentials before (black) and after (red) TTX perfusion. (H) Averaged data showing the effect of TTX on action potential peak amplitude (graphs were aligned to the beginning of TTX effect, n = 5). The decrease in peak amplitude is plotted in I. (I) Data from five individual axons showing the effect of TTX wash-in on the change in rate of action potential rise, and the change in the peak of the action potential. Each dot in data from an individual action potential, normalized to just before the perfusion of TTX. In red is the average effect.
-
Figure 4—source data 1
Raw values used for plots in Figure 4.
- https://cdn.elifesciences.org/articles/55729/elife-55729-fig4-data1-v1.xlsx
Figure 5
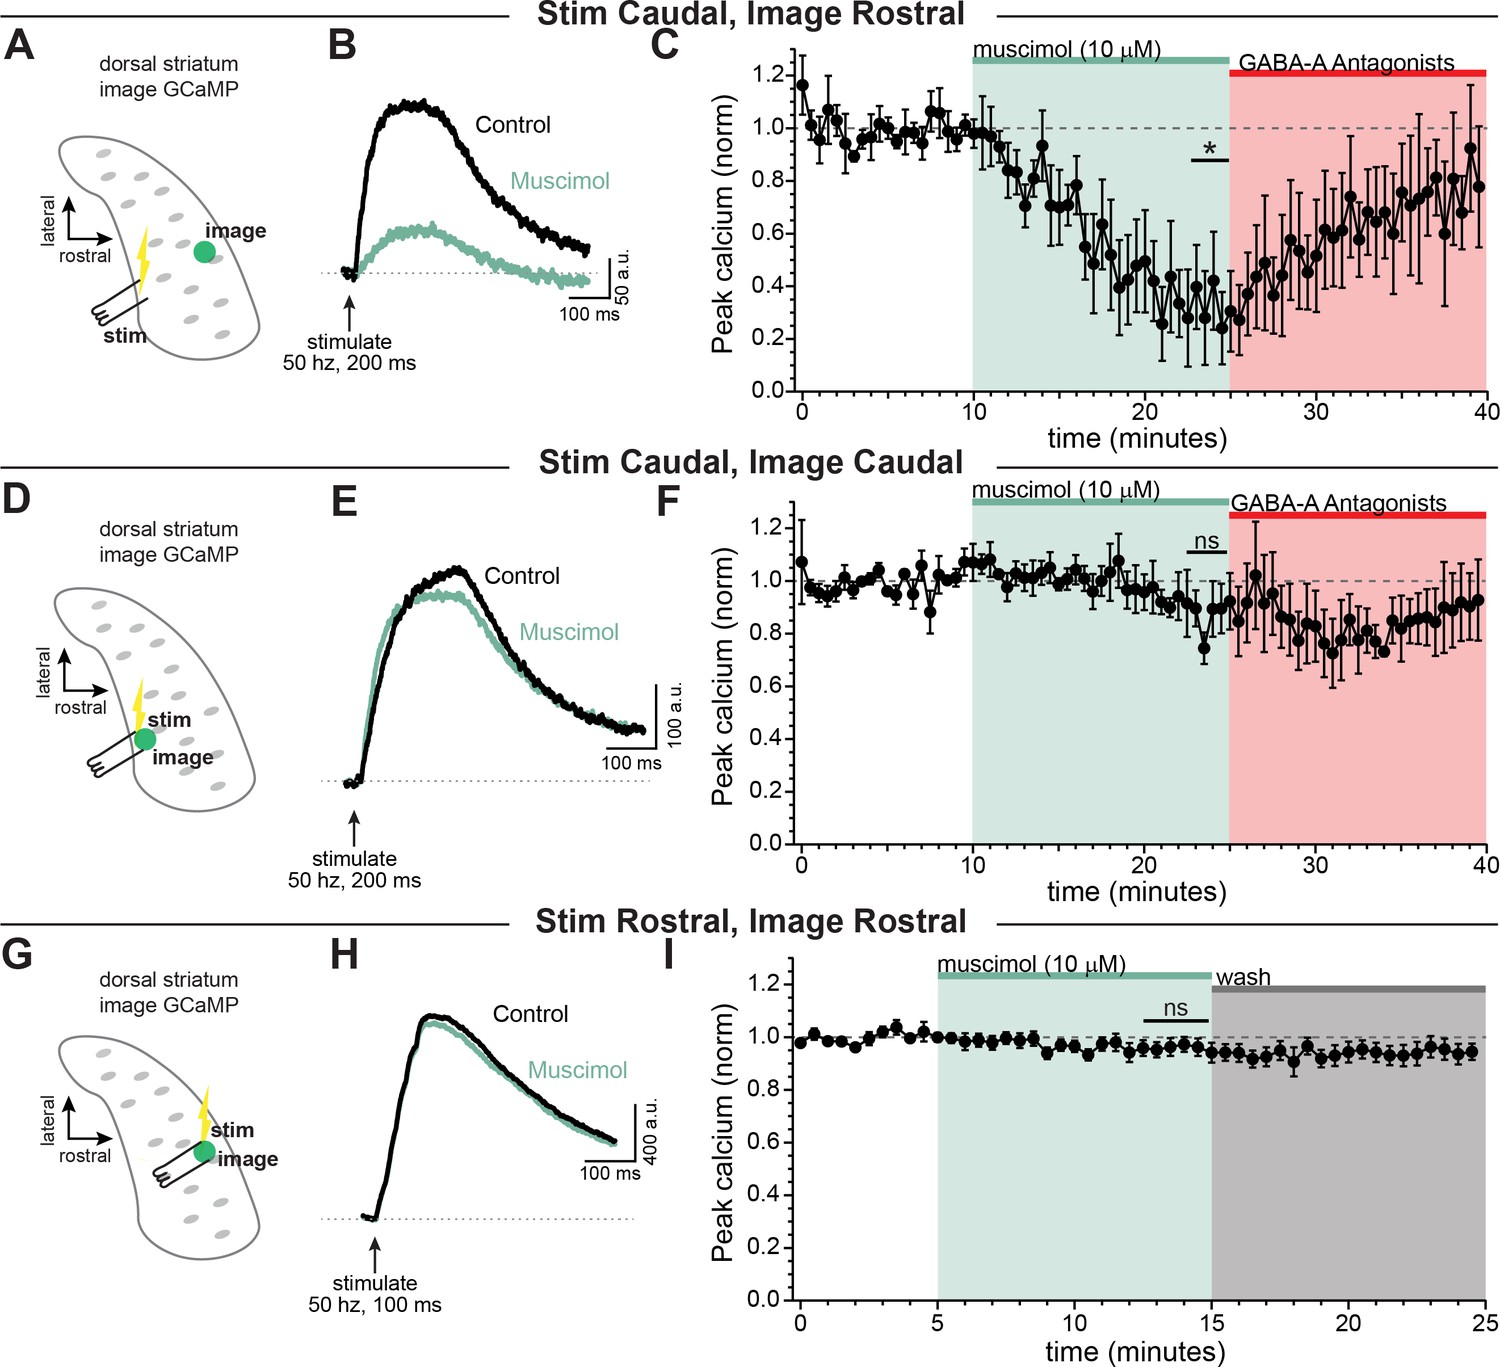
GABA-A receptor-mediated inhibition of axonal calcium signals increases with propagation distance.
Stimulation-evoked calcium signals in dopamine neuron axons imaged either at the site of stimulation, or distal to the site of stimulation. (A) Experimental setup diagram. (B) Stimulation-evoked GCaMP6f signals in control (black) and in response to muscimol bath application (green). (C) Time course showing a significant effect of bath applied muscimol for GCaMP6f signals imaged in the rostral striatum, stimulated caudally (~690 ± 73.1 µm between stimulation and imaging, n = 5; *p=0.034). (D) Experimental setup diagram. E) Stimulation-evoked GCaMP6f signals in control (black) and in response to muscimol bath application (green). (F) Time course showing no significant effect of bath applied muscimol for GCaMP6f signals imaged near to the site of stimulation in the caudal striatum (~100 ± 29.2 µm between stimulation and recording, n = 5, p=0.95). (G) Experimental setup diagram. H) Stimulation-evoked GCaMP6f signals in control (black) and in response to muscimol bath application (green). (I) Time course showing no significant effect of bath applied muscimol for GCaMP6f signals imaged near to the site of stimulation in the rostral striatum (<100 µm between stimulation and recording, n = 8, p=0.61). In these experiments, Hexamethonium Chloride (200 µM; Figure 6A–F) or DhβE (1 µM; Figure 6G–I), sulpiride (1 µM), atropine (30 nM), and CGP 55845 (200 nM) were used to block nAChRs, D2Rs, mAChRs, and GABA-BRs respectively.
-
Figure 5—source data 1
Raw values used for plots in Figure 5.
- https://cdn.elifesciences.org/articles/55729/elife-55729-fig5-data1-v1.xlsx
Figure 6 with 1 supplement
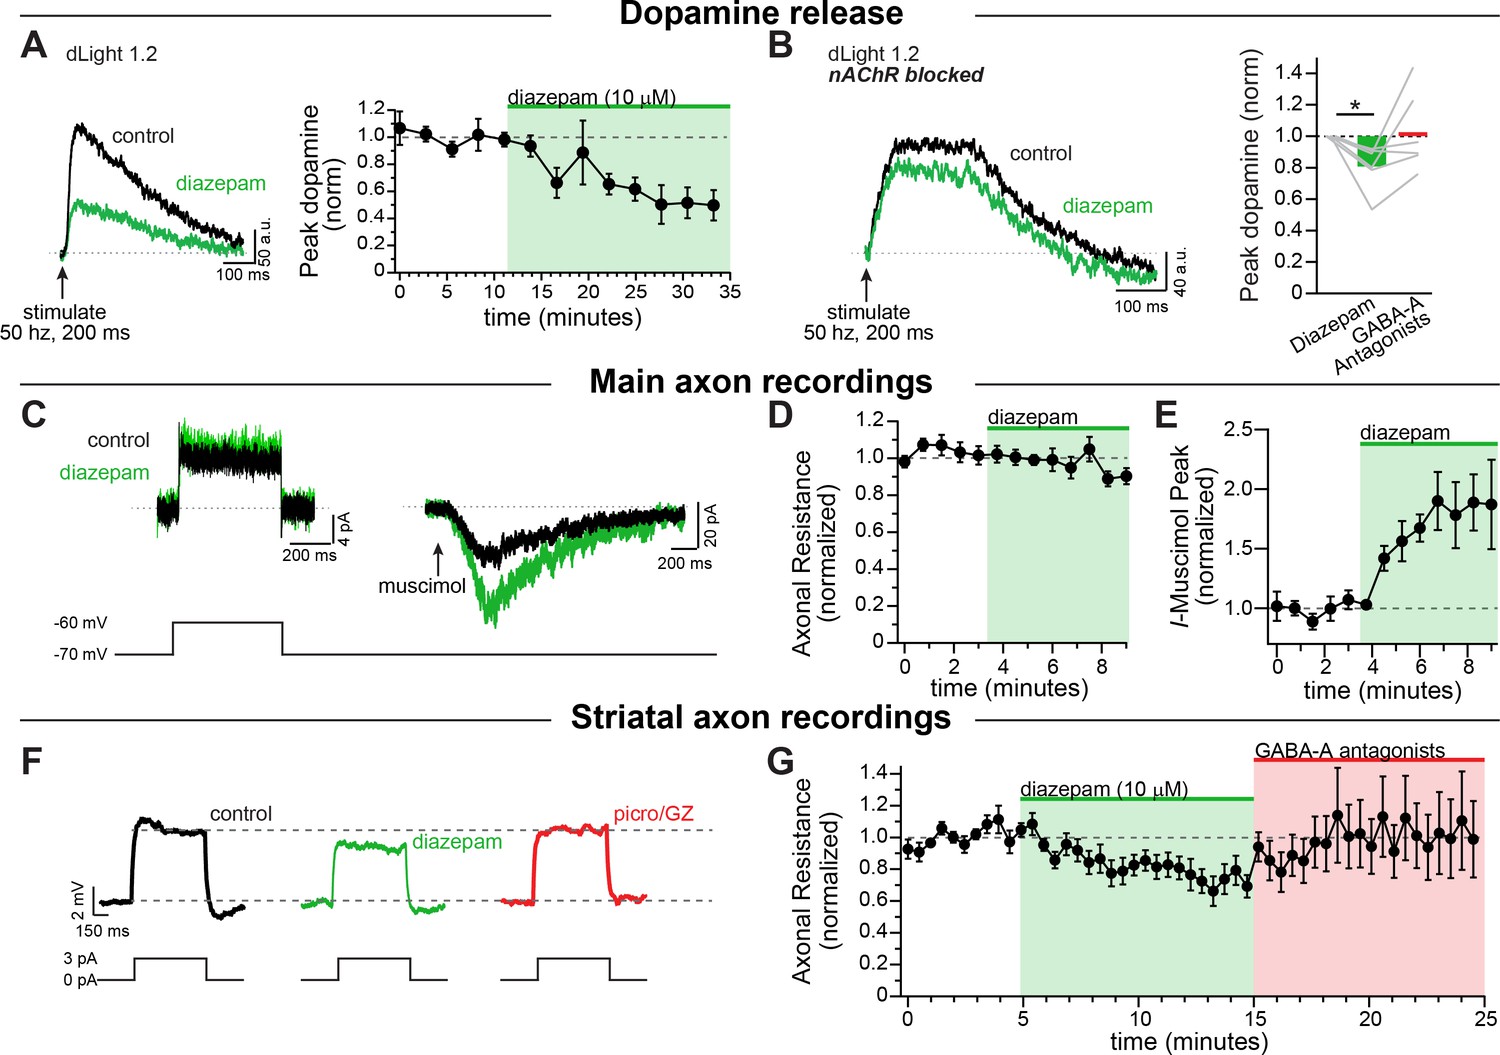
Diazepam inhibits striatal dopamine release through direct effects on axonal GABA-A receptors.
(A) Example traces of imaged dopamine release from control (black) and diazepam bath perfusion (green) conditions. Right: time course showing the effect of diazepam bath perfusion on peak dopamine release (n = 5). (B) Example traces of imaged dopamine release from control (black) and diazepam bath perfusion (green) conditions with nAChRs blocked. Right: Group effect of diazepam on peak dopamine release (n = 6; *p=0.044). GABA-A Antagonists picrotoxin (100 µM) and gabazine (10 µM) were perfused at the end of each experiment. (C) Example step depolarization (left) and muscimol pressure ejection (right) recorded in the main axon in control (black) and diazepam bath application (green). Step depolarization and muscimol puff were performed within the same cell. (D) Time course showing the effect of diazepam bath application on the normalized input resistance of the main axon in the medial forebrain bundle (n = 5). (E) Time course showing the effect of diazepam bath application on the normalized muscimol-evoked peak current (n = 6). (F) Example current injections to test axonal input resistance in control (black) diazepam (green) and GABA-A antagonists picrotoxin and gabazine (red) conditions. (G) Time course of diazepam bath perfusion followed by GABA-A antagonist bath perfusion on the normalized axonal input resistance. Hexamethonium chloride (200 µM), sulpiride (1 µM), atropine (30 nM), and CGP 55845 (200 nM) were used to block nAChRs, D2Rs, mAChRs, and GABA-BRs respectively.
-
Figure 6—source data 1
Raw values used for plots in Figure 6 and Figure 6—figure supplement 1.
- https://cdn.elifesciences.org/articles/55729/elife-55729-fig6-data1-v1.xlsx
Figure 6—figure supplement 1
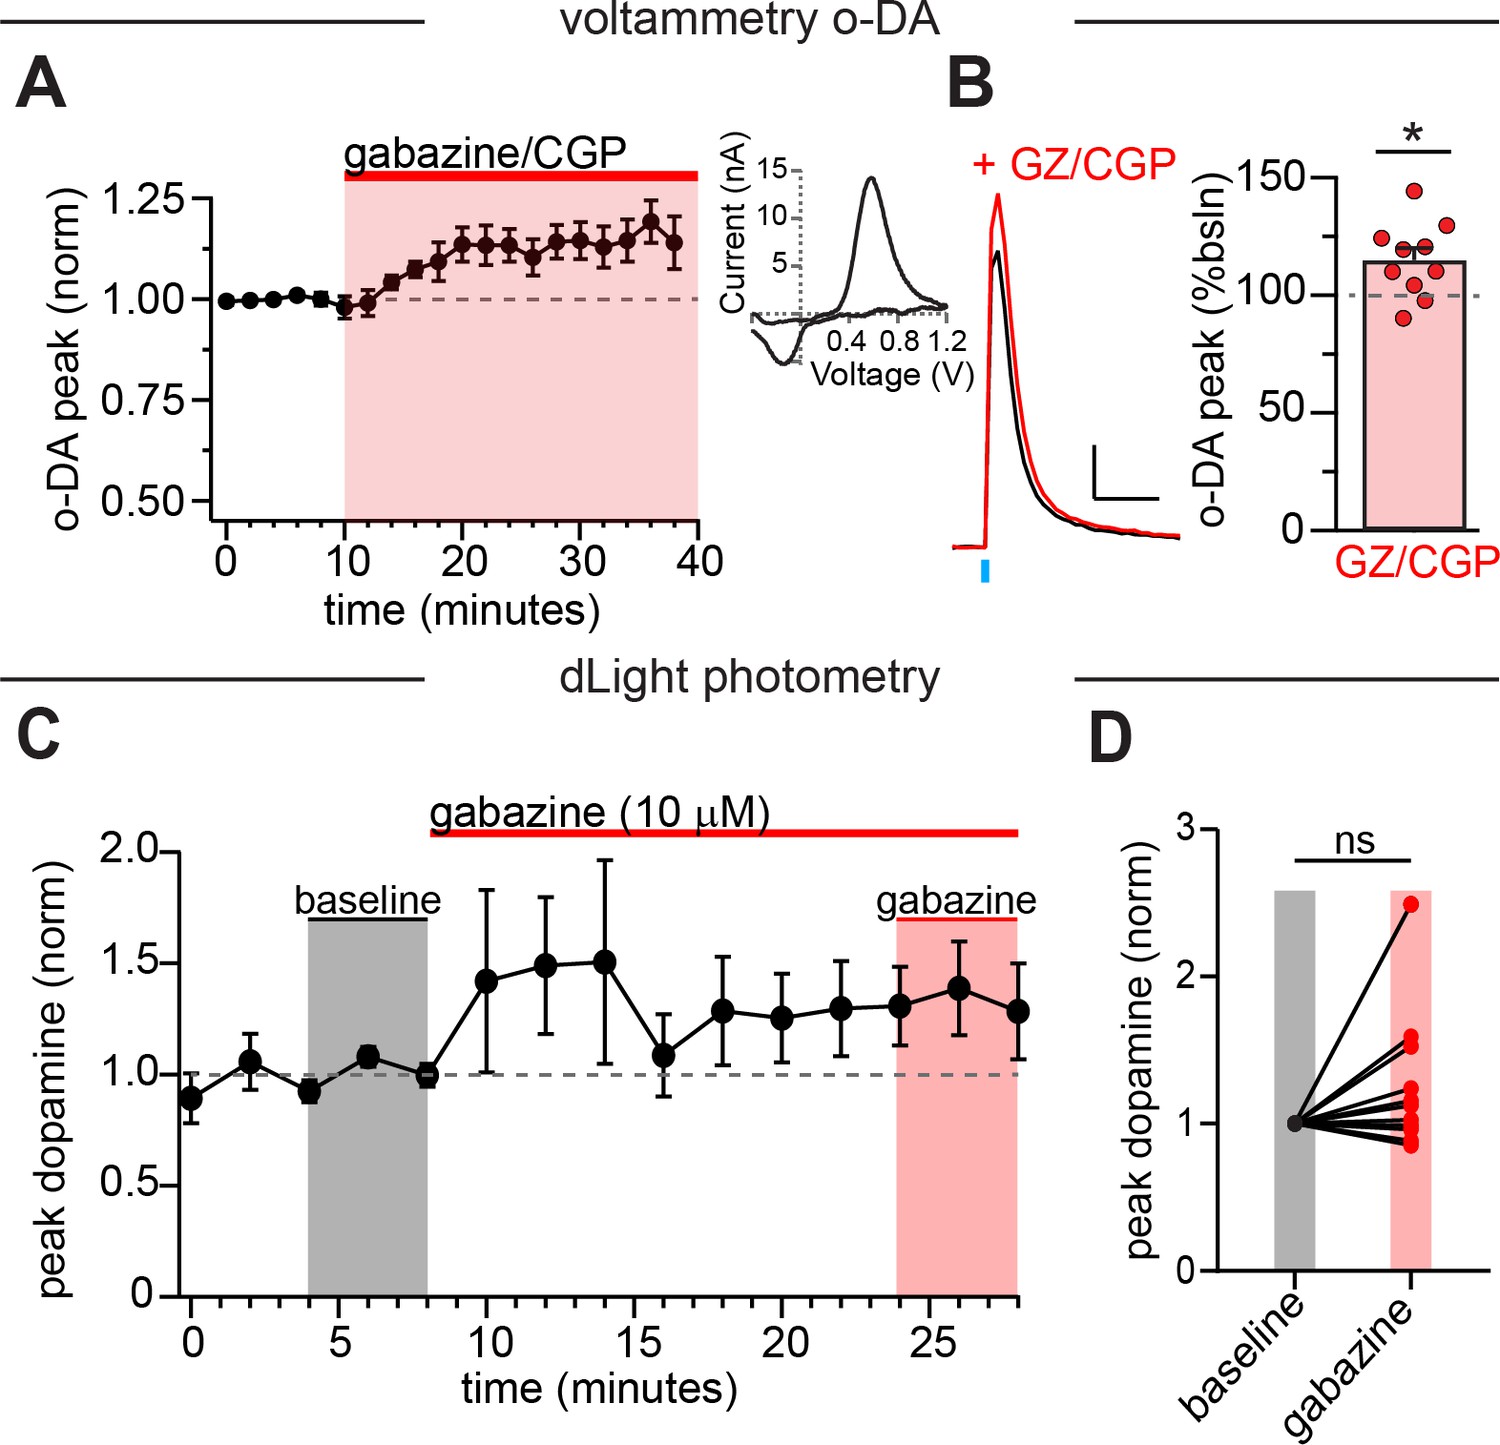
Inhibition of GABA-A alone does not significantly enhance dopamine release.
(A) GABA-A and GABA-B antagonists significantly increased optically-evoked dopamine release measured with voltammetry. Inset: example CV plot for dopamine release. (B) Left: Example dopamine transient in control (black) and in GZ/CGP (red). Right: Plot of the average increase in peak optically-evoked dopamine release (each point is one slice; n=10, p = 0.015). (C) Bath perfusion of the GABA-A antagonist gabazine (10 µM) did not significantly alter dopamine release as measured with dLight. (D) Comparison between the average baseline dopamine release (normalized) to the average final three events in gabazine. There was no significant difference between the baseline and gabazine (=126 ± 14.3% of baseline) conditions (two-tailed paired t-test, t(10)=1.8; p=0.10; n=11). Experiment was performed in the presence of CGP (200 nM), sulpiride (1 µM), atropine (30 nM), and DHβE (1 µM).
Tables
Key resources table
| Reagent type (species) or resource | Designation | Source or reference | Identifiers | Additional information |
|---|---|---|---|---|
| Genetic reagent (adeno-associated virus) | AAV1-hsyn-FLEX-CoChR-GFP | UNC vector core | Boyden, E. | |
| Genetic reagent (adeno-associated virus) | AAV9-CAG-FLEX-TdTomato | Penn vector core | ||
| Genetic reagent (adeno-associated virus) | AAV9-Syn-FLEX-jGCaMP7f | Janelia | ||
| Genetic reagent (adeno-associated virus) | AAV9-hSyn-dLight1.2 | Lin Tian | ||
| Chemical compound, drug | Streptavidin cy5 conjugate | Invitrogen | SA1011 | 1:1000 |
| Chemical compound, drug | SR95531 hydrobromide (Gabazine) | Tocris | Cat# 1262 | |
| Chemical compound, drug | SR95531 hydrobromide (Gabazine) | Hello Bio | Cat# HB0901 | used only in Figure 6—figure supplement 1A and B |
| Chemical compound, drug | CGP55845 hydrochloride | Tocris | Cat# 1248 | |
| Chemical compound, drug | D-AP5 | Tocris | Cat# 0106 | |
| Chemical compound, drug | Atropine | MilliporeSigma | Cat# A0132 | |
| Chemical compound, drug | NBQX disodium salt | Tocris | Cat# 1044 | |
| Chemical compound, drug | (±)-Sulpiride | MilliporeSigma | Cat# S8010 | |
| Chemical compound, drug | Tetrodotoxin (TTX) | Tocris | Cat# 1078 | |
| Chemical compound, drug | λ-Aminobutyric Acid (GABA) | MilliporeSigma | Cat# A5835 | |
| Chemical compound, drug | Picrotoxin | MilliporeSigma | Cat# P1675 | |
| Chemical compound, drug | Hexamethonium Chloride | MilliporeSigma | Cat# H2138 | |
| Chemical compound, drug | Diazepam | MilliporeSigma | Cat# D0899 | |
| Chemical compound, drug | Gramicidin | MilliporeSigma | Cat# G5002 | |
| Chemical compound, drug | Muscimol | Tocris | Cat# 0289 | |
| Chemical compound, drug | Gelatin from cold water fish skin | MilliporeSigma | Cat# G7041 | |
| Chemical compound, drug | (+)-Sodium L-ascorbate | MilliporeSigma | Cat# A4034 | |
| Chemical compound, drug | Sodium Pyruvate | MilliporeSigma | Cat# P5280 | |
| Chemical compound, drug | Thiourea | MilliporeSigma | Cat# T7875 | |
| Chemical compound, drug | Triethanolamine | MilliporeSigma | Cat# 90279 | |
| Chemical compound, drug | N,N,N’,N’-Tetrakis-(2-hydroxypropyl)ethylenediamine | TCI | Cat# T0781 | |
| Chemical compound, drug | Urea | MilliporeSigma | Cat# U5128 | |
| Strain, strain background (Mus musculus) | Ai95-RCL-GCaMP6f-D: Cg-Gt(ROSA)26Sor(tm95.1(CAG-GCaMP6f)Hze)/MwarJ | The Jackson Laboratory | Cat# 028865 | male and female over 6 weeks of age |
| Strain, strain background (Mus musculus) | Ai9: Gt(ROSA)26Sor(tm9(CAG-tdTomato)Hze) | The Jackson Laboratory | Cat# 007909 | male and female over 6 weeks of age |
| Strain, strain background (Mus musculus) | TH-GFP (Tg(TH-EGFP)1Gsat | NIH MMRRC | male and female over 6 weeks of age | |
| Strain, strain background (Mus musculus) | C57/Bl6J Wild Type | The Jackson Laboratory | Cat# 000664 | male and female over 6 weeks of age |
| Strain, strain background (Mus musculus) | B6.SJL-Slc6a3(tm1.1(cre)Bkmn/J (DAT-IRES-cre) | The Jackson Laboratory | Cat# 006660 | male and female over 6 weeks of age |
| Strain, strain background (Mus musculus) | Ai32: B6.Cg – Gt(ROSA)26Sor(tm32(CAG-COP4*H143R/EYFP)Hze) | The Jackson Laboratory | Cat#024109 | male and female over 6 weeks of age |
| Software, algorithm | Igor Pro 6 | Wavemetrics | RRID:SCR_000325 | |
| Software, algorithm | FIJI | PMID:22743772 | RRID:SCR_002285 | http://fiji.sc |
| Software, algorithm | Prism 8 | GraphPad | RRID:SCR_002798 | |
| Software, algorithm | pClamp 11 | Axon Instruments | RRID:SCR:011323 |
Additional files
Download links
A two-part list of links to download the article, or parts of the article, in various formats.
Downloads (link to download the article as PDF)
Open citations (links to open the citations from this article in various online reference manager services)
Cite this article (links to download the citations from this article in formats compatible with various reference manager tools)
Axonal mechanisms mediating γ-aminobutyric acid receptor type A (GABA-A) inhibition of striatal dopamine release
eLife 9:e55729.
https://doi.org/10.7554/eLife.55729


