Novel C1q receptor-mediated signaling controls neural stem cell behavior and neurorepair
- Sue and Bill Gross Stem Cell Research Center, United States
- Department of Anatomy and Neurobiology, United States
- Center of Regenerative Medicine, Facultad de Medicina, Universidad del Desarrollo, Chile
- Institute for Memory Impairments and Neurological Disorders, United States
- Bridges to Stem Cell Research Program (BSCR), California State University, United States
- Department of Physical Medicine and Rehabilitation, United States
- Department of Molecular Biology & Biochemistry, UC-Irvine, United States
Figures
Figure 1 with 1 supplement

C1q induces intracellular signaling activation in hNSC.
(A) Phosphoarray analysis quantification of hNSC exposed to C1q [0.1 nM], [1.0 nM], or [200 nM] concentrations for 15, 30, or 60 min. Data show mean ± SEM (N = 3 biological replicates per condition) for quantified optical intensity, normalized to control (dashed line = 1). In addition to statistical analysis, using one-sample t-test (*p≤0.05, **p≤0.01, ***p≤0.001), a minimum threshold of 1.5-fold activation (dashed line) was set for statistical significance. (B) ERK and Akt activation was verified using western blot in lysates from hNSC exposed to C1q [0.1 nM], [1.0 nM], or [200 nM] concentrations for 60 min. p-ERK and p-Akt band intensities were normalized to β-actin. Data show mean ± SEM (N = 3 biological replicates per condition) for quantified optical intensity normalized to control (dashed line). Statistical analysis using one-sample t-test (NS, not significant; *p≤0.05, **p≤0.01, ***p≤0.001).
Figure 1—figure supplement 1
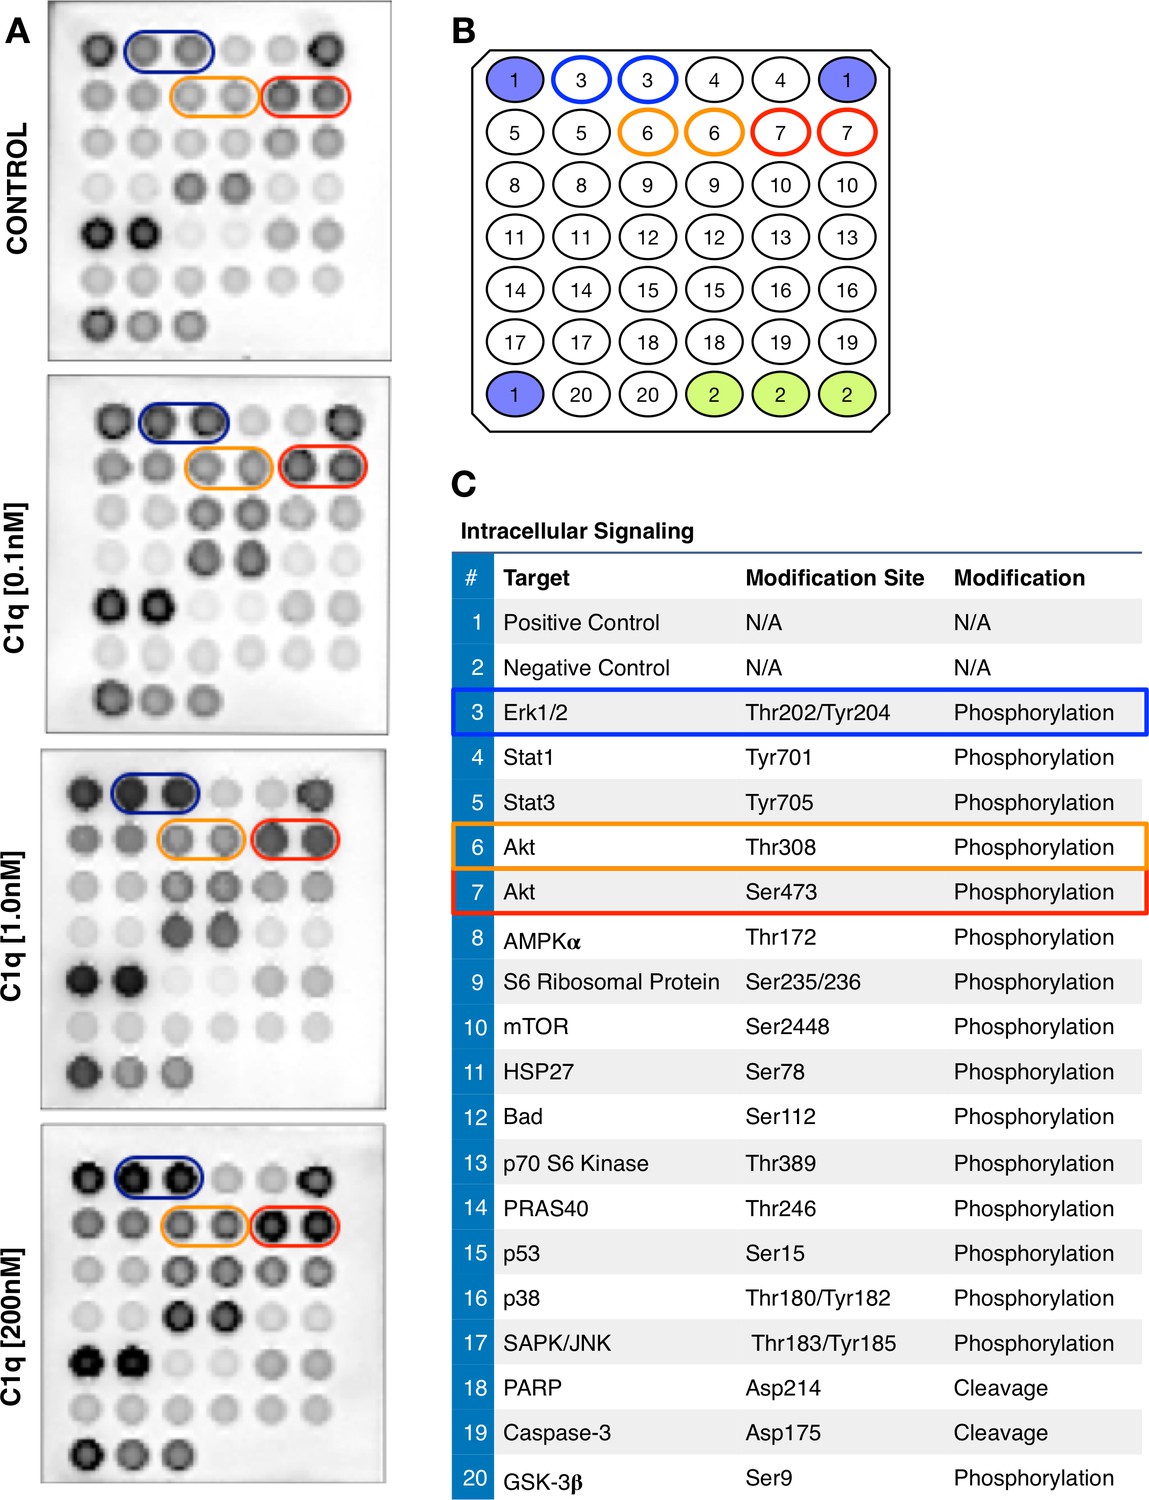
C1q induces intracellular signaling activation in hNSC.
(A) Representative images and numerical scheme of phosphoarray analysis of hNSC exposed to control media or C1q [0.1 nM; 1.0 nM; 200 nM] for 30 min. Array positions indicated for p-ERK (blue), p-Akt thr308 (orange), and ser473 (red). (B) Orientation and positions of the intracellular signaling proteins (in duplicate) assayed by phosphoarray: number 3 (blue, p-ERK); number 6 (orange, p-Akt thr308); and number 7 (red, p-Akt ser473). (C) Complete list of targets, intracellular proteins, and modifications tested by phosphoarray. Phosphoarray by PathScan Intracellular signaling array kit as described under Methods (Catalog #7744, Cell Signaling Technology).
Figure 2 with 1 supplement
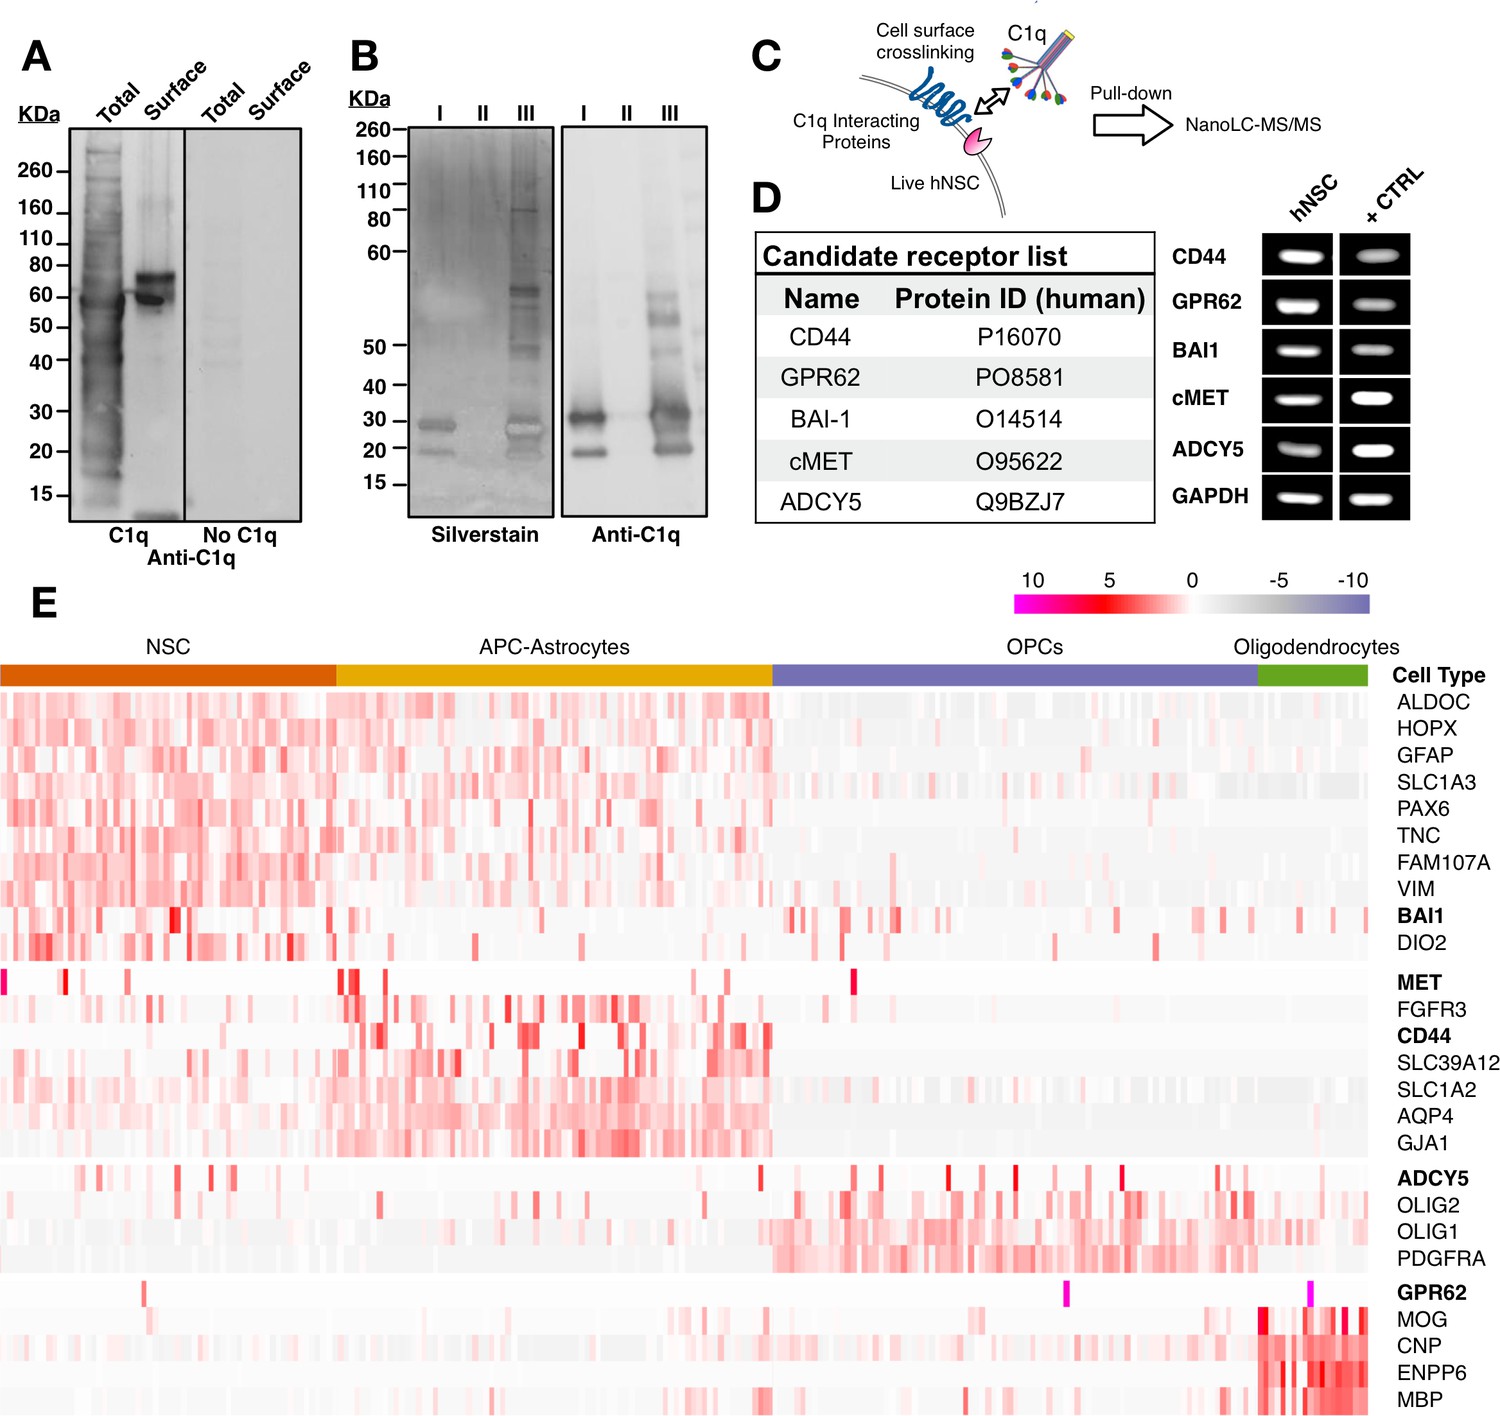
Unbiased screening for cell surface C1q-binding partners on hNSC identifies five novel signaling candidates.
(A) C1q binds specifically to cell surface proteins in hNSC. Far-western blot reveals C1q binding interactions in hNSC protein fractions derived from either total (multiple bands) or cell surface (few bands) isolates. Exclusion of C1q (no C1q control) reveals no anti-C1q staining. (B) Silver stain (left) and anti-C1q western blot (right) analysis in C1q pull-downs with hNSC total protein lysates. Conditions: (I) column + C1q (bait) and no total protein lysate (prey), verifying C1q attachment to the column; (II) column + total protein lysate (prey) and no C1q (bait), confirming the absence of nonspecific protein binding to the column; (III) column + C1q (bait) + total protein lysate (prey), identifying multiple bands associated with C1q. (C) Experimental scheme for identification of C1q binding partners on hNSC cell surface using a cell surface crosslinking strategy followed by pull-down and mass spectrometry analysis. (D) Cell surface-C1q crosslinking using the strategy from (C) identifies five novel membrane-bound signaling candidates. RT-PCR analysis in hNSC and positive control samples (+CTRL, human universal RNA) demonstrates the positive expression of each target signaling candidate by hNSC. (E) Human embryonic cortex single-cell RNA-seq dataset analysis verifies C1q candidate receptor expression on NSC. Heatmap clustered on the gene expression of glia cell type identity gene markers and C1q candidate receptors gene reveals a subset of glia cells that express the candidate receptor genes. Glia cells were processed and categorized into NSC (radial glia), astrocyte precursor cells (APC)/astrocytes, oligoprogenitors (OPCs), and oligodendrocytes.
Figure 2—figure supplement 1
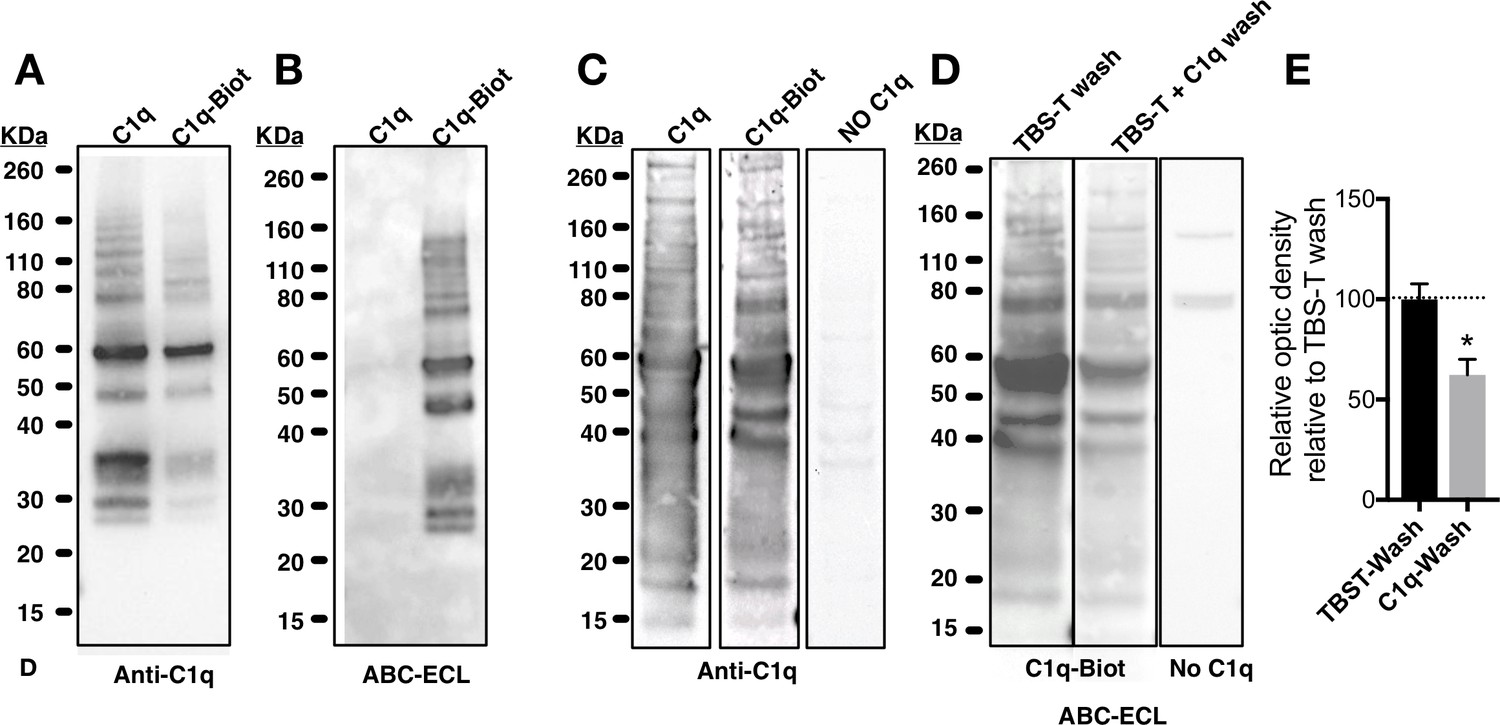
Biochemical analysis of C1q and biotinylated-C1q.
(A) Western blot of purified unmodified C1q (C1q) and biotinylated C1q (C1q-Biot) using anti-C1q antibody. (B) Gel electrophoresis of C1q and C1q-Biot demonstrates that avidin-biotin-peroxidase complex (ABC) (Vector Laboratories) followed by enhanced chemiluminescence (ECL) reaction with horseradish peroxidase (HRP) substrate recognizes only biotinylated C1q. (C-E) C1q and C1q-Biot show similar interaction patterns in far-western blot. (C) Far-westernblot reveals similar binding patterns of naive (C1q, left panel) or biotinylated C1q (C1q-Biot, middle panel) with proteins from hNSC total protein lysates. Control membranes were incubated without C1q (No C1q, right panel). Bound C1q was identified by immunodetection. (D-E) Competitive binding of biotinylated-C1q and naive-C1q demonstrates interaction specificity. (D) Far-westernblot was performed with hNSC total protein lysates and C1q-Biot. Membranes were then differentially washed with either TBS-T (control) or TBS-T + unmodified C1q, to compete with C1q-Biot for protein interactions. Bound C1q-Biot was identified by ABC-ECL reaction. Control membranes were incubated without C1q (right panel). (E) Relative optical density analysis reveals that washes with unmodified-C1q decreased C1q-Biot binding indicating the specificity of the interaction. Data show mean ± SEM of bound C1q relative optic intensity normalized to control (TBS-T washes; dashed line). Statistical analysis using one-sample t-test for comparison with control (*p=0.0398).
Figure 3
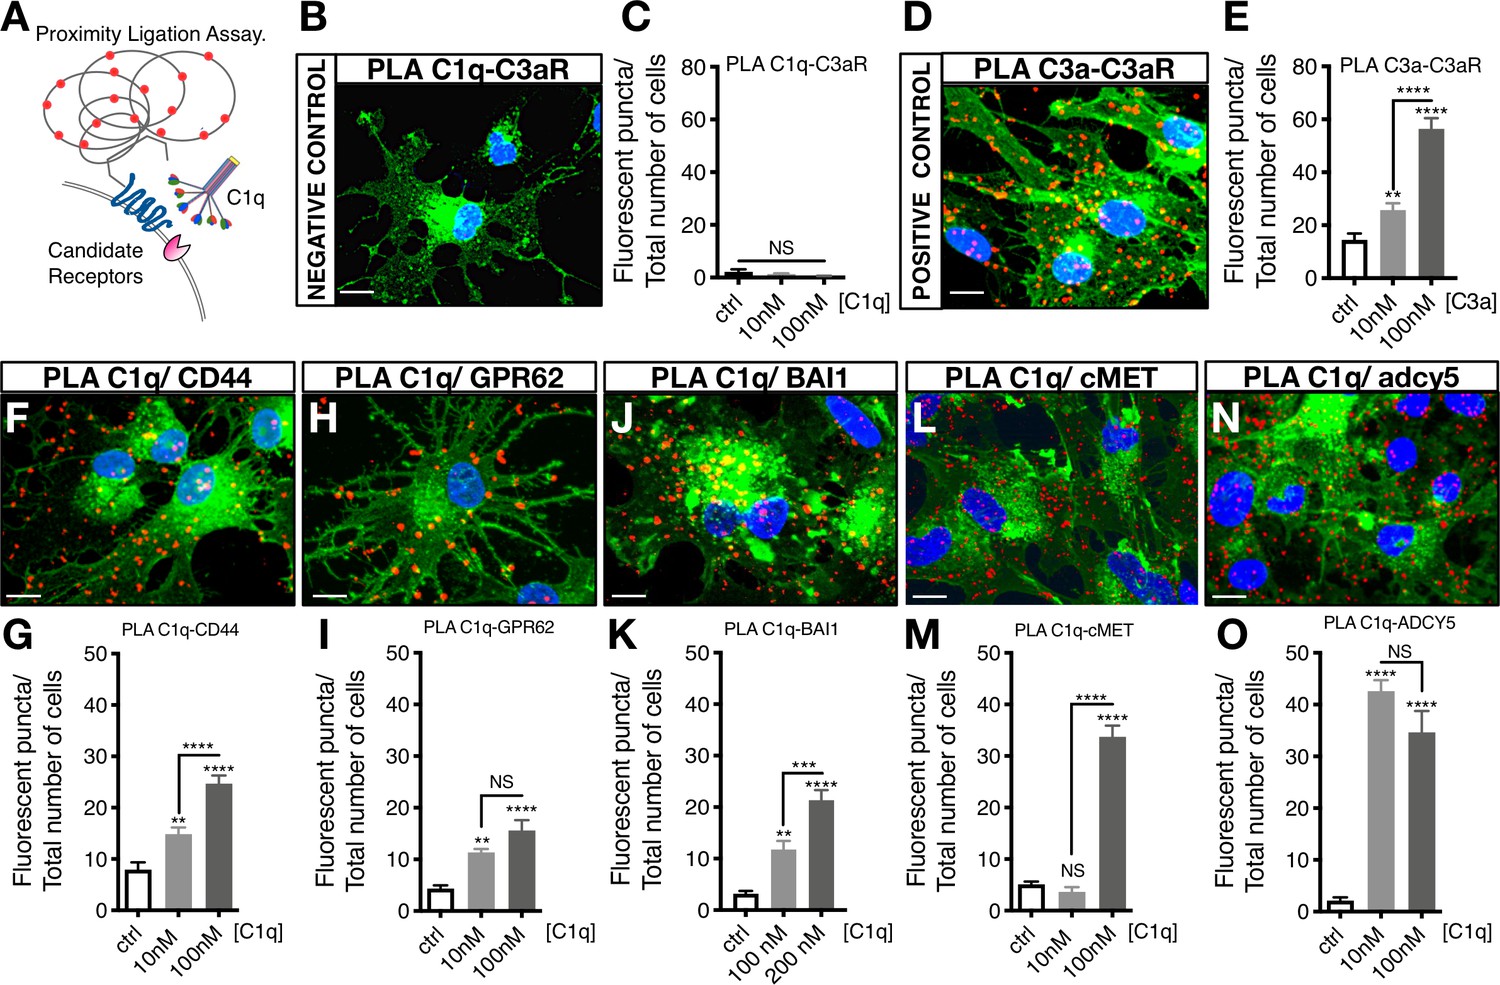
Proximity Ligation Assay (PLA) verifies C1q binding with five novel signaling candidates.
(A) In proximity ligation assays quantifiable positive red fluorescent punctae are obtained only when two target proteins are interacting nearby (<30 nm). (B) PLA validation showing a representative image from a mis-matched ligand-receptor negative control (C1q-C3aR); quantification in (C). (D) PLA validation showing a representative image from a matched ligand-receptor positive control (C3a-C3aR); quantification in (E). PLA representative images and quantification of C1q with novel signaling candidates: (F,G) C1q-CD44; (H,I) C1q-GPR62; (J,K) C1q-BAI1; (L,M) C1q-c-MET; and (N,O) C1q-ADCY5. Membrane staining (green) shown with Alexa 488 conjugated wheat germ agglutinin (WGA). Scale bars 10 µm. Graphs represent quantification of the average number of fluorescent punctae/cell in 13 random pictures/experiment (n = 2 biological replicates; mean ± SEM). Statistical analysis of PLA punctae was significant via one-way ANOVA for all signaling candidates at p<0.05 and was followed by Tukey’s post-hoc t-tests as indicated (NS, not significant; *p≤0.05, **p≤0.01, ***p≤0.001, ****p≤0.0001), no significant difference (ANOVA p=0.184) was identified in the negative control condition.
Figure 4 with 1 supplement
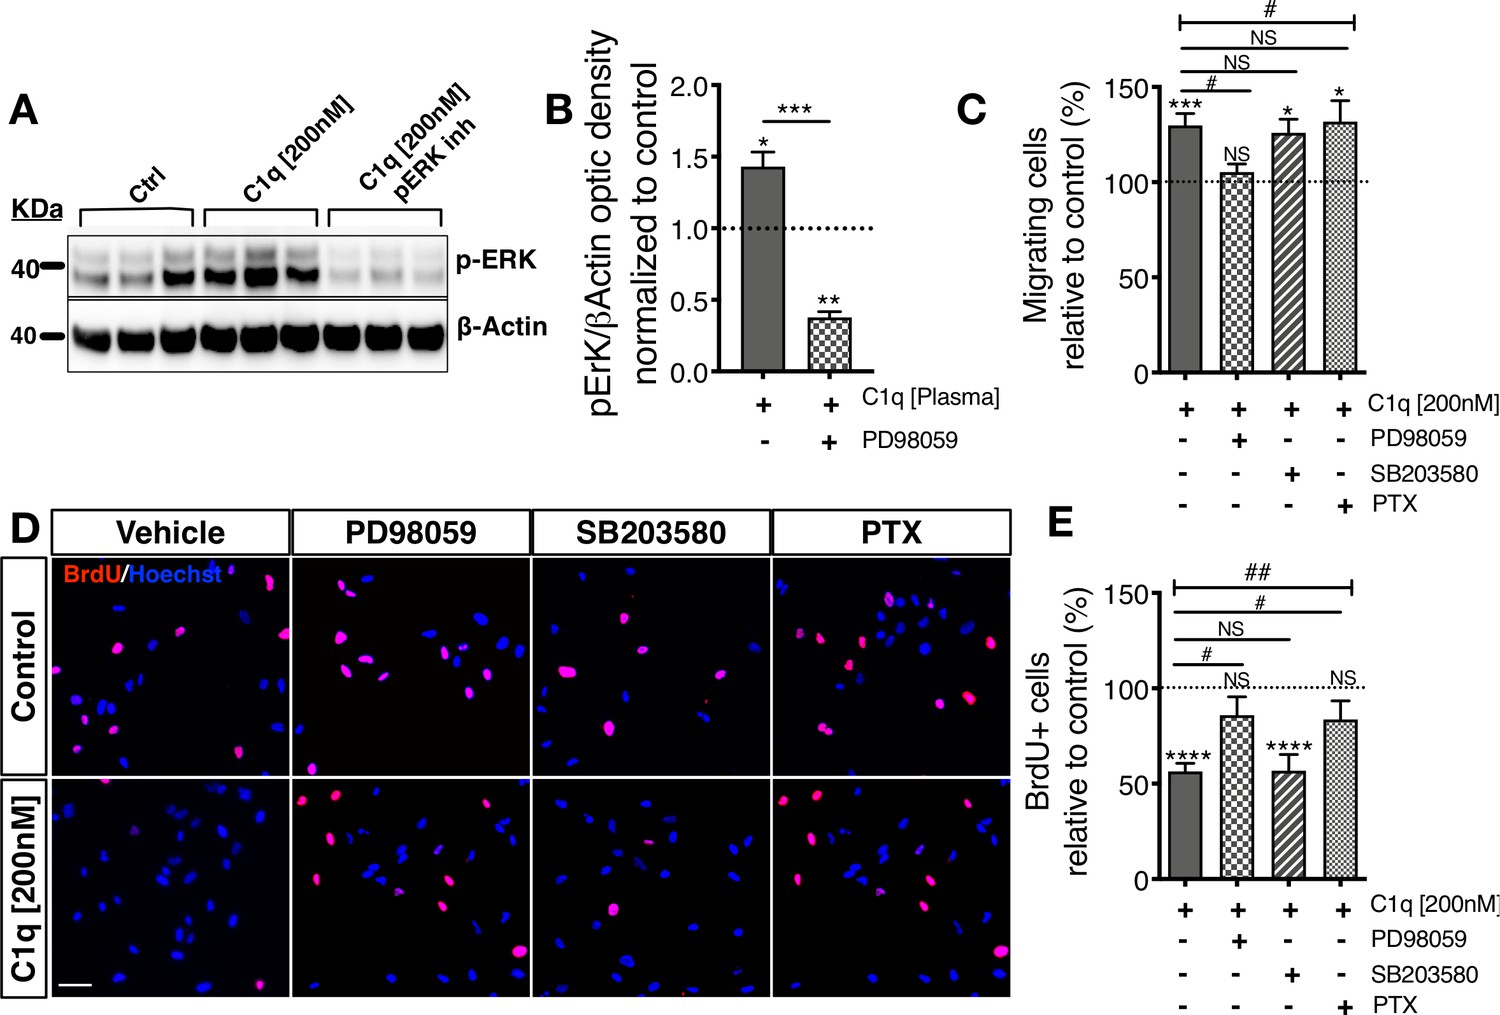
Distinct cellular signaling pathways control different C1q induced hNSC behavior.
(A,B) Western blot analysis in cells treated with the MEK/ERK pathway inhibitor PD89059 verifies effective p-ERK inhibition in cells exposed to C1q [200 nM] for 60 min. Optical densities were normalized to untreated controls (dashed line). Statistical analysis using one-sample t-test (*p≤0.05, **p≤0.01) for comparison with control and Student’s t-test for comparison between conditions as indicated (***p≤0.001). N = 3 biological replicates. (C) C1q [200 nM] induces hNSC chemotaxis in transwell migration assays (shown also in Figure 4—figure supplement 1D), which is blocked by PD89059 inhibition of p-ERK. No effect was observed with either a GPCR inhibitor (Pertussis toxin; PTX) or p38 MAPK inhibitor (SB203580). (D,E) C1q [200 nM] decreases hNSC proliferation in vitro as analyzed by BrdU incorporation (shown also in Figure 4—figure supplement 1E–F), which is blocked by either PD89059 or PTX treatment. No effect was observed with the p38 inhibitor SB203580. (D) Representative pictures of BrdU+ cells in control hNSC or hNSC treated with C1q [200 nM] and pathway inhibitors as indicated. (E) Brdu+ nuclei quantification (%). Data shows mean ± SEM normalized to untreated controls (dashed line). Statistical analysis using one-sample t-test (NS, not significant; *p≤0.05, **p≤0.01, ***p≤0.001) for comparison with untreated controls, and using one-way ANOVA (#) p<0.05 followed by Tukey’s post-hoc t-tests as indicated (NS, not significant; #p≤0.05) for comparison between conditions, N = 4 biological replicates.
Figure 4—figure supplement 1
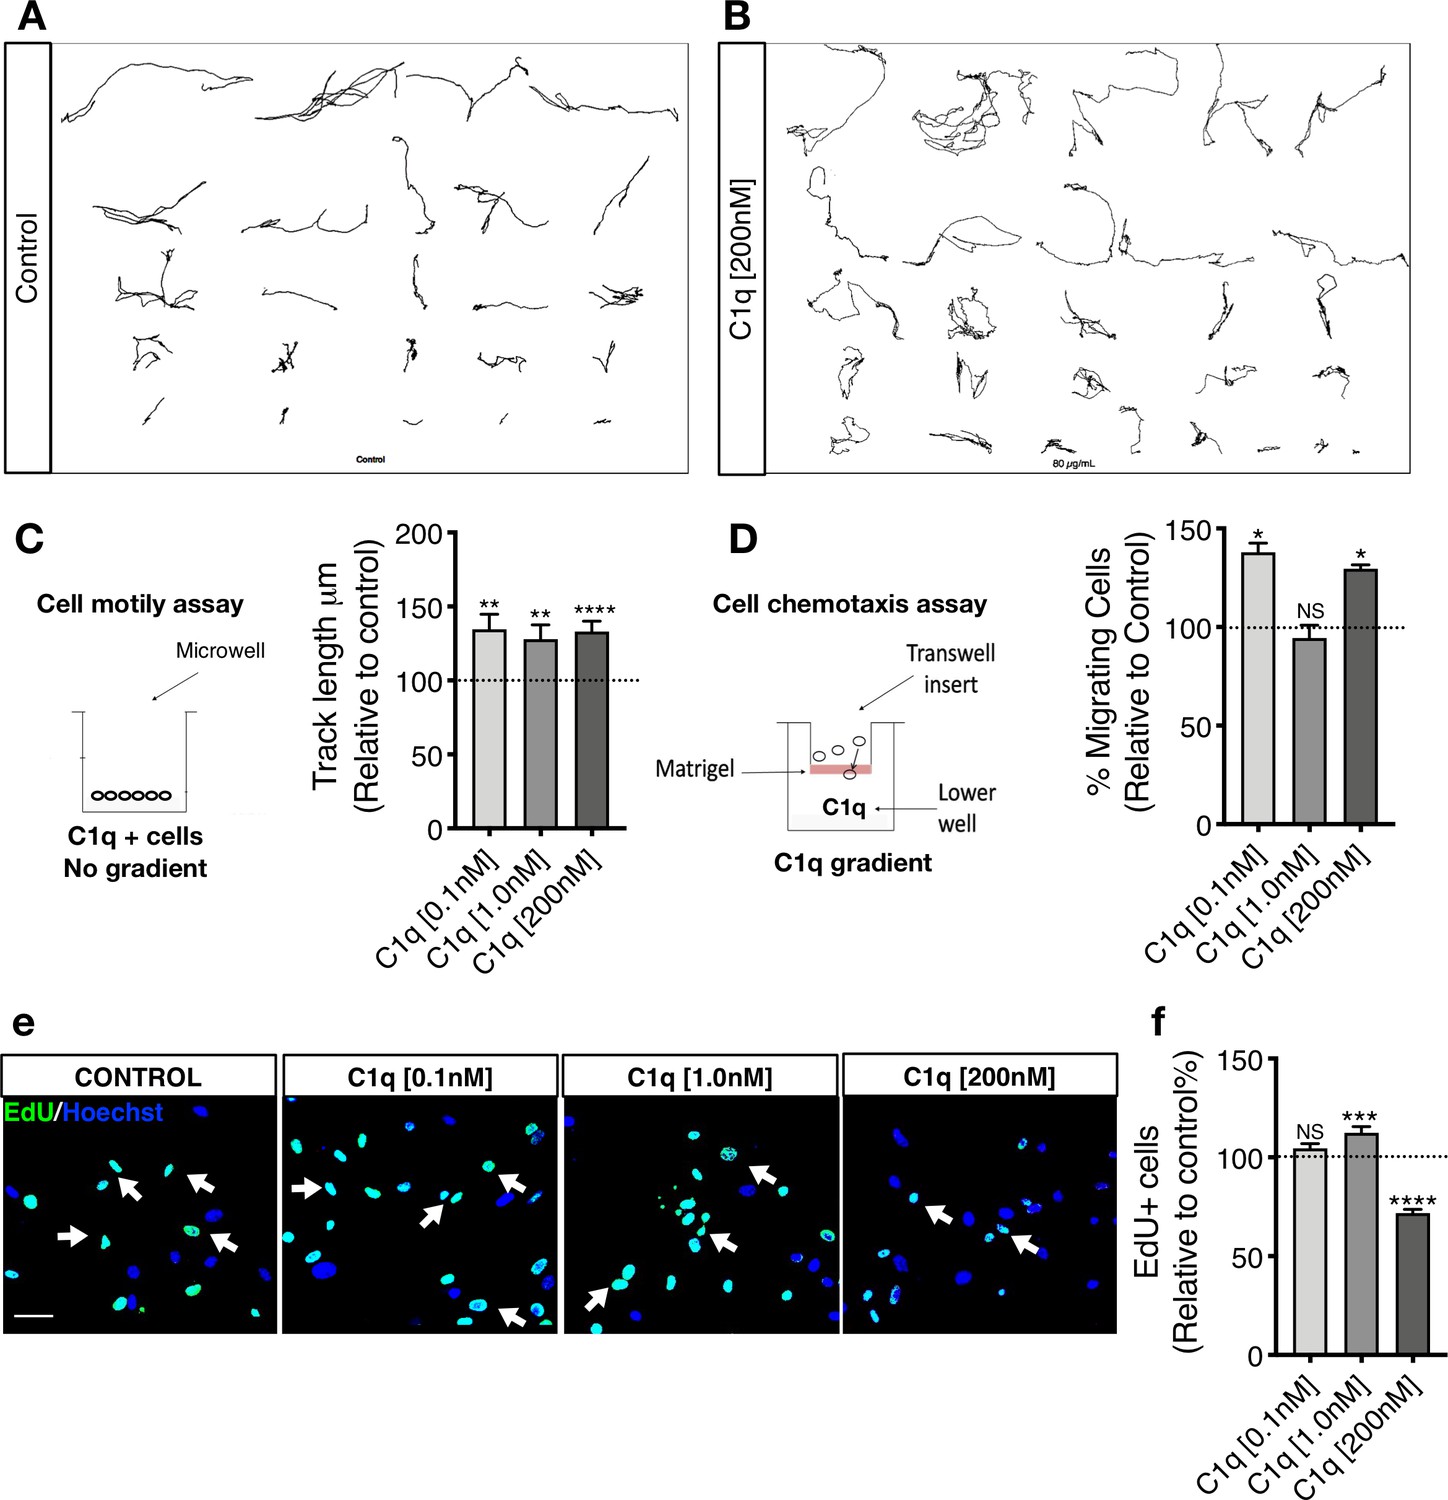
C1q induces NSC motility and chemotaxis in vitro.
(A-C) Exposure to C1q in the absence of a gradient increases hNSC motility independent of concentration. Manual tracking of 20 randomly selected cells per biological replicate in live-cell imaging assay reveals that C1q increases hNSC motility as measured by track length, independent of C1q concentration. Representative image of 20 manual tracks from cells in (A) control and (B) C1q [200 nM] condition. (C) Data normalized to untreated control (dashed line). Statistical analysis using one-sample t-test (*p≤0.05, **p≤0.01; N = 3 biological replicates) for comparison with control. ANOVA analysis for comparison between groups, p=0.8682. (D) Exposure to C1q in transwell assay for analysis of chemotaxis reveals that C1q induces hNSC migration in a concentration-dependent manner, with maximal effects at 0.1 nM and 200 nM. Data normalized to untreated control (dashed line). Statistical analysis using one-sample t-test for comparison with control (*p≤0.05, **p≤0.01; n = 4 biological replicates with technical triplicates). ANOVA analysis for comparison between groups, p=0.0005. (E-F) EdU incorporation analysis reveals that C1q modulates hNSC proliferation. Representative image of Edu+ nuclei (green, white arrows) in hNSC exposed to C1q [0.1 nM], [1.0 nM], or [200 nM] for 2DIV. Scale bars 30 µm. (F) Edu+ nuclei quantification. Data shows untreated control (dashed line; mean ± SEM). Statistical analysis using one-sample t-test for comparison with control (NS = not significant p>0.05, ***p≤0.001, ****p≤0.0001; 10 random images/experiment (N), N = 4 biological replicates, averaging 140 ± 60 cells/image. ANOVA analysis for comparison between groups, p≤0.0001.
Figure 5 with 4 supplements
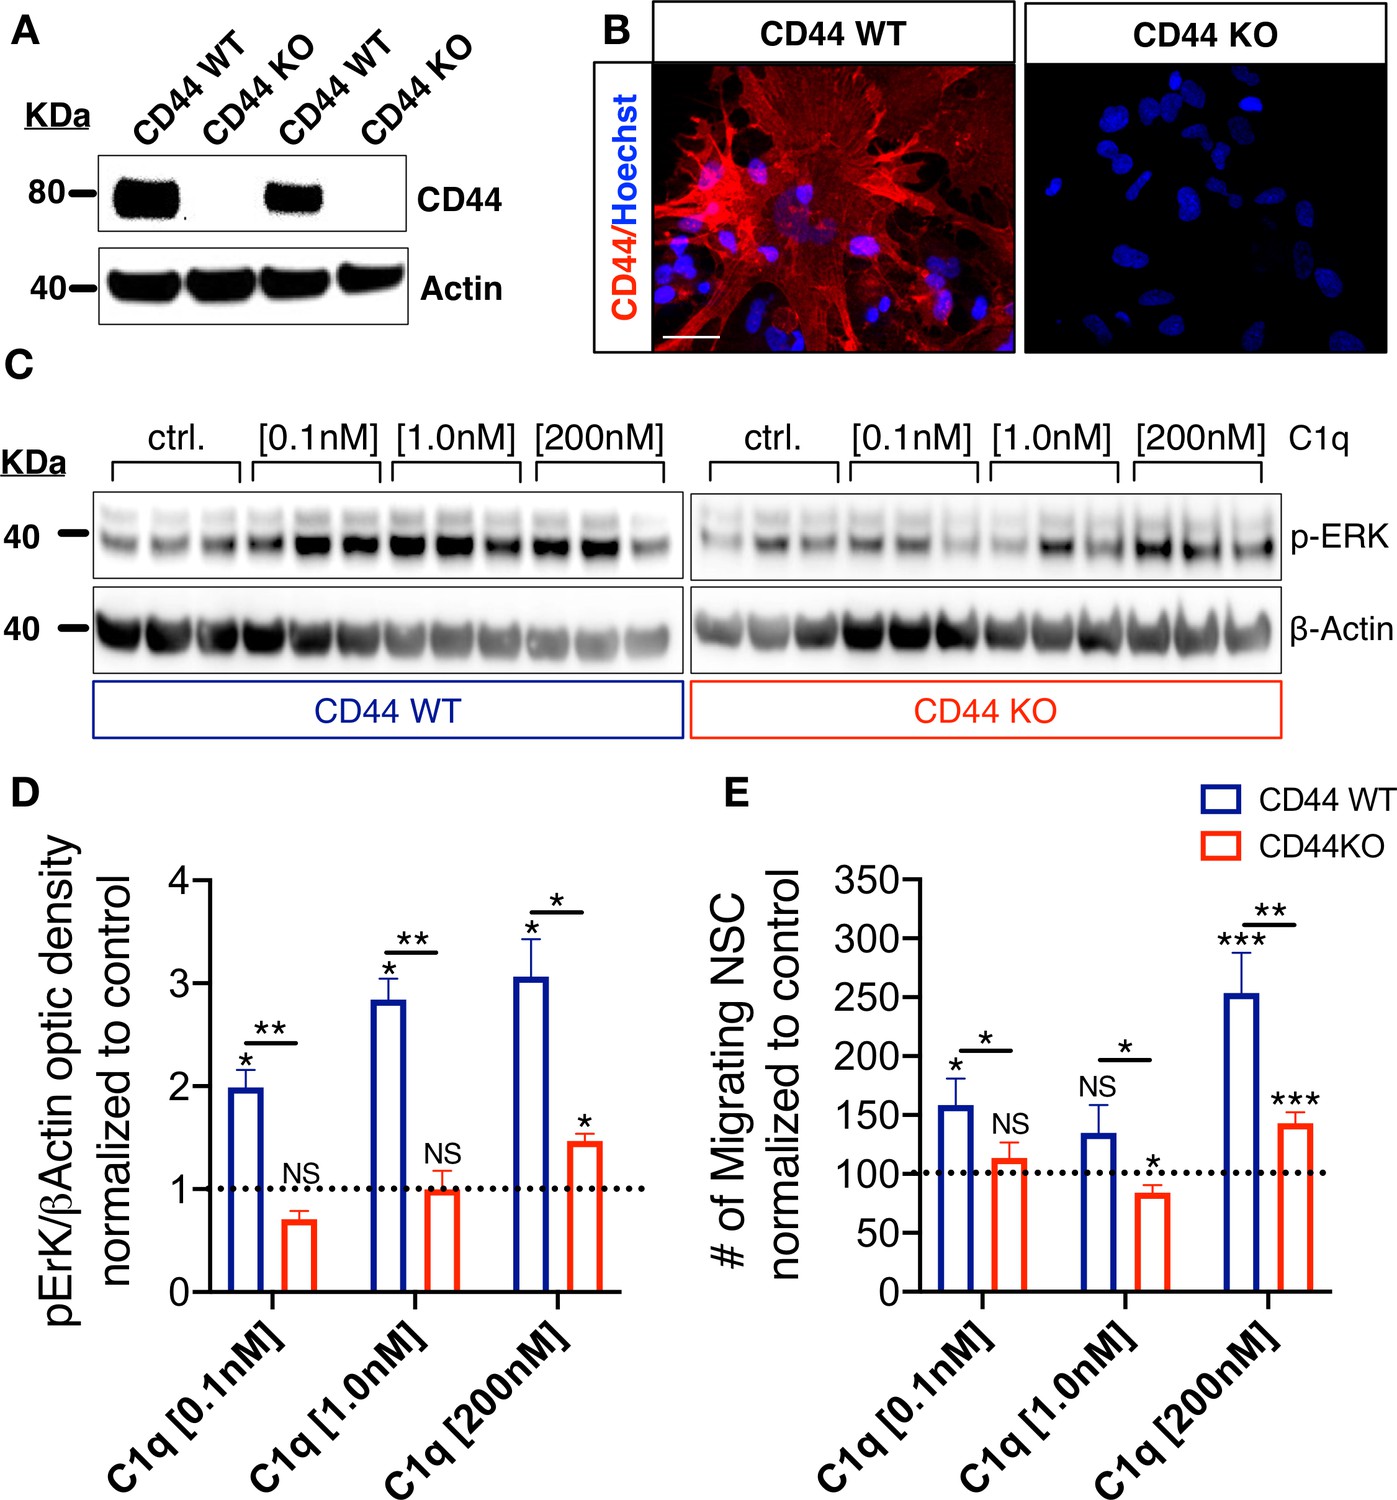
CD44 mediates C1q-induced ERK signaling activation and chemotaxis in hNSC in vitro.
(A,B) CD44 expression profile in WT but not in CD44 KO hNSC was verified by (A) western blot and (B) Immunocytochemistry (scale bar 30 µm). (C,D) p-ERK western blot analysis of protein lysates from WT and CD44 KO hNSC shows that C1q-induced ERK activation is completely blocked in CD44 KO hNSC at C1q [0.1 nM] and [1 nM], and dramatically attenuated at C1q [200 nM]. p-ERK band optical intensities were normalized to β-actin within condition. Data show mean ± SEM (N = 3 biological replicates per condition) normalized to untreated controls for comparison between conditions (dashed line). Statistical analysis using one-sample t-test (NS, not significant; *p≤0.05) for comparison with control and Student’s t-test for comparison between WT and CD44 KO hNSC as indicated (*p≤0.05, **p≤0.01). (E) Transwell chemotaxis assay reveals that C1q-induced hNSC chemotaxis is completely blocked in CD44 KO hNSC at C1q [0.1 nM] and dramatically attenuated at C1q [200 nM]. Data show mean ± SEM (N = 3 biological replicates per condition) normalized to untreated controls (dashed line). Statistical analysis using one-sample t-test (NS, not significant; *p≤0.05) for comparison with control and Student’s t-test for comparison between WT and CD44 KO hNSC as indicated (*p≤0.05, **p≤0.01).
Figure 5—figure supplement 1
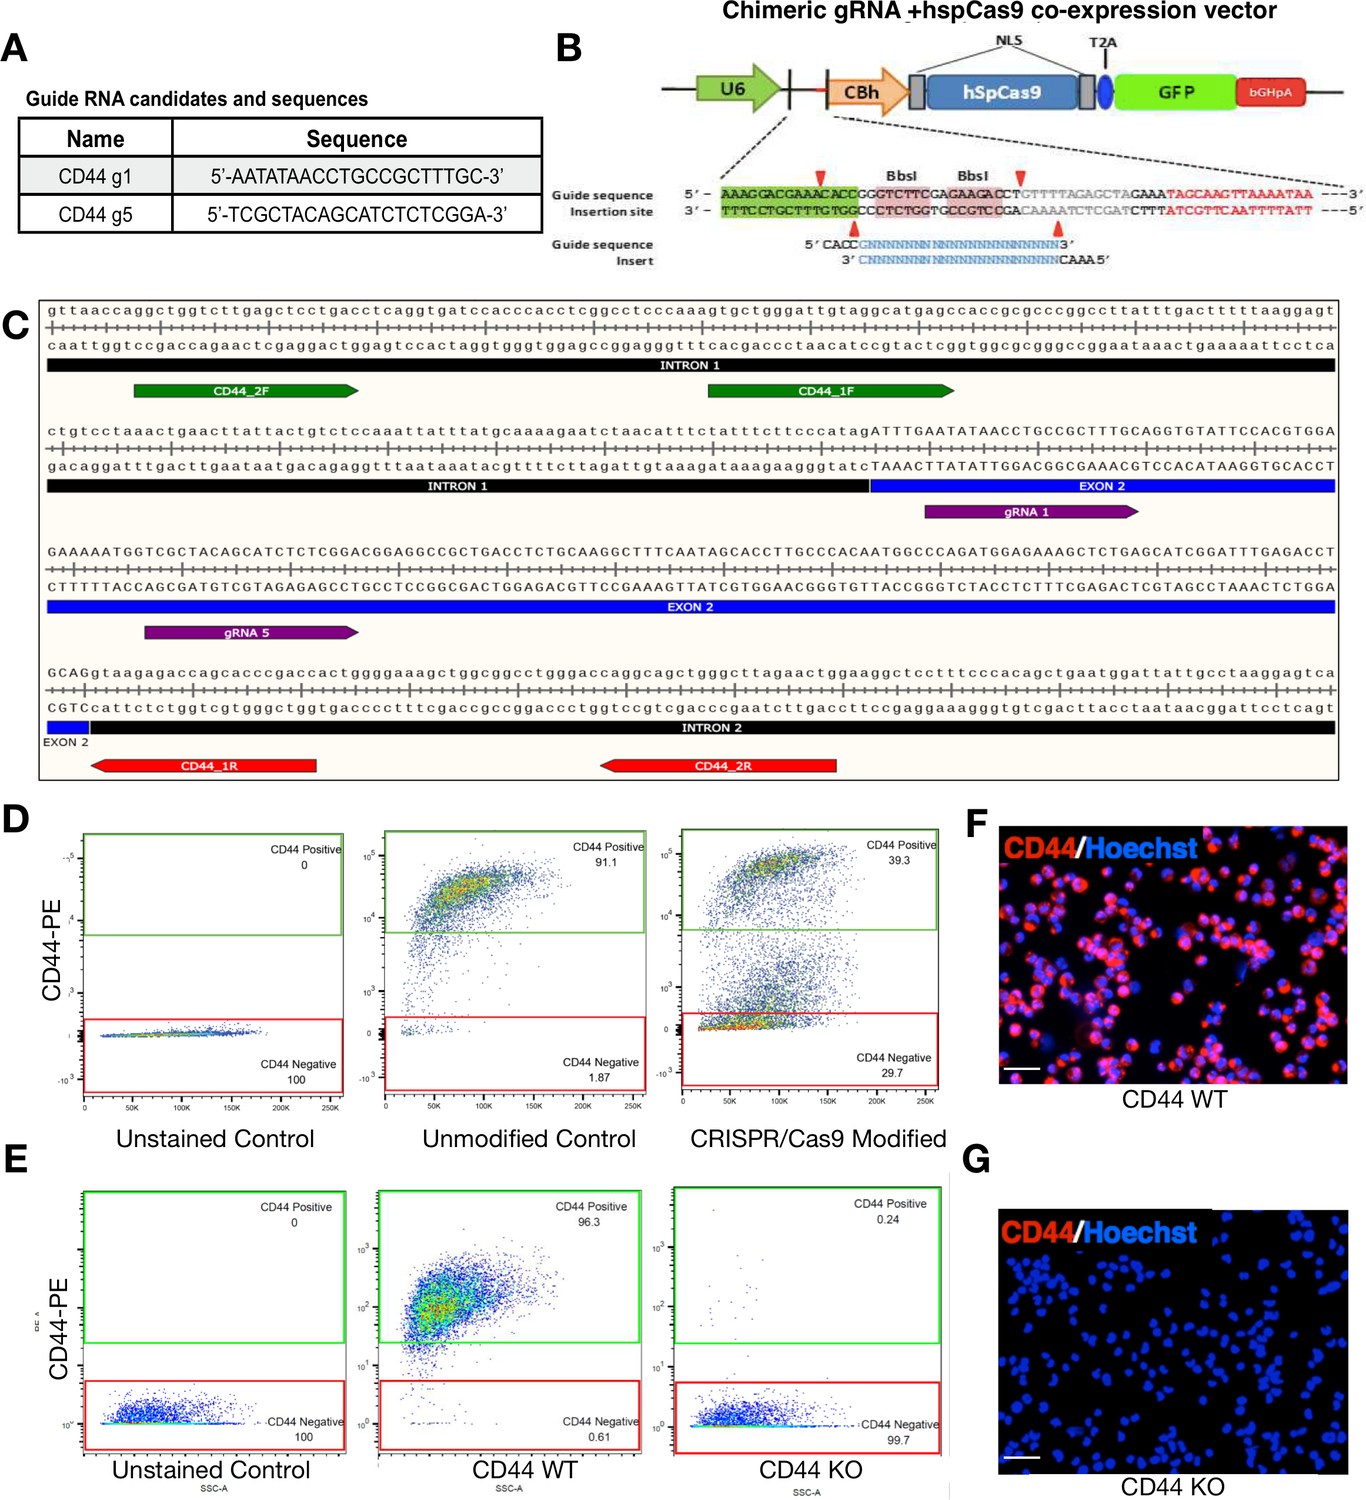
WT and CD44 KO hNSC generation.
The human CD44 loci (gene ID: 960) was targeted using the CRISPR/Cas9 system to create genetic knockout via non-homologous end joining (NHEJ). (A) CD44 Guide RNA sequences. For maximum disruption of CD44’s ORF, two guide RNAs (gRNAs) were simultaneously introduced into hNSC with chimeric guide RNA + hspCas9 co-expression vector. (B) hspCas9 co-expression vector. (C) Snap Gene Graphics for gRNA alignment. Both gRNAs (purple) were designed to target the second exon of CD44 to generate a 47 bp deletion within exon two resulting in a frame-shift that introduces a pre-mature stop codon within a targeted exon. (D) WT and CD44 KO FACS sorting after CRISPR. Two weeks after plasmid introduction, unsorted CRISPR-modified hNSC were separated based on CD44 expression using fluorescence activated cell sorting (FACS); CD44-negative knockout cells (29.7% of the total population) were isolated based on the gating of our unstained control; CD44-positive wild-type cells (39.3% of the total population) were isolated based on the gating of our positive control, unmodified CD44-PE-stained cells. FACS-isolated CD44 WT and CD44 KO hNSC retain expression identity after multiple passages. (E) Flow citometry analysis of CD44 WT and KO hNSC. After more than a month in culture, and having undergone four passages, we re-analyzed the expression of CD44 in WT and KO cells. FACS-isolated CD44 WT hNSC retained CD44 expression; 96.3% CD44-PE positive and 1.87% CD44-PE negative. FACS-isolated KO hNSC retained a CD44-negative expression phenotype; 99.7% CD44-PE negative and 0.24% CD44-PE positive. (F) Fluorescent images of CD44 WT immediately after flow cytometry. (G) Fluorescent images of CD44 KO immediately after flow cytometry. After CD44 -PE staining, hNSC were counterstained with Hoechst to label cell nuclei and then mounted on a slide using a Cytospin 4 centrifuge (Thermo Scientific). Scale bars 30 µm. Images were taken in an inverted fluorescent microscope at 20×.
Figure 5—figure supplement 2
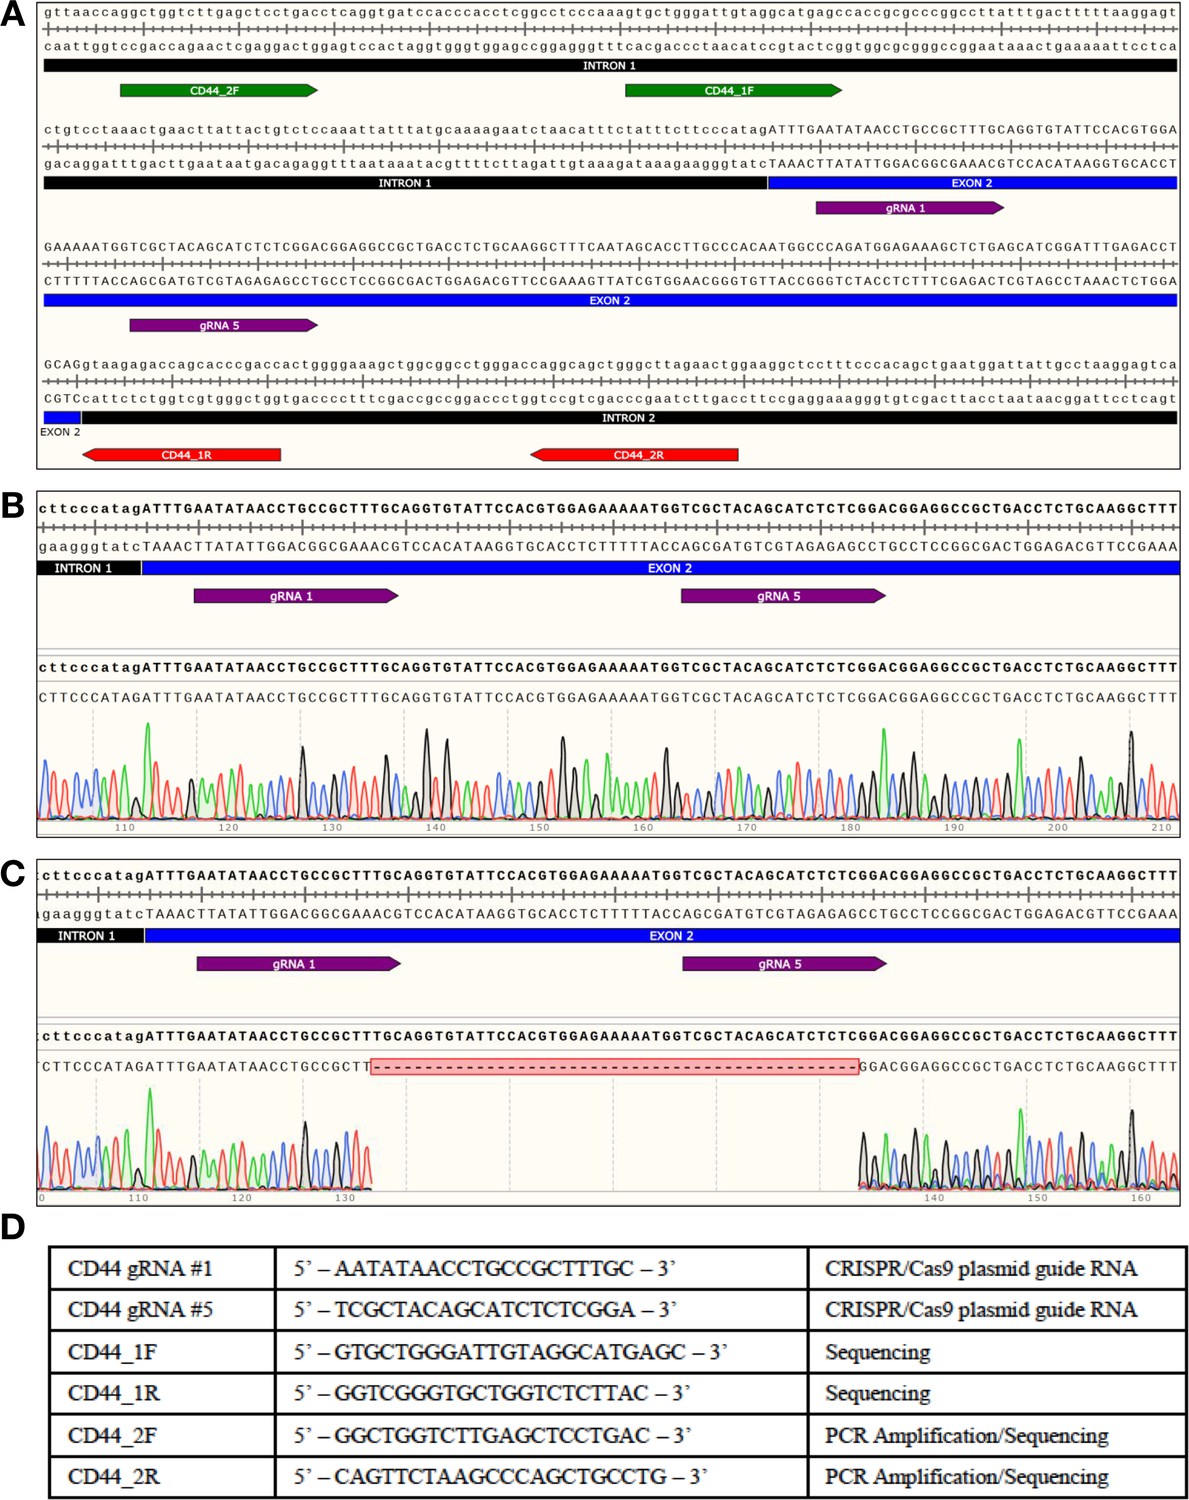
CD44 WT and CD44 KO hNSC genotyping by sequencing.
(A) Human CD44 locus: Location of guide RNAs (gRNA) and genotyping primers. CD44-WT or CD44-KO hNSC generated by NHEJ with CRISPR/Cas9 system. Two primer sets (forward primer in green), (reverse primer in red) were used to amplify and/or sequence the region surrounding the targeted site. Graphics were produced using SnapGene software. The targeted site was then amplified using a high-fidelity polymerase and highly specific primer set (CD44_2 F/CD44_2R); this primer set was optimized to produce a single amplicon of 422 bp. This amplicon was then purified and submitted for Sanger sequencing to Retrogen Inc; each amplicon was sequenced with four different primers. The raw chromatograph data from the Sanger sequencing was then aligned with the targeted site using SnapGene software. (B) Alignment of CD44 WT sequencing results. FACS isolated CD44-positive hNSC showed no genetic changes within the targeted exon (no double peaks at any positions). (C) Alignment of CD44 KO sequencing results. FACS isolated CD44-negative hNSC contained a 47 bp deletion within exon 2 resulting in a frame-shift that introduced a premature stop codon within targeted exon; the same deletion was consistently detected in all traces. (D) Table containing all of the sequences used in producing the data of this figure.
Figure 5—figure supplement 3
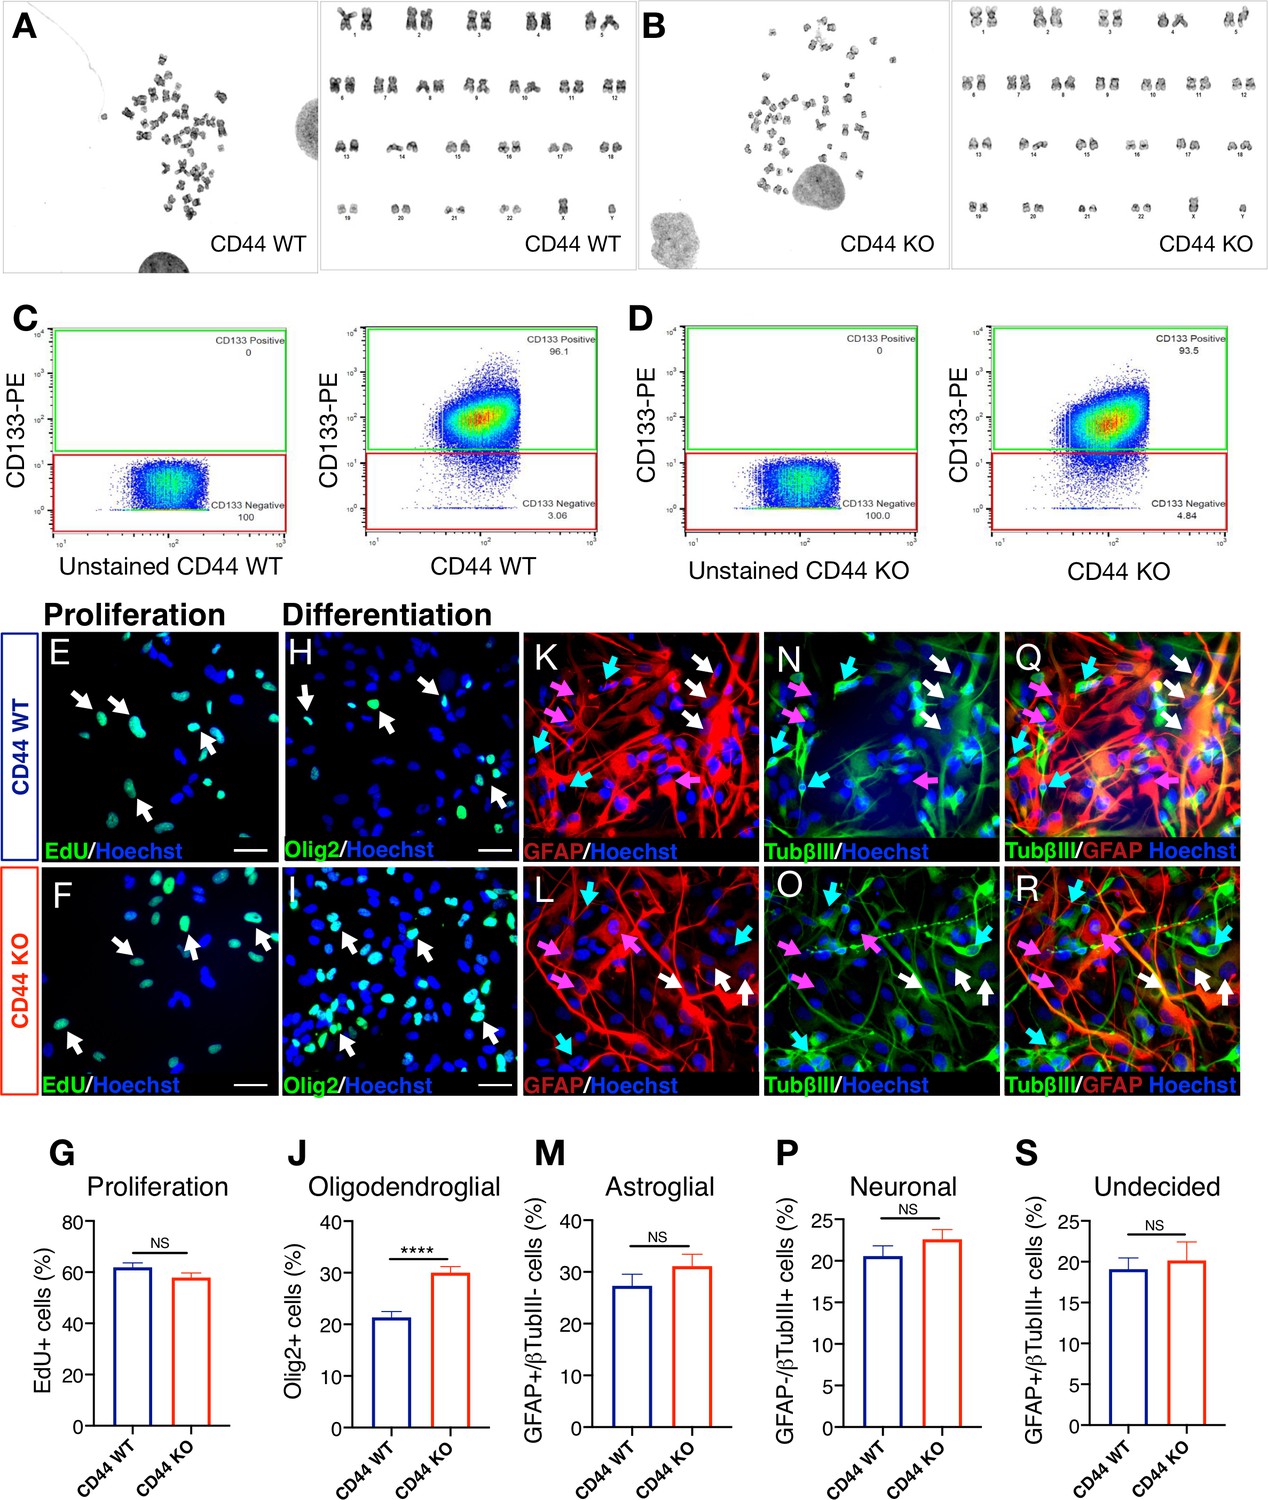
Karyotype, stemness, proliferation capacity, and multipotency are unaltered after CRISPR Cas9 genetic deletion of CD44 in hNSC.
(A,B) CD44 WT and KO hNSC are karyotypically normal at p7. CD44 WT/KO hNSC were submitted to Cell Line Genetics, for G-banding karyotyping. (A) FACS-isolated CD44 wildtype (WT) G-banding karyotyping. (B) FACS-isolated CD44 knockout (KO) G-banding karyotyping. (C,D) CD44 WT and CD44 KO hNSC express similar levels of CD133+ cells. (C) CD44 WT and (D) CD44 KO hNSC were assessed for expression of the ‘stemness’ marker CD133. Relative to the unstained control, at passage 7, CD44 WT and CD44 KO hNSC express similar levels of CD133 as measured by flow cytometry; 96.1% and 93.5%, respectively. (E-G) CD44 WT and CD44 KO hNSC exhibit similar proliferation levels. Representative image of EdU (green) + nuclei and Hoechst counterstain (blue) of (E) CD44 WT and (F) CD44 KO hNSC. White arrows indicate examples of EdU+ nuclei, scale bars 30 µm. (G) EdU incorporation quantification at 2 d in vitro (DIV). Data shown as proportion of EdU+ cells for CD44 WT (blue column) and KO (red column), Mean + SEM. Student’s t-test, NS = not significant p=0.1126, N = 4 biological replicates. (H-S) Genetic deletion of CD44 in human NSC did not alter multipotency of hNSC but increased oligodendroglial differentiation in vitro. After 14DIV under differentiation conditions, cells were immunostained for an oligodendroglial marker (Olig2+, green). A second set of cells was double immunostained for astroglial (GFAP+, red) and neuronal (β tubulin III+, green) markers. Representative image of Olig2 immunostaining in (H) WT and (I) CD44 KO hNSC. White arrows indicate examples of Olig2+ nuclei, scale bars 30 µm. (J) Olig2+ nuclei quantification (%). Representative image of GFAP immunostaining in (K) CD44 WT and (L) CD44 KO hNSC. Pink arrows indicate examples of cytoplasmic GFAP+/β tubulin III- astroglial cells, scale bars 30 µm. (M) GFAP+/β-tubulinIII- astroglial cell quantification (%). Representative image of β-tubulinIII immunostaining in (N) CD44 WT and (O) CD44 KO hNSC. Green arrows point to examples of cytoplasmic GFAP-/β tubulinIII+ neuronal cells, scale bars 30 µm. (P) GFAP-/β tubulin III+ neuronal cell quantification (%). Representative image of GFAP and β tubulinIII double immunostaining in (Q) CD44 WT and (R) CD44 KO hNSC. White arrows point to examples of GFAP+/β tubulinIII+ undecided double positive cells, scale bars 30 µm. (S) GFAP+/β tubulin III+ double + undecided cell quantification (%). Data represent average percentage ± SEM of quantified positive cells, obtained from 10 random pictures/experiment, from N = 4 biological replicates (averaging 140 ± 60 cells/picture). Statistical analysis was performed using Student’s t-test between WT and CD44 KO hNSC; NS: not significant p≥0.2455, ****p≤0.0001.
Figure 5—figure supplement 4
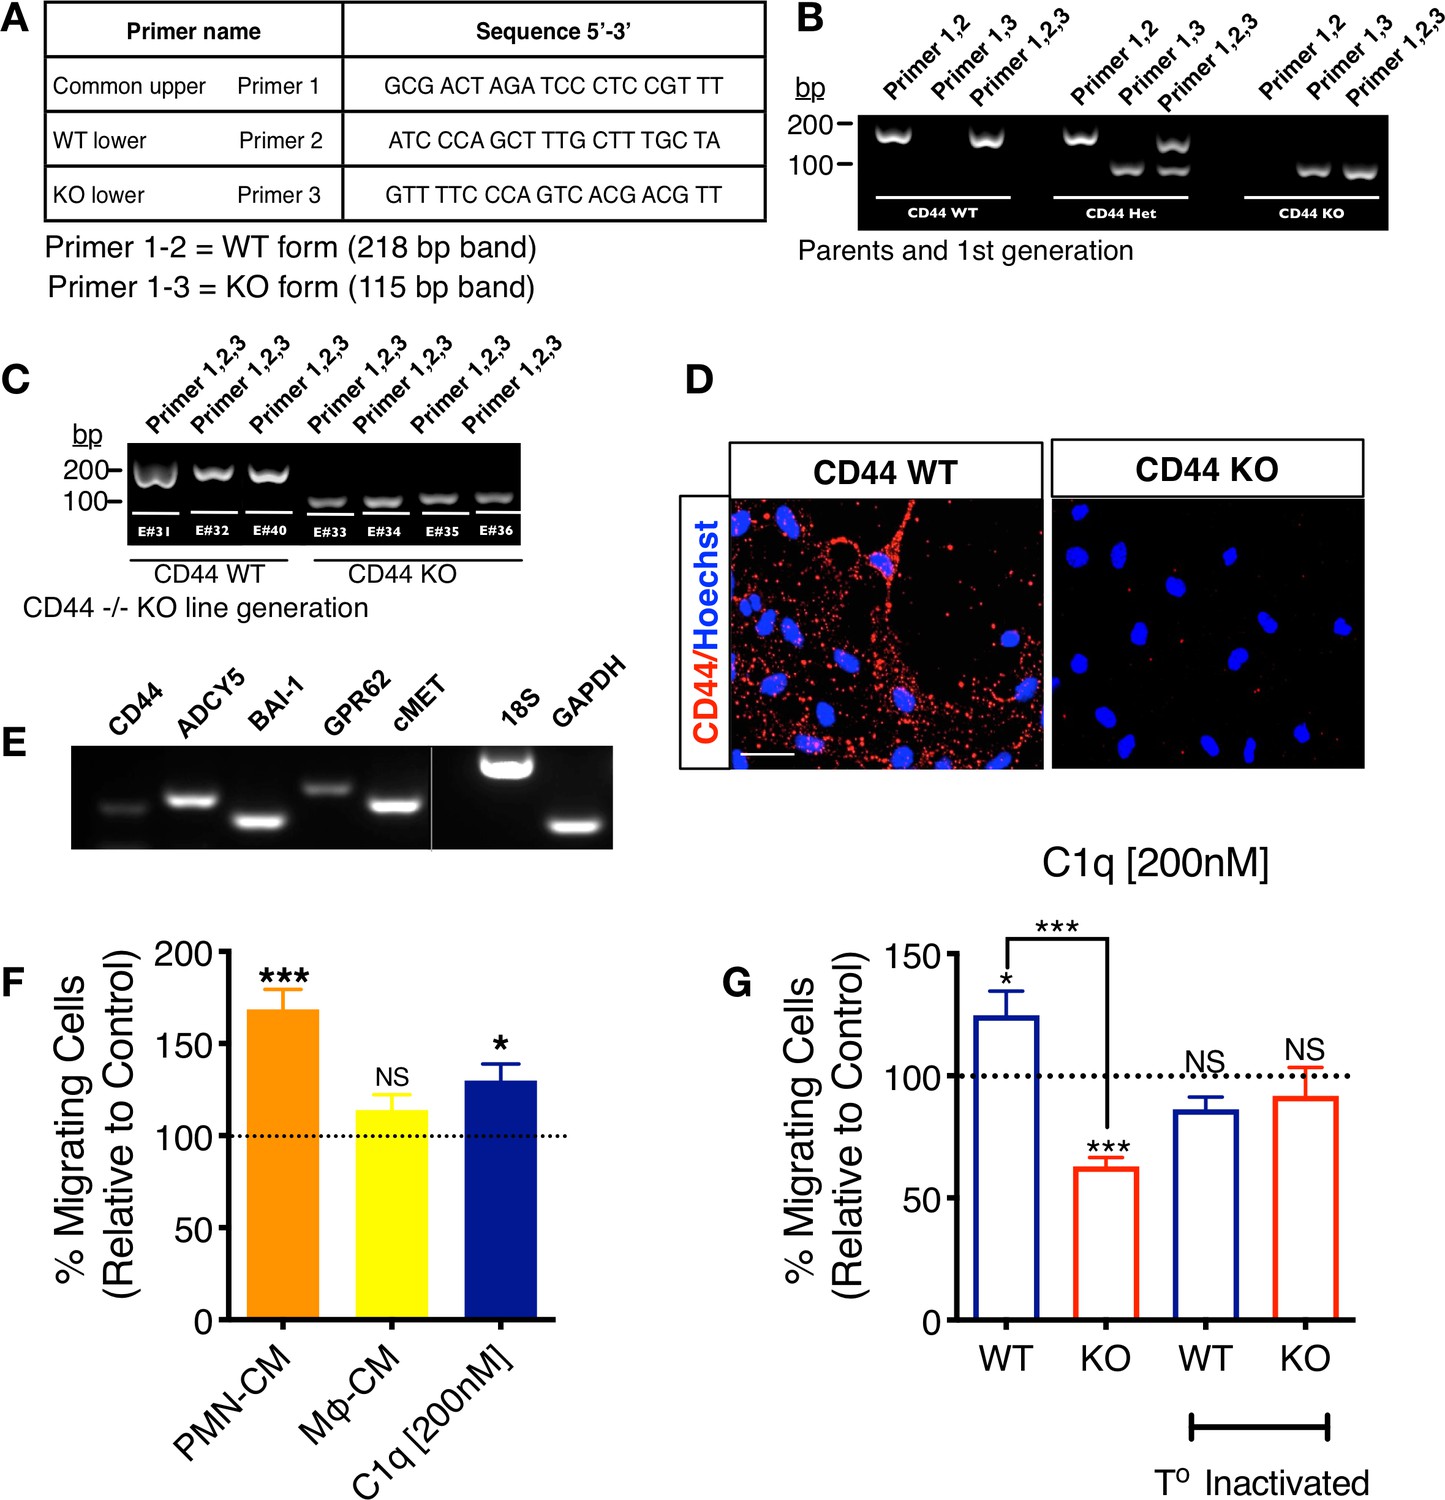
CD44 WT and KO mNSC cell line generation.
Mouse NSC (mNSC) from CD44 WT and KO mice were derived from single embryo cortices at E11.5–12. DNA of parent mice and each littermate embryo was extracted from tail snips and direct PCR performed for genotyping. (A) Primers used for genotyping CD44 WT, KO, and heterozygous embryos. (B) Genotyping results of WT and CD44KO parents and first-generation heterozygous CD44 +/– colonies. (C) Genotyping results of WT and CD44 KO embryos that were used to generate CD44 WT and KO mNSC lines. (D) CD44 expression in CD44 WT and CD44 KO mNSC by immunostaining verifies positive staining only in WT cells. (E) mNSC express all C1q novel candidate receptors. mRNA RT-PCR analysis in mNSC reveals the positive expression of all C1q novel signaling candidates. (F) mNSC migrate toward PMN-CM and C1q similar to hNSC in vitro. Transwell chemotaxis assay shows that PMN-CM and C1q [200 nM] but not Mφ-CM induce mNSC chemotaxis. Data normalized to untreated control (dashed line; N = 3 biological replicates per condition with technical triplicates). Statistical analysis using one-sample t-test (NS, not significant; *p≤0.05, ***p≤0.001) for comparison with control. ANOVA analysis for comparison between groups, p=0.0018. (G) CD44 WT but not KO mNSC migrate toward C1q [200 nM] similar to hNSC in vitro. Transwell chemotaxis assay shows that C1q [200 nM] induces mNSC chemotaxis only in CD44 WT cells, while KO cells are repulsed by C1q. Both effects are blocked by temperature inactivation of C1q. Data normalized to untreated control levels (dashed line; N = 3 biological replicates per condition with technical triplicates). Statistical analysis using one-sample t-test (NS, not significant; *p≤0.05, ***p≤0.001) for comparison with control, ANOVA analysis for comparison between groups, ****p≤0.0001, and Student’s t-test for comparison between WT and CD44 KO mNSC as indicated (***p≤0.001).
Figure 6
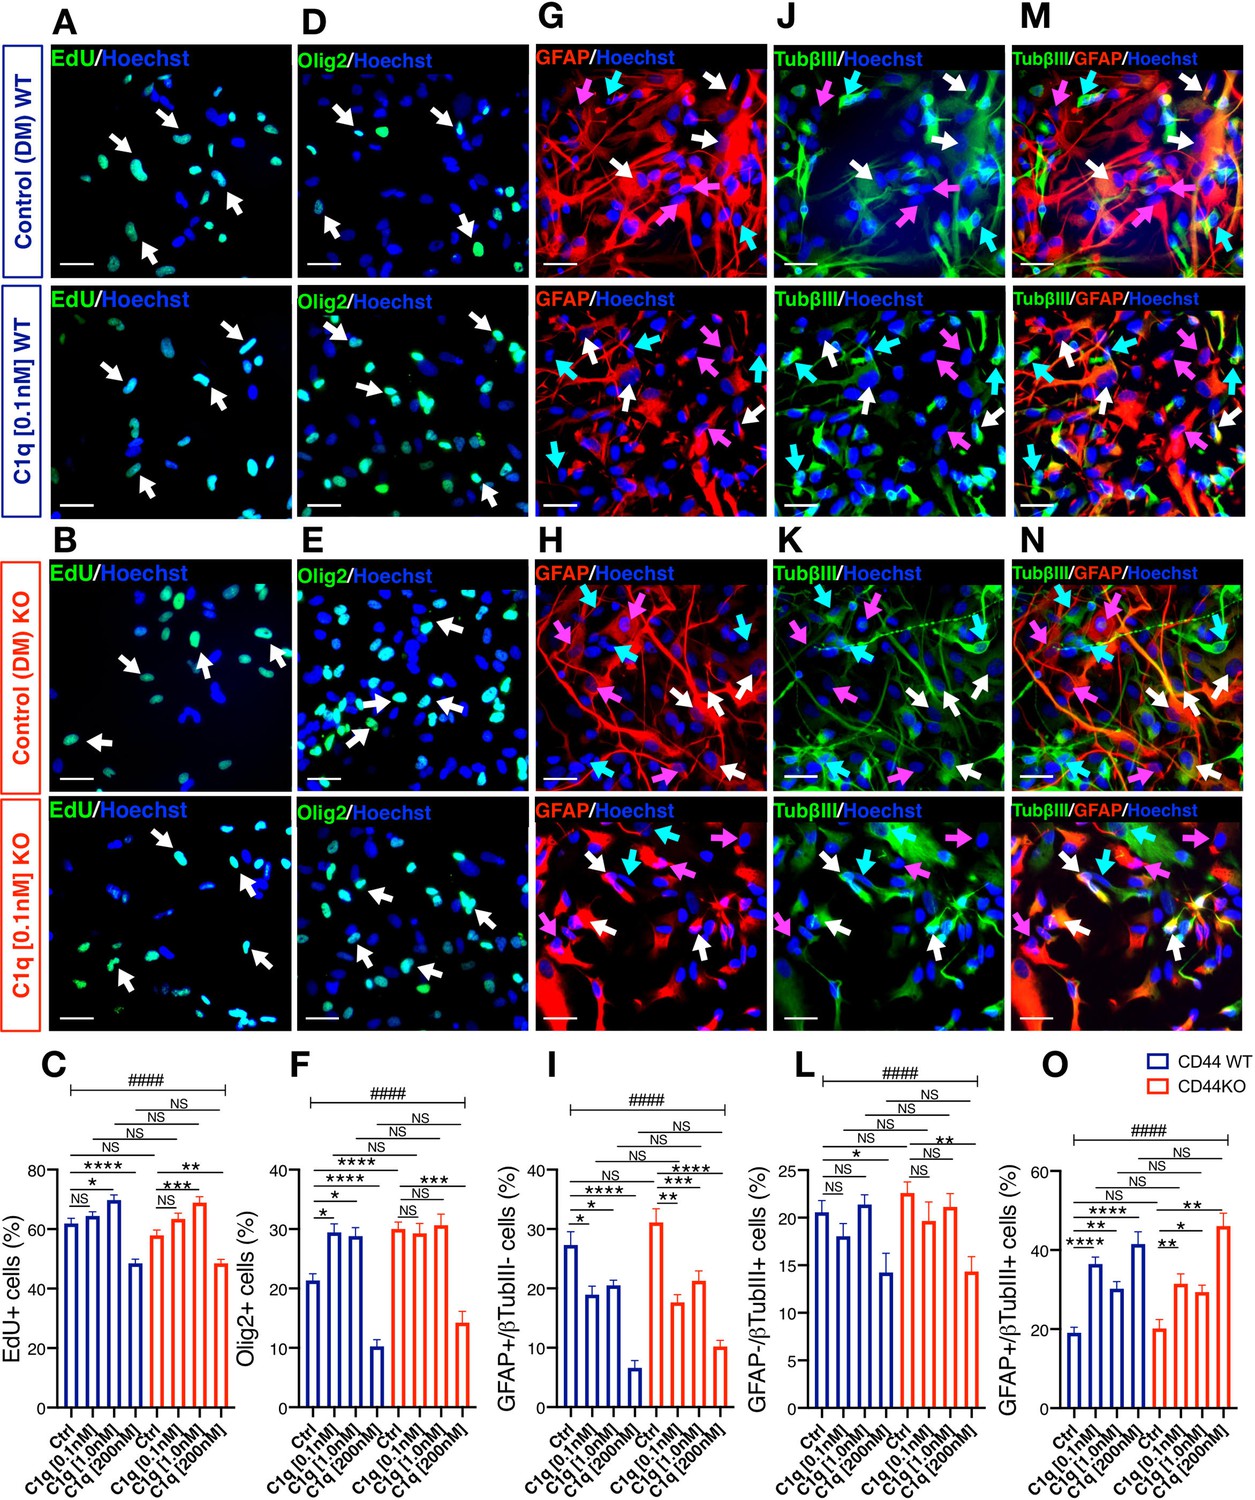
C1q modulation of hNSC proliferation and fate is CD44 independent.
(A-C) EdU incorporation analysis reveals that C1q exposure for 2DIV (0.1 nM–200 nM vs. control media, as indicated) exerts comparable effects on hNSC proliferation in CD44 WT and KO. Representative images (A, B; white arrows, scale bar 30 µm) and quantification (C) of EdU+ nuclei of CD44 WT (blue) and KO (red) hNSC. (D-O) Immunohistochemical fate analysis reveals that C1q exposure for 14DIV in DM (0.1 nM–200 nM vs. control media, as indicated) exerts comparable effects on hNSC fate in CD44 WT and KO. hNSC were immunolabeled for Olig2 (green) to identify oligodendroglial lineage cells, and doubled immunolabeled for glial fibrillary acidic protein (GFAP, red) and Tubulin βIII (TubβIII, green) to identify astroglial and neuronal lineage cells, respectively. Representative images and quantification of nuclear Olig2+ oligodendroglial cells (D-F; white arrows, scale bar 30 µm), GFAP+/TubβIII- astroglial cells (G-I; pink arrows, scale bar 30 µm), GFAP-/TubβIII+ neuronal cells (j-l, green arrows, scale bar 30 µm), and GFAP+/TubβIII+ double-positive ‘undecided’ cells (M-O, white arrows, scale bar 30 µm). Data represent average number of cells as a percentage of total nuclei ± SEM of EdU labeled or immunolabeled cells obtained from 10 random fields/experiment (N = 4 biological replicates for each label and condition; average 140 ± 60 cells/field). Statistical analysis was performed using one-way ANOVA (####p≤0.0001) followed by Tukey’s post-hoc t-tests as indicated (NS, not significant; *p≤0.05, **p≤0.01, ***p≤0.001, ****p≤0.0001). No significant differences were observed between WT and CD44 KO hNSC in response to C1q at any tested C1q concentration (Tukey post-hoc t-tests p≥0.7891 for all comparisons).
Figure 7 with 2 supplements
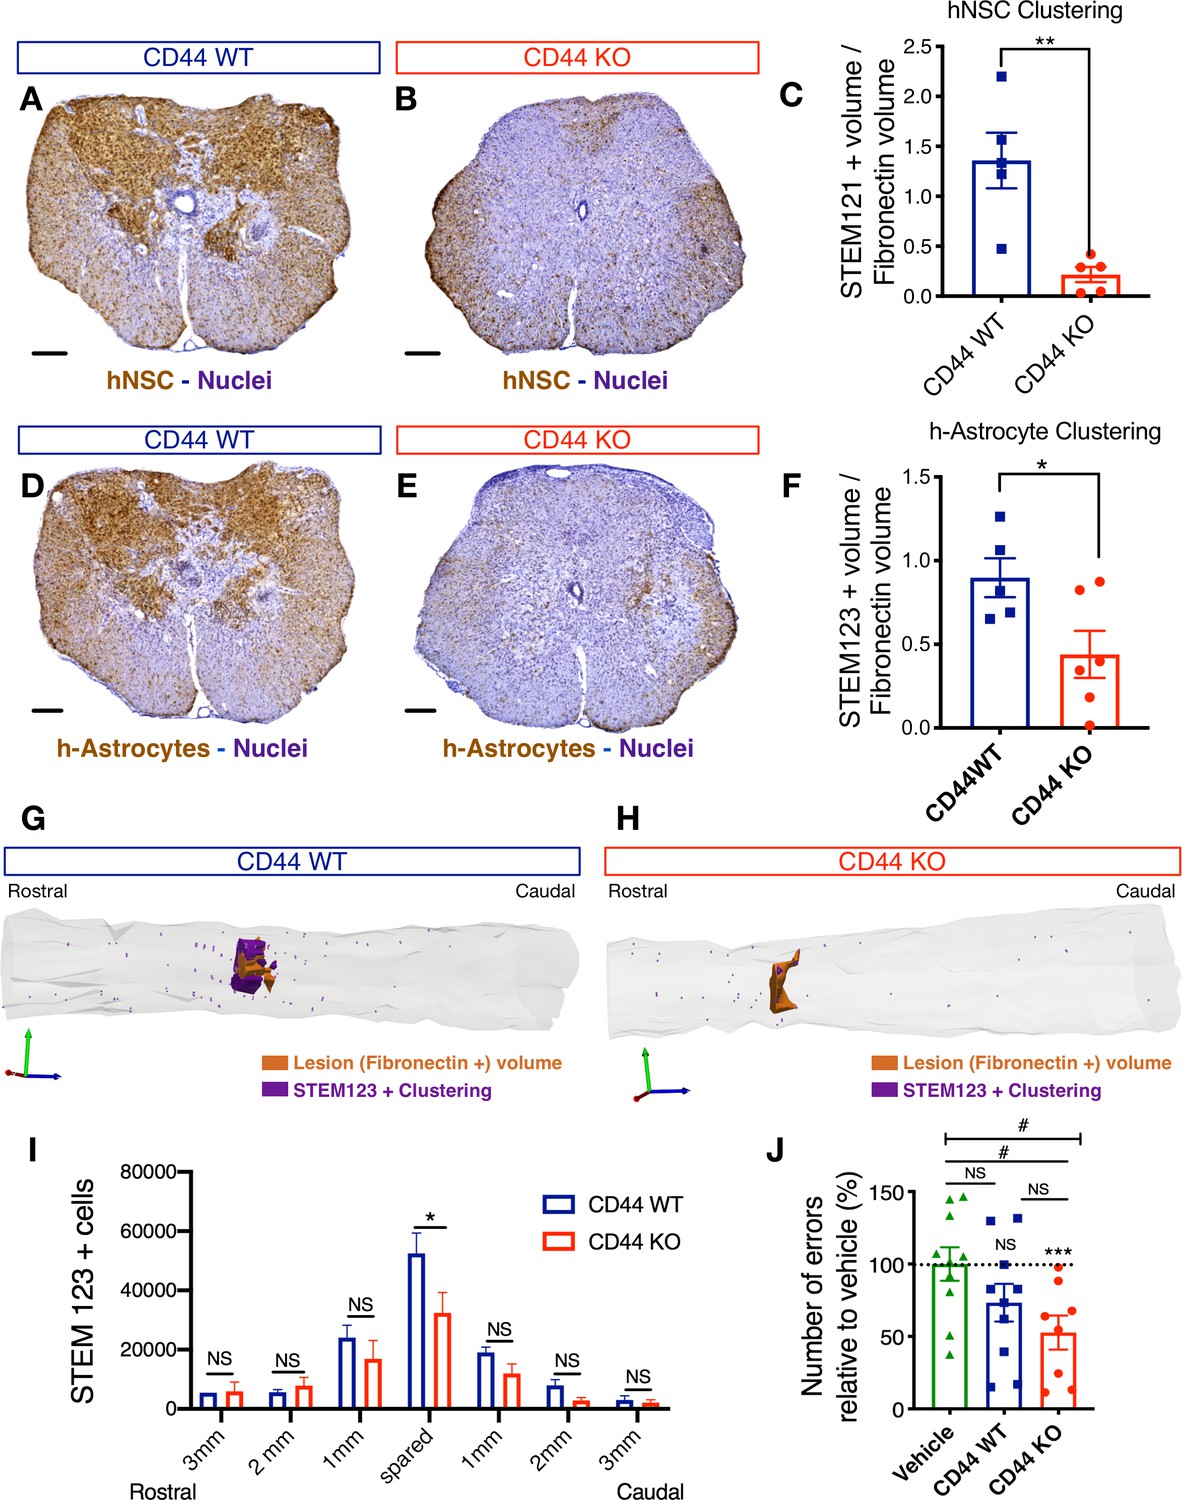
CD44 KO decreases hNSC localization at the SCI epicenter, modulating astroglial fate and rescuing the capacity of hNSC to promote locomotor recovery after transplantation into the acute SCI microenvironment.
All histological data obtained 16 weeks post-transplant (WPT). (A,B) Representative images of transverse spinal cord sections corresponding to the injury epicenter area immunostained for the human-specific cell marker STEM121 (brown; scale bars, 250 µm) and hematoxylin nuclear counterstain (purple) on spinal cords from mice transplanted with WT (blue) or CD44 KO (red) hNSC. (C) Stereological analysis of STEM121+ human cell clustering using Cavalieri sampling demonstrates a decrease in CD44 KO vs. WT human cells adjacent to the SCI epicenter. Data show mean ± SEM (N = 5–6 mice randomly selected for histology/group). Statistical analysis using Student’s t-test as indicated (**p≤0.01). (D,E) Representative image of transverse spinal cord section corresponding to the injury epicenter area immunostained for the human astrocyte specific marker STEM123 (brown; scale bars, 250 µm) and hematoxylin nuclear counterstain (purple) in spinal cords from mice transplanted with (D) WT or (E) CD44 KO hNSC. (F) Stereological analysis of STEM123+ h-astrocyte clustering using Cavalieri sampling demonstrates a decrease in CD44 KO vs. WT h-astrocytes adjacent to the SCI epicenter. Data show mean ± SEM (N = 5–6 mice randomly selected for histology/group). Statistical analysis using Student’s t-test as indicated (*p≤0.05). (G,H) Representative three-dimensional reconstructions generated by stereological quantification of the lesion Fibronectin+ area (orange volume), STEM123+ clusters (purple volume), and individual STEM123+ cells (light purple dots) from mice transplanted with CD44 WT or KO hNSC. (I) Stereological analysis of STEM123+ h-Astrocyte number in the spared tissue adjacent to the SCI epicenter demonstrates a decrease in CD44 KO vs. WT localized in these regions. Data show mean ± SEM (N = 5–6 mice randomly selected for histology/group). Statistical analysis using Student’s t-test as indicated (*p≤0.05). (J) CD44 KO in hNSC rescues the capacity of acutely transplanted hNSC to promote locomotor recovery. Mice transplanted acutely with CD44 KO but not WT hNSC made significantly fewer errors on the horizontal ladder beam locomotor task in comparison with vehicle-treated mice 16 WPT. Data shown as number of errors normalized to vehicle-treated mice (dashed line; N = 8–10 mice/group). Statistical analysis using one-sample t-test (NS, not significant, ***p≤0.0005) for comparison with control vehicle-treated mice and via one-way ANOVA (#) p<0.05 followed by Tukey’s post-hoc t-test as indicated (NS, not significant; #p≤0.05) for comparison between conditions.
Figure 7—figure supplement 1
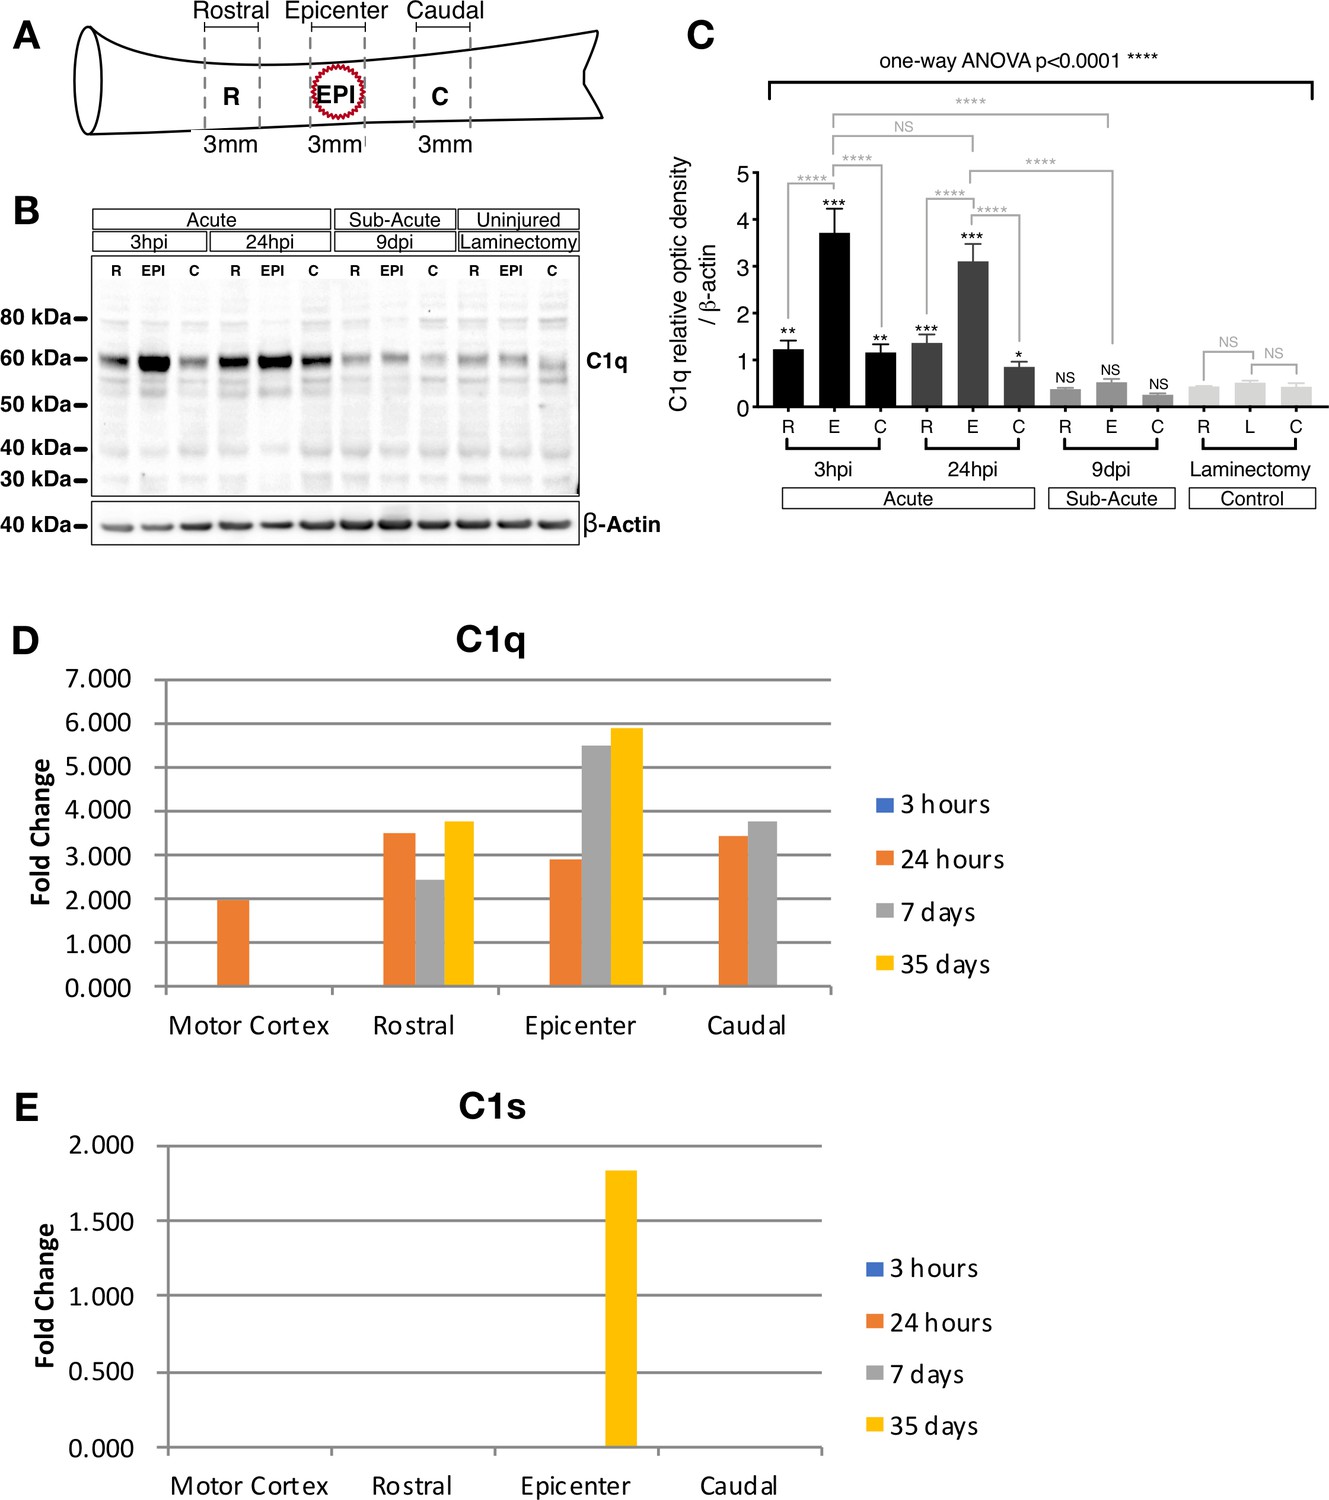
C1q protein increases in the epicenter acutely after SCI.
(A) Schematic illustrating the spinal cord sections utilized to determine C1q protein levels following 50 KDa spinal cord contusion injury or laminectomy control. (B) C1q Western blot on 3 mm rostral, epicenter, and caudal sections after laminectomy or SCI at 3 hr, 24 hr, and 9 d post-SCI reveals significantly increased C1q protein levels in the epicenter and at acute (3 hr and 24 hr) time points. (C) C1q band intensities were normalized to β-actin. Data show mean ± SEM (N = 4 mice/time point) for quantified C1q optical intensities. Statistical analysis of C1q levels was significant using one-way ANOVA at ****p≤0.0001, followed by Tukey’s post-hoc t-test as indicated (NS, not significant; *p≤0.05, **p≤0.01, ***p≤0.001, ****p≤0.0001). (D,E) mRNA expression analysis reveals a parallel increase in local C1q mRNA synthesis at the injury epicenter that is not accompanied by C1s mRNA. (D) C1q and (E) C1s gene expression changes after spinal cord injury were obtained by data analysis of our published microarray data following contusive injury of the adult rat spinal cord. Differential gene expression was examined spatially, using tissue samples from the epicenter of the injury as well as 1 cm rostral and 1 cm caudal to the epicenter, and temporally, at 3 hr, 24 hr, 7 d, and 35 d post-injury, as described in Aimone et al., 2004.
Figure 7—figure supplement 2
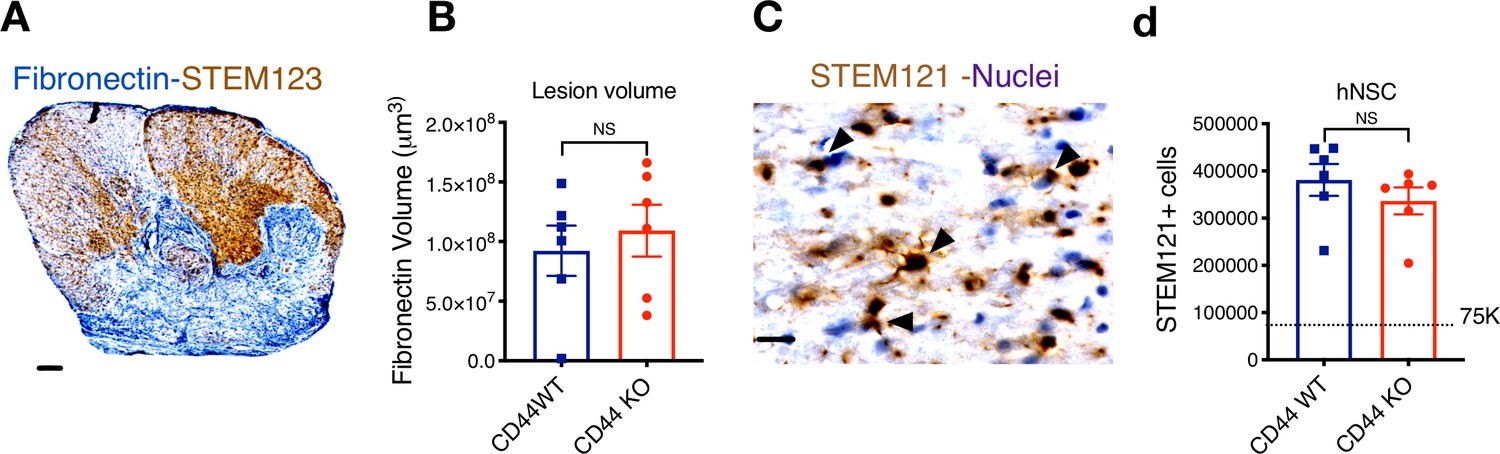
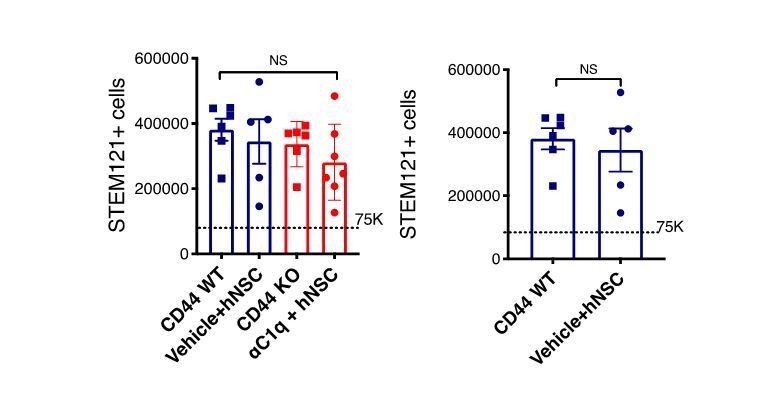
CD44 KO hNSC does not alter lesion volume or total hNSC engraftment after transplantation in the SCI acute microenvironment.
Histological analysis at 16 WPT. (A) Representative image of a transverse spinal cord section immunostained for fibronectin-at the SCI epicenter (FN+, blue; scale bar = 150 μm) and STEM123+ human astrocytes (brown). Sections were counterstained for nuclei using hematoxylin (purple). (B) Quantification of host lesion volume by unbiased stereology using the Cavalieri probe in SCI mice that received WT (blue squares) or KO (red circles) hNSC. Comparisons between groups were analyzed using Student’s t-test (NS, p=0.589). (C) Immunohistochemistry for the human-specific cytoplasmic marker STEM121 (brown; scale bar = 25 μm) Sections were counterstained for nuclei using hematoxylin (purple); arrowheads indicate STEM121+ cells with hematoxylin + nuclei as quantified. (D) Quantification of the total number of hNSC by unbiased stereology using the optical fractionator probe in mice that received CD44 WT (blue squares) vs. CD44 KO (red circles) hNSC. Comparisons between groups were conducted using Student’s t-test (NS, p=0.338). Dashed line indicates the transplantation dose of 75,000 cells.
Figure 8 with 1 supplement
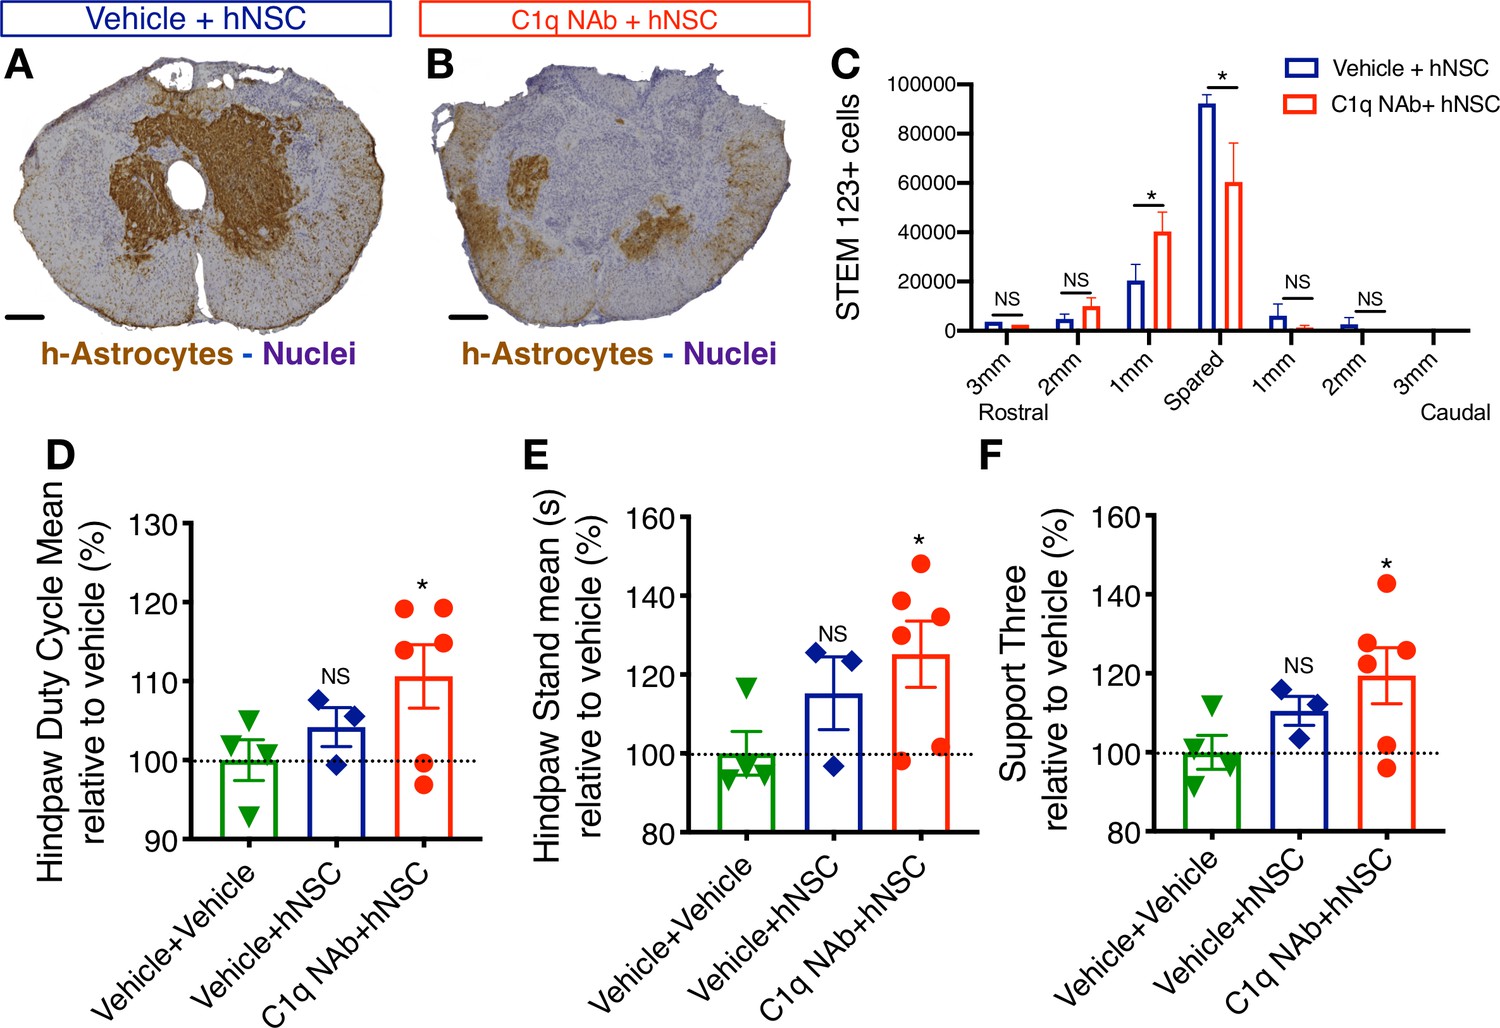
Epicenter C1q neutralization is similar to CD44 KO in modulating hNSC behavior and capacity for repair after acute transplantation.
All histological data are from animals sacrificed at 12 weeks post-transplant (WPT). (A,B) Representative images of transverse spinal cord sections corresponding to the injury epicenter area immunostained for the h-Astrocyte STEM123 marker (brown, hematoxylin nuclear counterstain in purple; scale bars, 250 µm). (A) In the absence of C1qNAb, a dense plexus of h-Astrocytes is present near the injury epicenter. (B) A single epicenter injection of C1qNAb in acute SCI microenvironment dramatically decreases the proportion of h-astrocyte at the SCI epicenter. (C) Stereological analysis of STEM123+ h-Astrocytes in the spared tissue adjacent to the SCI epicenter, as well as in 1 mm regions rostral and caudal at 12WPT. Data show mean ± SEM (N = 6 mice per group). Statistical analysis using Student’s t-test for comparison between vehicle + hNSC treated mice and C1qNAb + hNSC treated mice as indicated (*p<0.0261). (D-F) Catwalk kinematic gait analysis at 12 WPT shows that mice receiving C1qNAb + hNSC, but not vehicle + hNSC improves locomotor function in Catwalk kinematic testing vs. mice receiving only vehicle + vehicle. (G) Hindpaw duty cycle (% mean). (H) Catwalk Hindpaw stand mean (s). (I) Support three paws (%), indicating increased weight bearing. Data show mean ± SEM normalized to vehicle+vehicle-treated mice (as explained in Supplementary file 1 only a subset of animals reached sufficient stepping parameters in this experiment to perform on CatWalk N = 3–5 mice per group as shown by individual points in graphs). Statistical analysis using Student’s t-test for comparison between vehicle + hNSC treated mice and C1qNAb + hNSC treated mice as indicated.
Figure 8—figure supplement 1
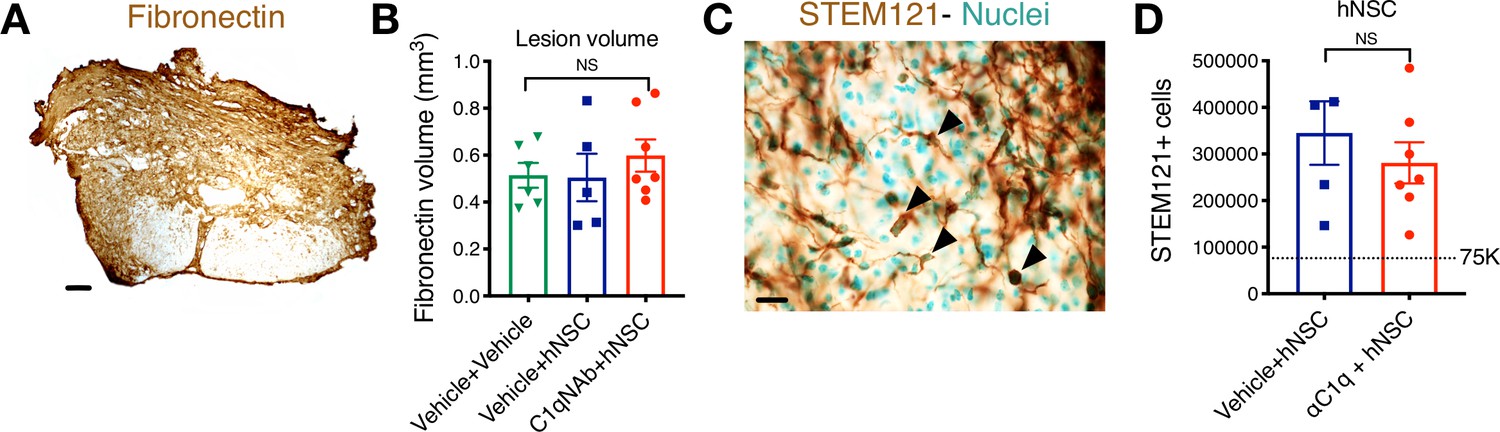
C1q epicenter blockade does not alter lesion volume or hNSC engraftment after transplantation.
Histological analysis at 12 WPT. (A) Representative image of transverse spinal cord section immunostained for fibronectin at the SCI epicenter (brown; scale bar = 150 μm). (B) Quantification of host lesion volume by unbiased stereology using the Cavalieri probe in SCI mice that received vehicle + vehicle (green triangles), vehicle + hNSC (blue squares), or C1qNAb + hNSC (red circles). Mean ± SEM (N = 5–7). Comparisons between groups were conducted using one-way ANOVA (NS, p=0.6073). (C) Immunohistochemistry for the human-specific cytoplasmic marker STEM121 (brown; scale bar = 25 μm). Sections were counterstained for nuclei using methyl green; arrowheads indicate SC121+ cells with methyl green+ nuclei as quantified. (D) Quantification of the total number of hNSC by unbiased stereology using the optical fractionator probe in mice that received vehicle + hNSC (blue squares) vs. C1qNAb (red circles). Comparisons between groups were conducted using Student’s t-test (NS, p=0.4276).
Author response image 1
Tables
Key resources table
| Reagent type (species) or resource | Designation | Source or reference | Identifiers | Additional information |
|---|---|---|---|---|
| Strain, strain background | Rag1 mice | JAXmice | 002216 - B6.129S7-Rag1 < tm1Mom>/J | |
| Strain, strain background | NODSCID mice | JAXmice | 001303 - NOD.Cg-Prkdc<scid > /J | |
| Cell line | Multipotent human CNS-derived stem cells | Uchida et al., 2000 | Stem cells inc 2491.2 | Human Neural stem cells |
| Cell line | Human Neural stem cells | This paper and Piltti et al., in preparation | UCI161.1 | Human Neural stem cells (UCI) correspondence to aja@uci.edu |
| Transfected construct | Chimeric gRNA +hspCAS9 co-expression Vector | https://www.appliedstemcell.com/ | Custom made | Guide RNA sequences in Figure 5—figure supplement 1 |
| Antibody | Anti-STEM121 (mouse monoclonal) | TAKARA | Cat# Y40410 RRID:AB_2801314 | IF(1:3000) |
| Antibody | Anti-STEM123 (mouse monoclonal) | TAKARA | Cat# Y40420 Antibody ID:AB_2833249 | IF(1:3000) |
| Antibody | Fibronectin (rabbit) | Sigma Aldrich | Cat# F3648 RRID:AB_476976 | IF(1:500) |
| Antibody | Anti-C1q (mouse monoclonal) | Abcam | Cat#: ab71940 RRID:AB_10711046 | WB (1:200) Far-WB (1:50) PLA (1:100) |
| Antibody | Anti-pERK (rabbit) | Cell Signaling | Cat#: 4370 RRID:AB_10693765 | WB (1:1000) |
| Antibody | Anti-pAkt (rabbit) | Cell Signaling | Cat#: 9916 RRID:AB_10693765 | WB (1:1000) |
| Antibody | Anti-CD44 (rabbit monoclonal) | Abcam | Cat#: ab51037 RRID:AB_868936 | WB (1:1000) ICC (1:500) PLA (1:500) |
| Antibody | Anti-CD44 (rabbit) | Abcam | Cat#: ab189524 | ICC (1:500) |
| Antibody | Anti-c-MET (rabbit monoclonal) | Abcam | Cat#: ab51067 RRID:AB_880695 | PLA (1:500) |
| Antibody | Anti-BAI-1 (rabbit polyclonal) | Abcam | Cat#: ab135907 | PLA (1:500) |
| Antibody | Anti-GPR62 (rabbit polyclonal) | Thermo Fisher | Cat#: PA5-33745 RRID:AB_2551116 | PLA (1:500) |
| Antibody | Anti-ADCY5 (rabbit polyclonal) | Abcam | Cat#: ab66037 RRID:AB_1140781 | PLA (1:500) |
| Antibody | Anti-Olig2 (rabbit polyclonal) | Abcam | Cat#: ab136253 RRID:AB_2810961 | ICC (1:1000) |
| Antibody | Tubulin βIII (mouse monoclonal) | Biolegend | Cat#: MMS-435P RRID:AB_2313773 | ICC (1:500) |
| Antibody | GFAP (rabbit polyclonal) | Dako | Cat#: Z 0334 RRID:AB_10013382 | ICC (1:1000) |
| Antibody | Anti CD44 -PE | Miltenyi | Cat#:130-110-293 RRID:AB_2658165 | FACS (1:11) |
| Antibody | Anti CD133-FITC | Miltenyi | Cat#:130-113-673 RRID:AB_2726215 | FACS (1:11) |
| Antibody | Anti-C1qNAb (Goat-anti human) | Quidel | Cat#:A031 | C1q neutralization in vivo [100 µg/mL] 2 µL injection |
| Sequence-based reagent | Primers different mRNAs | This paper | NA | Figure 5—figure supplement 1 |
| Peptide, recombinant protein | Purified human C1q | My Biosource | Cat. #: MBS143105 | [0.1nM = 28 ng/mL] [1nM = 400 ng/mL] [200nM = 80µg/mL] |
| Chemical compound, drug | PD98059 (pERK MAPK inhibitor) | GIBCO Life Technologies | Cat. #: PHZ1164 | 10 µM dissolved in DMSO |
| Chemical compound, drug | SB203580 (p38 MAPK inhibitor) | GIBCO Life Technologies | Cat. #: PHZ1253 | 10 µM dissolved in DMSO |
| Chemical compound, drug | Pertussis Toxin (GPCR inhibitor) | GIBCO Life Technologies | Cat. #: PHZ1174 | 10 µg/mL |
| Chemical compound, drug | DMSO | Sigma-Aldrich | Cat. #: D26650 | 1:1000 |
| Chemical compound, drug | PathScan Intracellular signaling array kit | Cell Signaling | Cat. #7744 | Phosphoarray Cell signalling |
| Chemical compound, drug | Pierce Pull-Down biotinylated protein-protein interaction kit; | Thermo | Cat. #21115 | Protein pulldown |
| Chemical compound, drug | RNeasy Mini Kit | Qiagen | Cat No./ID: 74104 | RNA extraction |
| Chemical compound, drug | DNA-free DNase I (Ambion) | Thermo Fisher | Cat. # AM2224 | DNA elimination |
| Chemical compound, drug | High Capacity cDNA Reverse Transcription Kit | ABI Life Technologies | Cat. # 4368814 | Retrotranscription |
| Chemical compound, drug | Duolink in situ Red starter kit Mouse/Rabbit | Sigma | Cat. # DUO92101 | Proximity Ligation Assay (PLA) |
| Chemical compound, drug | QCM Chemotaxis Cell Migration Assay, 96-well | Millipore/ Chemicon | Cat. # ECM510 | Cell migration |
| Software, algorithm | SnapGene | SnapGene | RRID:SCR_015052 | Sequencing |
| Software, algorithm | StereoInvestigator | Microbrightfield | Stereology analysis | |
| Software, algorithm | ImageJ | ImageJ | RRID:SCR_003070 | WB data analysis |
| Software, algorithm | Prism8 | Graphpad | RRID:SCR_002798 | Statistics and graphs |
| Other | Hoechst 33342 | Invitrogen Thermo | H3569 | 1:1000 |
Additional files
-
Supplementary file 1
Number of animals per group for in vivo studies.
- https://cdn.elifesciences.org/articles/55732/elife-55732-supp1-v1.docx
-
Supplementary file 2
List of antibodies and concentrations used for immunodetection.
- https://cdn.elifesciences.org/articles/55732/elife-55732-supp2-v1.docx
-
Supplementary file 3
List of conditions used in vitro for migration, proliferation, fate, and signaling assay.
- https://cdn.elifesciences.org/articles/55732/elife-55732-supp3-v1.docx
-
Supplementary file 4
List of primers used in this manuscript.
- https://cdn.elifesciences.org/articles/55732/elife-55732-supp4-v1.docx
-
Transparent reporting form
- https://cdn.elifesciences.org/articles/55732/elife-55732-transrepform-v1.docx
Download links
A two-part list of links to download the article, or parts of the article, in various formats.
Downloads (link to download the article as PDF)
Open citations (links to open the citations from this article in various online reference manager services)
Cite this article (links to download the citations from this article in formats compatible with various reference manager tools)
Novel C1q receptor-mediated signaling controls neural stem cell behavior and neurorepair
eLife 9:e55732.
https://doi.org/10.7554/eLife.55732


