An improved zebrafish transcriptome annotation for sensitive and comprehensive detection of cell type-specific genes
- Department of Molecular, Cell and Cancer Biology, University of Massachusetts Medical School, United States
- Bioinformatics Core, University of Massachusetts Medical School, United States
- Department of Physiology, Anatomy and Genetics, University of Oxford, United Kingdom
- Program in Molecular Medicine, University of Massachusetts Medical School, United States
- Program in Bioinformatics and Integrative Biology, University of Massachusetts Medical School, United States
Figures
Figure 1 with 1 supplement
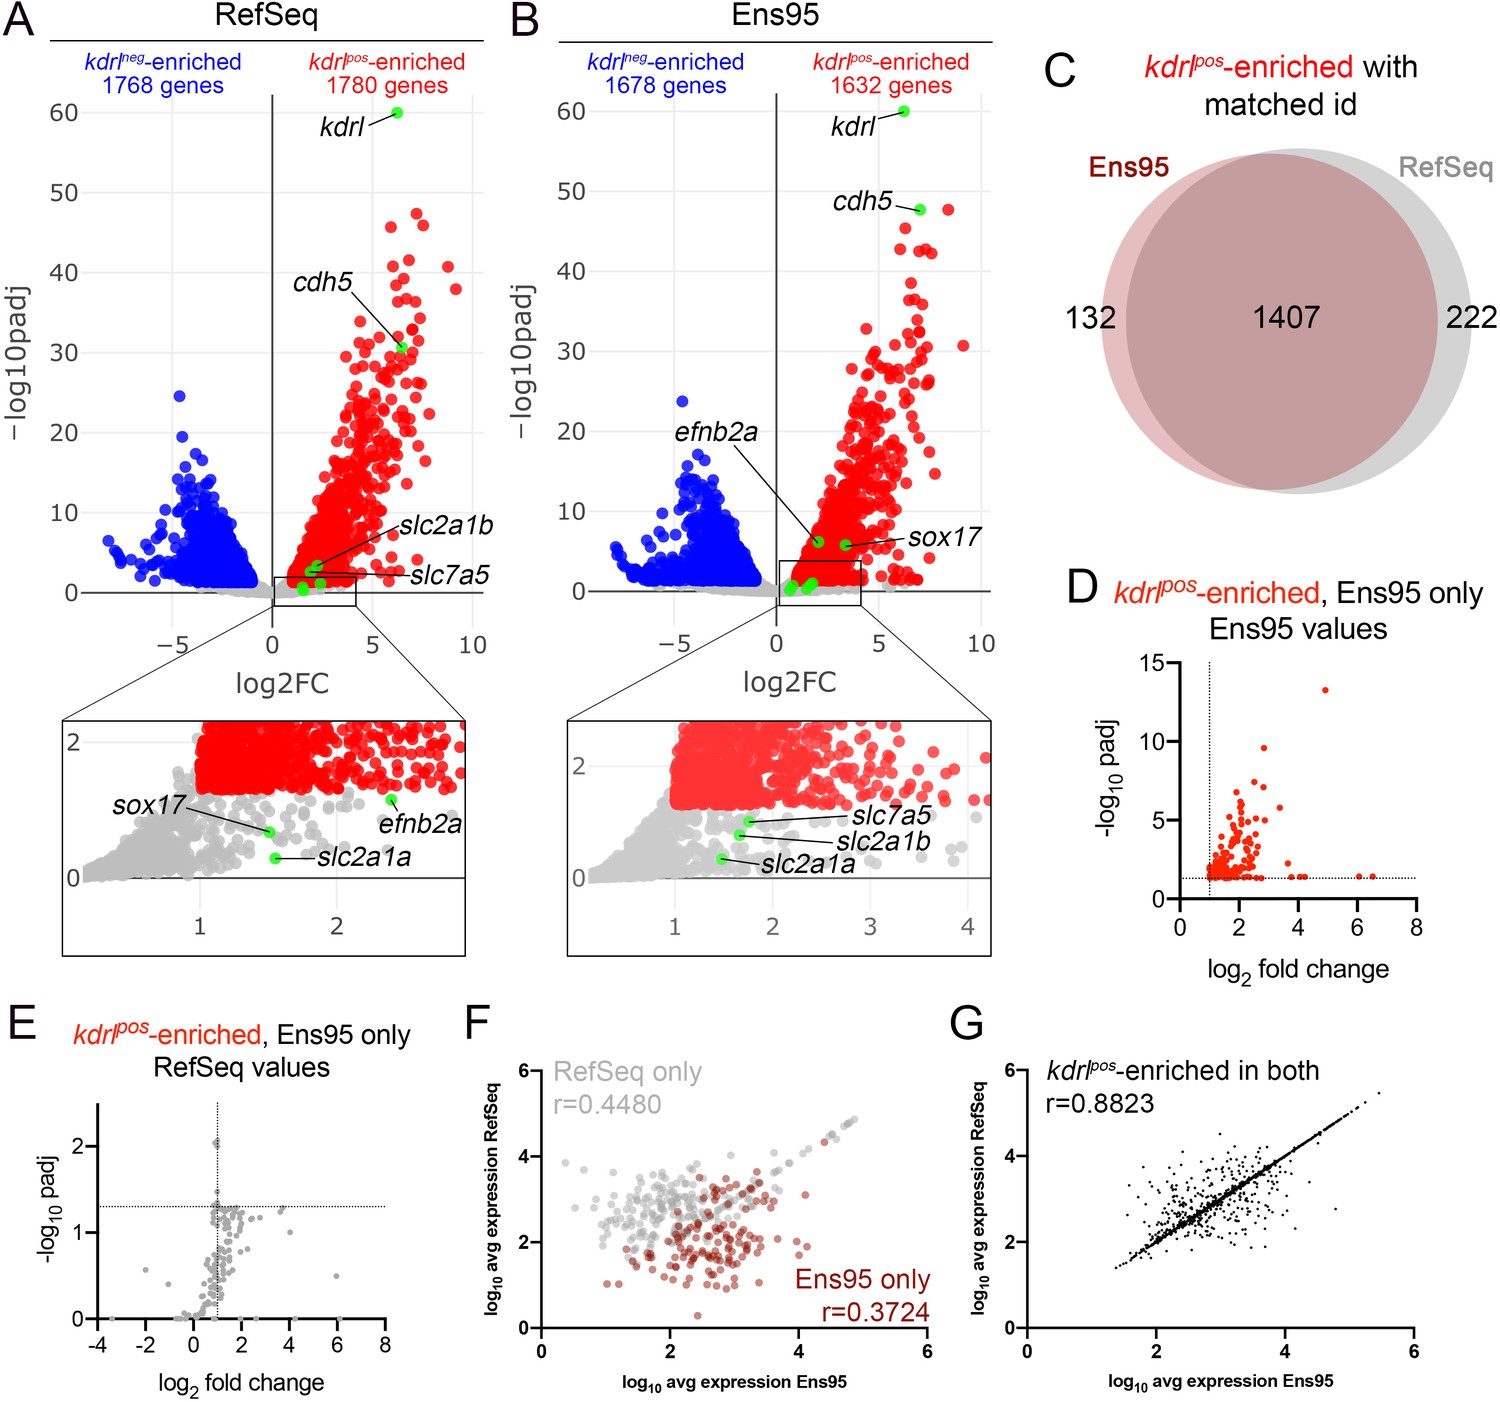
Comparison of Ensembl and RefSeq zebrafish transcriptome annotations for bulk RNA-seq analysis.
(A, B) Volcano plots showing differentially expressed genes from Tg(kdrl:HRAS-mCherry)s896-positive and negative (kdrlpos and kdrlneg) cells identified using RNA-seq reads quantified with (A) RefSeq or (B) Ensembl, version 95 (Ens95) transcript annotations. Genes with significant enrichment (padj <0.05) are shown as red or blue (log2 fold change >1 or <-1, respectively) across replicate samples (n = 3). Grey dots are genes that fall below statistical cutoffs. Green dots indicate selected genes previously found to be enriched in endothelial cells in zebrafish or other models. (C) Venn diagram illustrating the intersection of genes with a common NCBI ID in Ens95 and RefSeq found significantly enriched in kdrlpos cells using either annotation. (D, E) Plots of commonly annotated genes identified as kdrlpos-enriched only by Ens95 with indicated values from (D) Ens95 or (E) RefSeq. (F, G) Correlation of expression levels from indicated annotation for kdrlpos-enriched genes identified (F) selectively as such by Ens95 (maroon) or RefSeq (grey) only, or (G) both annotations. Data are not normally distributed, Spearman correlation, r values are indicated.
-
Figure 1—source data 1
DESeq2 output for kdrlpos and kdrlneg RNA-seq quantified with RefSeq (GCF_000002035.6_GRCz11; worksheet 1) or Ensembl, v95 (worksheet 2).
Gene expression levels were quantified using RSEM. Median ratio normalized expression values are shown for each replicate, along with adjusted p-value, and log2 fold change. Data used to generate plots in Figure 1A,B, and incorporated into source data tables indicated below.
- https://cdn.elifesciences.org/articles/55792/elife-55792-fig1-data1-v2.xlsx
-
Figure 1—source data 2
Intersection of kdrlpos-enriched genes from RefSeq and Ens95 commonly annotated by NCBI ID.
Gene symbol, along with matching Ensembl gene ID and NCBI ID, as well as differential annotation (i.e., identified as differentially expressed only in RefSeq, Ens95, or both) are indicated. Expression data are derived from Figure 1—source data 1. Data used to generate plots in Figure 1C–G.
- https://cdn.elifesciences.org/articles/55792/elife-55792-fig1-data2-v2.xlsx
Figure 1—figure supplement 1
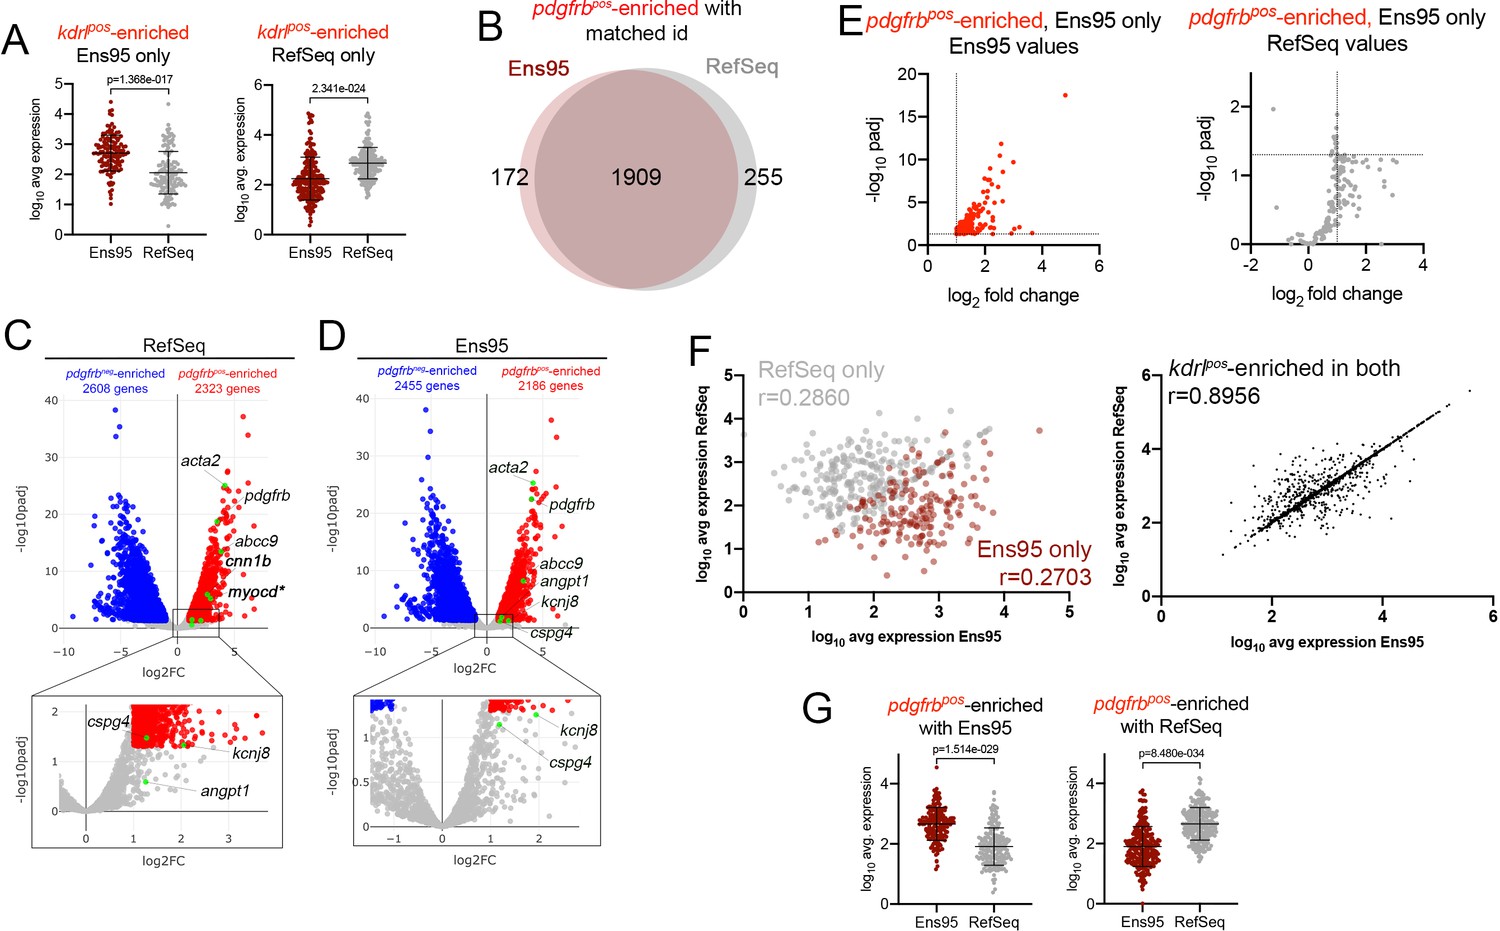
Comparison of Ens95 and RefSeq zebrafish transcriptome annotations for bulk RNA-seq analysis.
(A) Log10 average expression (n = 3) for kdrlpos-enriched genes as quantified by each indicated annotation. Each separate plot shows genes identified as kdrlpos-enriched only using or Ens95 or RefSeq. Data are not normally distributed, Wilcoxon matched-pairs signed-rank test, p values are indicated. (B) Venn diagram of intersection for genes with a common NCBI ID in Ens95 and RefSeq found significantly enriched in pdgfrbpos cells (log2 fold change [pdgfrbpos/pdgfrbneg]>1,adjp <0.05) using each annotation. (C, D) Volcano plots showing differentially expressed genes from TgBAC(pdgfrb:citrine)s1010-positive and negative cells identified using RNA-seq reads quantified using (C) RefSeq or (D) Ens95 annotations. Genes with significant differences (padj <0.05) are shown as red (log2 fold change >1) or blue (log2 fold change<-1). Grey dots are genes that fall below these statistical cutoffs; n = 3. Green dots indicate selected genes previously identified as expressed in vascular smooth muscle cells or pericytes (see main text). (E) Plots of commonly annotated genes identified as pdgfrbpos-enriched only by Ens95 with indicated values from Ens95 or RefSeq. (F) Correlation of expression levels from indicated annotation for pdgfrbpos-enriched genes identified selectively as such by Ens95 (maroon) or RefSeq (grey) only (left plot) or in both annotations (right plot). Data are not normally distributed, Spearman correlation, r values are indicated. (G) Log10 average expression (n = 3) for pdgfrbpos-enriched genes as quantified by each indicated annotation. Each separate plot shows genes only identified as pdgfrbpos-enriched using Ens95 or RefSeq. Data are not normally distributed, Wilcoxon matched-pairs signed-rank test, p values are indicated.
-
Figure 1—figure supplement 1—source data 1
DESeq2 output for pdgfrbpos and pdgfrbneg RNA-seq quantified with RefSeq (GCF_000002035.6_GRCz11) or Ensembl, v95.
Gene expression levels were quantified using RSEM. Median ratio normalized expression values are shown for each replicate, along with adjusted p-value, and log2 fold change. Data used to generate plots in Figure 1—figure supplement 1C–E, and incorporated into source data tables indicated below.
- https://cdn.elifesciences.org/articles/55792/elife-55792-fig1-figsupp1-data1-v2.xlsx
-
Figure 1—figure supplement 1—source data 2
Intersection of pdgfrbpos-enriched genes from RefSeq and Ens95 commonly annotated by NCBI ID.
Gene symbol, along with matching Ensembl gene ID and NCBI ID, as well as differential annotation (i.e., identified as differentially expressed only in RefSeq, Ens95, or both) are indicated. Expression data are derived from Figure 1—source data 1. Data used to generate plots in Figure 1—figure supplement 1B,F–H.
- https://cdn.elifesciences.org/articles/55792/elife-55792-fig1-figsupp1-data2-v2.xlsx
Figure 2 with 2 supplements
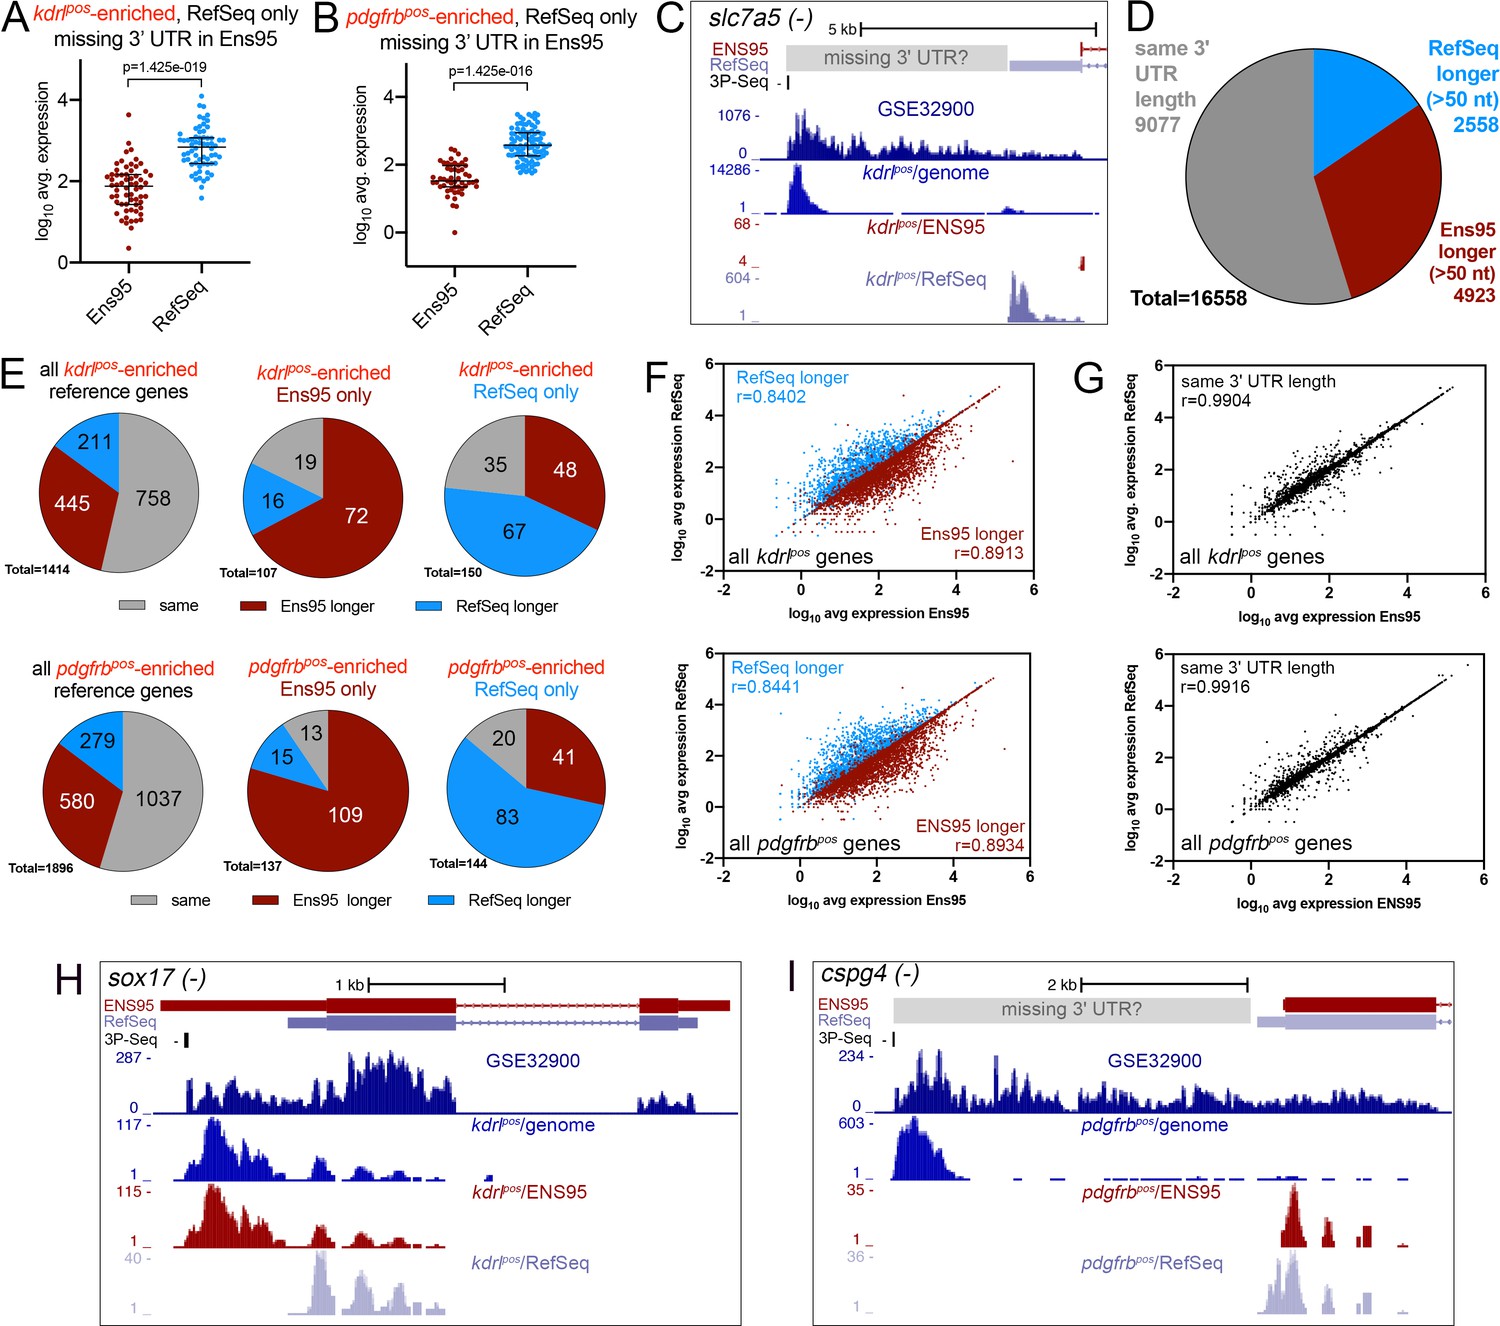
Incomplete 3' UTRs annotations contribute to discrepancies in RNA-seq analysis.
(A, B) Log10 average expression as quantified using indicated annotation for (A) kdrlpos- or (B) pdgfrbpos-enriched genes identified as such only in RefSeq and lacking an Ens95 3' UTR annotation. Expression levels for genes from each annotation with matched NCBI ID are shown in each case. Data are normally distributed (Shapiro-Wilks test), paired t-test, p values are indicated; n = 3 (i.e. each point represents an average value from three separate RNA-seq replicates). (C) UCSC browser image of slc7a5 locus on the minus strand showing 3' UTR annotations from Ens95 and RefSeq. Mapped read depth from kdrlpos cells on the genome, or assigned to each annotation are indicated, as is a 3P-seq feature. The GSE32900 track is consolidated RNA-seq reads from all stages indicated in Figure 3A. The location of a putative missing 3' UTR is indicated. (D) Pie chart showing numbers of reference genes with the same or longer 3' UTRs in each indicated annotation. (E) Pie charts showing the proportion of reference genes selectively identified as kdrlpos- or pdgfrbpos-enriched by Ens95 and RefSeq with indicated relative 3' UTR length. (F, G) Correlation plots showing log10 average expression from kdrlpos RNA-seq (n = 3) quantified with each annotation for matched reference genes with (F) longer Ens95 (maroon) or RefSeq (light blue) 3' UTR, or (G) same 3' UTR length. Data are not normally distributed, Spearman correlation, r values are indicated. (H, I) UCSC browser images of (H) sox17 and (I) cspg4 loci, both on the minus strand, showing 3' UTR annotations from Ens95 and RefSeq. Mapped read depth of RNA-seq from (H) kdrlpos or (I) pdgfrbpos cells captured for each annotation is indicated. Consolidated reads from GSE32900 and location of 3P-Seq features are indicated, as is putative missing 3' UTR in cspg4.
-
Figure 2—source data 1
Missing 3' UTR annotations in RefSeq and Ens95.
This file includes lists of Ens95 (worksheet 1) and RefSeq (worksheet 2) genes indicating annotation as coding sequence (CDS) and whether there is an annotated stop codon and 3' UTR. Data from RNA-seq-based quantification for Ens95 genes missing a 3' UTR that is present in RefSeq is included for kdrlpos (worksheet 3), pdgfrbpos (worksheet 4), and Nr2f2pos (worksheet 5) cells. These data were used to generate Table 2 and graphs in Figure 2A,B; Figure 2—figure supplement 2I.
- https://cdn.elifesciences.org/articles/55792/elife-55792-fig2-data1-v2.xlsx
-
Figure 2—source data 2
Reference gene set for 3' UTR comparisons.
IDs for representative Ens95, RefSeq, and V4.3 transcript ID, along with V4.3 gene symbols are shown with respective 3' UTR lengths (worksheet 1). Average median ratio normalized expression and log2 fold change (pos/neg) values quantified with Ens95, RefSeq, and V4.3 annotations from kdrlpos (worksheet 2), pdgfrbpos (worksheet 3), and Nr2f2pos (worksheet 4) RNA-seq for reference genes are included. Data directly used to generate Figure 2D–G, Figure 2—figure supplement 2C–H, Figure 3B–J and incorporated into source data as indicated below.
- https://cdn.elifesciences.org/articles/55792/elife-55792-fig2-data2-v2.xlsx
-
Figure 2—source data 3
RNA-seq analysis of Nr2f2pos and NR2f2neg cells.
Output from DESeq2 analysis comparing Nr2f2pos and Nr2f2neg RNA-seq from gene expression levels quantified using RSEM with Ens95 (worksheet 1) or RefSeq (worksheet 2). Median ratio normalized expression values are shown for each sample, along with adjusted p-value, p-value, log2 fold change, fold change, and log10 adjusted p-value. Intersection of genesets identified as significantly enriched in Nr2f2pos cells using Ens95 or RefSeq (worksheet 3).
- https://cdn.elifesciences.org/articles/55792/elife-55792-fig2-data3-v2.xlsx
-
Figure 2—source data 4
Transcript based-comparison of RefSeq and Ensembl annotations.
Worksheet one is a list of Ens95 genes missing from RefSeq with Ensembl gene ID, matching ZFIN ID and biotype annotation. Worksheet two is a list of RefSeq genes missing from Ensembl with NCBI gene ID, matching ZFIN ID, and coding sequence annotation. Transcript level matching output from gffcompare is included using Ens95 (worksheet 3) or RefSeq (worksheet 4) as a reference. Worksheet five is a transcript level comparison of Ens95 and Ens99. In this case, all transcripts exhibit a complete intron/exon chain match (designated by a ‘=" in class code). Data used to generate Table 3.
- https://cdn.elifesciences.org/articles/55792/elife-55792-fig2-data4-v2.xlsx
Figure 2—figure supplement 1
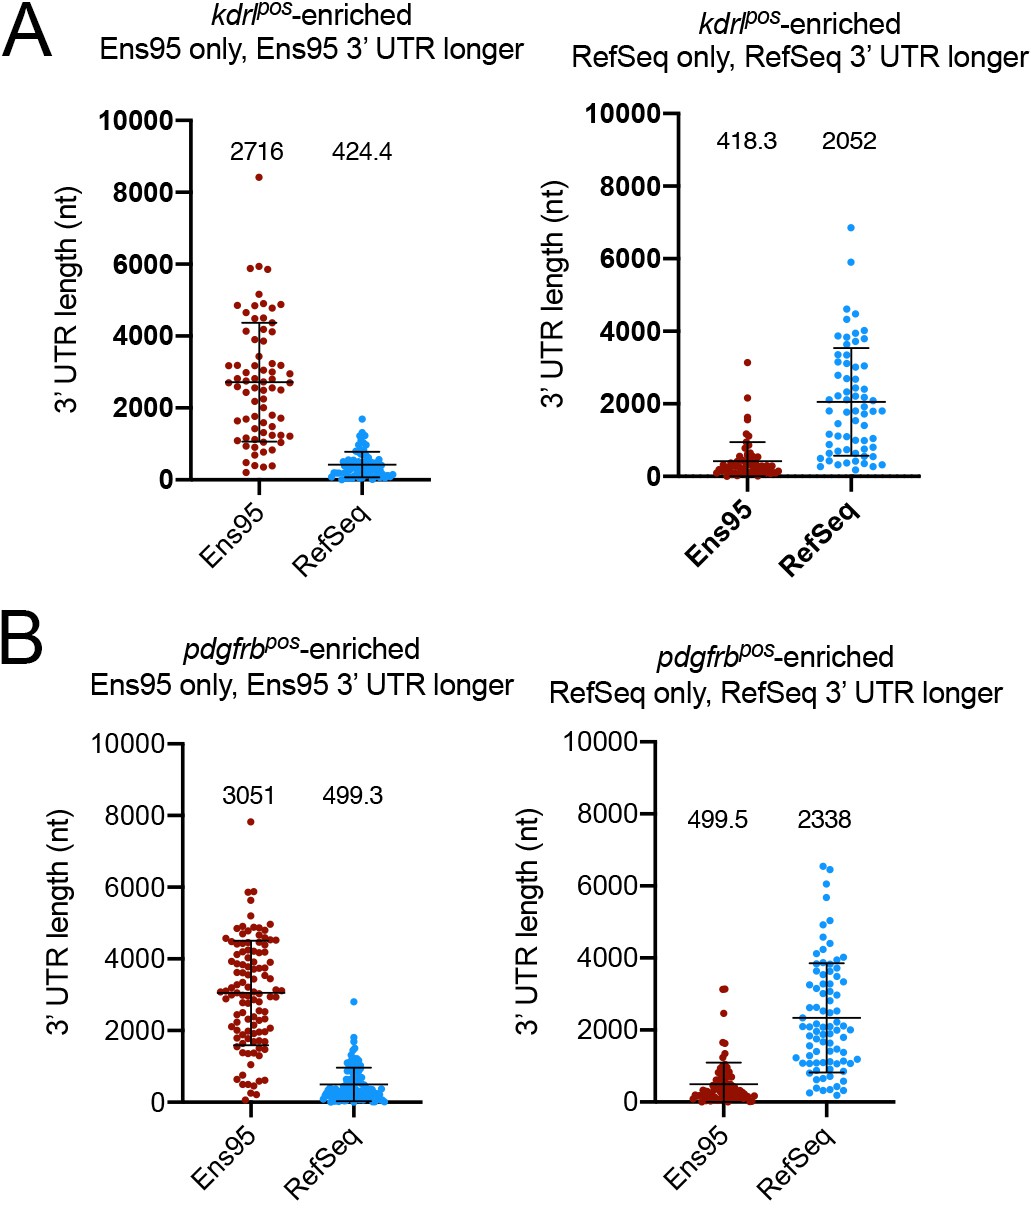
Differences in 3' UTR lengths between Ens95 and RefSeq for discrepant kdrlpos- and pdgfrbpos-enriched genes.
(A, B) Plots showing 3' UTR length from matched reference genes from indicated annotation identified as enriched only in Ens95 or RefSeq. Mean 3' UTR length for each group is shown, error bars denote mean and standard deviation. No statistical comparison is presented since these data are already defined as longer (>50 nt) in indicated annotation. (A) kdrlpos-enriched genes. (B) pdgfrbpos-enriched genes.
Figure 2—figure supplement 2
Analysis of RNA-seq reads from a random-primed library.
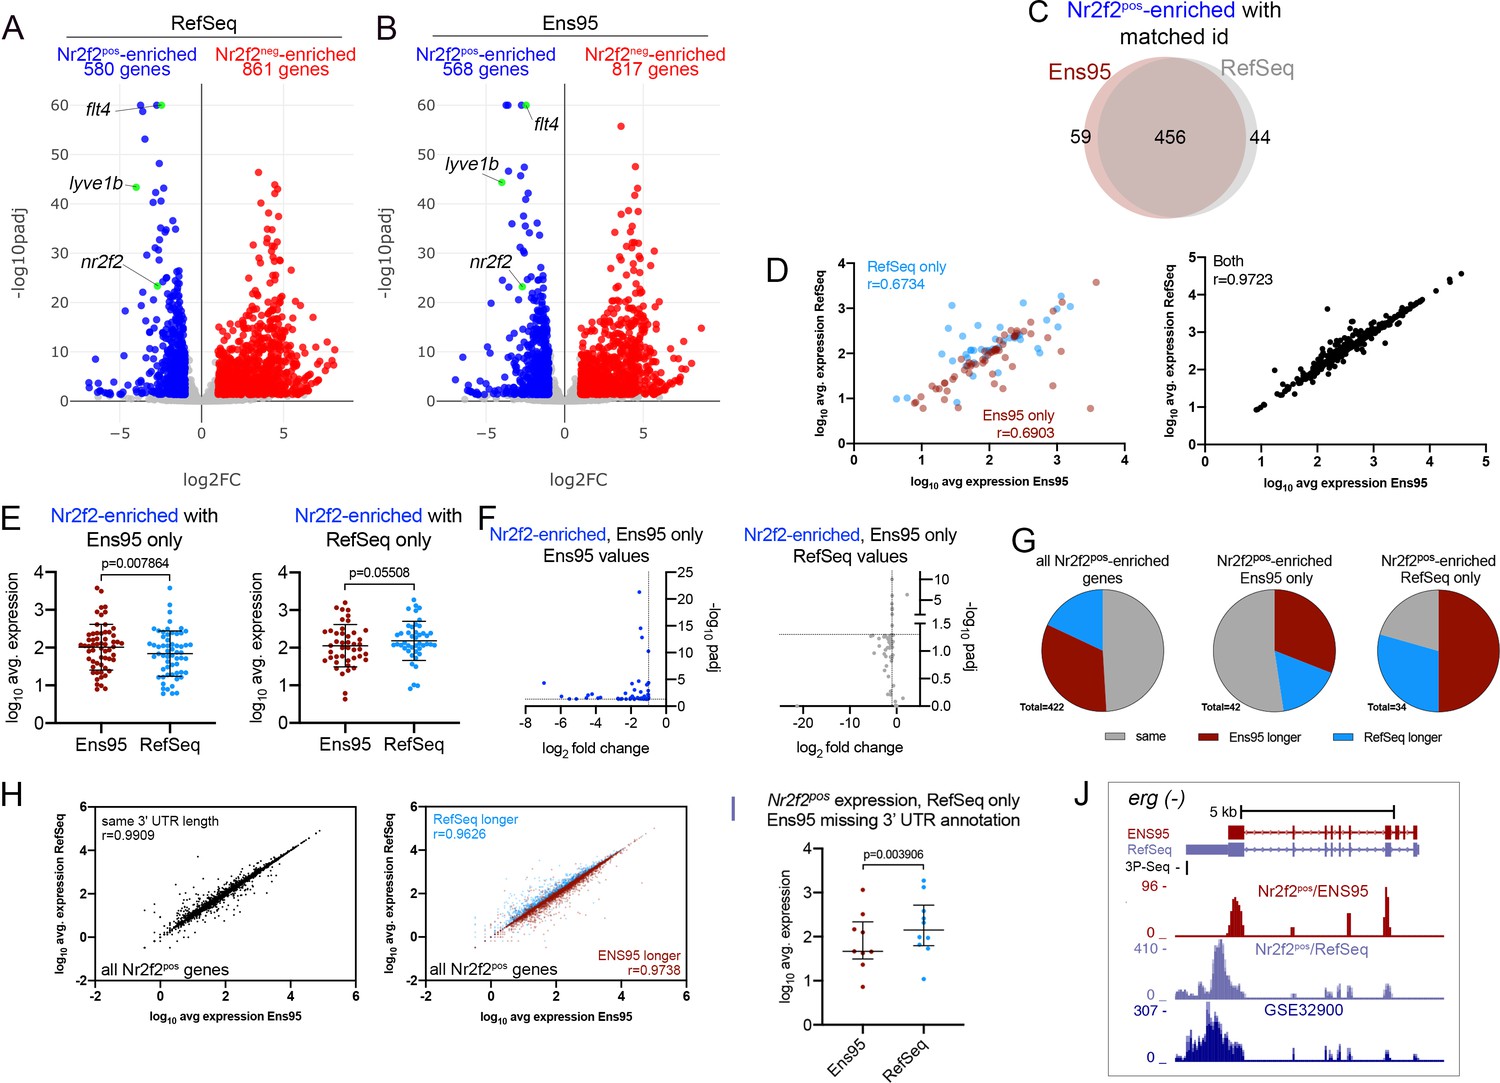
(A,B) Volcano plots of differentially expressed genes from Nr2f2-positive and -negative (Nr2f2pos and Nr2f2neg) endothelial cells identified using RNA-seq reads quantified with (A) RefSeq or (B) Ensembl, version 95 (Ens95) transcript annotations. Genes with significant enrichment (padj <0.05) are shown as red or blue (log2 fold change >1 or <-1, respectively). Grey dots are genes that fall below statistical cutoffs. (A, B) Green dots are selected known vein-specific genes. (C) Venn diagram of genes with a common NCBI ID in Ens95 and RefSeq identified as significantly Nr2f2pos-enriched using either annotation. (D) Correlation of log10 average expression levels (n = 3) from indicated annotation for Nr2f2pos-enriched genes identified selectively as such by Ens95 or RefSeq only (left plot) or both annotations (right plot). Data are not normally distributed, Spearman correlation, r values are indicated. (E) Log10 average expression (n = 3) for Nr2f2pos-enriched genes as quantified by each indicated annotation. Separate plots shown for genes selectively identified as Nr2f2pos-enriched using Ens95 or RefSeq. Data are not normally distributed, Wilcoxon matched-pairs signed-rank test, p values are indicated. (F) Plots of commonly annotated genes identified as Nr2f2pos-enriched only by Ens95 with indicated values from Ens95 (left plot) or RefSeq (right plot). (G) Pie charts showing the proportion of reference genes identified as Nr2f2pos-enriched by Ens95 and RefSeq with indicated relative 3' UTR length. (H) Correlation of log10 average expression from Nr2f2pos RNA-seq (n = 3) quantified with each annotation for matched reference genes with same 3' UTR length or longer Ens95 or RefSeq 3' UTR length. Data are not normally distributed, Spearman correlation, r values are indicated. (I) Log10 average expression (n = 3) as quantified by Ens95 or RefSeq for Nr2f2pos-enriched genes lacking an Ens95 3' UTR annotation. Data are not normally distributed, Wilcoxon matched-pairs signed-rank test, p value is indicated. (J) UCSC browser image of the erg gene (on minus strand) showing 3' UTR annotation and lack thereof from RefSeq and Ens95, respectively. Mapped depth of RNA-seq reads from Nr2f2pos cells captured for each annotation is indicated. Genome-mapped consolidated reads from GSE32900 are also shown as is the location of 3P-seq feature, also on the minus strand.
Figure 3 with 3 supplements
The V4.2 annotation improves detection of cell-type-specific genes from bulk RNA-seq data.
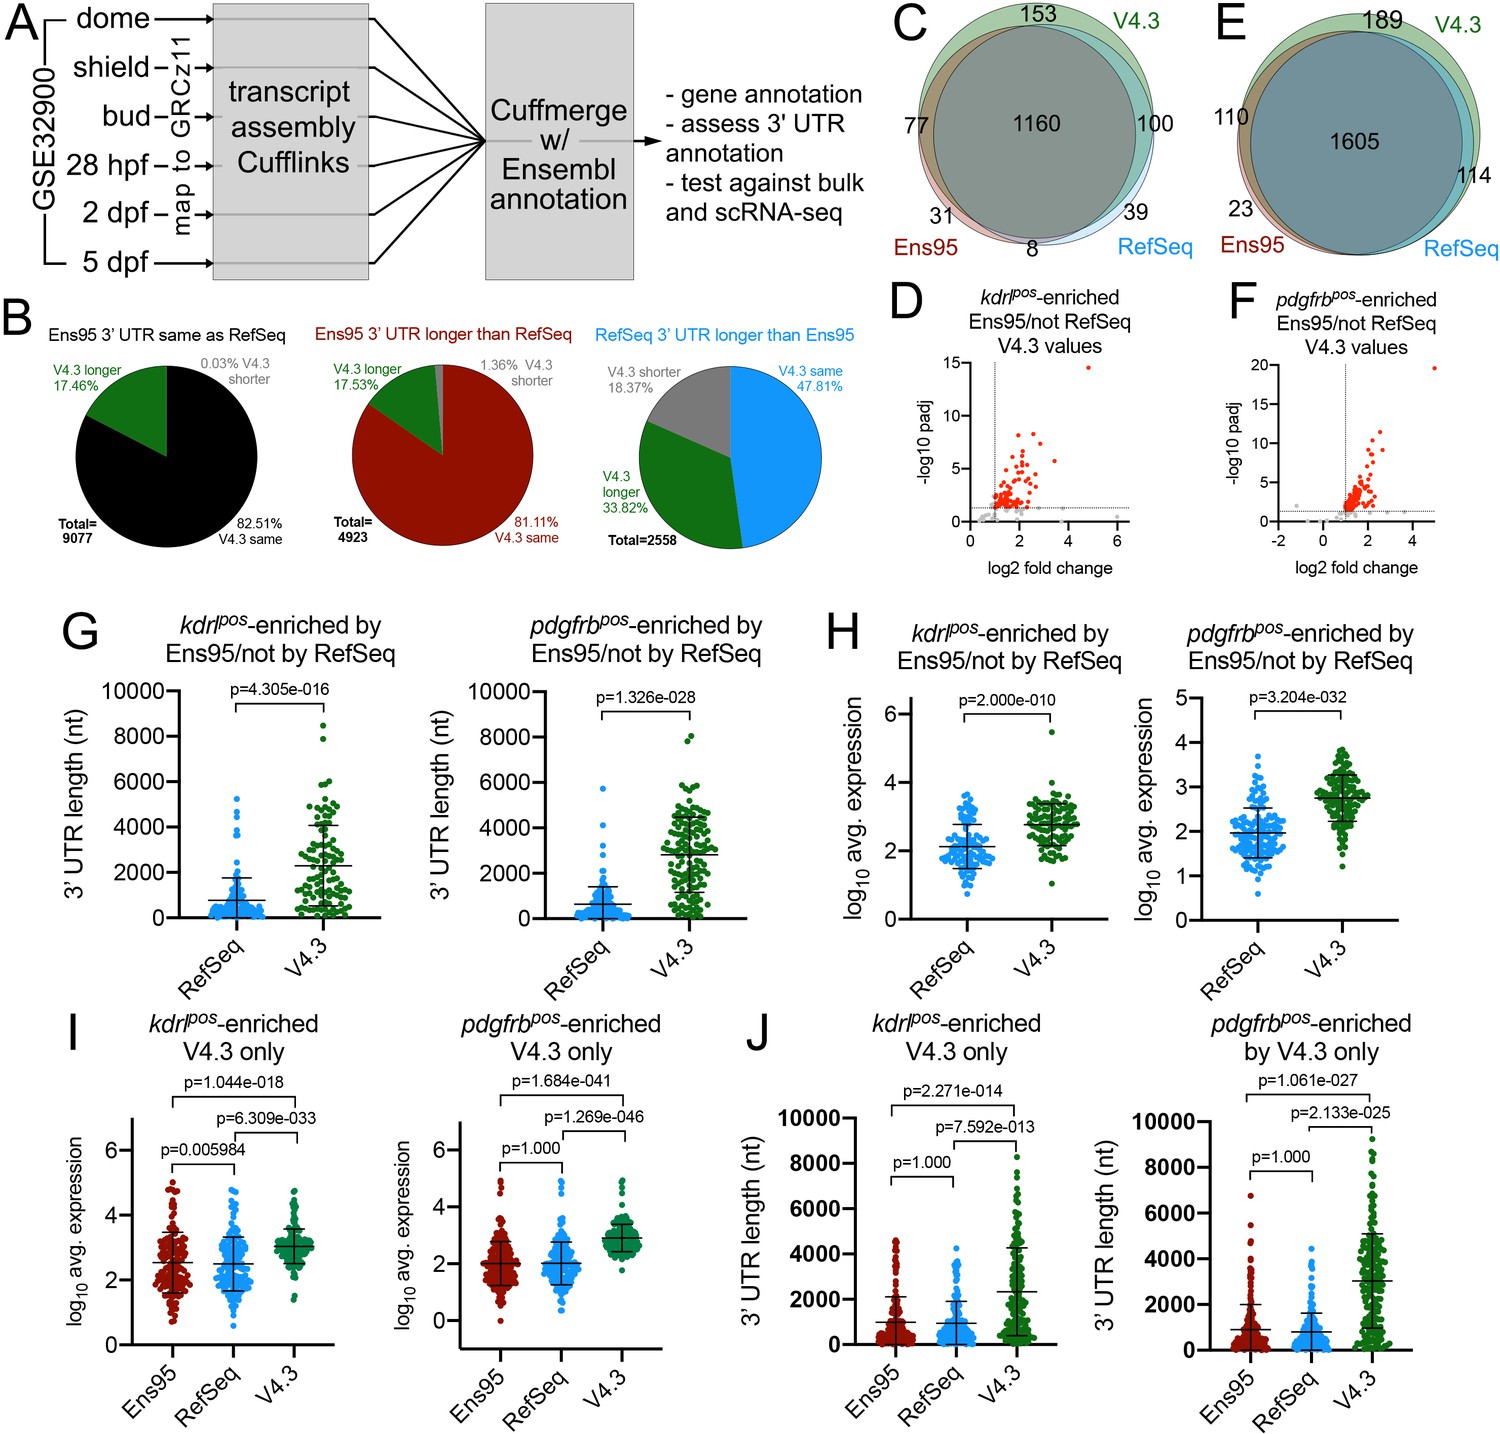
(A) Schematic outline for generating a new zebrafish transcriptome annotation. See Results and Materials and methods sections for details. (B) Pie charts showing the proportion of reference genes with same, longer or shorter 3' UTR in the V4.3 annotation compared to relative 3' UTR length between Ens95 and RefSeq. (C, E) Venn diagrams showing intersection of reference genes with commonly annotated NCBI ID that are significantly enriched in (C) kdrlpos- or (E) pdgfrbpos-cells in each indicated annotation. (D, F) Volcano plots of reference genes with common NCBI ID identified as (D) kdrlpos- or (F) pdgfrbpos-enriched only by Ens95 in comparison to RefSeq. Indicated values are from the same genes quantified using V4.3. Red dots indicate log2 fold change >1 and adjp <0.05. (G) 3' UTR lengths and (H) log10 average expression (n = 3) using RefSeq and V4.3 for reference genes in the indicated dataset. (G, H) Data are not normally distributed, Wilcoxon matched-pairs signed-rank test, p values are indicated. Error bars denote mean and standard deviation. (I) Log10 average expression (n = 3) and (J) 3' UTR lengths across all annotations for reference genes uniquely identified as enriched in indicated transgene-positive cell type using V4.3 (log2 fold change >1, padj <0.05). Data are not normally distributed. Friedman test to assess variance (p<0.0001 in all cases). Dunn's multiple comparison test was used for pairwise comparisons, p values are indicated. Error bars denote mean and standard deviation.
-
Figure 3—source data 1
List of SRA accession numbers, stages, and read numbers from GSE32900 for associated RNA-seq datasets used in this study.
- https://cdn.elifesciences.org/articles/55792/elife-55792-fig3-data1-v2.xlsx
-
Figure 3—source data 2
List of manually-identified discrepancies in Ensembl gene annotation due to spurious fusionor overlapping transcripts.
Table includes Ens95 gene symbol, gene ID, and spurious transcript ID. Persistence of observed discrepancy in Ens99 is indicated, as is previous status of curation in ZFIN. All of these have been reported to ZFIN.
- https://cdn.elifesciences.org/articles/55792/elife-55792-fig3-data2-v2.xlsx
-
Figure 3—source data 3
RefSeq (worksheet 1) and Ens99 (worksheet 2) genes missing from the V4.2 annotation.
- https://cdn.elifesciences.org/articles/55792/elife-55792-fig3-data3-v2.xlsx
-
Figure 3—source data 4
Novel genes from V4.2 genome annotation.
This table includes information regarding blastx hits against zebrafish and human proteins, matches with lincRNAs, number of exons per gene, and whether the novel locus was included in the V4.3 annotation.
- https://cdn.elifesciences.org/articles/55792/elife-55792-fig3-data4-v2.xlsx
-
Figure 3—source data 5
V4.3 gene information table, including unique LL ID numbers, associated Ens99 gene ID, NCBI ID, and ZFIN gene ID numbers, gene symbols, and gene names.
Annotation notes are also included regarding the relative strength of coordinate-based incorporation of NCBI (Entrez) and Ens99 gene identifiers.
- https://cdn.elifesciences.org/articles/55792/elife-55792-fig3-data5-v2.xlsx
-
Figure 3—source data 6
Output from DESeq2 analysis comparing kdrlpos and kdrlneg RNA-seq.
Gene expression levels were quantified using RSEM with the V4.3 annotation. Median ratio normalized expression values are shown for each sample, along with adjusted p-value and log2 fold change. Matching Ensembl and NCBI gene IDs are included.
- https://cdn.elifesciences.org/articles/55792/elife-55792-fig3-data6-v2.xlsx
-
Figure 3—source data 7
Output from DESeq2 analysis comparing pdgfrbpos and pdgfrbneg RNA-seq.
Gene expression levels were quantified using RSEM with the V4.3 annotation. Median ratio normalized expression values are shown for each replicate, along with adjusted p-value and log2 fold change. Matching Ensembl and NCBI gene IDs are included.
- https://cdn.elifesciences.org/articles/55792/elife-55792-fig3-data7-v2.xlsx
-
Figure 3—source data 8
Worksheet 1 - Output from DESeq2 analysis comparing Nr2f2pos and Nr2f2neg RNA-seq.
Gene expression levels were quantified using RSEM with the V4.3 annotation. Median ratio normalized expression values are shown for each replicate, along with adjusted p-value and log2 fold change. Matching Ensembl and NCBI gene IDs are included. Worksheet 2 – Nr2f2pos-enriched genes with matched entries from reference gene set (Figure 2—source data 2) and associated 3' UTR lengths (Figure 2—source data 2).
- https://cdn.elifesciences.org/articles/55792/elife-55792-fig3-data8-v2.xlsx
Figure 3—figure supplement 1
Ensembl naming conflicts and improved transcript diversity in V4.3.
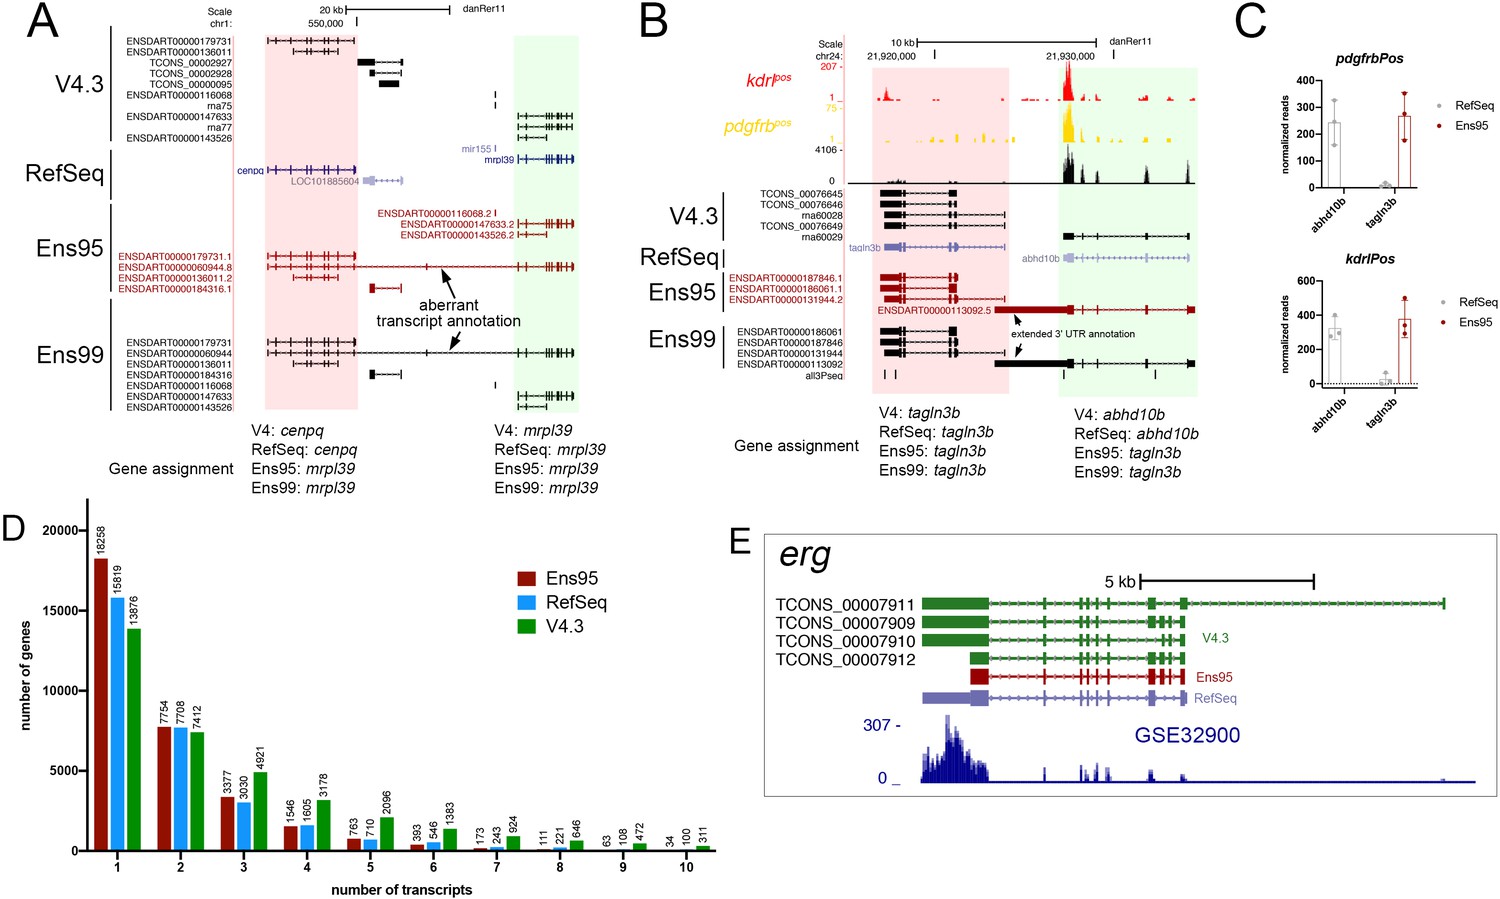
(A, B) Annotated UCSC Genome Browser screenshots of (A) cenpq and mrpl39 loci and (B) talgn3b and abhd10b loci. RefSeq, Ens95, Ens99 and V4.3 transcript annotations are shown. Ensembl-annotated transcripts overlapping adjacent locus and leading to misassignment of gene names are indicated. (C) Apparent detected expression for abhd10b and tagln3b in pdgfrbpos RNA-seq reads (n = 3) using indicated annotation. Error bars denote SEM. The abhd10b transcripts are annotated as belonging to the tagln3b gene in Ensembl95 and 99. This leads to a failure to detect abhd10b when using Ensembl annotations, along with spurious inflation of tagln3b expression levels due to the inclusion of reads that should be mapped to abhd10b. (D) Histogram plot of numbers of transcripts per gene for indicated annotation. The plot is limited to genes with 10 or fewer transcripts. (E) UCSC browser image of the erg locus showing transcripts from indicated annotation and mapped reads from GSE32900.
Figure 3—figure supplement 2

The V4.3 annotation improves the detection of cell-type-specific genes from bulk RNA-seq data.
(A, B) Volcano plots of RNA-seq data from (A) kdrl-positive and negative and (B) pdgfrb-positive and negative cells quantified using V4.3. (A, B) Numbers of differentially expressed genes, along with selected known (A) endothelial or (B) mural cell genes are indicated with green dots. (A, B) Genes with significant differences (padj <0.05) are shown as red (log2 fold change pos/neg > 1) or blue (log2 fold changepos/neg <-1). (C–E) Left panels, UCSC browser images of (C) slc7a5 (minus strand), (D) slc2a1a (plus strand), and (E) cspg4 (minus strand) loci showing 3' UTR annotations from V4.3, ENS95, and RefSeq. Mapped depth of RNA-seq reads from indicated cell type on the genome, or assigned to each annotation are indicated, as are 3P-seq features. (C–E) Right panels, log10 normalized expression of (C) slc7a5, (D) slc2a1a, and (E) cspg4 in replicate RNA-seq samples (n = 3) quantified using indicated annotations. Values are normalized with median ratio normalization. (C, D) Values display normal distribution (Shapiro-Wilks test) and analysis of variance revealed statistical significance (slc2a1a, p=0.0160; slc7a5, p=0.0002). Adjusted p-values from Dunnett's multiple comparison tests are indicated. (E) Values are not normally distributed, variance determined by Friedman test (p=0.0278). p-values from Dunn's multiple comparison test are indicated. Error bars represent mean and standard deviation.
Figure 3—figure supplement 3

Analysis of Nr2f2pos and Nr2f2neg datasets using V4.3.
(A) Volcano plot of RNA-seq data from Nr2f2pos and Nr2f2neg cells quantified using V4.3. Numbers of differentially expressed genes are shown. Selected known venous endothelial genes are indicated with green dots, as is erg, which is not detected as differentially expressed by Ens95. Genes with significant differences (padj <0.05) are red (log2 fold change pos/neg > 1) or blue (Nr2f2pos-enriched, log2 fold change pos/neg <-1). (B) Venn diagram showing intersection of reference genes (using commonly annotated NCBI ID) that are significantly enriched in Nr2f2pos-cells in each indicated annotation. (C) Volcano plot of Nr2f2pos-enriched reference genes identified only by Ens95 in comparison to RefSeq. Indicated values are from the same genes quantified using V4.3. Red dots indicate log2 fold change<-1 and adjp <0.05. (D) 3' UTR lengths and (E) log10 average expression (n = 3) for reference genes in Ens95 and V4.3 for the indicated dataset. (D, E) Data are normally distributed, paired t-test, p values are indicated. Error bars denote mean and standard deviation.
Figure 4 with 2 supplements
The V4.2 annotation increases the number of cells and clusters detected in single cellingle-cell RNA-seq analysis.
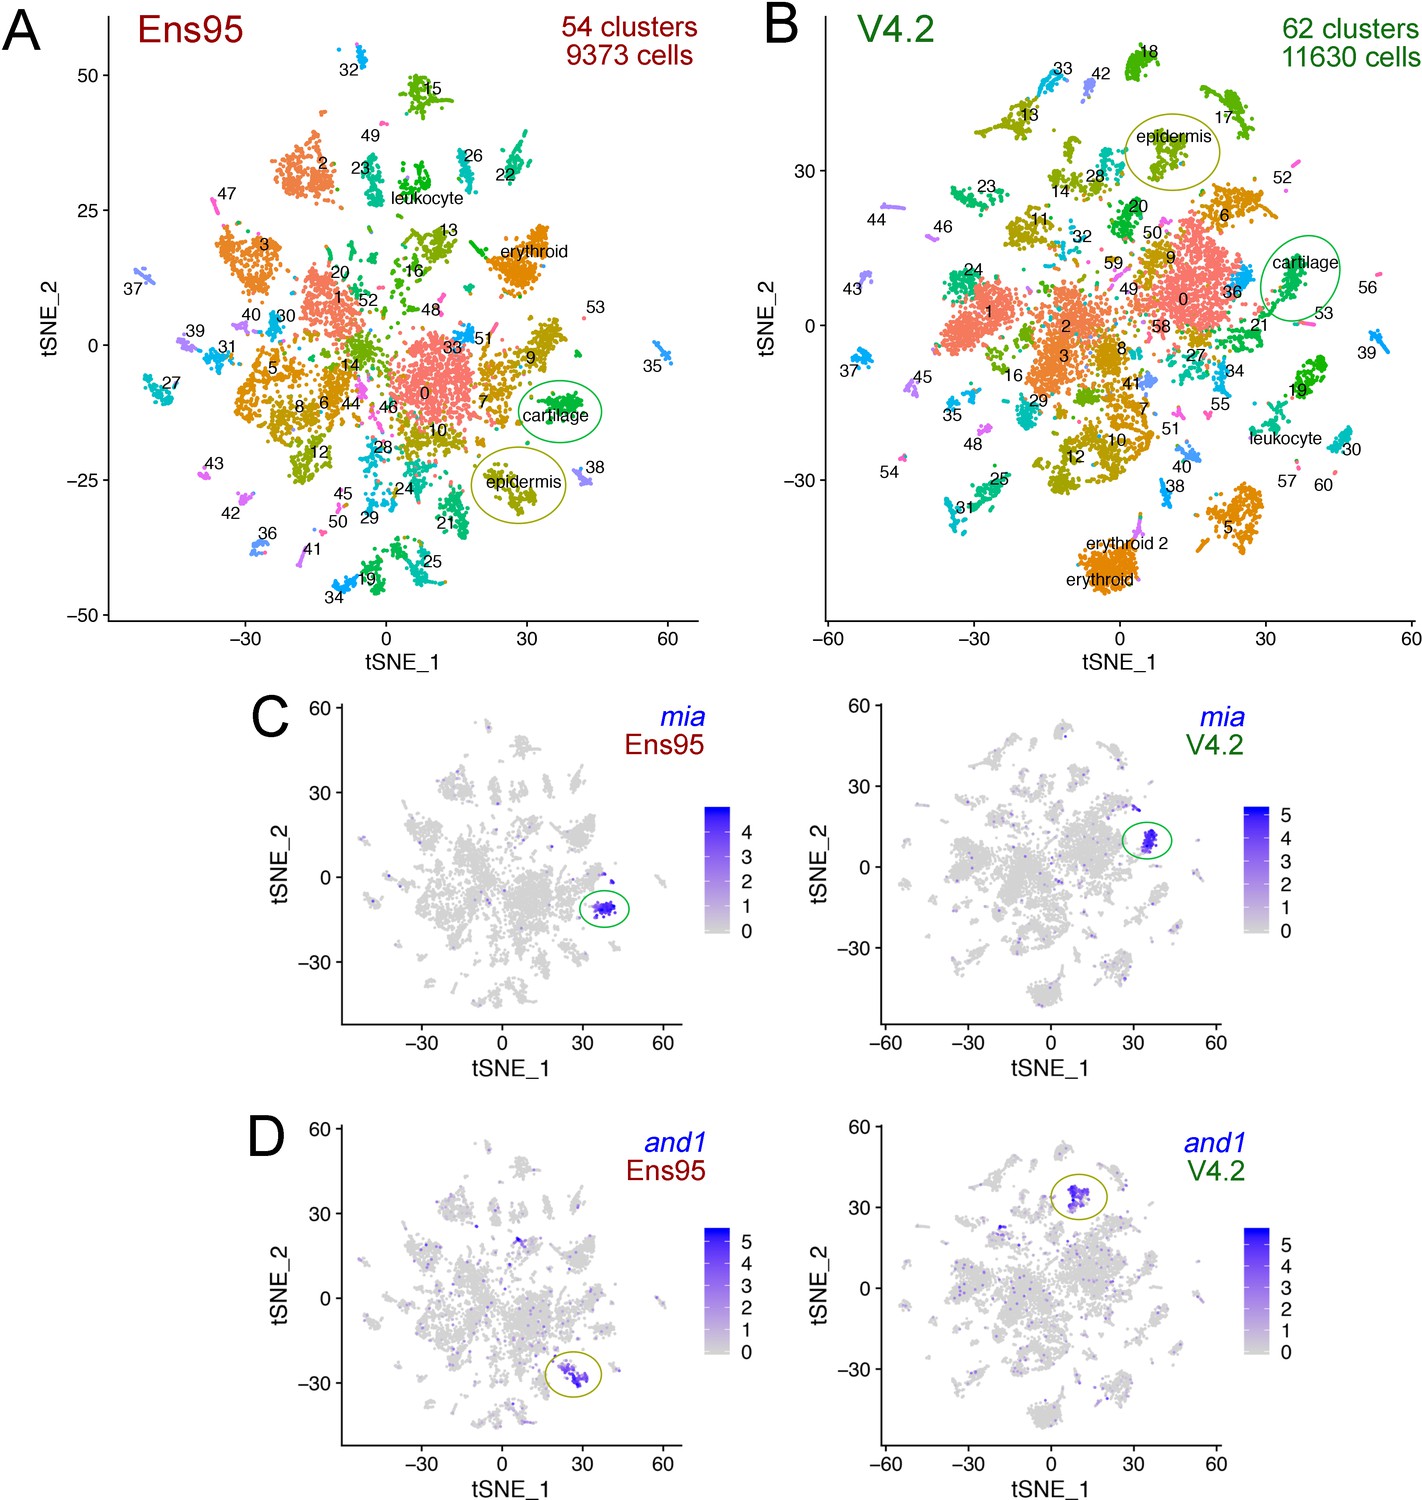
(A, B) tSNE plots of cells from 5 day post fertilization (dpf) zebrafish embryos from the same mapped scRNA-seq reads quantified with (A) Ens95 or (B) V4.2. The total number of clusters and cells that passed filtering are shown. Clusters of interest noted in the text are named. Cartilage and epidermis clusters are circled. (C, D). tSNE plots showing restricted expression of (C) mia in cartilate cells and (D) and1 in epidermis cells for both Ens95 and V4.2 annotations. Each cluster is indicated by a circle. Legends indicate log-transformed and normalized expression values.
-
Figure 4—source data 1
Metrics from CellRanger output for data quantified using Ens95 and V4.2.
- https://cdn.elifesciences.org/articles/55792/elife-55792-fig4-data1-v2.xlsx
-
Figure 4—source data 2
Cluster-specific genes from whole embryo scRNA-seq at 5 days post fertilization (dpf) identified using Seurat from data quantified with Ens95.
The p-value, adjusted p-value, and average log2 fold change refer to comparison of indicated cluster with all other clusters. Cutoffs are adjp <0.05, log2 fold change >0.5. Pct.1 is proportion of cells within indicated cluster that express detectable levels of the indicated gene. Pct.2 is proportion of all other cells that express detectable levels of the indicated gene. Matching LL and Ensembl gene IDs are included.
- https://cdn.elifesciences.org/articles/55792/elife-55792-fig4-data2-v2.xlsx
-
Figure 4—source data 3
Cluster-specific genes from whole embryo scRNA-seq at five dpf identified using Seurat from data quantified with V4.2.
p-value, adjusted p-value and average log2 fold change refer to comparison of indicated cluster with all other clusters. Cutoffs are adjp <0.05, log2 fold change >0.5. Pct.1 is proportion of cells within indicated cluster that express detectable levels of the indicated gene. Pct.2 is proportion of all other cells that express detectable levels of the indicated gene. Matching LL and Ensembl gene IDs are included.
- https://cdn.elifesciences.org/articles/55792/elife-55792-fig4-data3-v2.xlsx
Figure 4—figure supplement 1
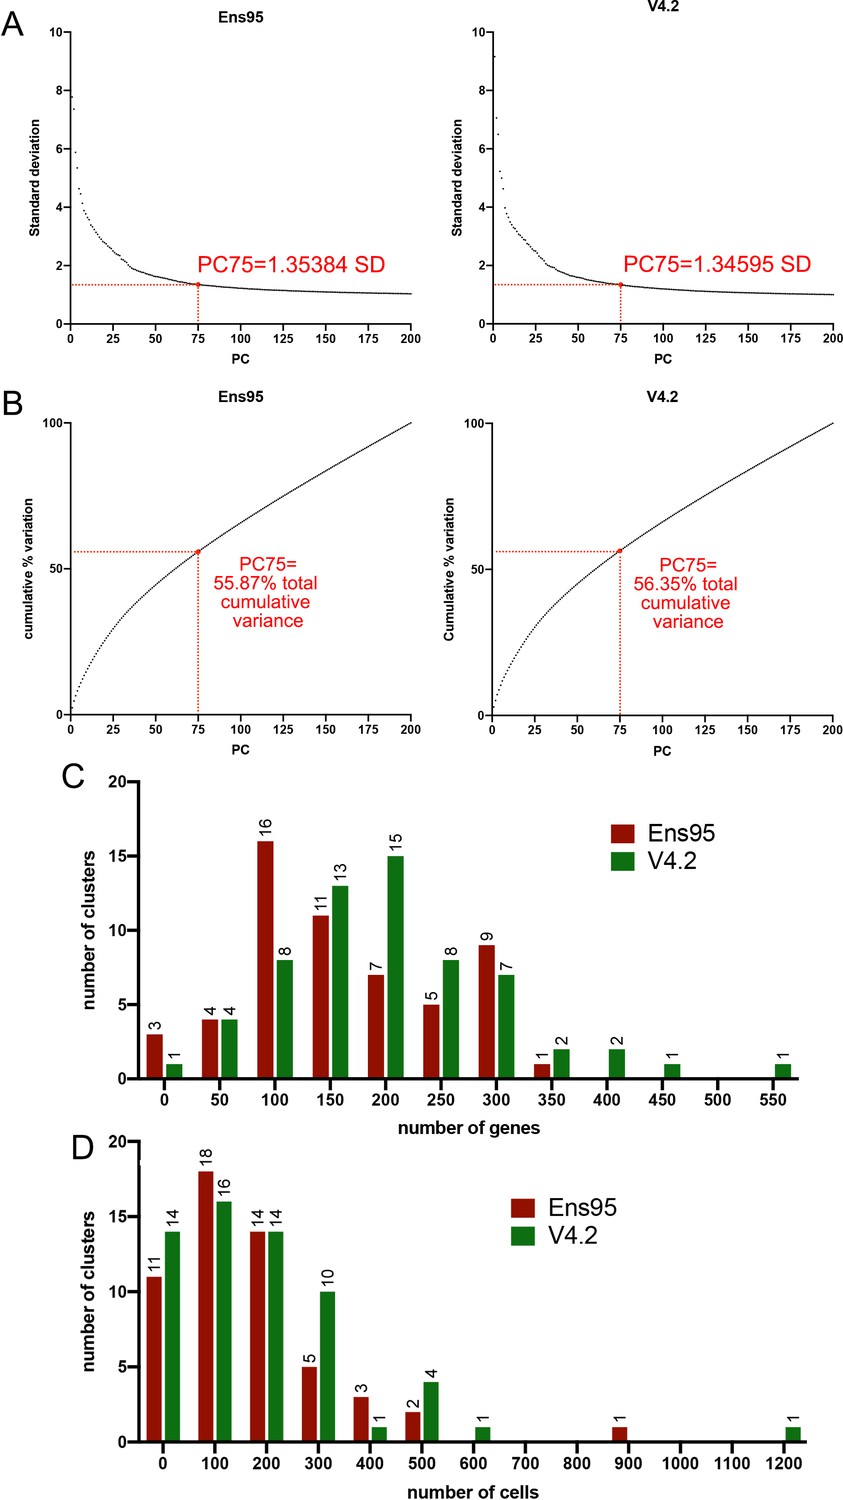
Standard variance and principal component comparisons for scRNA-seq analysis.
(A) Plots of standard deviation against the number of principal components using whole embryo scRNA-seq data quantified using indicated annotation. Standard deviation values for 75 principal components are shown in both cases. (B) Plots of cumulative variation against the number of principal components from scRNA-seq data quantified using indicated annotation. Total cumulative variance values for 75 principal components are shown in each case. (C) Histogram plot of the number of genes per cluster. The bin size is 50. No clusters have 0 genes. (D) Histogram showing the number of cells per cluster. The bin size is 100. No clusters have 0 cells.
Figure 4—figure supplement 2
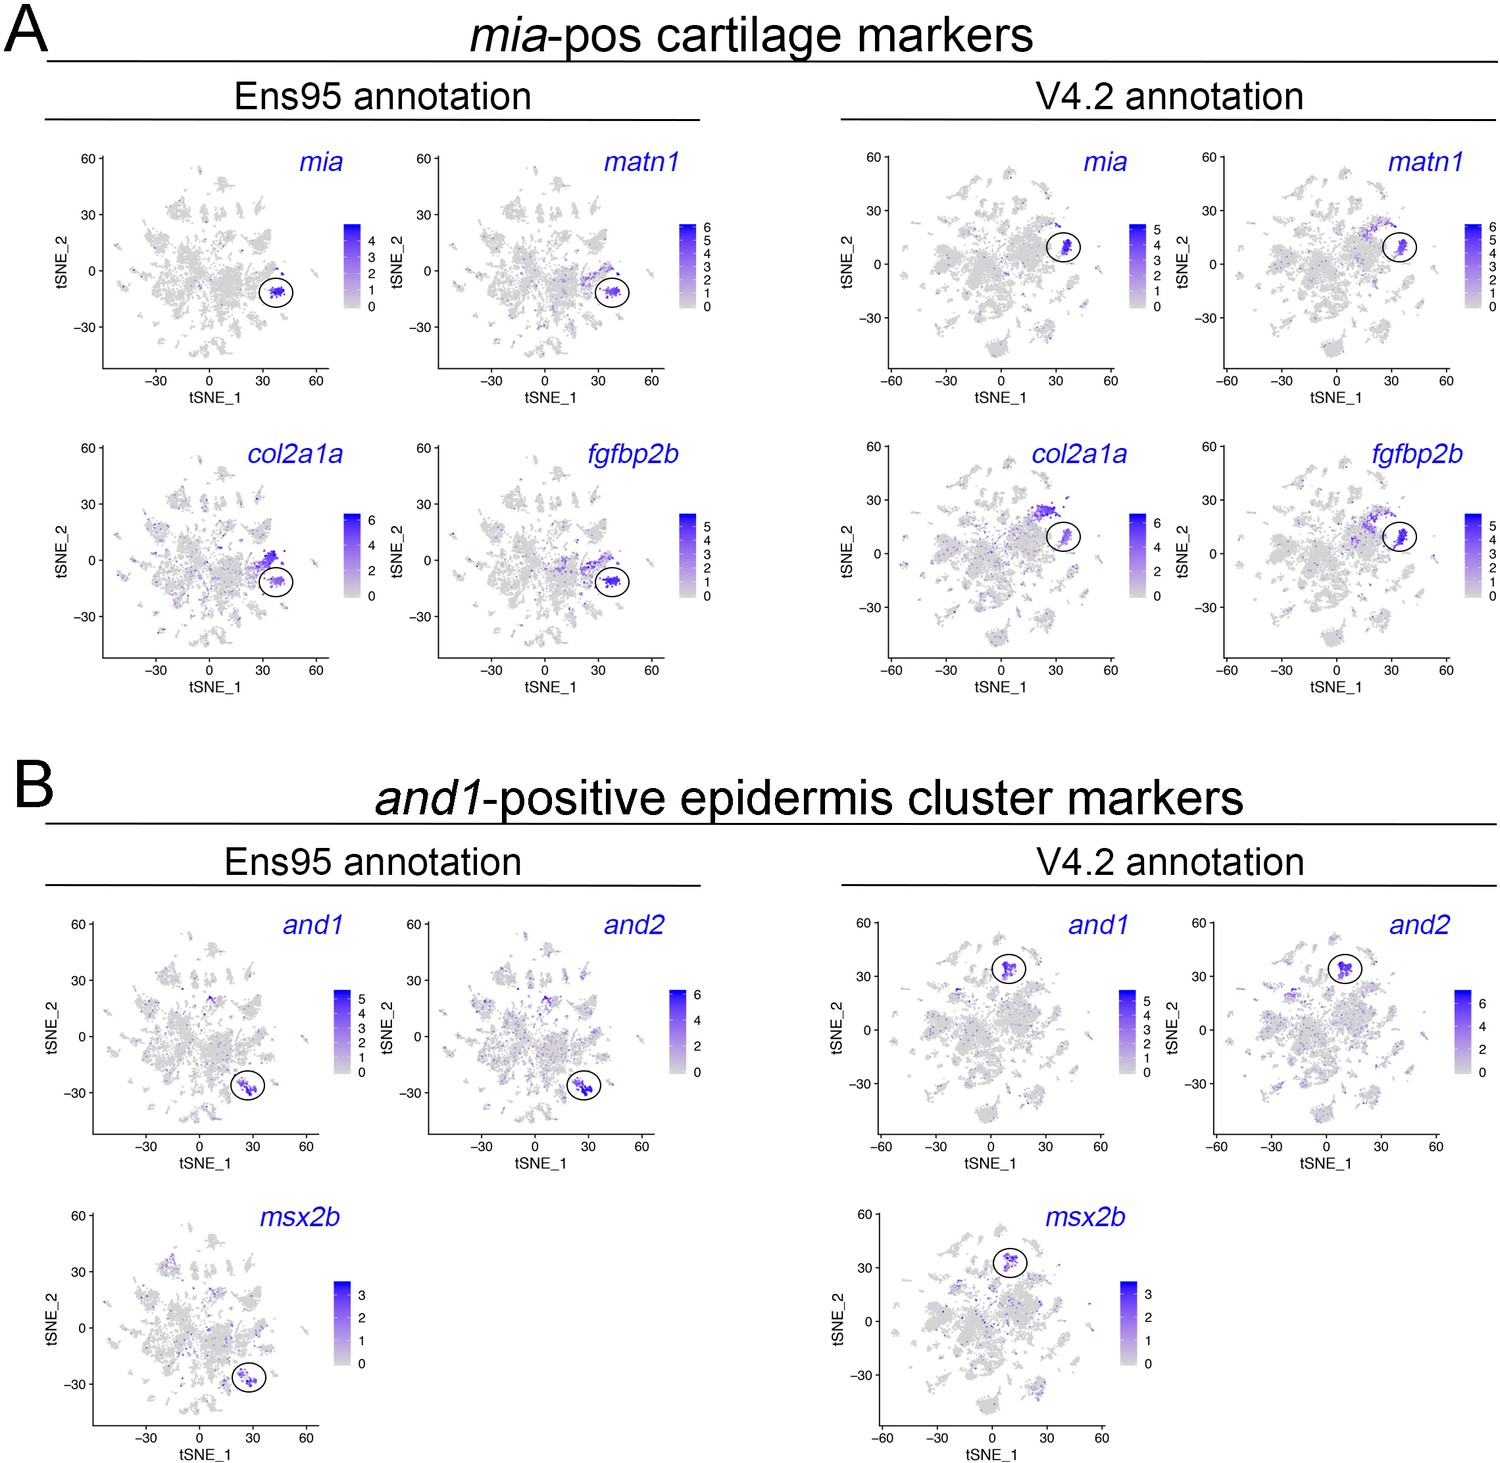
Identification of cartilage and epidermis cell clusters in scRNA-seq data.
(A) tSNE plots showing expression of cartilage markers mia, matn1, col2a1a, and fgfbp2 using clustering based on data quantified with Ens95 or V4.2, as indicated. (B) tSNE plots showing expression of epidermis markers and1, and2, and msx2b using clustering based on data quantified with Ens95 or V4.2, as indicated. (A, B) Legends indicate log-transformed normalized expression level per cell.
Figure 5 with 1 supplement
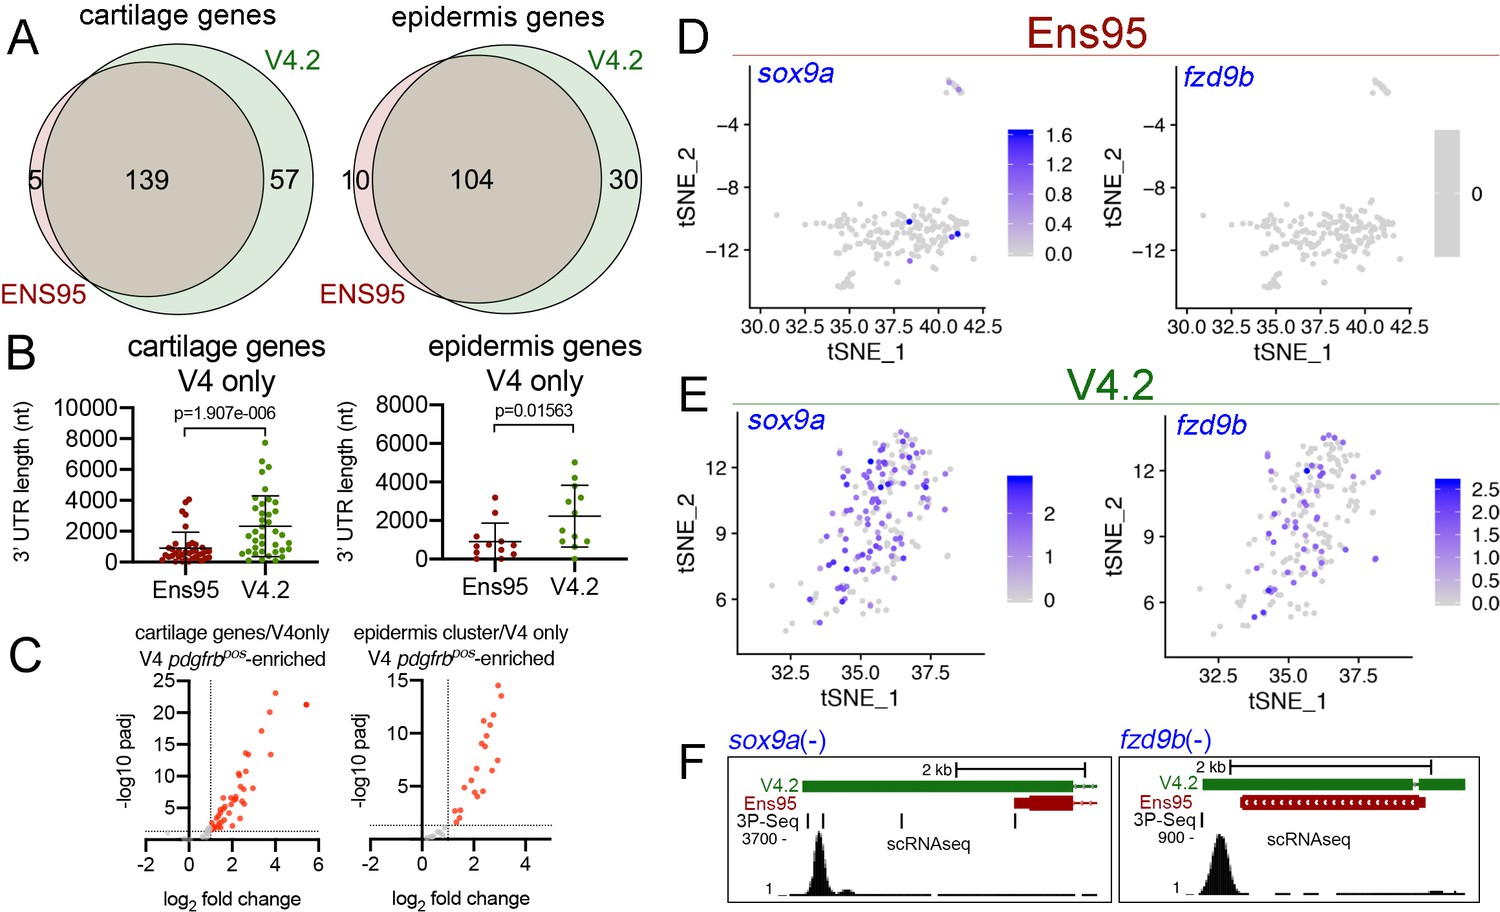
The V4.2 annotation increases the quantity of cell type-specific genes identified by scRNA-seq.
(A) Venn diagrams illustrating intersection by common LL gene ID of genes enriched in mia-positive cartilage cells and and1-positive epidermis cells by both indicated annotations. (B) 3' UTR lengths from Ens95 and V4.2 for reference genes identified as cartilage or epidermis-specific uniquely by V4.2. Data are not normally distributed (Shapiro-Wilks test), comparison by Wilcoxon matched-pairs signed-rank test, p-values are shown. (C) Volcano plots showing cartilage- or epidermis-specific genes identified selectively by V4.2 with corresponding values from bulk RNA-seq comparison of pdgfrbpos and pdgfrbneg cells. Red indicates log2 fold change >1 (pdgfrbpos/pdgfrbneg), padj <0.05. (D, E) tSNE plots of the mia-positive cartilage cluster showing expression levels of sox9a and fzd9b using scRNA-seq data quantified using (D) Ens95 and (E) V4.2. Legends indicate log-transformed and normalized expression levels per cell. (F) UCSC browser image of sox9a and fzd9b loci showing 3' UTR annotations from V4.2 and Ens95. Both loci are located on the negative strand. Mapped read depth from kdrlpos cells on the genome, or assigned to each annotation are indicated, as are 3P-seq features, all of which reside in the same orientation as the genes themselves.
-
Figure 5—source data 1
Cartilage-specific genes identified by scRNA-seq.
Worksheet one includes all cartilage genes identified using both Ens95 and V4.2 quantification, as indicated, with associated adjusted p-values and log2 fold change (comparison of cartilage cells to all other clusters). 3' UTR length from matching reference gene (from Figure 2—source data 2) is indicated. Worksheet two includes matched bulk RNA-seq quantification from Ens95 and V4.3 annotations for cartilage-specific genes. Data used to generate Figure 5A–C, Figure 5—figure supplement 1A,B.
- https://cdn.elifesciences.org/articles/55792/elife-55792-fig5-data1-v2.xlsx
-
Figure 5—source data 2
Epidermis-specific genes identified by scRNA-seq.
Worksheet one includes all epidermis genes identified using both Ens95 and V4.2 quantification, as indicated, with associated adjusted p-values and log2 fold change. 3' UTR length from matching reference gene (from Figure 2—source data 2) is indicated. Worksheet two includes matched bulk RNA-seq quantification from Ens95 and V4.3 annotations for epidermis-specific genes. Data used to generate Figure 5A–C, Figure 5—figure supplement 1A,B.
- https://cdn.elifesciences.org/articles/55792/elife-55792-fig5-data2-v2.xlsx
Figure 5—figure supplement 1
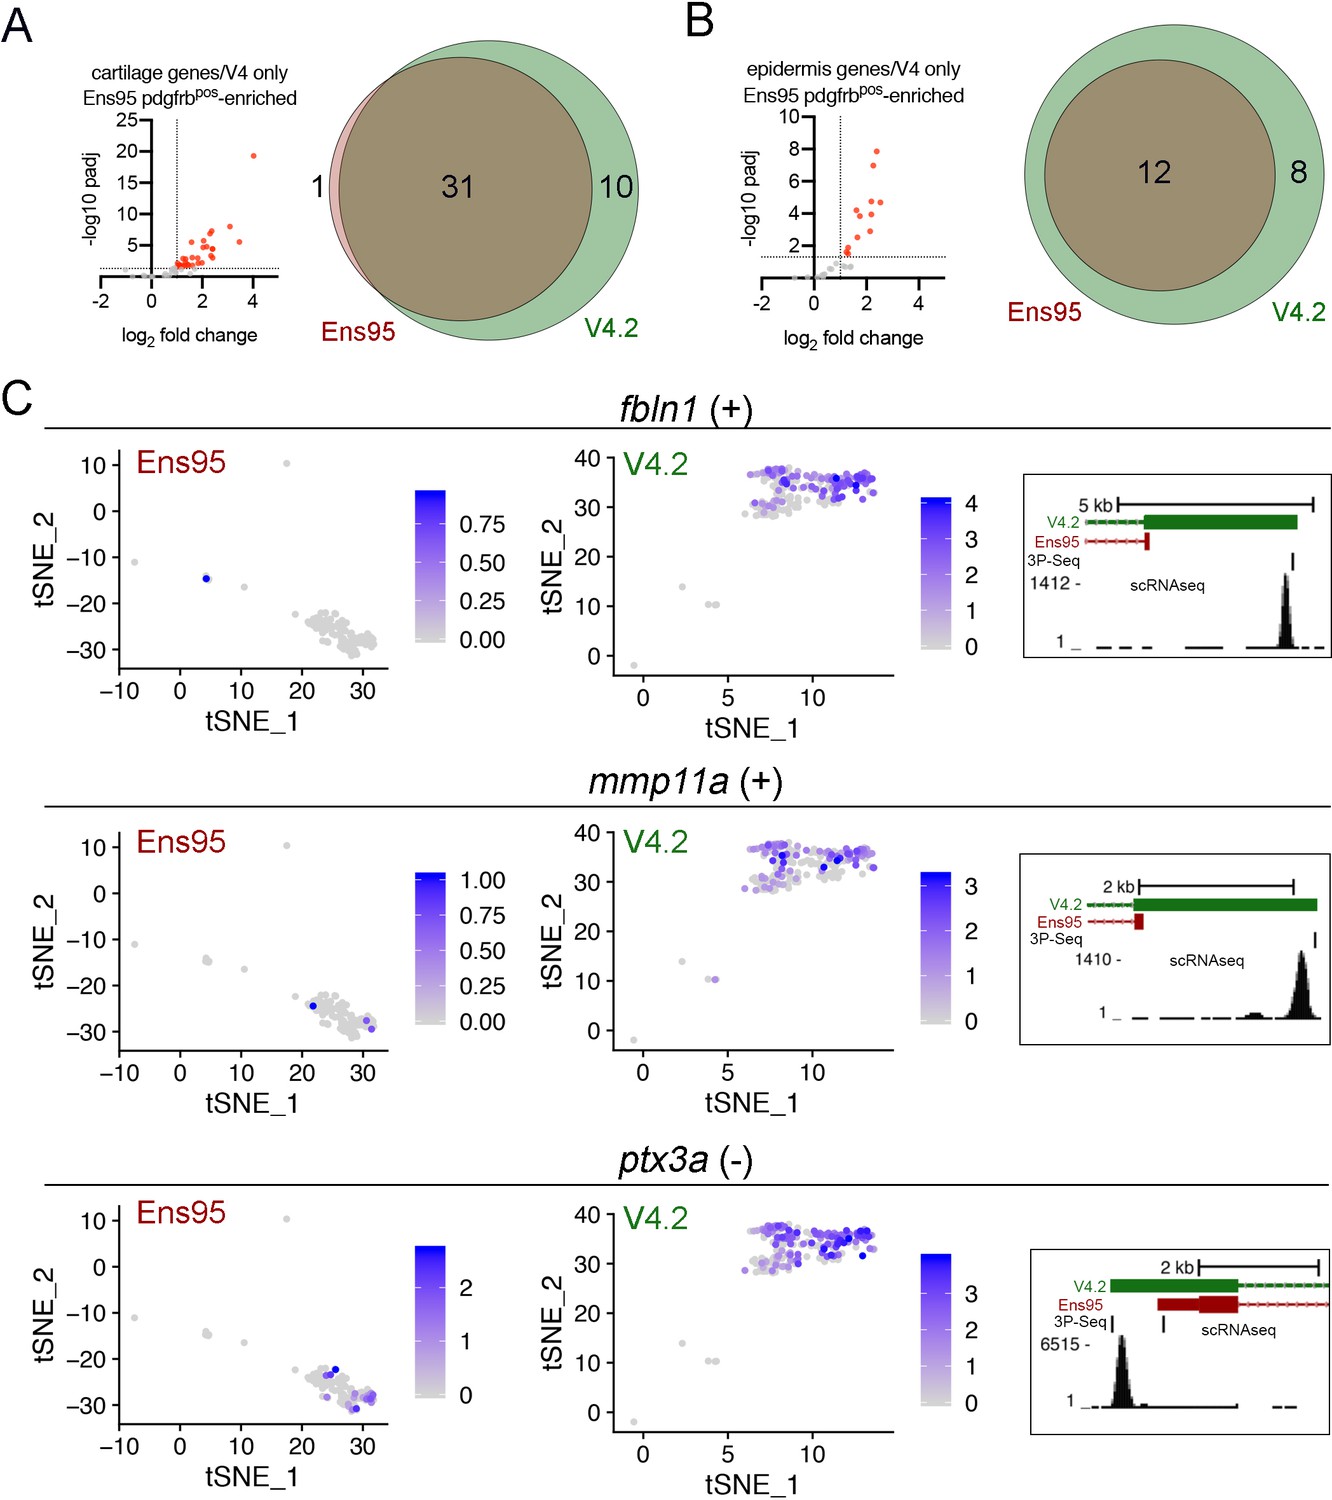
Improved detection of cartilage and epidermis genes in scRNA-seq data using V4.2.
(A, B) Left, plots showing values from bulk RNA-seq comparison of pdgfrbpos and pdgfrbneg cells quantified with Ens95 for (A) cartilage and (B) epidermis genes identified as such selectively in V4.2 by scRNA-seq. Red indicates log2 fold change >1, padj <0.05. (A, B) Venn diagrams showing the intersection of (A) cartilage and (B) epidermis genes identified as pdgfrbpos-enriched in bulk RNA-seq using indicated annotation. (C) Examples of epidermis genes identified by scRNA-seq using V4.2, but not Ens95. Left, tSNE plots of epidermis cluster from data quantified with Ens95 or V4.2 showing expression of fbln1, mmp11a, and ptx3a. Right, 3' UTR annotation for each gene from Ens95 or V4.2. Location and read density of scRNA-seq reads are indicated.
Figure 6
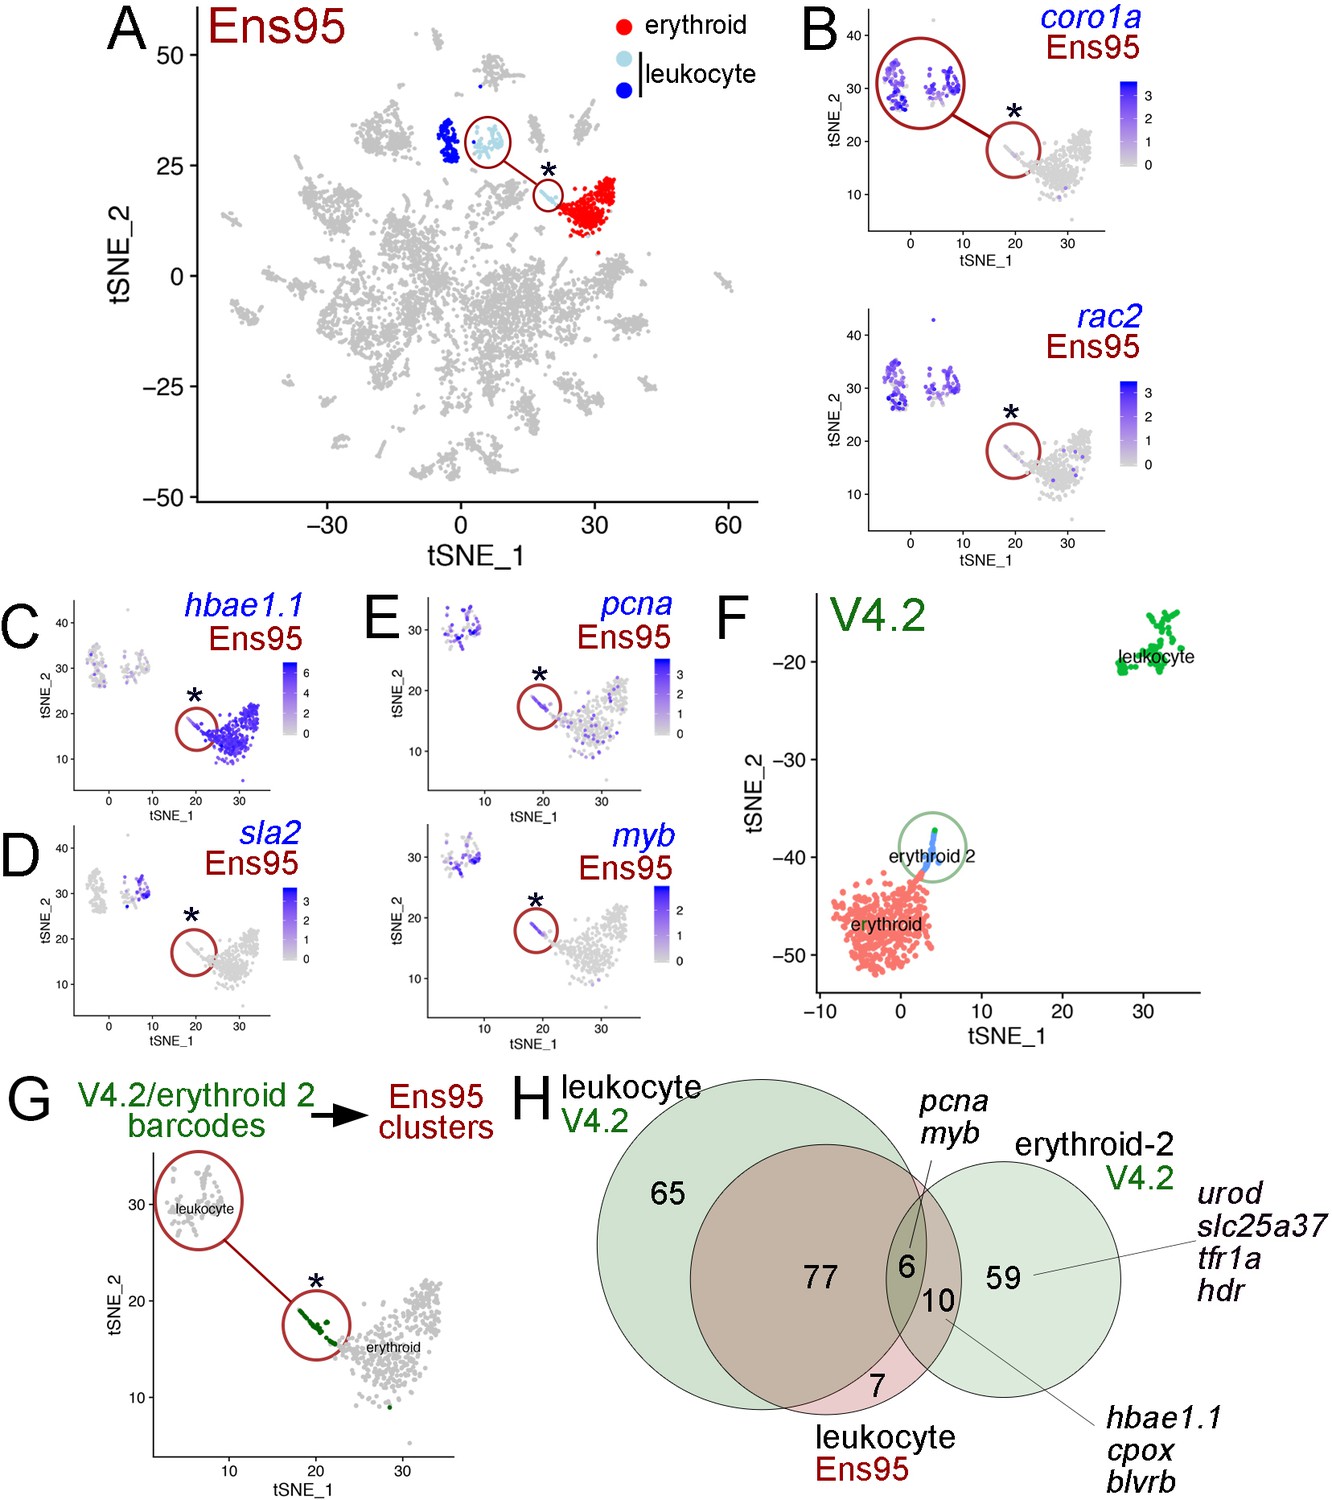
The V4.2 annotation improves cluster resolution in scRNA-seq data.
(A) tSNE plot of all clusters from Ensembl (Ens95)-quantified scRNA-seq of zebrafish embryos at 5 days post fertilization with one erythroid and two leukocyte clusters indicated. (A–E, G) Circled clusters denote sla2pos leukocyte cells. Asterisk marks cells spuriously assigned to sla2pos leukocytes, but identified as erythroid two when using the V4.2 annotation. (B–E) tSNE plots showing only sla2pos leukocyte (circled) and erythroid clusters with expression of (B) known leukocyte markers, coro1a, and rac2, (C) erythroid marker hbae1.1, and (D) sla2. (E) tSNE plots showing expression of pcna and myb in sla2pos and erythrocyte clusters. (B–E) Legends indicate log-transformed and normalized expression values. (F) Erythroid and sla2pos (leukocyte) clusters identified using the same scRNA-seq dataset as in (A) but quantified using V4.2. A unique erythroid-like cluster (erythroid 2) is circled. (G) tSNE plot of erythroid and sla2pos leukocyte clusters identified with Ens95 quantified data. Dark green denotes cells with identical barcodes as those in the erythroid two cluster identified using V4.2 shown in (F). (H) Three-way Venn diagram intersecting cluster-specific genes of indicated clusters by gene symbol. Selected genes are shown.
-
Figure 6—source data 1
List of genes from 3-way Venn diagram output shown in Figure 6H.
First column is gene symbol, second column is assigned class shown in the Venn diagram.
- https://cdn.elifesciences.org/articles/55792/elife-55792-fig6-data1-v2.xlsx
Figure 7

Improved detection of erythroid markers in V4.2.
(A) tSNE plots of blood cell clusters from Ens95- and V4.2-quantified data showing expression of slc25a37, tfr1a, and itga4. Erythroid 2 cells spuriously identified as leukocyte using Ens95 quantification are circled. Legends indicate log-transformed and normalized expression values. (B) 3' UTR annotations from Ens95 and V4.2 for slc25a37 (on the positive strand), tfra1a (on the negative strand), and itga4 (positive strand). The 3' end of the cerkl gene on the negative strand overlaps the itga4 3' UTR. Therefore, in this case we show read densities split based on strand.
Tables
Table 1
Numbers of detected and differential genes from RNA-seq datasets analyzed with Ens95 and RefSeq annotations with matched identifiers.
| Ens95 | RefSeq | |||
|---|---|---|---|---|
| All | w/NCBI ID | All | w/Ens ID | |
| kdrlpos – all detected | 25704 | 21489 | 27516 | 21903 |
| kdrlpos-enriched | 1632 | 1538 | 1780 | 1651 |
| pdgfrbpos – all detected | 25699 | 21480 | 27598 | 21903 |
| pdgfrbpos-enriched | 2186 | 2091 | 2323 | 2188 |
| Nr2f2pos – all detected | 20516 | 17867 | 21788 | 18164 |
| Nr2f2pos-enriched | 568 | 516 | 580 | 508 |
Table 2
Number of coding genes and proportion without stop codon or 3' UTR in indicated annotation.
| Ens95 | RefSeq | |
|---|---|---|
| All Genes | 32520 | 30445 |
| annotated CDS | 25592 | 26120 |
| CDS, missing annotated stop codon | 1585 | 269 |
| CDS, missing annotated 3' UTR | 4703 | 1580 |
Table 3
Coordinate-based transcriptome comparisons.
| Annotation | Ensembl 95 | RefSeq | V4.2 | V4.3 |
|---|---|---|---|---|
| # genes | 32520 | 30445 | 39988 | 36351 |
| # transcripts | 59876 | 55182 | 115496 | 111842 |
| # exons | 335075 | 307538 | 414404 | 411330 |
| # RefSeq genes missing | 3165 | - | 173 | 7c |
| # Ensembl genes missinga | - | 2116 | 1133b | 957d |
-
a –RefSeq comparison with Ens95, V4 comparison with Ens99.
b – 956/1133 classified as rRNA, snRNA, snoRNA or sRNA.
-
c – left out from V4.2 add-back; see main text.
d – 956/957 are rRNA, snRNA, snoRNA, sRNA, or miscRNA; remaining protein coding gene is a sequence duplicate.
Table 4
Numbers of genes identified as enriched in indicated genotype with each annotation.
| kdrlpos-enriched | pdgfrbpos-enriched | Nr2f2pos-enriched | |
|---|---|---|---|
| Ens95 | 1632 | 2186 | 568 |
| RefSeq | 1780 | 2323 | 580 |
| V4.3 | 2141 | 2794 | 613 |
| annotated in Ens95 and RefSeq | 1938 | 2612 | 523 |
| not annotated in Ens95 | 144 | 131 | 67 |
| not annotated in RefSeq | 119 | 113 | 54 |
| only annotated in V4.3 | 60 | 62 | 31 |
Key resources table
Additional files
-
Source code 1
List of R commands used to run Seurat for clustering of data quantified using Ens95 and V4.2.
- https://cdn.elifesciences.org/articles/55792/elife-55792-code1-v2.zip
-
Source code 2
Perl script used to add strand information and filter reads in BAM file output from GSNAP.
- https://cdn.elifesciences.org/articles/55792/elife-55792-code2-v2.zip
-
Source code 3
Python script to identify and remove spurious fusion transcripts.
- https://cdn.elifesciences.org/articles/55792/elife-55792-code3-v2.zip
-
Source data 1
Zebrafish transcriptome annotation V4.2.
Contains genomic annotation file (153.8 MB, md5sum:44c87a2bdd19ccfd9f7cd526f9e21498) and gene information (as tab-delimited file and .xlsx file).
- https://cdn.elifesciences.org/articles/55792/elife-55792-data1-v2.zip
-
Source data 2
Zebrafish transcriptome annotation V4.3.1.
Contains genomic annotation file (152 MB, md5sum: 19759898187c47edfd9c216162851e31) and gene information (as tab-delimited file and .xlsx file).
- https://cdn.elifesciences.org/articles/55792/elife-55792-data2-v2.zip
-
Transparent reporting form
- https://cdn.elifesciences.org/articles/55792/elife-55792-transrepform-v2.docx
Download links
A two-part list of links to download the article, or parts of the article, in various formats.
Downloads (link to download the article as PDF)
Open citations (links to open the citations from this article in various online reference manager services)
Cite this article (links to download the citations from this article in formats compatible with various reference manager tools)
An improved zebrafish transcriptome annotation for sensitive and comprehensive detection of cell type-specific genes
eLife 9:e55792.
https://doi.org/10.7554/eLife.55792


