Dopaminergic and opioidergic regulation during anticipation and consumption of social and nonsocial rewards
- Department of Psychology, University of Essex, United Kingdom
- Department of Cognition, Emotion and Methods in Psychology, University of Vienna, Austria
- Department of Clinical and Health Psychology, University of Vienna, Austria
- Department of Psychiatry and Psychotherapy, Medical University of Vienna, Austria
Figures
Figure 1 with 1 supplement

Main elements in each trial for the food (top) and touch (bottom) reward types.
Before the main task, participants experienced and ranked three food stimuli and three touch stimuli, based on liking (Figure 2). In the main task (here depicted), the highest-ranked (‘high’) reward was announced in half of the trials and the second-highest ranked (‘low’) reward was announced in the other half of trials. The probability of obtaining the announced reward was determined linearly by participants’ hand-squeezing effort, which was indicated in real-time. Participants knew that they would obtain the announced reward if they reached the top of the displayed vertical bar, which corresponded to their previously measured maximum voluntary contraction (MVC). The gained reward (which was either the one announced at the beginning of the trial, or – in the case of lower probability due to less squeezing – the least-liked ‘verylow’ reward) was then announced and delivered. To assess reward anticipation, EMG data was analyzed during the Pre-Effort anticipation period (3 s) at the beginning of the trial, when a possible reward was announced, as well as during the Post-Effort anticipation period (3 s announcement) preceding reward delivery. To investigate reward consumption, EMG data was analyzed during reward Delivery (5 s for food and 6.5 s for touch), and in the immediately following Relax phase (5 s). Rating slides stayed on screen indefinitely, or until participants’ button press. For a representation of all trial elements see Figure 1—figure supplement 1.
Figure 1—figure supplement 1

All trial elements.
Figure 2 with 1 supplement
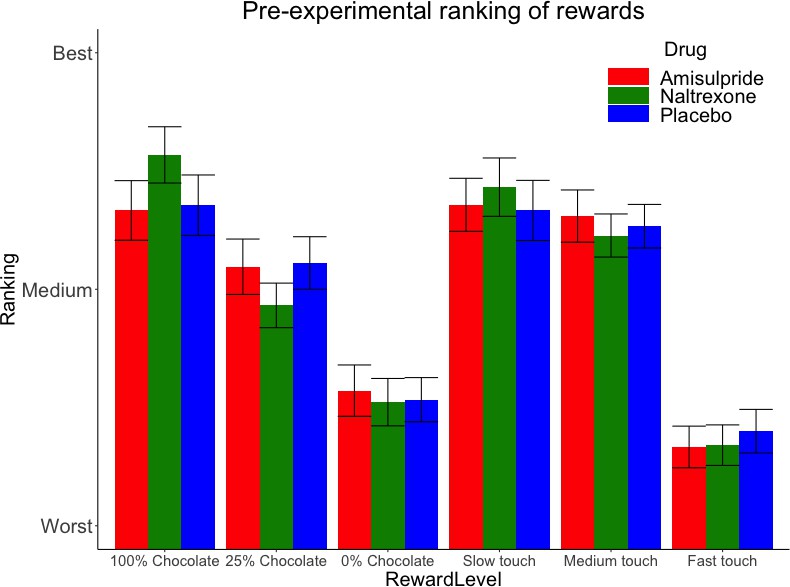
Pre-experimental mean (SE) rankings of rewards by preference.
This ranking occurred just before the main task, which adapted to these preferences by using for each Reward Type (food, touch) the highest ranked stimulus as ‘high’ reward, the second-highest ranked stimulus as ‘low’ reward, and the lowest-ranked stimulus as ‘verylow’ reward.
Figure 2—figure supplement 1
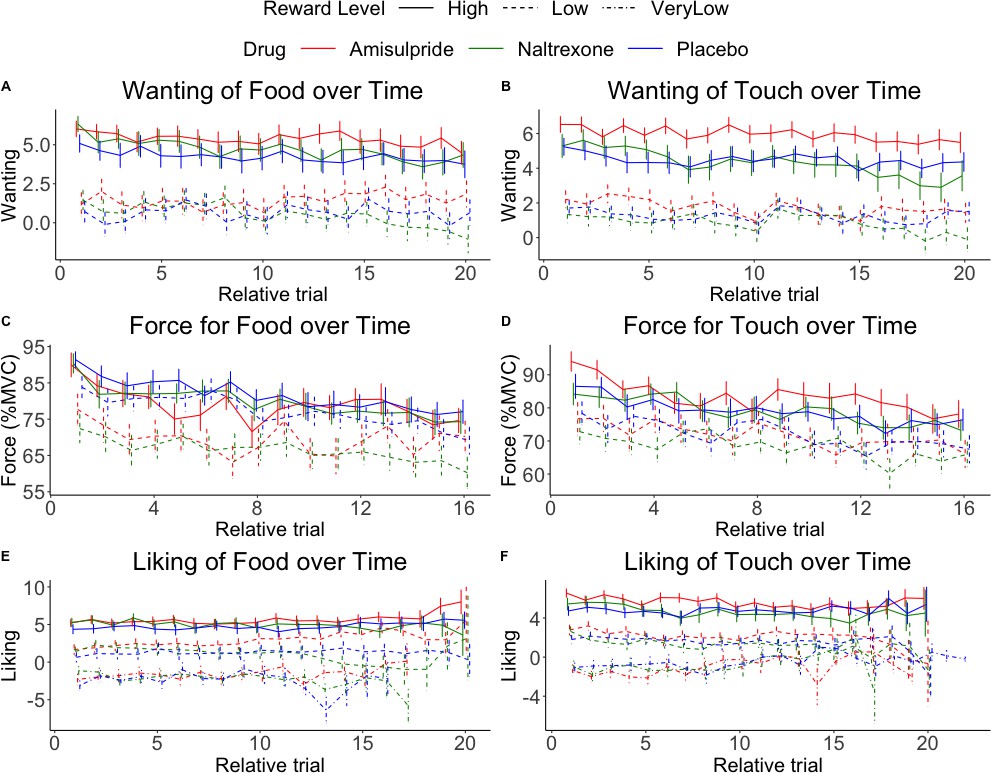
Effect of time (trial) on ratings and effort.
Figure 3 with 1 supplement
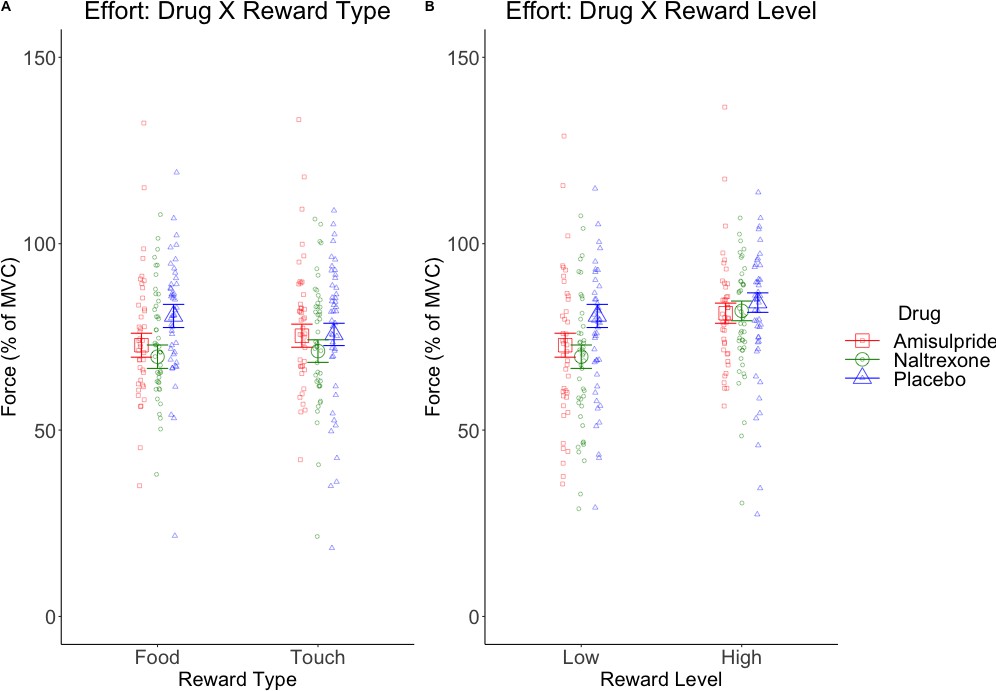
Marginal means (and 95% CIs) for interactions with the predictor Drug in behavioral analyses.
Physical effort was lower in the amisulpride and naltrexone groups compared to placebo (A) for food but not touch rewards, and (B) non-significantly (p=0.056) for low but not high rewards. This suggests lower wanting after inhibition of both the dopaminergic and the opioidergic systems, specifically for high and low food rewards and for low-level rewards of both reward types. These null effects were confirmed with Bayesian analyses. See Figure 3—figure supplement 1 for all behavioral results.
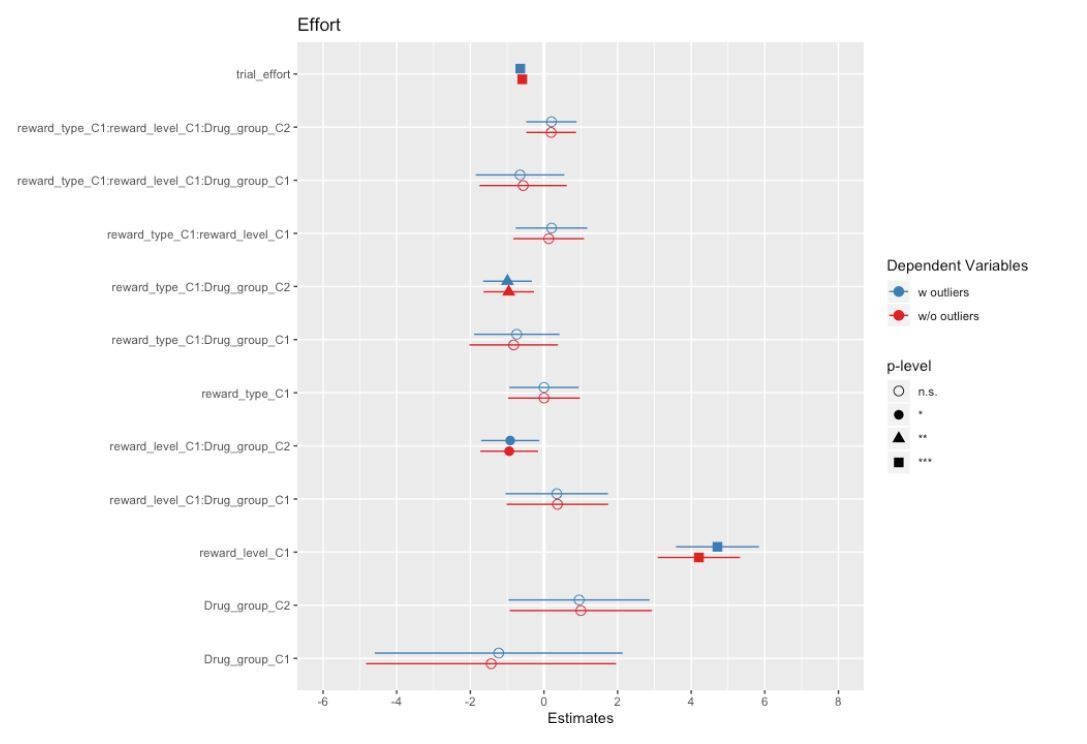
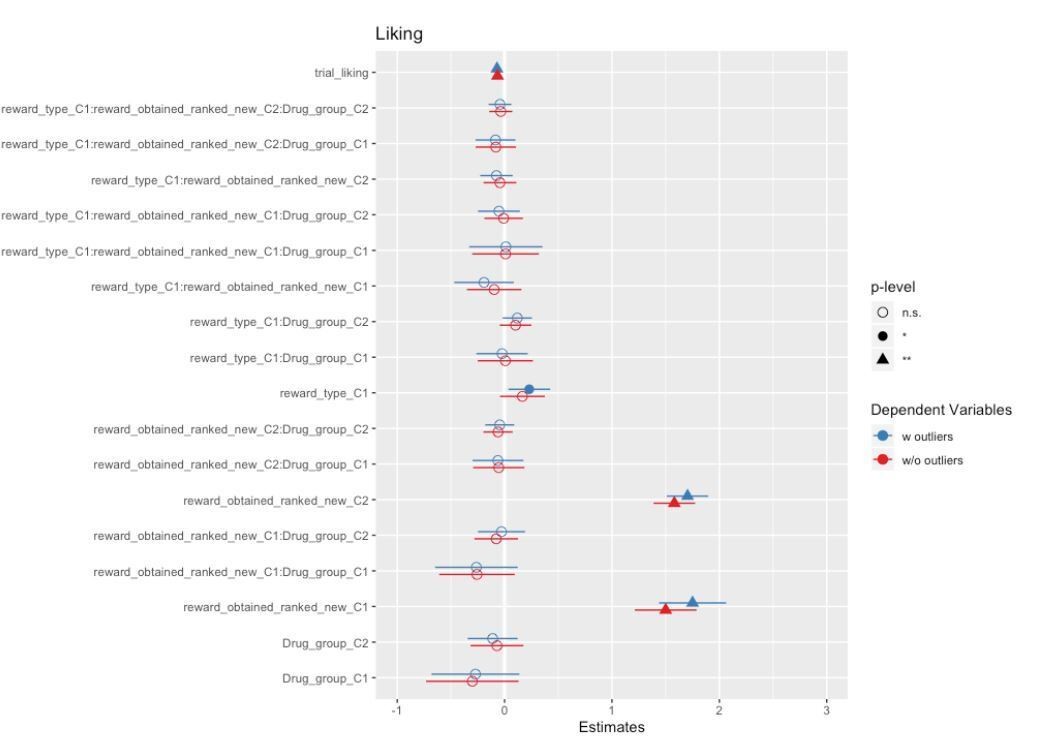
Figure 3—figure supplement 1
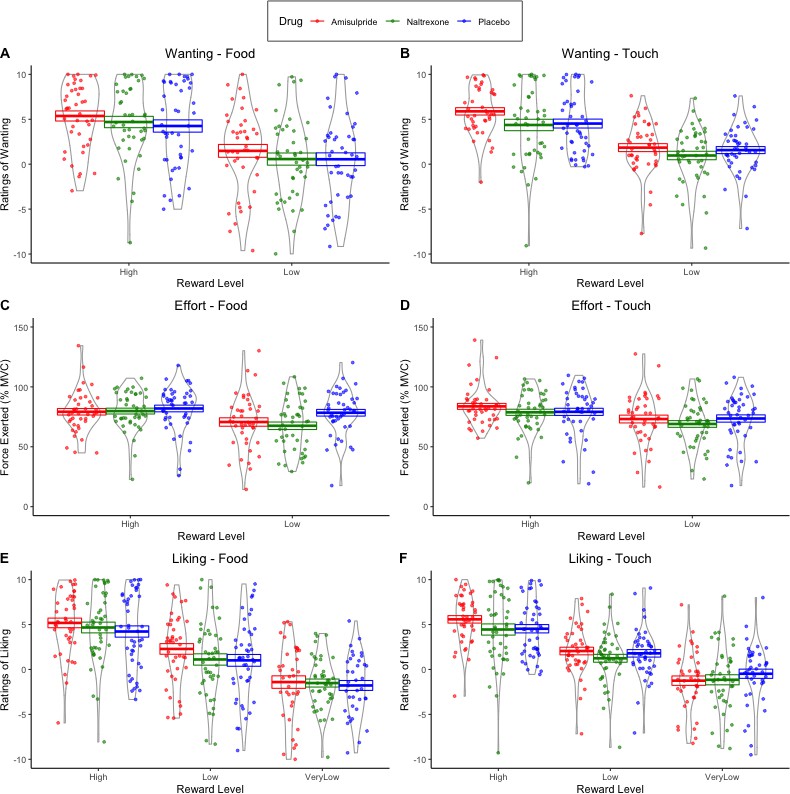
Ratings and Effort by Reward Type, Reward Level, and Drug.
Figure 4
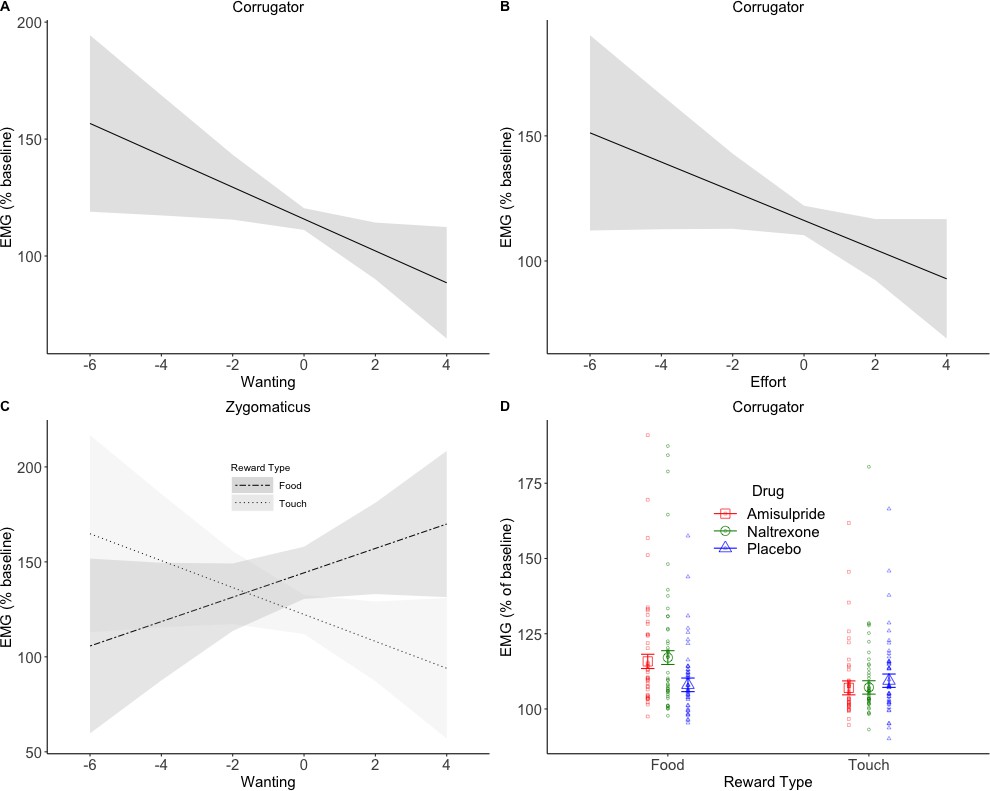
EMG during Pre-Effort anticipation.
The corrugator relaxed in trials with greater wanting (A) and greater effort (B). Zygomaticus activation to food (C) showed the opposite pattern of activation for trials with greater wanting. This is in line with the literature and was also expected for touch. A significant Drug X Reward Type interaction was found in the corrugator analyses by wanting (D), and by effort (not shown). The anticipation of food rewards resulted in greater corrugator activation in the two drug groups compared to placebo, suggesting a reduction in hedonic facial responses. Plots A-C show marginal means and 95% CIs; plot D shows marginal means with standard errors and averages by subject.
Figure 5
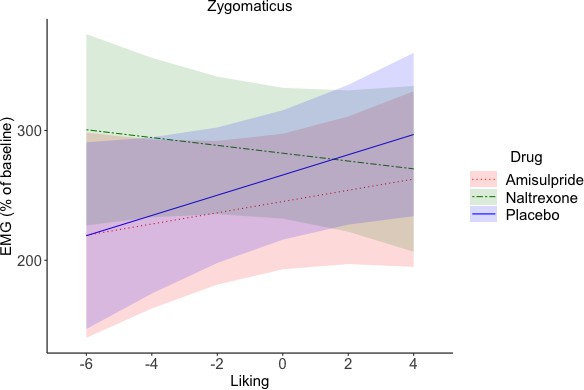
Zygomaticus during Delivery (marginal means and 95% CIs).
A Liking x Drug interaction (not significant after FDR correction, p=0.09, but credible according to a Bayesian LMM) reflected zygomaticus activation for greater liking in the placebo group, and to a lesser extent also in the amisulpride group, but zygomaticus relaxation in the naltrexone group. This suggests that blocking of the opioidergic system resulted in an inverted effect of liking on zygomaticus activation, with less smiling for the most liked rewards.
Author response image 1
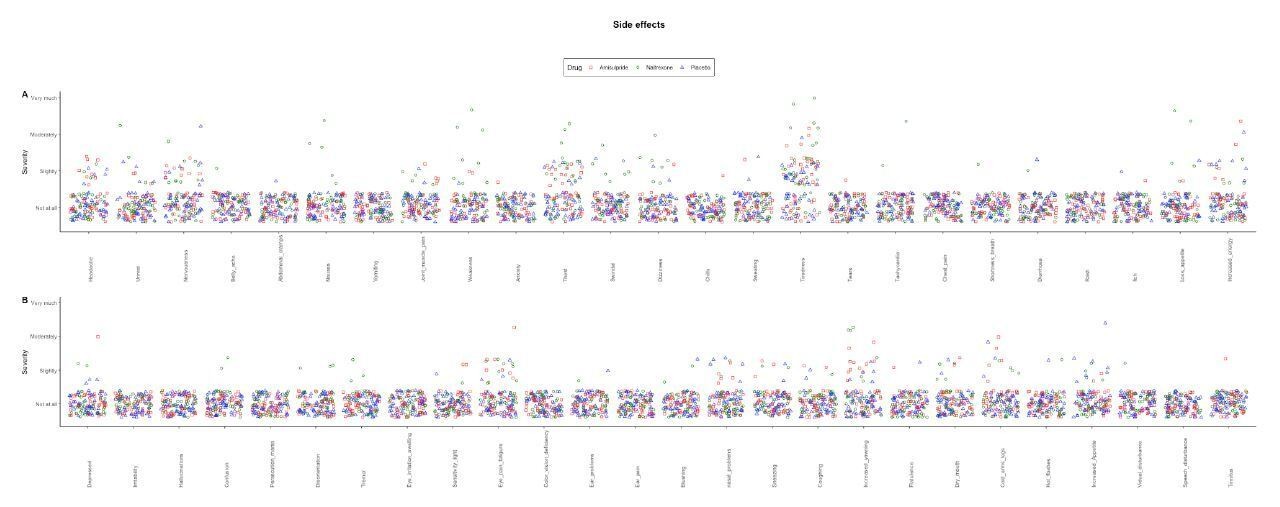
Nausea and other possible side effects were measured through self-report (4 options: “not at all”, “slightly”, “moderately”, and “very much“) three hours after pill intake.
All reported side effects were generally low, and did not differ between groups. The list of side effects (from top left to bottom right in the figure; original in German) was: headache; unrest; nervousness; belly ache; abdominal cramps; nausea; vomiting; joint/muscle pain; weakness; anxiety; thirst; swindle; dizziness; chills; sweating; tiredness; tears; tachycardia; chest pain; shortness of breath; diarrhoea; rush; itch; loss of appetite; increased energy; depressed; irritability; hallucinations; confusion; persecution mania; disorientation; tremor; eye irritation/swelling; light sensitivity; eye pain/fatigue; color vision deficiency; ear problems; ear pain; blushing; nasal problems; sneezing; coughing; increased yawning; flatulence; dry mouth; cold arms/legs; hot flashes; increased appetite; visual disturbance; speech disturbance; tinnitus.
Author response image 2
Author response image 3
Author response image 4
Tables
Table 1
Participants’ characteristics across groups, as tested with linear regression (the t and p value refer to the main effect of Group).
BMI = Body Mass Index; MVC = Maximum Voluntary Contraction; PANAS = Positive and Negative Affective Schedule; M = Mean; SD = Standard deviation.
| Amisulpride | Naltrexone | Placebo | Group differences | |
|---|---|---|---|---|
| N (male, female) | 42 (14, 28) | 44 (14, 30) | 45 (15, 30) | |
| Age M (SD) | 23.7 (4.1) | 22.9 (2.8) | 23.1 (3.7) | t = −0.73, p=0.46 |
| BMI M (SD) | 22.7 (2.5) | 23.0 (2.3) | 22.2 (2.5) | t = −0.99, p=0.32 |
| MVC M (SD) | 211.9 (86.3) | 208.7 (81.8) | 215.3 (73.1) | t = 0.19, p=0.85 |
| PANAS pos T1 M (SD) | 30.5 (5.4) | 29.7 (7.3) | 29.4 (6.7) | t = −0.8, p=0.42 |
| PANAS neg T1 M (SD) | 12.1 (3.2) | 14.3 (7.5) | 11.5 (2.1) | t = −0.7, p=0.52 |
| PANAS pos T2 M (SD) | 27.1 (6.3) | 24.7 (8.0) | 26.7 (7.4) | t = −0.3, p=0.80 |
| PANAS neg T2 M (SD) | 10.1 (2.8) | 12.1 (5.5) | 10.5 (0.9) | t = −0.5, p=0.58 |
| Nausea T1 M (SD) | 1.05 (0.2) | 1.02 (0.1) | 1.00 (0.0) | t = −1.5, p=0.14 |
| Nausea T2 M (SD) | 1.00 (0.0) | 1.20 (0.6) | 1.00 (0.0) | t = −0.1, p=0.93 |
Additional files
-
Supplementary file 1
Description of all elements in a trial.
- https://cdn.elifesciences.org/articles/55797/elife-55797-supp1-v1.docx
-
Transparent reporting form
- https://cdn.elifesciences.org/articles/55797/elife-55797-transrepform-v1.docx
Download links
A two-part list of links to download the article, or parts of the article, in various formats.
Downloads (link to download the article as PDF)
Open citations (links to open the citations from this article in various online reference manager services)
Cite this article (links to download the citations from this article in formats compatible with various reference manager tools)
Dopaminergic and opioidergic regulation during anticipation and consumption of social and nonsocial rewards
eLife 9:e55797.
https://doi.org/10.7554/eLife.55797


