Diversity-decomposition relationships in forests worldwide
- Qianyanzhou Ecological Research Station, Key Laboratory of Ecosystem Network Observation and Modeling, Institute of Geographic Sciences and Natural Resources Research, Chinese Academy of Sciences, China
- College of Resources and Environment, University of Chinese Academy of Sciences, China
- CEFE, Univ. Montpellier, CNRS, EPHE, IRD, Univ. Paul-Valéry, France
- State Key Laboratory of Tree Genetics and Breeding, Key Laboratory of Tree Breeding and Cultivation of State Forestry Administration, Research Institute of Forestry, Chinese Academy of Forestry, China
Figures
Figure 1

A map showing the geographical distribution of the 63 study sites included in the meta-analysis.
Black circles denote all studies where only mass loss was assessed, yellow circles denote the studies where also N release was measured, and grey circles denote the studies where mass loss, N release, and P release were measured.
Figure 2 with 2 supplements
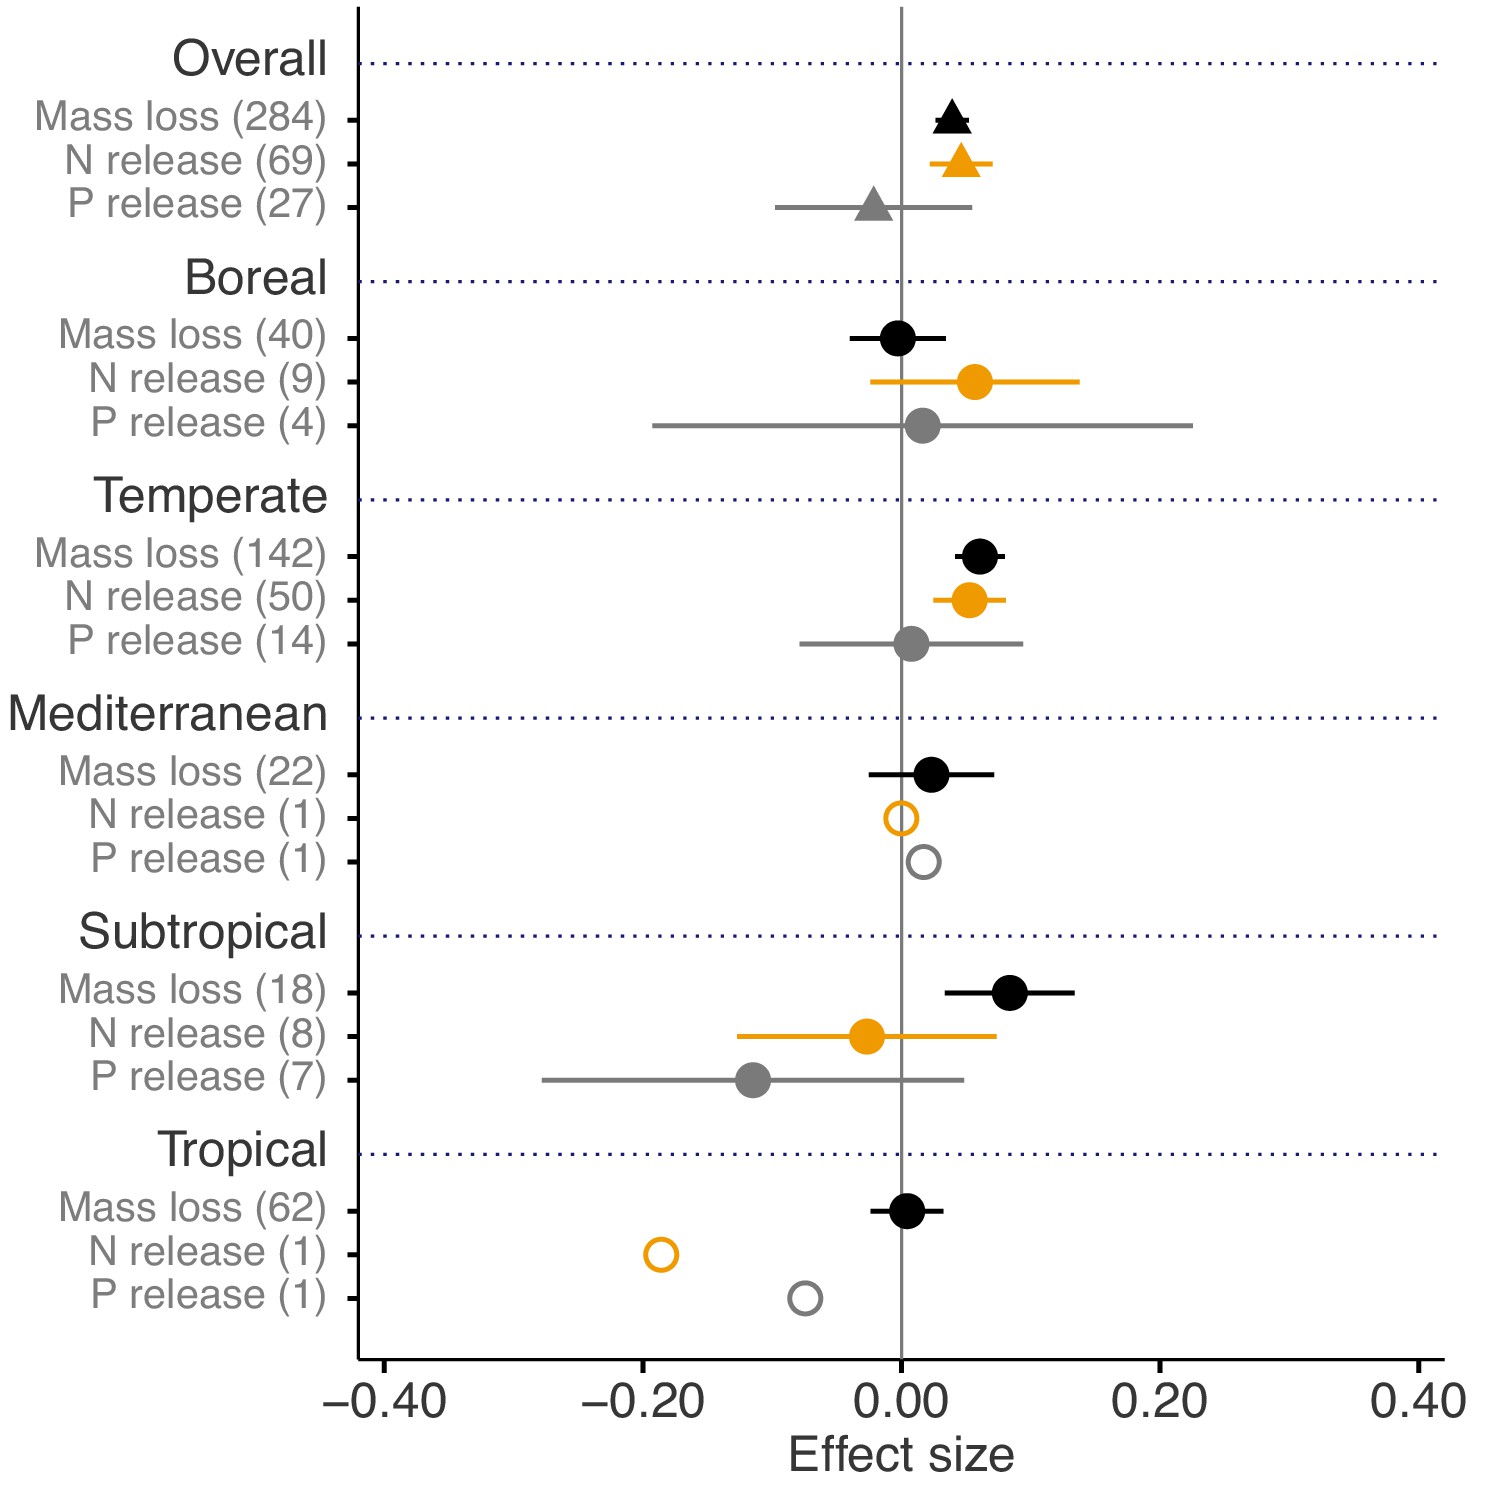
Litter mixture effects on mass loss (solid black triangles or circles), N release (solid yellow triangles or circles), and P release (solid grey triangles or circles) at the global scale (overall average, triangles) and for each of the five different biomes separately (circles).
Effect sizes were calculated as the log response ratio between observed and expected values for each response variable and 95% bootstrap confidence intervals (CI) are shown. Data from the final harvest time of the decomposition experiment (if there was more than one harvest) were used to calculate the effect size of each variable. The solid vertical black line indicates no effects (mean effect size = 0, observed values = expected values). Mean effect size >0 indicates synergistic effects (observed values > expected values), while mean effect size <0 indicates antagonistic effects (observed values < expected values). The non-additive effects (synergistic or antagonistic) are significant at α = 0.05 if the CI of the effect size does not overlap 0, while the effects are additive when there is overlap. The values in parentheses denote the number of observations. The open circles indicate sample sizes that were too low to run statistic.
Figure 2—figure supplement 1
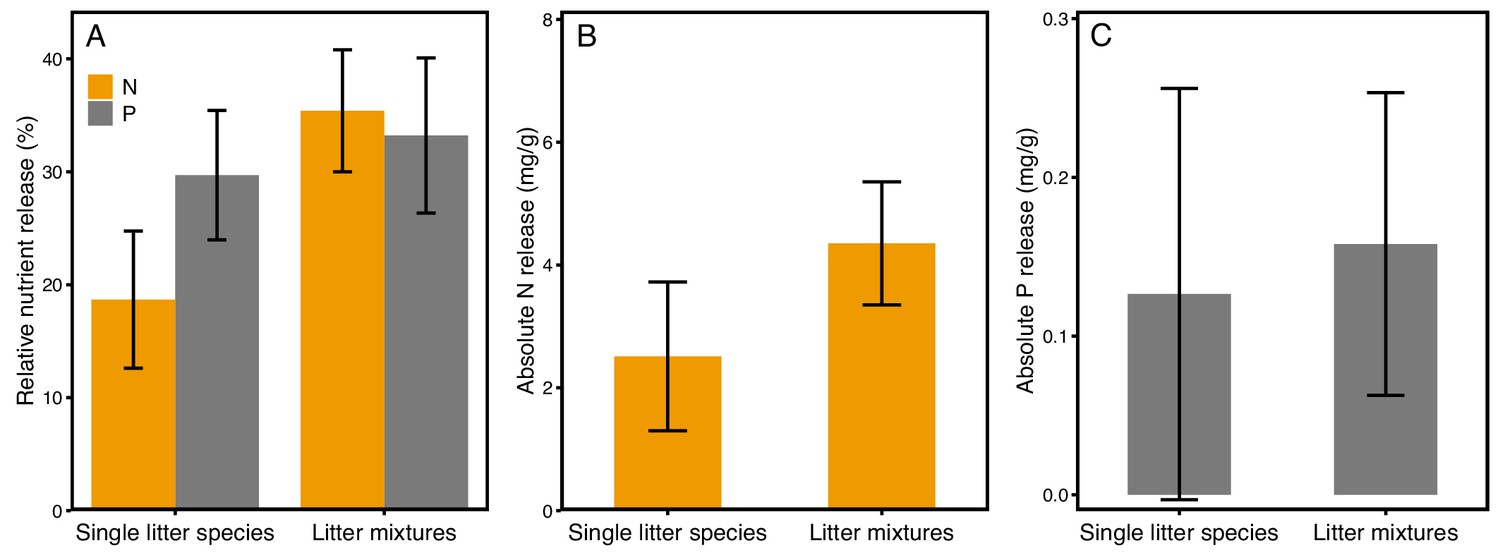
Nitrogen and P release from single litter species treatments and litter mixtures across all studies included in our meta-analysis.
Nitrogen and P release from single litter species treatments and litter mixtures across all studies included in our meta-analysis. The left panel shows relative amounts compared to the initial quantity of N and P (A), and the middle and right panels show absolute amounts of N (B) and P (C).
Figure 2—figure supplement 2
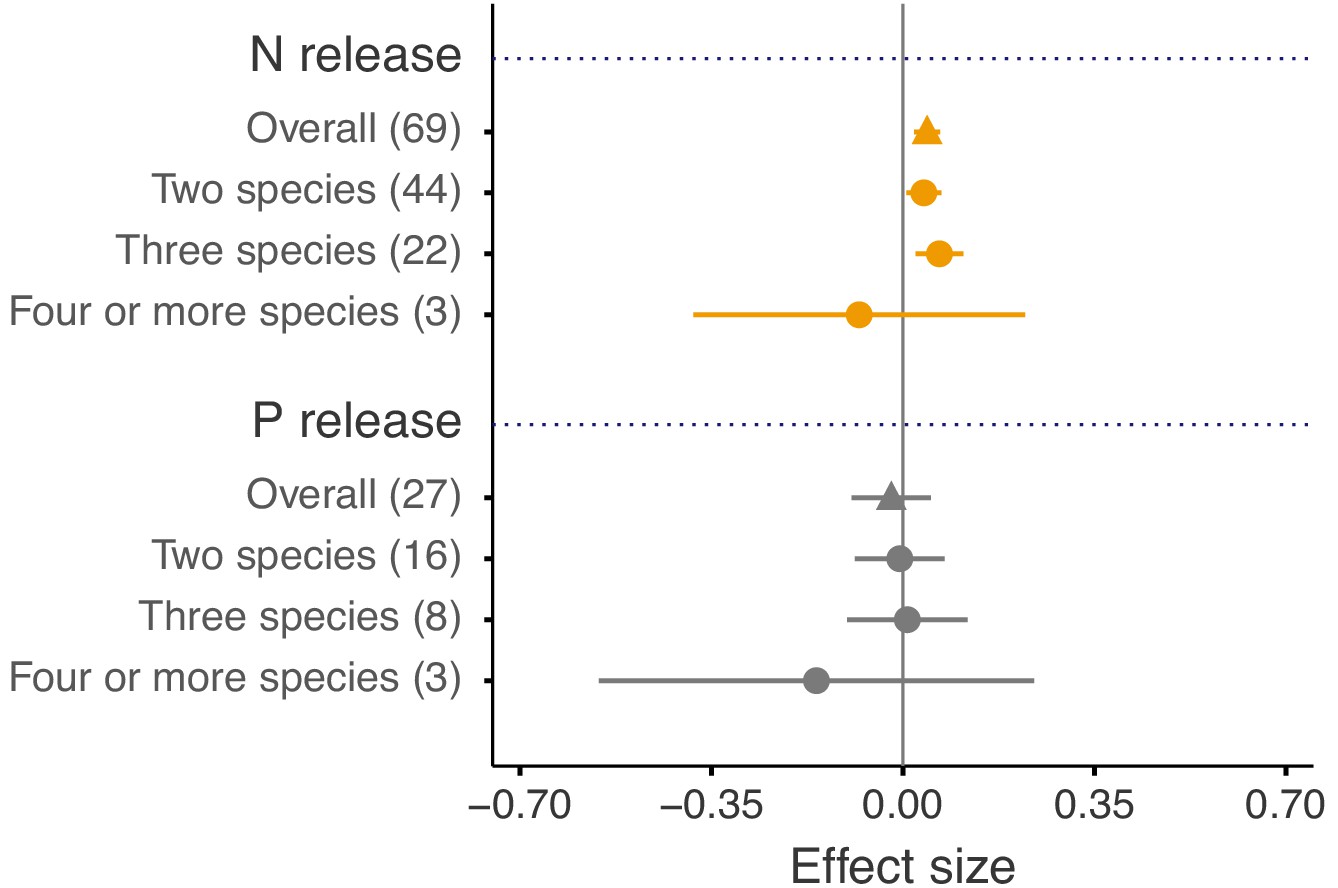
Overall average of N and P release and for each species richness level separately.
Overall average of N and P release (triangles) and for each species richness level separately (circles). Effect sizes were calculated as the log response ratio between observed and expected values for each response variable and 95% bootstrap confidence intervals (CI) are shown. When there were several harvests through time, only the data from the final harvest were used for the calculation of effect sizes. The solid vertical black line indicates no effects (mean effect size = 0, observed values = expected values). Mean effect size >0 indicates synergistic effects (observed values > expected values), while mean effect size <0 indicates antagonistic effects (observed values < expected values). The non-additive effects (synergistic or antagonistic) are significant at α = 0.05 if the CI of the effect size does not overlap 0, while the effects are additive when there is overlap. The values in parentheses denote the number of observations.
Figure 3
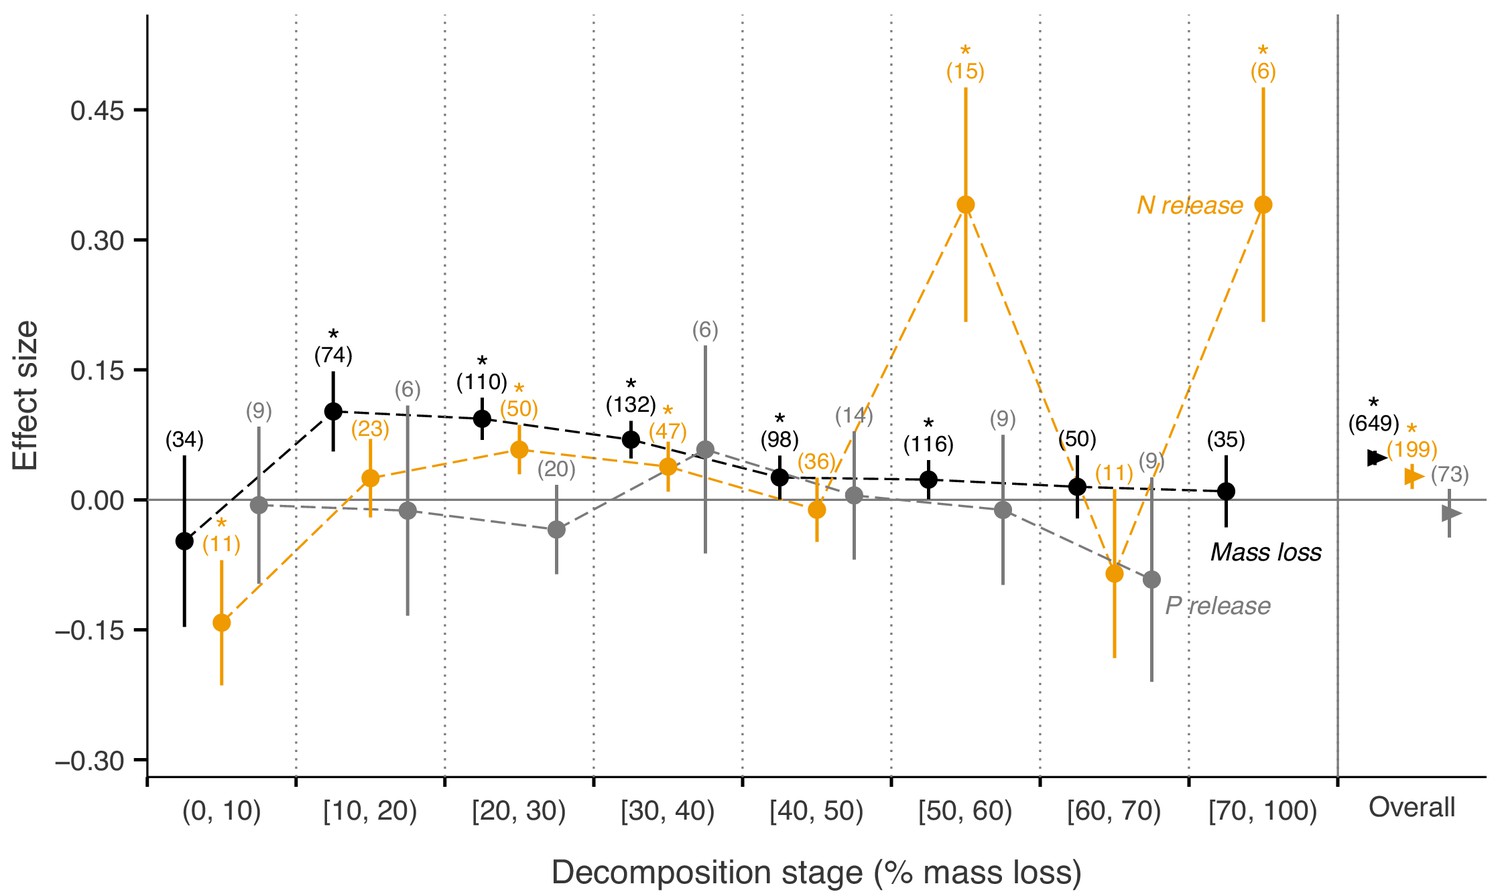
Litter mixture effects on mass loss (solid black triangles or circles), N release (solid yellow triangles or circles), and P release (solid grey triangles or circles) at different mass-loss intervals during the decomposition process (% mass loss indicated the expected values calculated from the mass loss of the individual component species).
Effect sizes were calculated as the log response ratio between observed and expected values for each response variable and 95% bootstrap confidence intervals (CI) are shown. Data at each harvest time of the decomposition experiment were used to calculate the effect size of each variable. We created intervals of 10% increments in mass loss up to 70% of mass loss, but did not distinguish further the final interval from 70% to 100%, because of only few observations within this range of mass loss. The slightly different positions of symbols within each interval is to better differentiate among curves of mass loss, N release, and P release and has no other meaning. The solid horizontal black line indicates no effects (mean effect size = 0, observed values = expected values). Mean effect size >0 indicates synergistic effects (observed values > expected values), while mean effect size <0 indicates antagonistic effects (observed values < expected values). The non-additive effects (synergistic or antagonistic) are significant at α = 0.05 if the CI of the effect size does not overlap with the zero line, while the effects are additive when there is overlap. Values in parentheses above the symbols denote the number of observations and asterisks indicate a significant mixture effect (i.e. a significant deviation from 0).
Figure 4 with 2 supplements
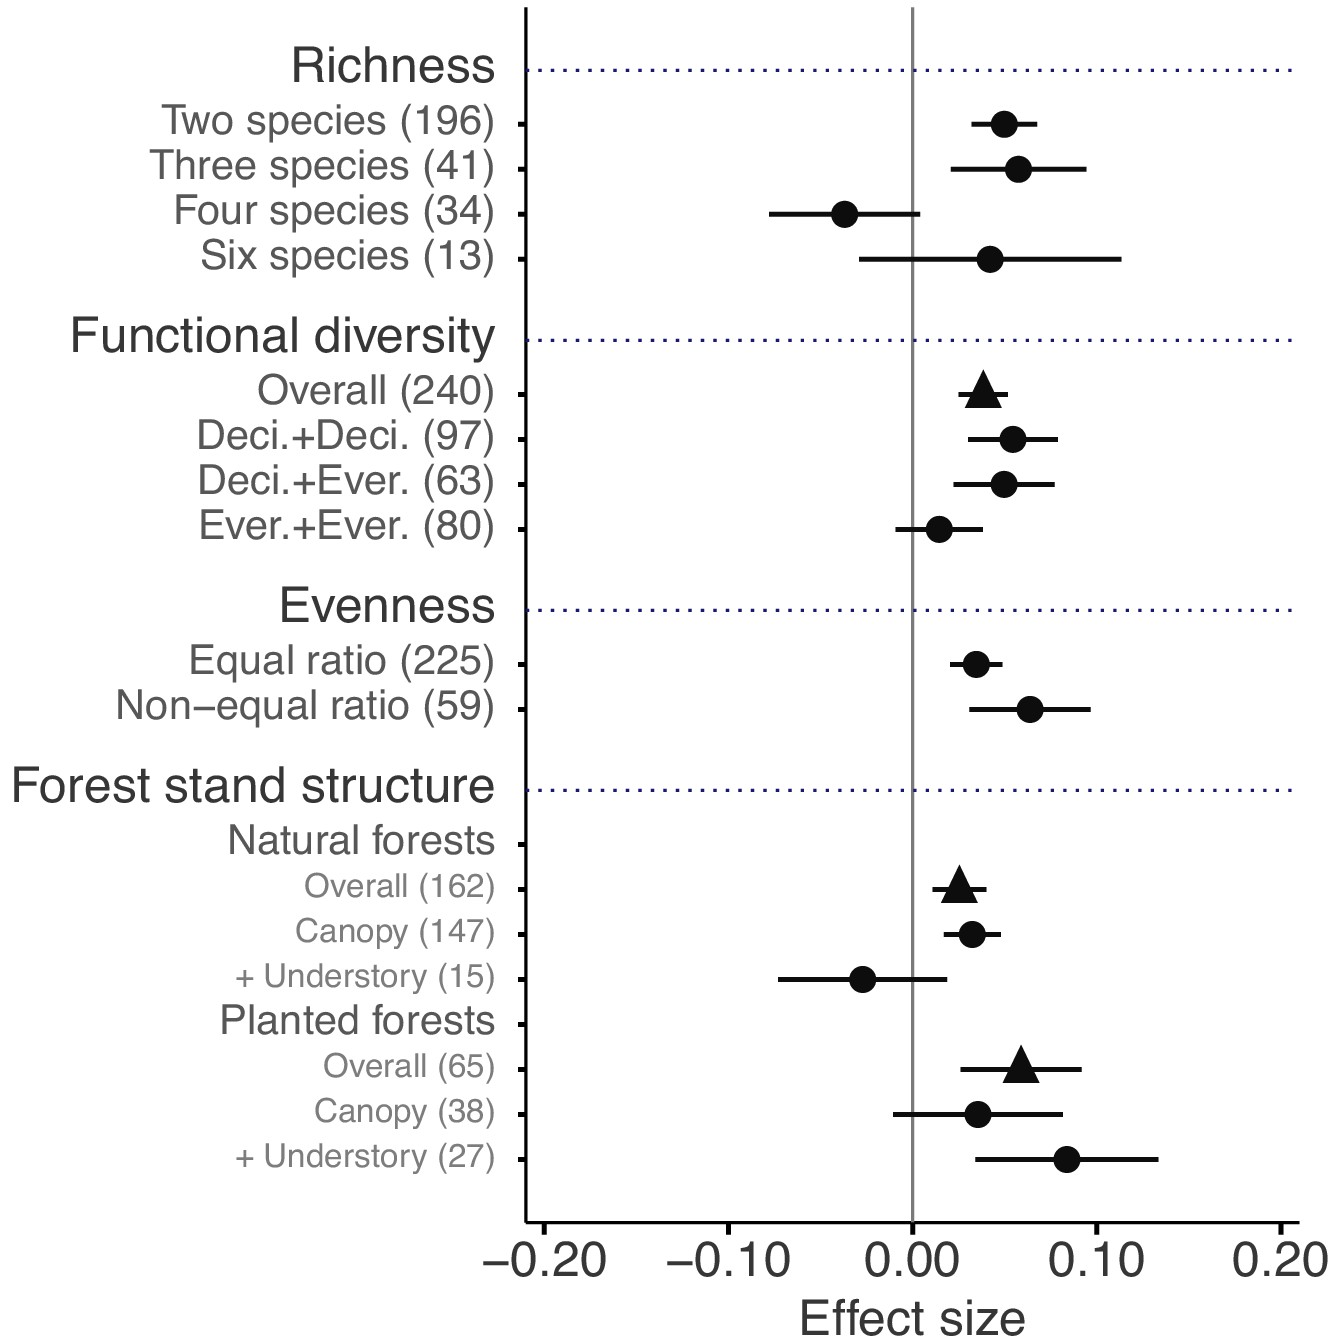
Litter mixture effects on mass loss as a function of the number of species present in litter mixtures, functional diversity (here defined on the basis of leaf habit), evenness in mixtures, and forest stand structure, which is distinguished between natural and planted forests.
Effect sizes were calculated as the log response ratio between observed and expected values for each response variable and 95% bootstrap confidence intervals (CI) are shown. When there were several harvests through time, only the data from the final harvest were used for the calculation of effect sizes. The solid vertical black line indicates no effects (mean effect size = 0, observed values = expected values). Mean effect size >0 indicates synergistic effects (observed values > expected values), while mean effect size <0 indicates antagonistic effects (observed values < expected values). The non-additive effects (synergistic or antagonistic) are significant at α = 0.05 if the CI of the effect size does not overlap 0, while the effects are additive when there is overlap. The values in parentheses denote the number of observations. Deci. and Ever. stand for deciduous and evergreen woody species, respectively. Forest stand structure distinguishes between the overall effect (triangles), the effect of exclusively canopy species (‘canopy’), and the effect when understory plant species were included in the studies (‘+ understory’).
Figure 4—figure supplement 1
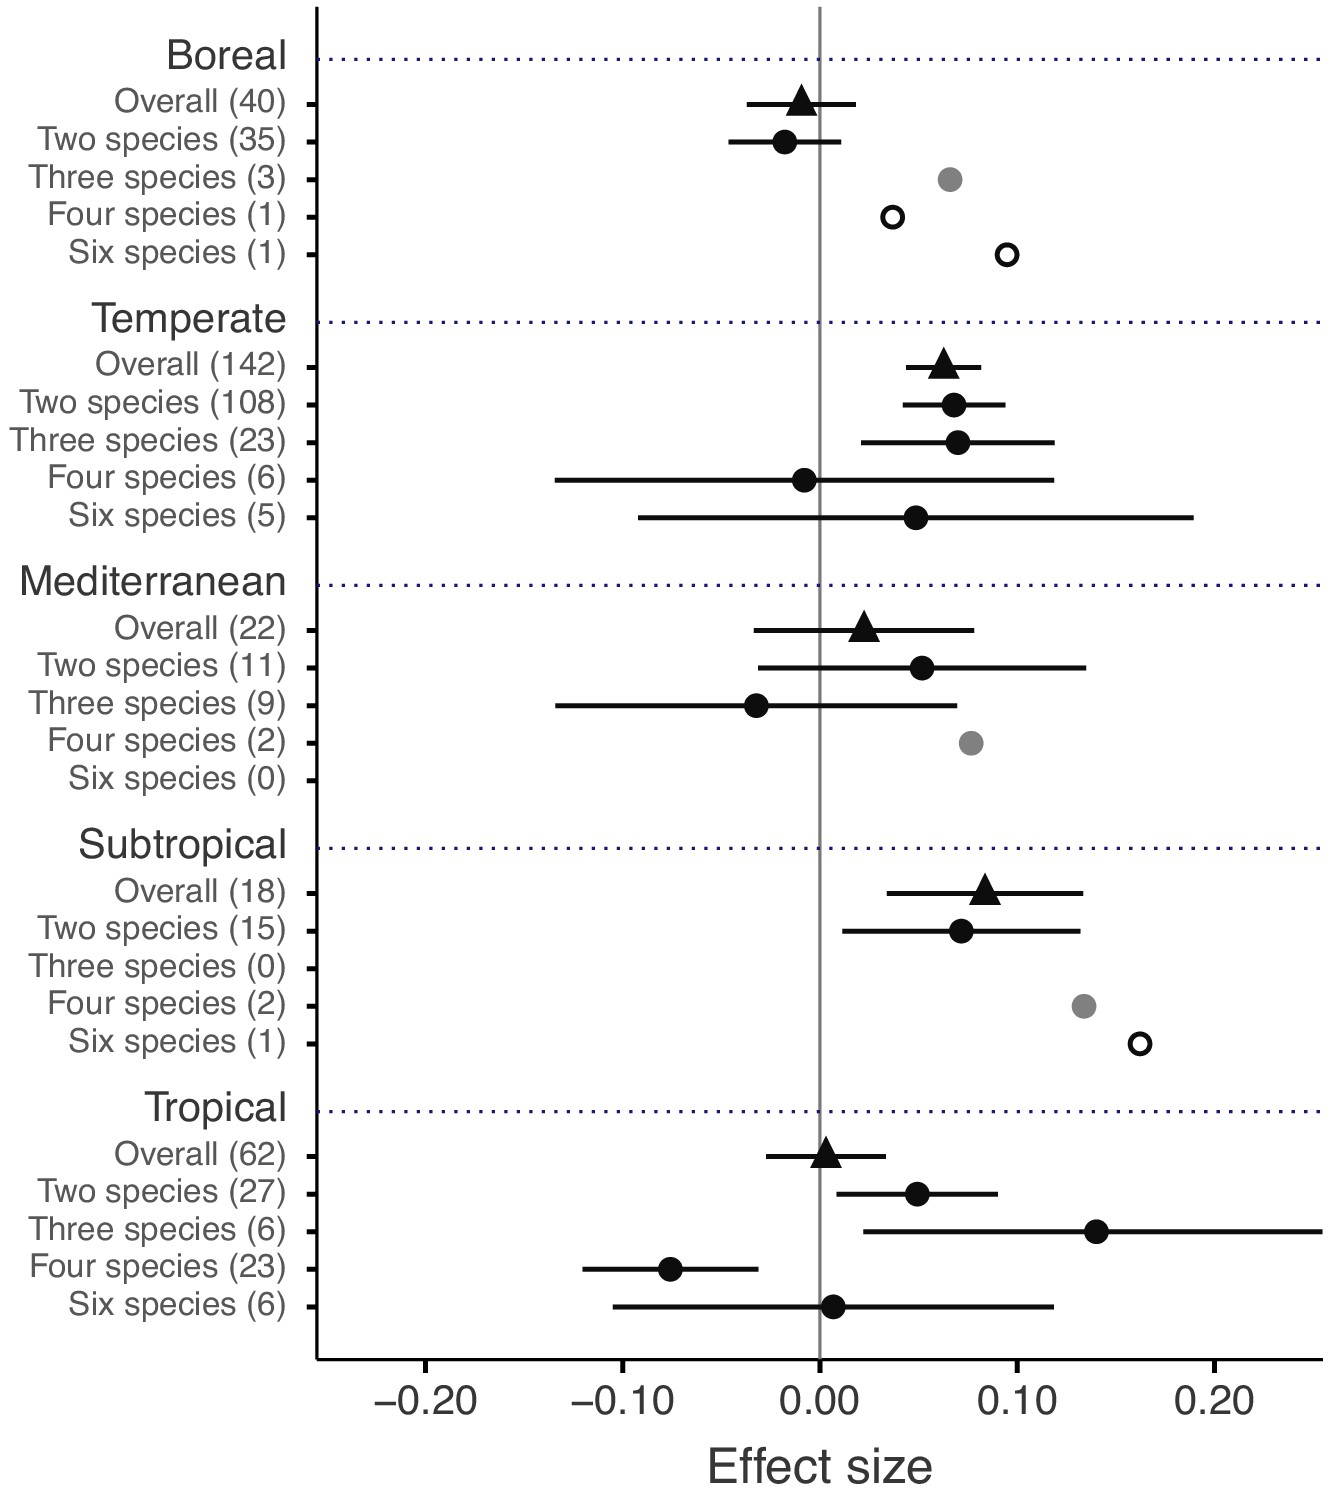
Litter mixture effects on mass loss for each biome separately and distinguishing among overall and species richness level-specific effects.
Litter mixture effects on mass loss for each biome separately and distinguishing among overall (triangles) and species richness level-specific (circles) effects. Effect sizes were calculated as the log response ratio between observed and expected values for each response variable and 95% bootstrap confidence intervals (CI) are shown. Data from the final harvest time of the decomposition experiment (if there was more than one harvest) were used to calculate the effect size of each variable. The solid vertical black line indicates no effects (mean effect size = 0, observed values = expected values). Mean effect size >0 indicates synergistic effects (observed values > expected values), while mean effect size <0 indicates antagonistic effects (observed values < expected values). The non-additive effects (synergistic or antagonistic) are significant at α = 0.05 if the CI of the effect size does not overlap 0, while the effects are additive when there is overlap. The values in parentheses denote the number of observations. The open and grey circles indicate sample sizes that were too low to run statistics and 95% bootstrap CI that was too large to show, respectively.
Figure 4—figure supplement 2
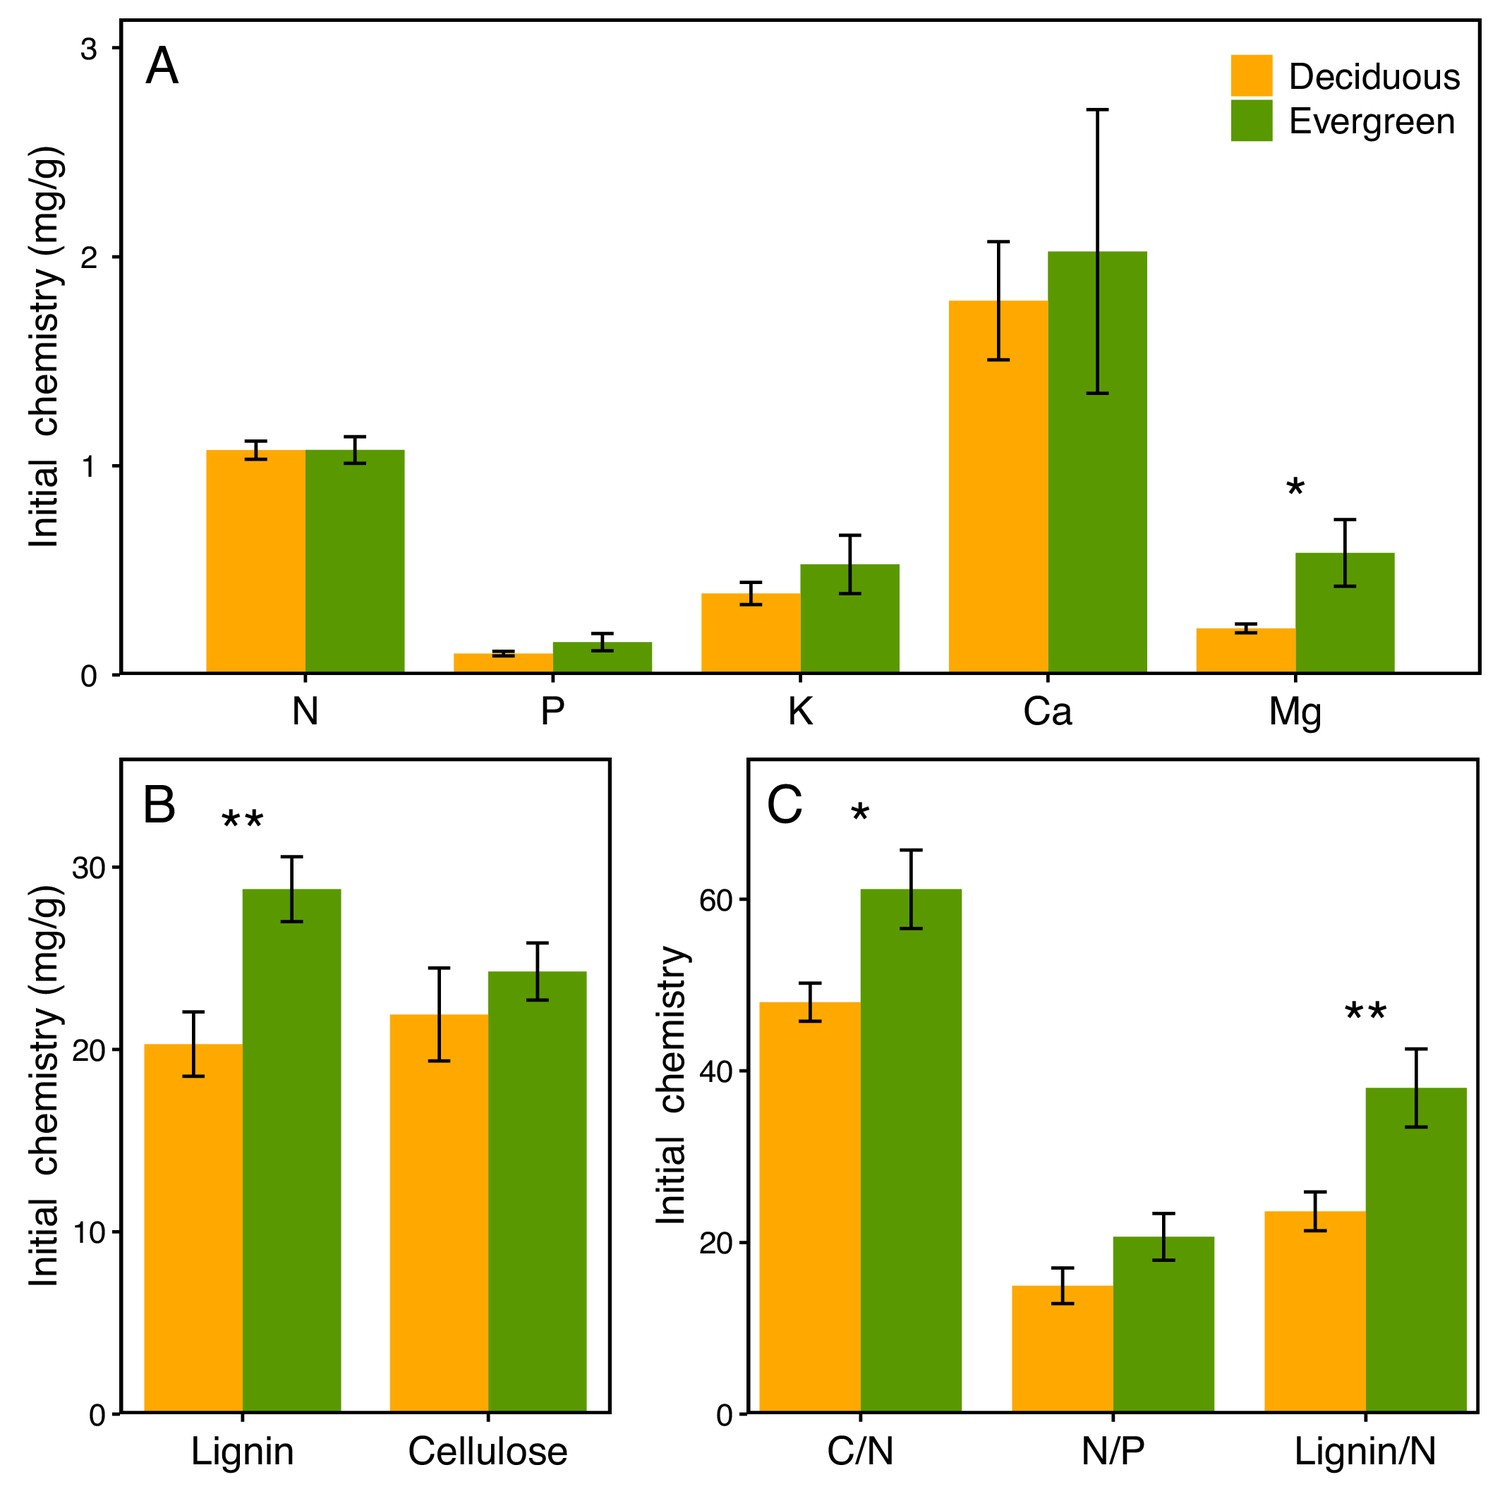
Initial quality of leaf litter from deciduous and evergreen species included in the meta-analysis.
Initial quality of leaf litter from deciduous (n = 82) and evergreen (n = 81) species included in the meta-analysis. The specific number of deciduous or evergreen species varied among the different litter quality parameters, because not all parameters were measured for all species.
Figure 5 with 1 supplement
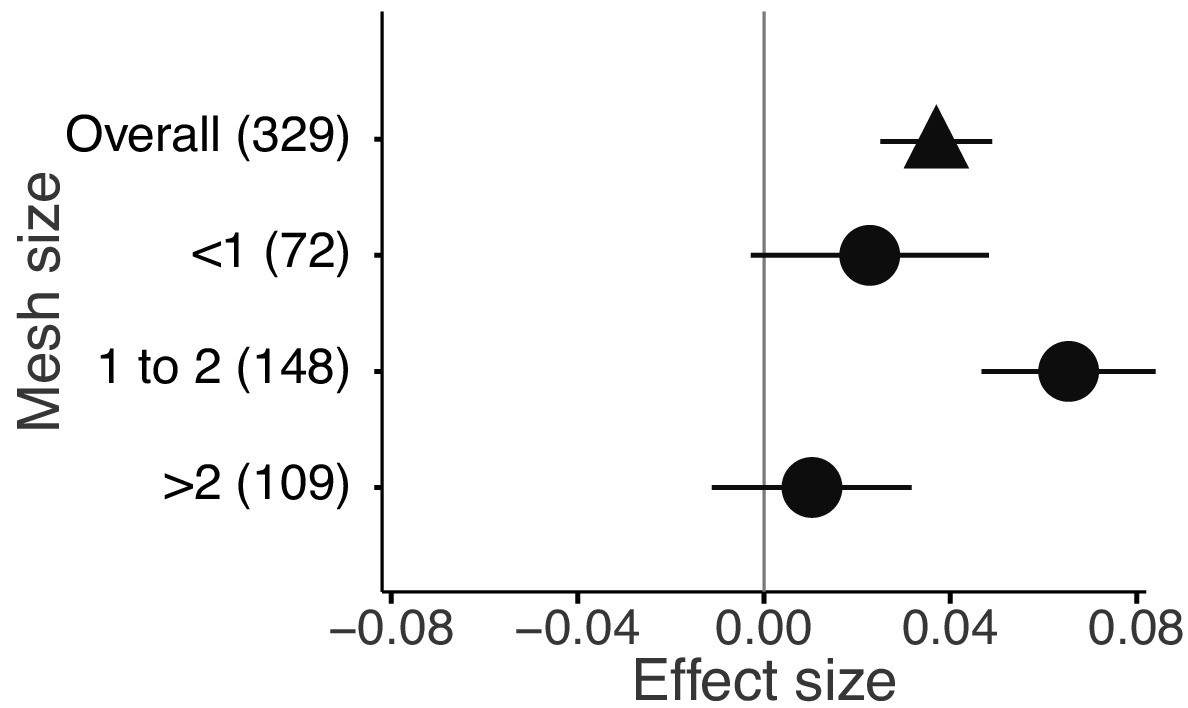
Litter mixture effects on mass loss from litterbags with different mesh sizes.
Effect sizes were calculated as the log response ratio between observed and expected values for each response variable and 95% bootstrap confidence intervals (CI) are shown. Data from the final harvest of the decomposition experiment were used to calculate the effect sizes. The solid vertical black line indicates no effects (mean effect size = 0, observed values = expected values). Mean effect size >0 indicates synergistic effects (observed values > expected values), while mean effect size <0 indicates antagonistic effects (observed values < expected values). The non-additive effects (synergistic or antagonistic) are significant at α = 0.05 if the CI of the effect size does not overlap 0, while the effects are additive when there is overlap. The values in parentheses denote the number of observations.
Figure 5—figure supplement 1

Litter mixture effects on mass loss from litterbags for each biome separately and distinguishing among overall and mesh size-specific effects.
Litter mixture effects on mass loss from litterbags for each biome separately and distinguishing among overall (triangles) and mesh size-specific (circles) effects. Effect sizes were calculated as the log response ratio between observed and expected values for each response variable and 95% bootstrap confidence intervals (CI) are shown. Data from the final harvest of the decomposition experiment were used to calculate the effect sizes. The solid vertical black line indicates no effects (mean effect size = 0, observed values = expected values). Mean effect size >0 indicates synergistic effects (observed values > expected values), while mean effect size <0 indicates antagonistic effects (observed values < expected values). The non-additive effects (synergistic or antagonistic) are significant at α = 0.05 if the CI of the effect size does not overlap 0, while the effects are additive when there is overlap. The values in parentheses denote the number of observations. The grey circles indicate 95% bootstrap CI that was too large to show.
Figure 6
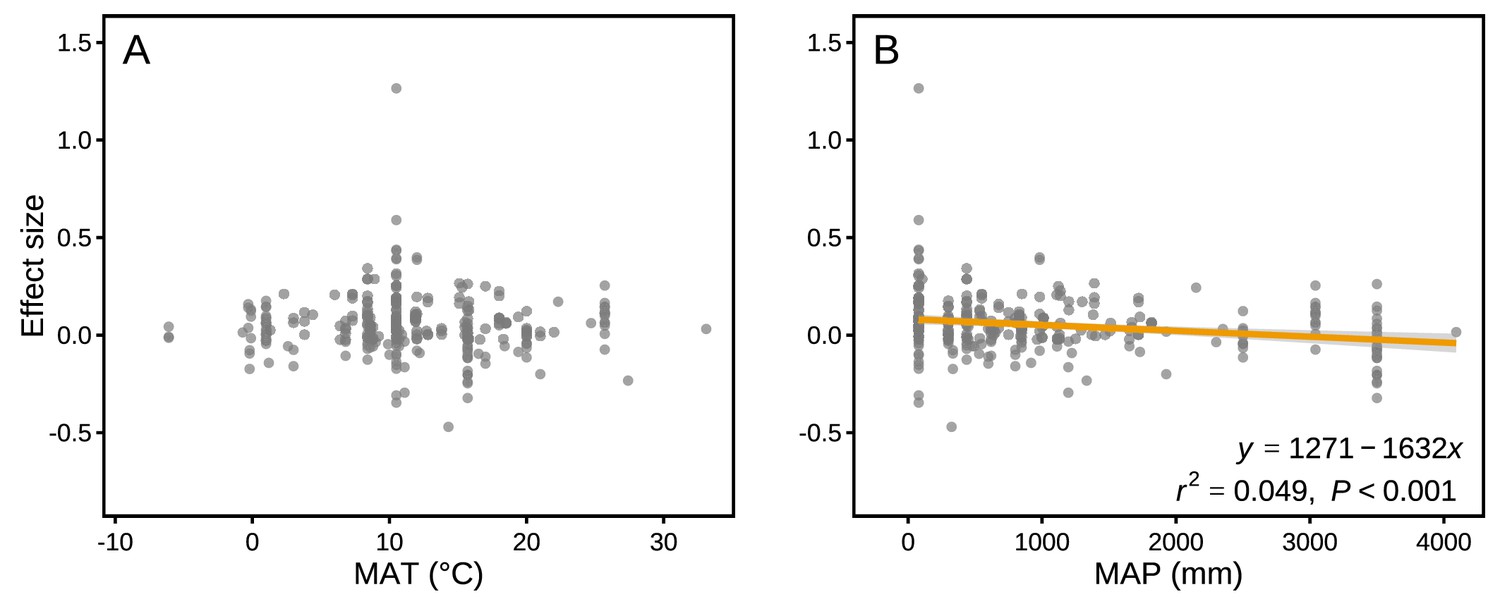
Mixture effects on mass loss (effect size) across all studies included in our synthesis as a function of mean annual temperature (MAT; A) and mean annual precipitation (MAP; B).
Data from the final harvest of the decomposition experiment were used to calculate the effect sizes.
Figure 7

Litter mixture effects on mass loss (effect size) as a function of the divergence in initial litter quality among component litter species in a mixture.
Trait divergence was calculated following Rao’s quadratic entropy (see Equation 3) and the Euclidean distance (see Equation 4). The mixture effects represent the data for the decomposition process between 10% and 40% of mass loss, during which the strongest non-additive effects were observed (see Figure 3). The correlations remained significant for Ca (r2 = 0.319, p=0.001) and Mg (r2 = 0.368, p=0.001) even without the data points clustered on the right of the graphs.
Additional files
-
Supplementary file 1
Location and climatic conditions of studies used in the meta-analysis.
Data were extracted from corresponding references or the WorldClim database.
- https://cdn.elifesciences.org/articles/55813/elife-55813-supp1-v2.xlsx
-
Supplementary file 2
The relative and absolute N and P release from single litter species treatments and litter mixtures consisting of different numbers of species across all studies included in our meta-analysis.
- https://cdn.elifesciences.org/articles/55813/elife-55813-supp2-v2.xlsx
-
Supplementary file 3
Functional type and life form of species included in the meta-analysis.
- https://cdn.elifesciences.org/articles/55813/elife-55813-supp3-v2.xlsx
-
Supplementary file 4
Divergence in initial chemical traits among component litter species in 284 mixtures included in this study.
Values are calculated based on the Equation 3 shown in materials and methods. “– “denotes not provided values.
- https://cdn.elifesciences.org/articles/55813/elife-55813-supp4-v2.xlsx
-
Transparent reporting form
- https://cdn.elifesciences.org/articles/55813/elife-55813-transrepform-v2.docx
Download links
A two-part list of links to download the article, or parts of the article, in various formats.
Downloads (link to download the article as PDF)
Open citations (links to open the citations from this article in various online reference manager services)
Cite this article (links to download the citations from this article in formats compatible with various reference manager tools)
Diversity-decomposition relationships in forests worldwide
eLife 9:e55813.
https://doi.org/10.7554/eLife.55813


