The dynamic interplay of host and viral enzymes in type III CRISPR-mediated cyclic nucleotide signalling
- Biomedical Sciences Research Complex, School of Biology, University of St Andrews, United Kingdom
Figures
Figure 1
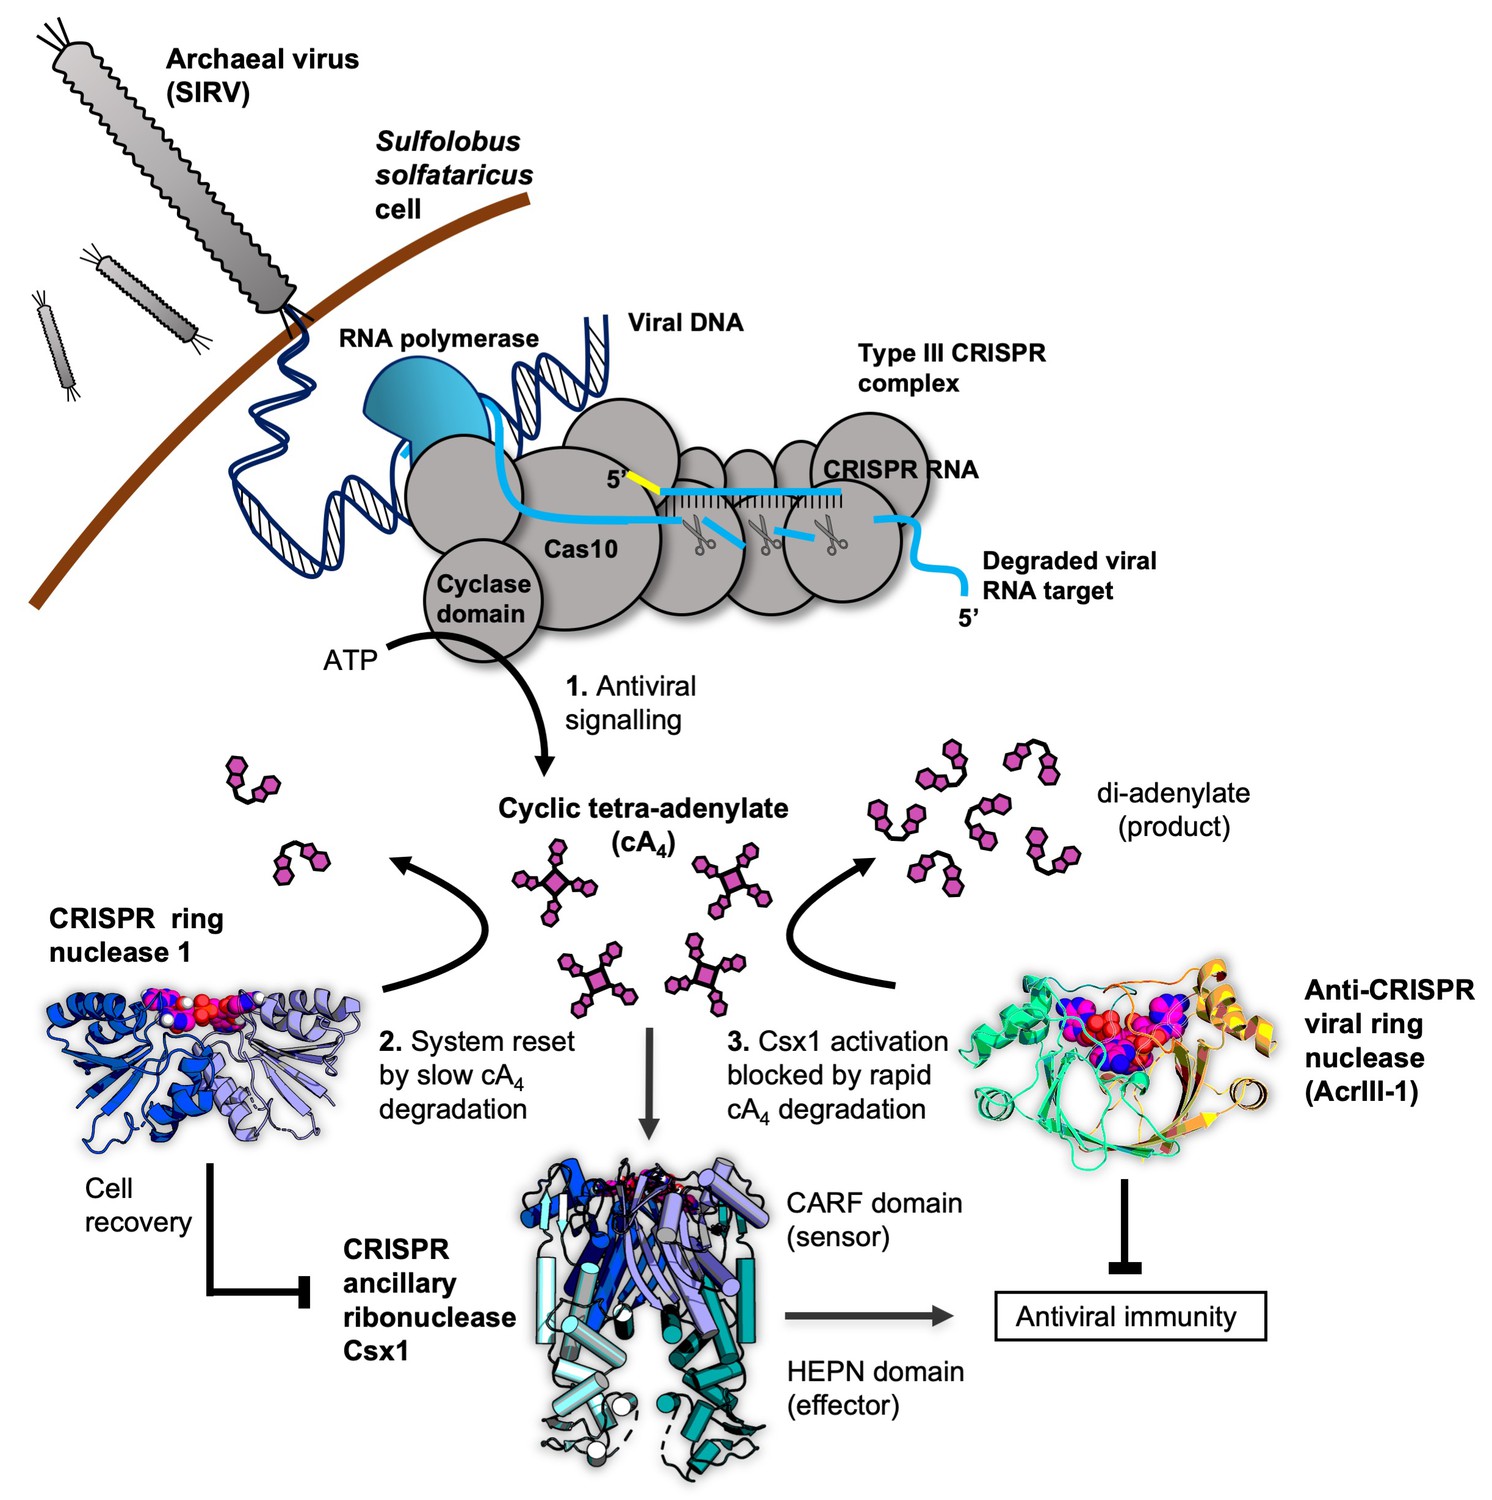
Cartoon of type III CRISPR cyclic nucleotide signalling and defence in Sulfolobus solfataricus.
The Cas10 subunit of the type III CRISPR complex synthesises cyclic tetra-adenylate (cA4) when viral RNA transcripts are detected. Target RNA cleavage shuts-off cA4 synthesis. cA4 binds to the CARF (CRISPR associated Rossmann Fold) domain of CRISPR ancillary nuclease Csx1 and allosterically activates its HEPN (Higher Eukaryotes and Prokaryotes Nucleotide binding) domain, which degrades RNA non-specifically within the cell. Extant cA4 is degraded slowly by CRISPR ring nucleases (Crn1 family) which likely facilitate cell recovery after clearing the virus. Viral anti-CRISPR ring nucleases (AcrIII-1 family) degrade cA4 rapidly to stop activation of ancillary defence enzymes such as Csx1 and supress antiviral immunity.
Figure 2 with 2 supplements

Approximately 1000 molecules cA4 are made per molecule of RNA target.
(A) Upper panel shows phosphorimages of thin-layer chromatography of cyclic tetra-adenylate (cA4) made by S. solfataricus (Sso) Csm complex (470 nM carrying the CRISPR RNA A26) across a range of RNA target concentrations (0.1, 1, 10, 25,100 nM) complementary to the A26 CRISPR RNA at 70°C. Lower panel shows cA4 synthesised with a cleavage resistant (phosphorothioate) form of the RNA target. (B) Bar graph of the concentration of cA4 generated with increasing cleavable and cleavage-resistant RNA target generated by quantifying the densiometric signals from A, with an α-32P-ATP standard curve (Figure 2—figure supplement 1). Error bars indicate the standard deviation of the mean of three technical replicates, with individual data points shown as clear circles. No data are shown for 1 nM cleavable RNA target as cA4 generated was below detection limits. (C) Bar chart quantifying the number of molecules of cA4 generated per molecule of cleavable or cleavage resistant target RNA across a range of RNA target concentrations. On average SsoCsm synthesised 980 ± 24 and 3100 ± 750 molecules of cA4 per molecule of cleavable and cleavage resistant target RNA, respectively. (D) Cartoon depicting the cellular implications of ~1000 molecules of cA4 generated per molecule of RNA target, which in S. solfataricus would equate to ~6 µM cA4 within the cell.
-
Figure 2—source data 1
Excel spreadsheet with raw data.
- https://cdn.elifesciences.org/articles/55852/elife-55852-fig2-data1-v2.xlsx
Figure 2—figure supplement 1
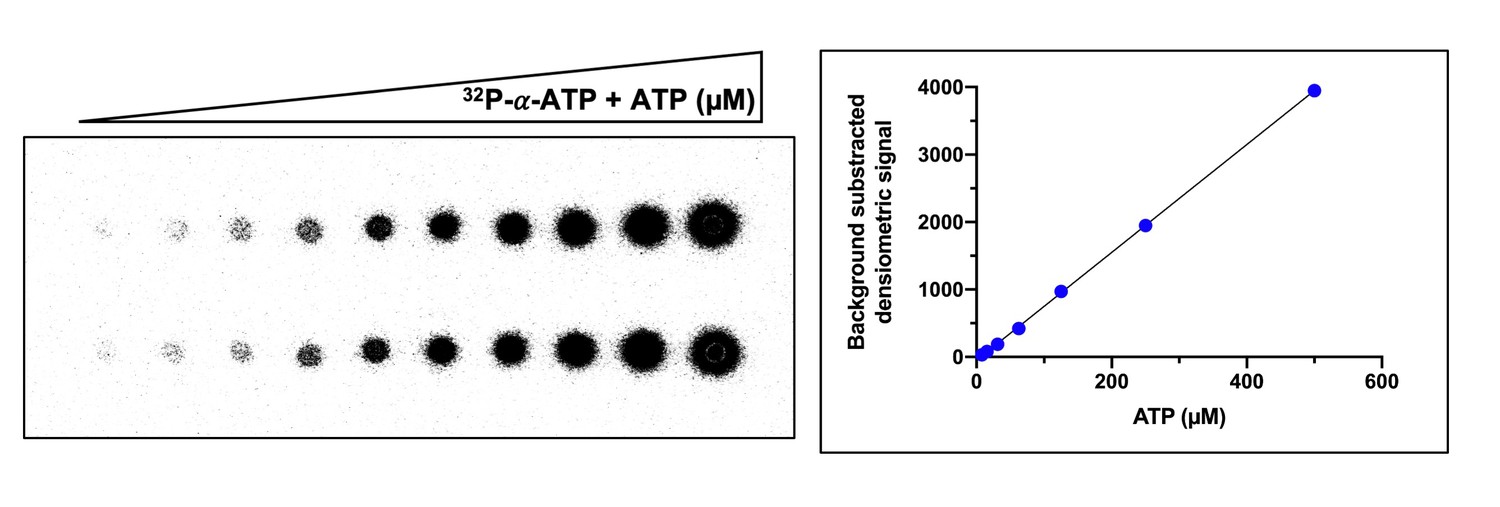
Example of ATP standard curve used to determine the concentration of ATP converted to cyclic tetra-adenylate (cA4).
Left-hand side panel shows duplicate serial dilution of 32P-α-ATP (5 nM) and ATP (500 µM) mix spotted (1 µl) on a thin-layer chromatography (TLC) plate. The right-hand side panel is a plot of the densiometric signal quantified from the TLC plate after phosphorimaging. The mean densiometric signal is plotted and errors bars showing the standard deviation are plotted but not visible due to their scale. The densiometric signal corresponding to cA4 was compared to the standard curve to determine the concentration of ATP converted. Duplicate standard curves were carried out for each replicate assay examining cA4 synthesis.
Figure 2—figure supplement 2
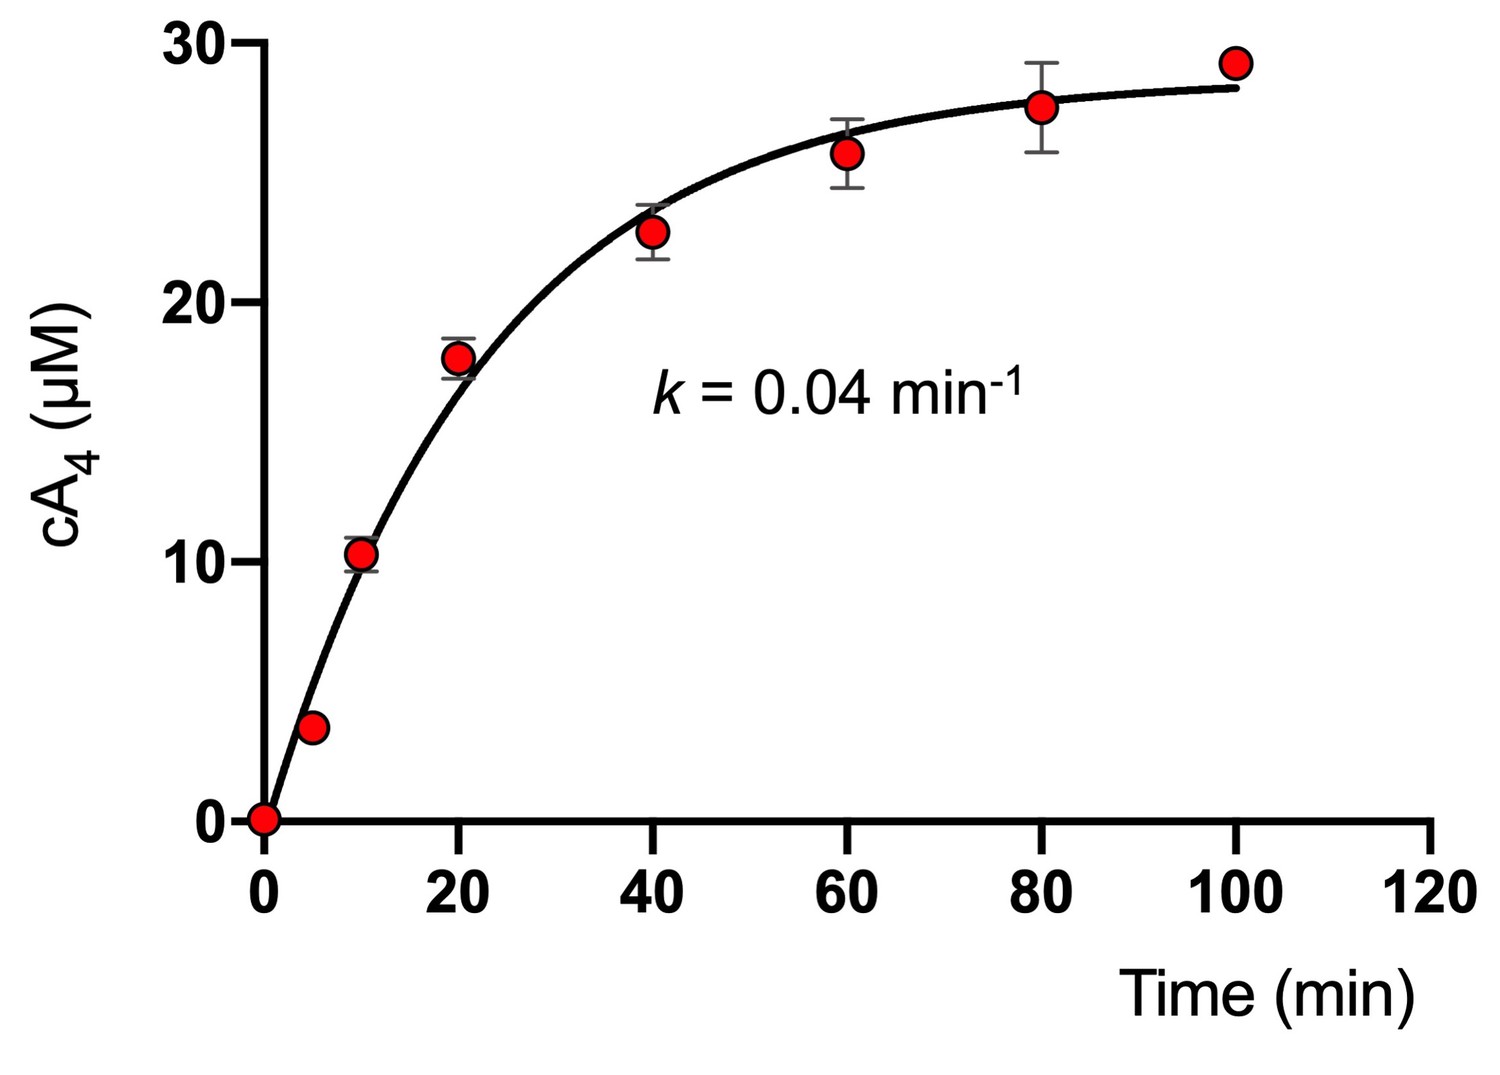
Rate of cA4 synthesis by S. solfataricus type III-D effector complex.
Plot showing the concentration of cA4 generated by SsoCsm (~4.2 µM) over time in the presence of 25 nM RNA target, 0.5 mM ATP and 2 nM 32P-α-ATP at 70°C. The data were originally reported in Rouillon et al. (2018) and here were fitted to an exponential equation to determine the kinetic rate constant of cA4 synthesis (0.04 ± 0.01 min−1). Error bars show the standard deviation of the mean of three technical replicates.
-
Figure 2—figure supplement 2—source data 1
Excel speadsheet with raw data.
- https://cdn.elifesciences.org/articles/55852/elife-55852-fig2-figsupp2-data1-v2.xlsx
Figure 3
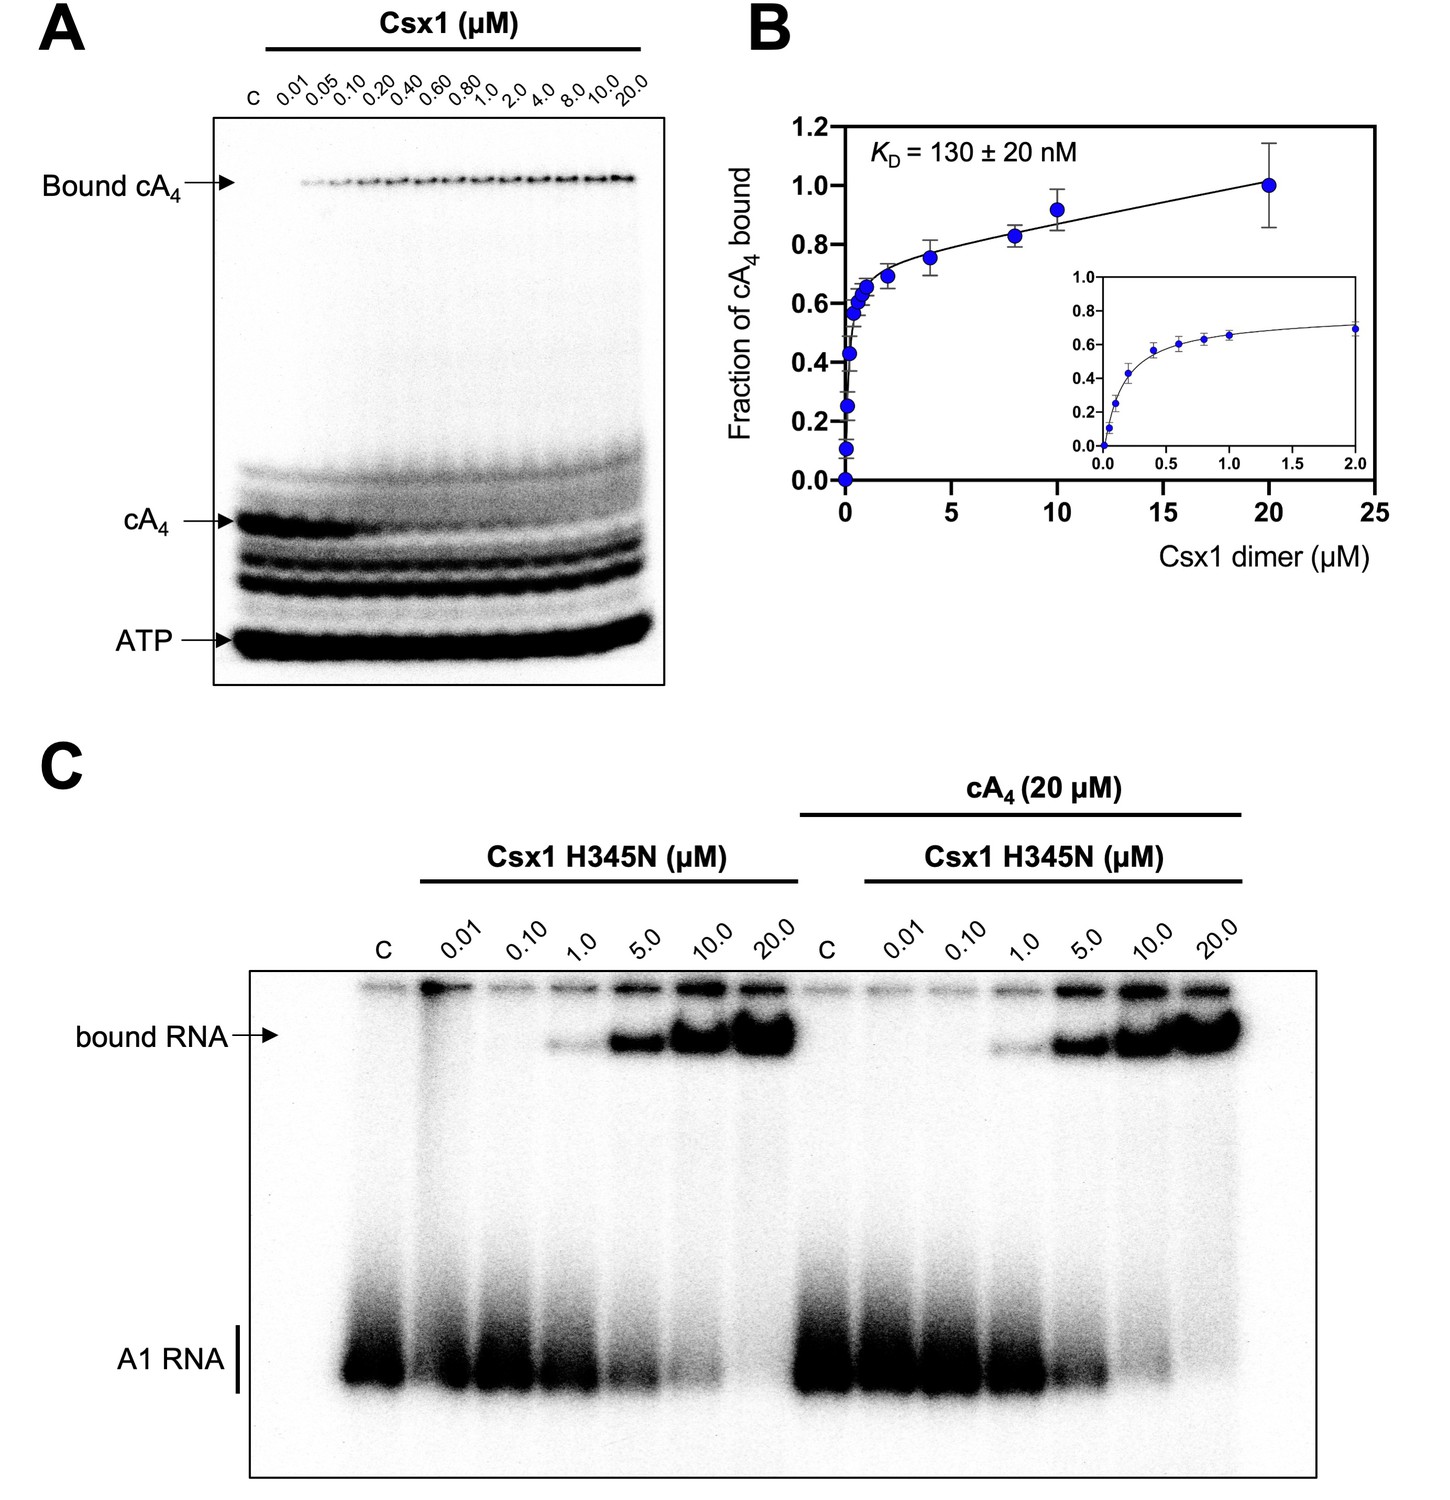
Csx1 binds cA4 with high affinity and RNA with relatively low affinity.
(A) Phosphorimage of native gel electrophoresis visualising cA4 (20 nM) binding by Csx1 (concentrations as indicated in the figure). The other bands visible are due to unreacted ATP and other linear nucleotide products. (B) Plot of fraction of cA4 bound by Csx1. Error bars indicate the standard deviation of the mean of four technical replicates and the data were fitted to a quadratic equation incorporating a term for non-specific binding. The inset plot is a magnification of cA4 binding between 0.01 and 5 µM Csx1 dimer concentrations. (C) Phosphorimage of native gel electrophoresis visualising A1 substrate RNA binding by Csx1 H345N protein dimer in the absence (left hand-side) or presence (right hand-side) of unlabelled cA4 (20 µM). The image shown is representative of three technical replicates. Control c – RNA alone.
-
Figure 3—source data 1
Csx1 binding to cA4 and RNA.
- https://cdn.elifesciences.org/articles/55852/elife-55852-fig3-data1-v2.xlsx
Figure 4
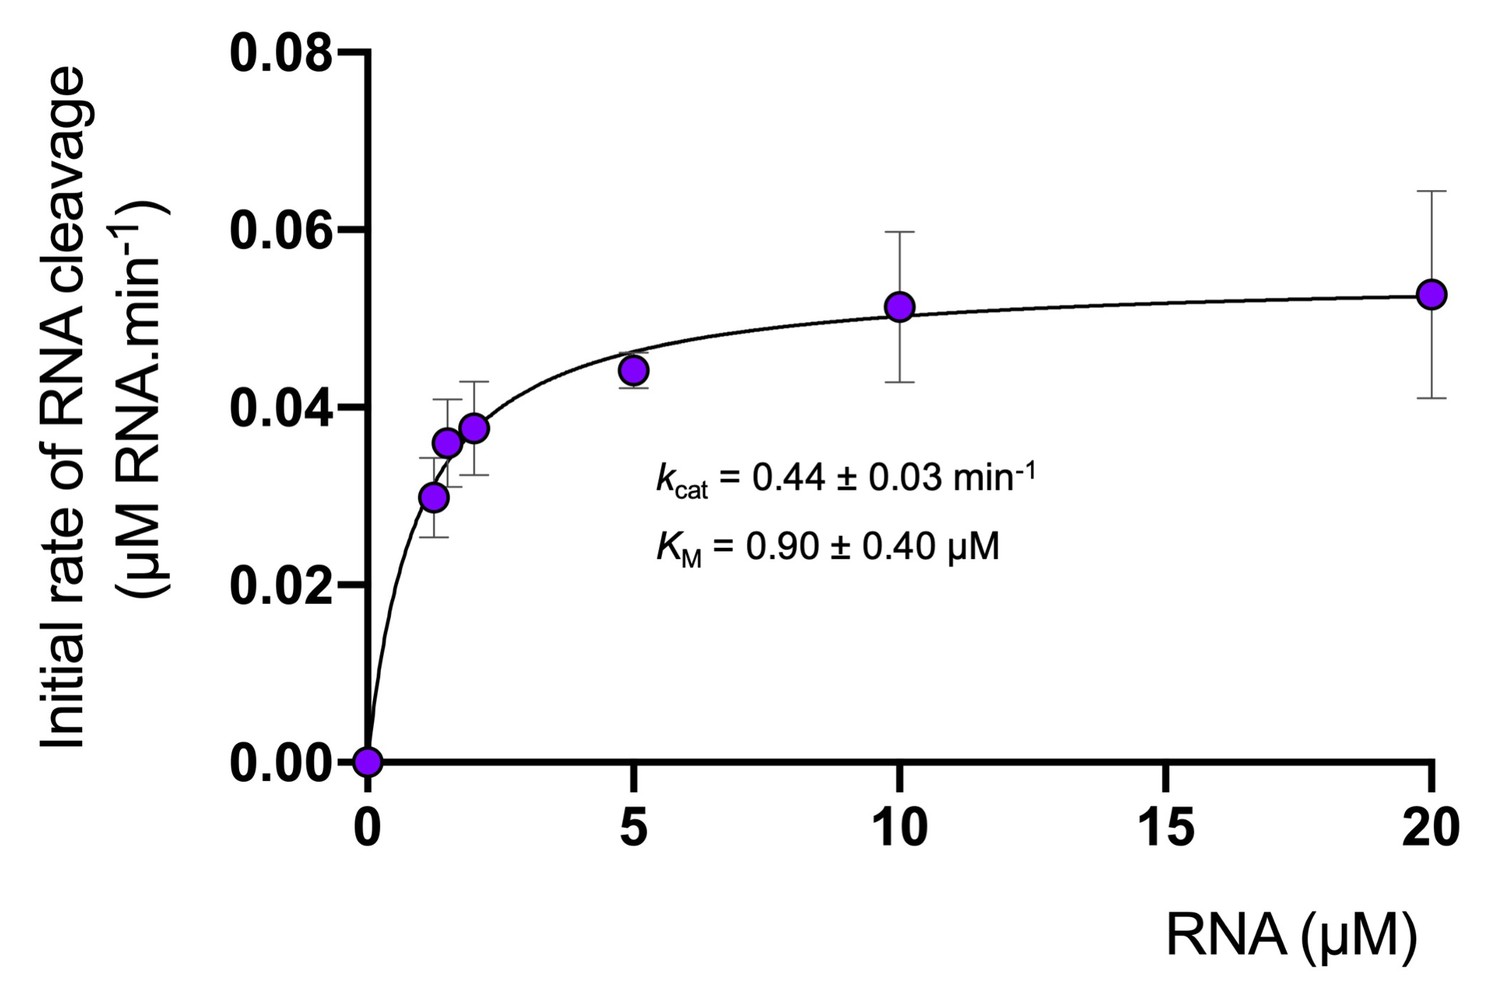
Degradation of RNA by Csx1.
Analysis of multiple-turnover, steady state kinetics of A1 RNA cleavage by Csx1 (125 nM dimer) at 70°C. The data were fitted to the Michaelis-Menten equation and error bars show the standard deviation of the mean of three technical replicates.
-
Figure 4—source data 1
Excel spreadsheet with data for kinetics of Csx1.
- https://cdn.elifesciences.org/articles/55852/elife-55852-fig4-data1-v2.xlsx
Figure 5
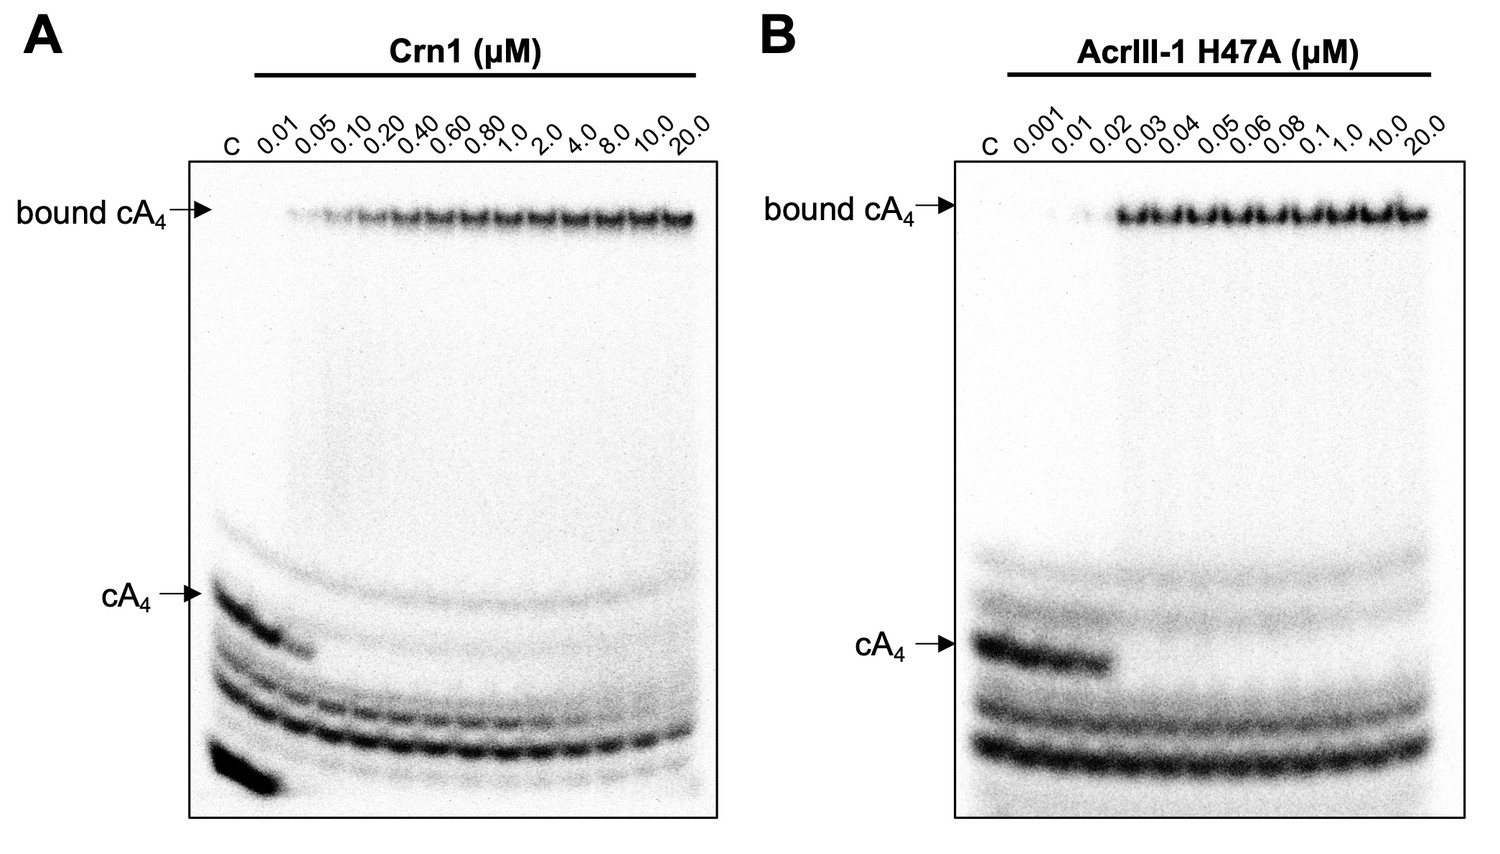
Crn1 and AcrIII-1 bind cA4 with high affinity.
Phosphorimages of native gel electrophoresis visualising radiolabelled cyclic oligoadenylate (cOA) binding by (A) Crn1 (B) and catalytically inactive AcrIII-1 (SIRV1 gp29 H47A). Crn1 binds cA4 (10 nM) with an apparent dissociation constant (KD) of ~50 nM, whereas AcrIII-1 binds cA4 with an apparent KD of ~25 nM. The images shown are representative of three technical replicates. Control c – cOA alone. The other bands near the bottom of the gel are caused by unreacted ATP and other linear products.
Figure 6 with 3 supplements
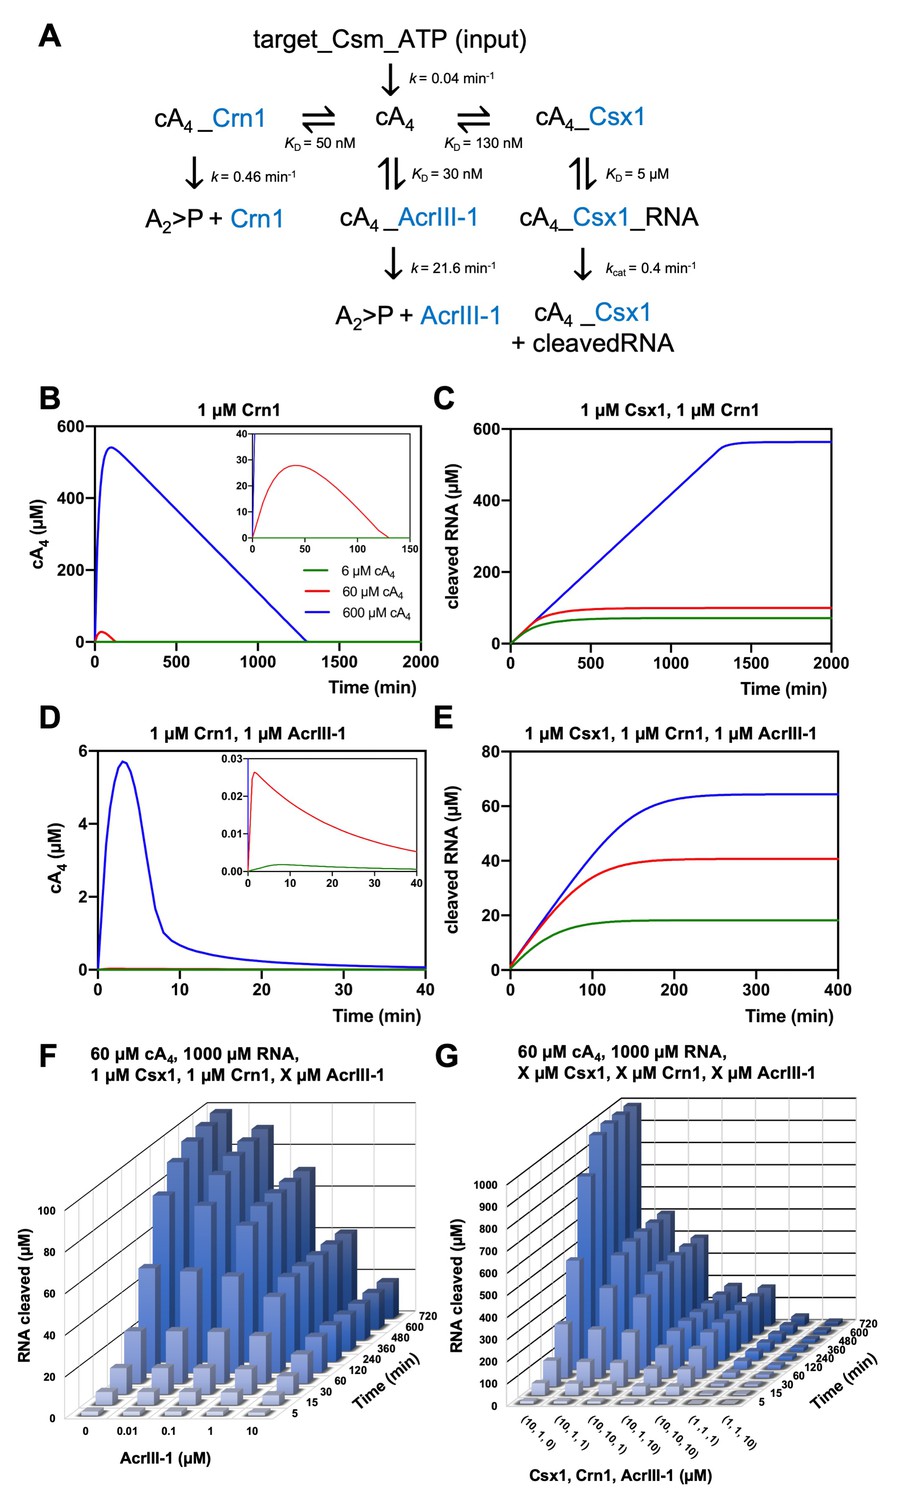
Modelling of S. solfataricus antiviral signalling.
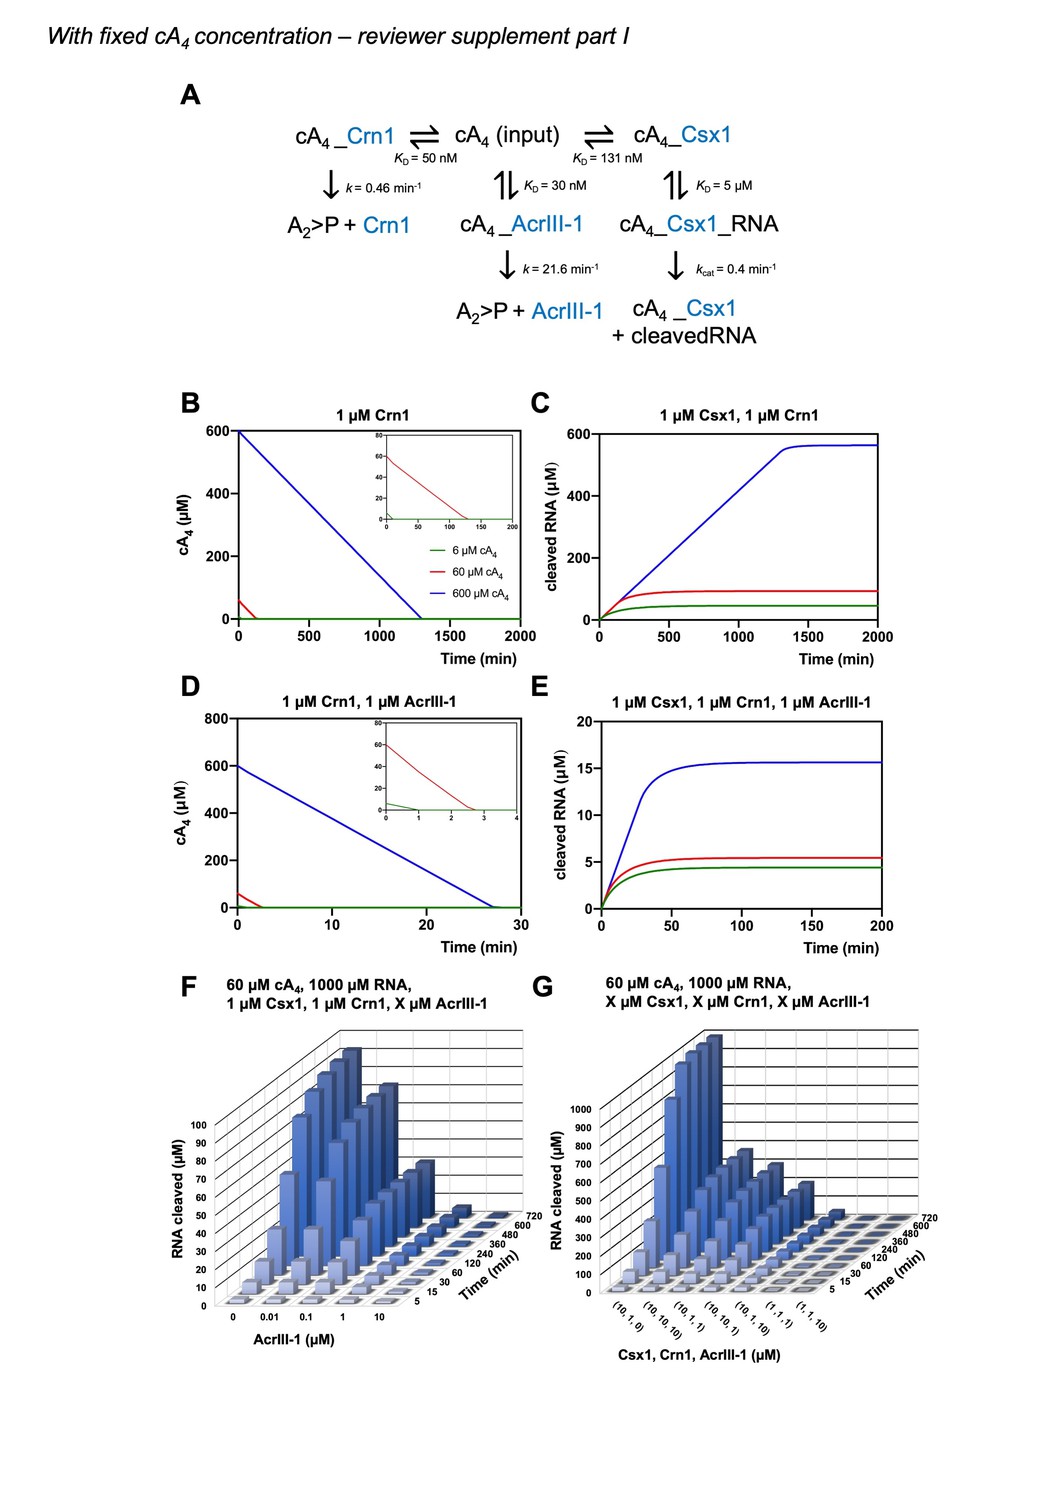
(A) Schematic showing kinetic and equilibrium parameters inserted into the KinTek Global Kinetic Explorer software for modelling the type III CRISPR defence illustrated in Figure 1. Parameters have been determined in this study with the following exceptions: Crn1 rate constant of 0.46 min−1 at 70°C estimated from rate of 0.23 min−1 measured at 60°C and AcrIII-1 rate constant of 21.6 min−1 at 70°C estimated from rate of 5.4 min−1 measured at 50°C (Athukoralage et al., 2020). The parameter ‘target-Csm-ATP’ was set at 6, 60 or 600 µM in simulations. Underscores connecting two variables indicate their relationship in a complex. cA4, cyclic tetra-adenylate; Crn1, CRISPR ring nuclease 1; AcrIII-1, viral ring nuclease anti-CRISPR SIRV1 gp29; Csx1, CRISPR ancillary ribonuclease; A2 >P, di-adenylate containing 2’,3’ cyclic phosphate (product of cA4 cleavage). (B) Free cA4 (600 µM, blue; 60 µM, red; 6 µM, green) concentration and (C), RNA cleavage in presence of 1 µM Crn1 and 1 µM Csx1. (D) and (E) show equivalent plots in the presence of 1 µM AcrIII-1. Insets where present show a magnified view of the start of each plot. (F) 3D plot visualising concentration of RNA (1000 µM at start) cleaved by Csx1 in response to 60 µM cA4 made by Csm complex, 1 µM Crn1 and varying amounts of AcrIII-1 across a range of doubling endpoints. (G) 3D plot visualising concentration of RNA (1000 µM at start) cleaved by Csx1 in response to 60 µM cA4 made by Csm complex, and varying concentrations of Csx1, Crn1 and AcrIII-1 enzymes.
-
Figure 6—source data 1
Raw data from modelling.
- https://cdn.elifesciences.org/articles/55852/elife-55852-fig6-data1-v2.xlsx
-
Figure 6—source data 2
Extracted data from modelling.
- https://cdn.elifesciences.org/articles/55852/elife-55852-fig6-data2-v2.xlsx
-
Figure 6—source code 1
KinTek model code for kinetic modelling in Figure 6.
- https://cdn.elifesciences.org/articles/55852/elife-55852-fig6-code1-v2.mec.zip
Figure 6—figure supplement 1
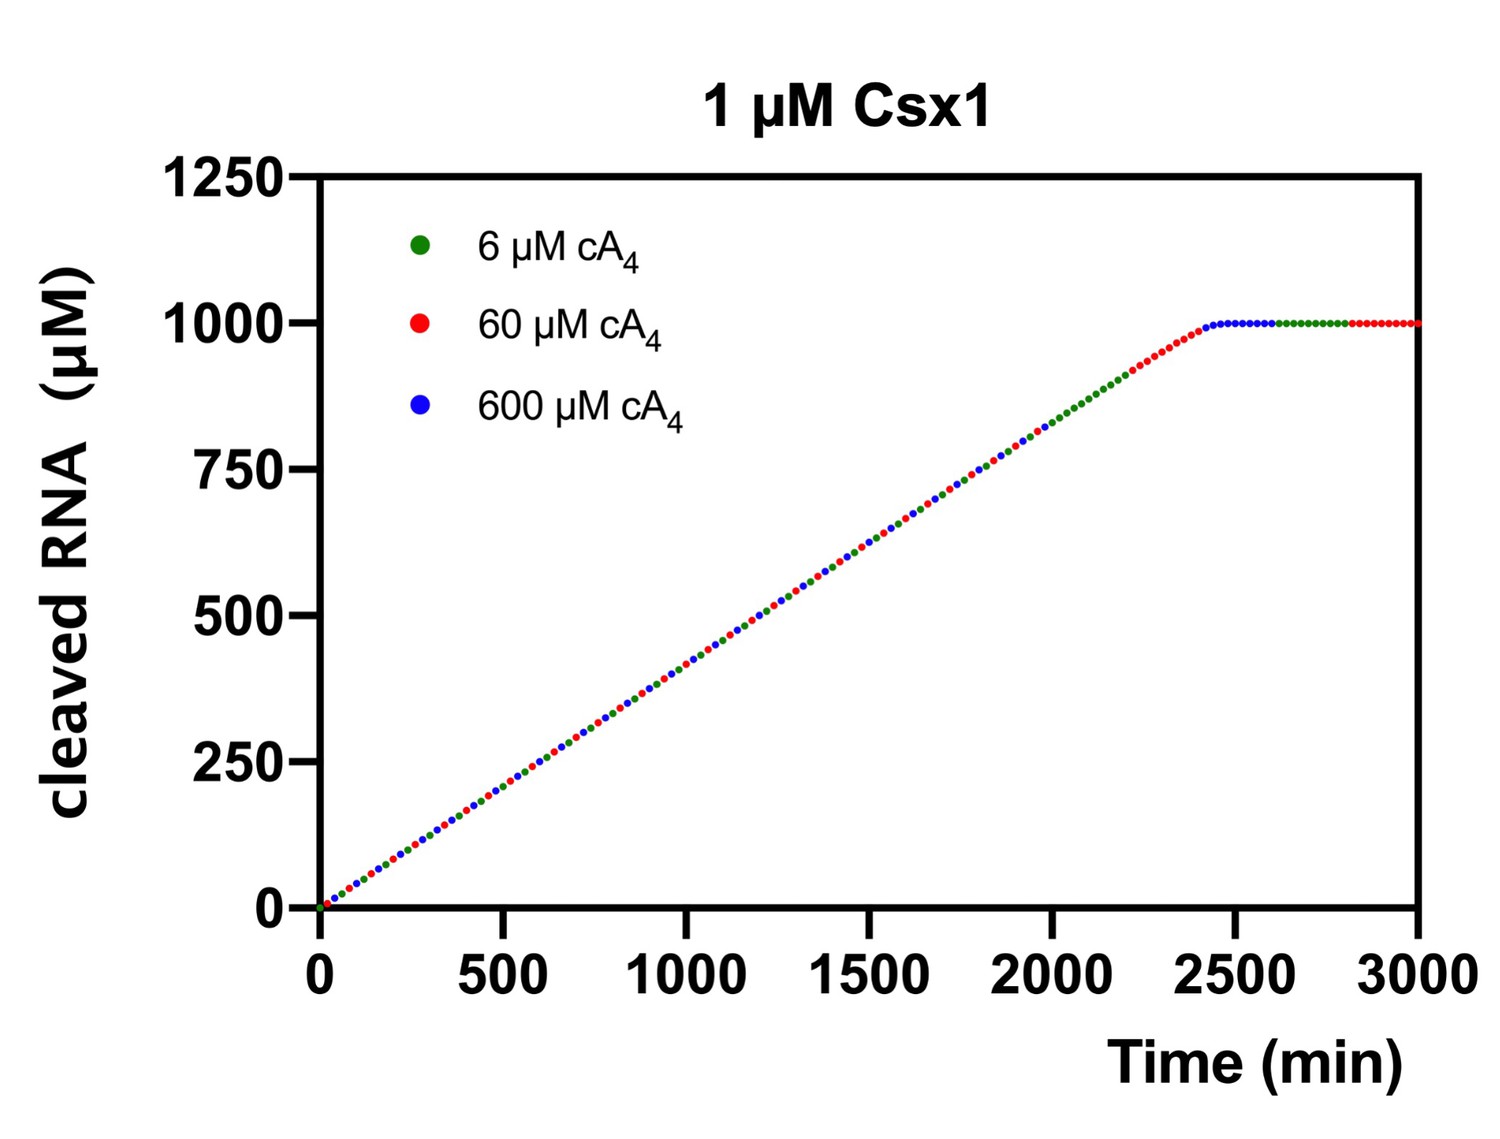
Modelling of RNA cleavage by Csx1 stimulated by cA4 synthesised in response to varying target RNA concentrations.
Plot of RNA (1000 µM) cleaved by 1 µM Csx1 in the presence of 6, 60 or 600 µM cA4 and no ring nuclease. Identical amounts of RNA are cleaved when cA4 synthesised is in excess of Csx1 concentration and all the RNA present is eventually degraded.
Figure 6—figure supplement 2
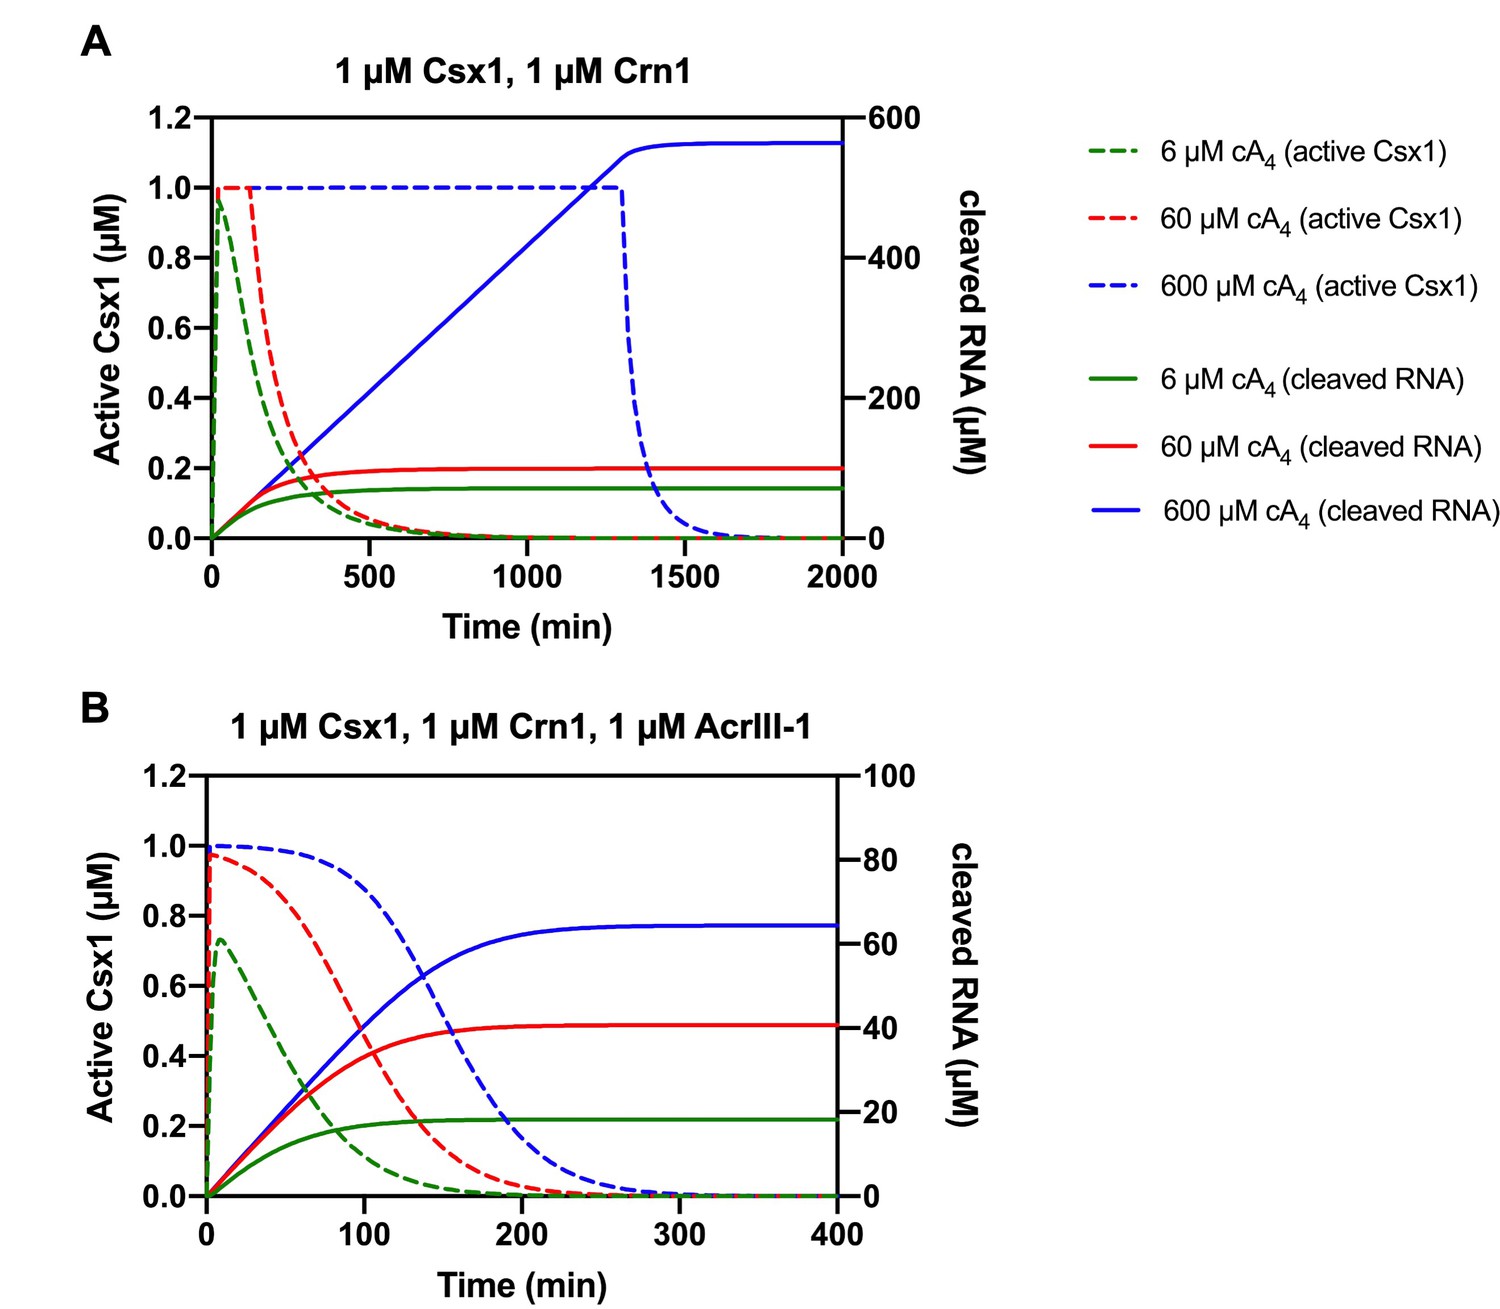
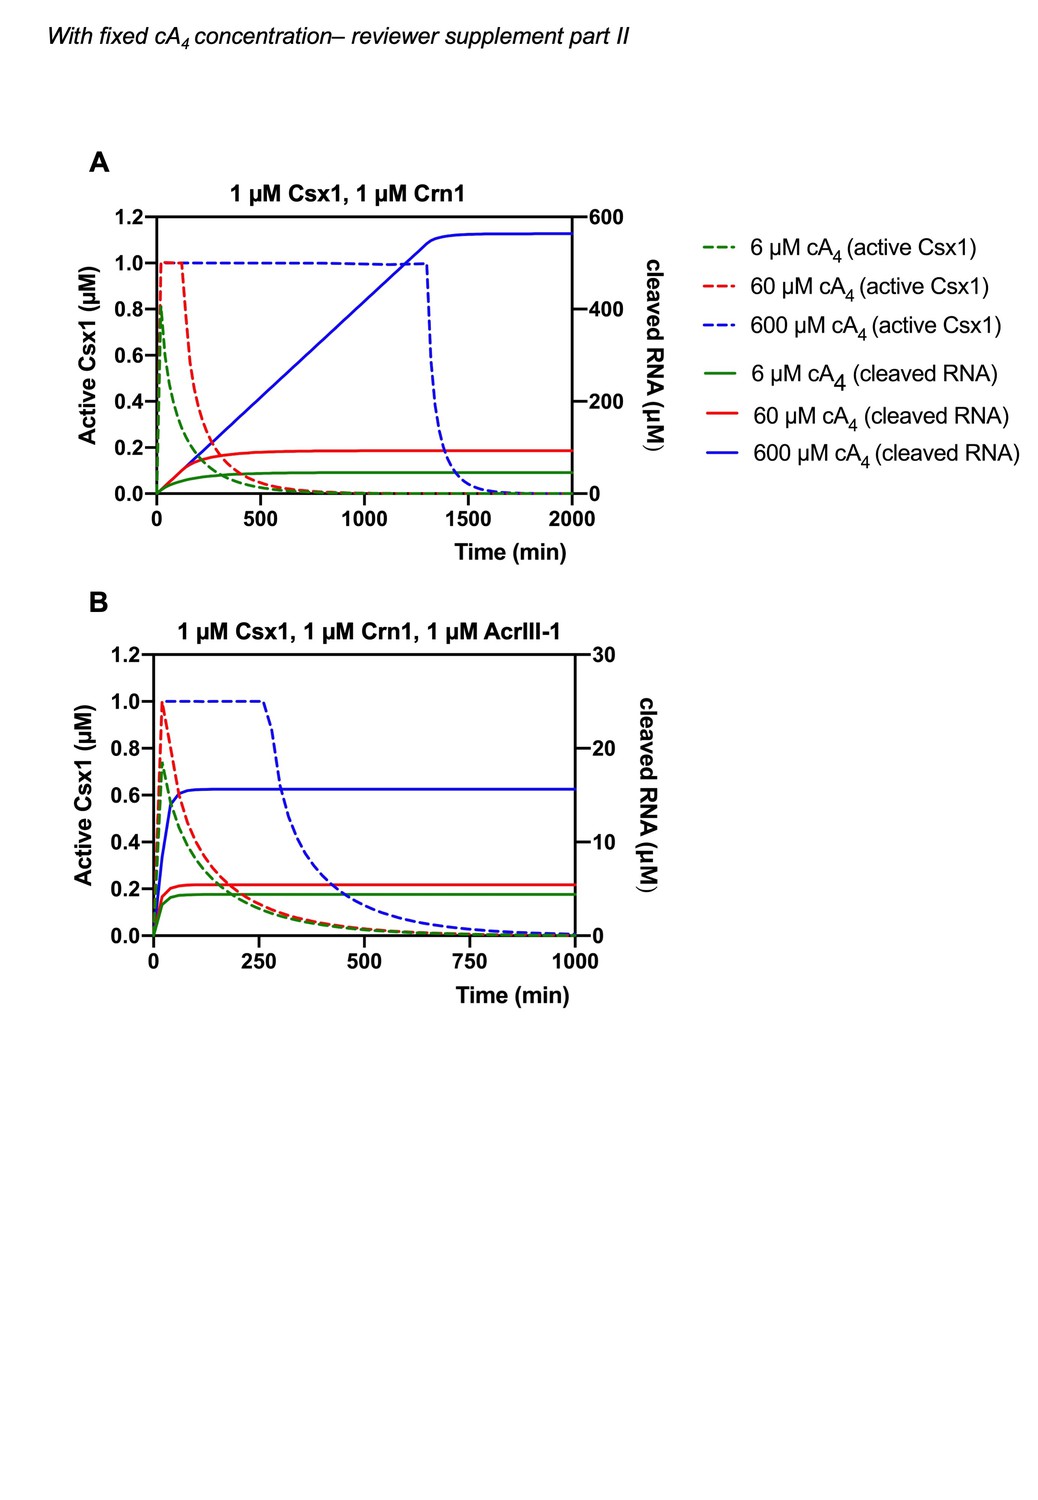
Modelling of the relationship between Csx1 RNA cleavage and deactivation by ring nucleases with varying cA4 concentrations.
(A) Active fraction of 1 µM Csx1 (dotted lines, left-hand side y-axis; cA4_Csx1 and cA4_Csx1_RNA) plotted together with cleaved RNA (solid lines, right-hand side axis) in response to varying cA4 concentrations (600 µM, blue; 60 µM, red; 6 µM, green) made by target:Csm complex when 1 µM Crn1 is present. (B) Active fraction of 1 µM Csx1 and cleaved RNA over time in response to varying cA4 concentrations when 1 µM Crn1 and 1 µM AcrIII-1 is present, as colour coded previously.
Figure 6—figure supplement 3
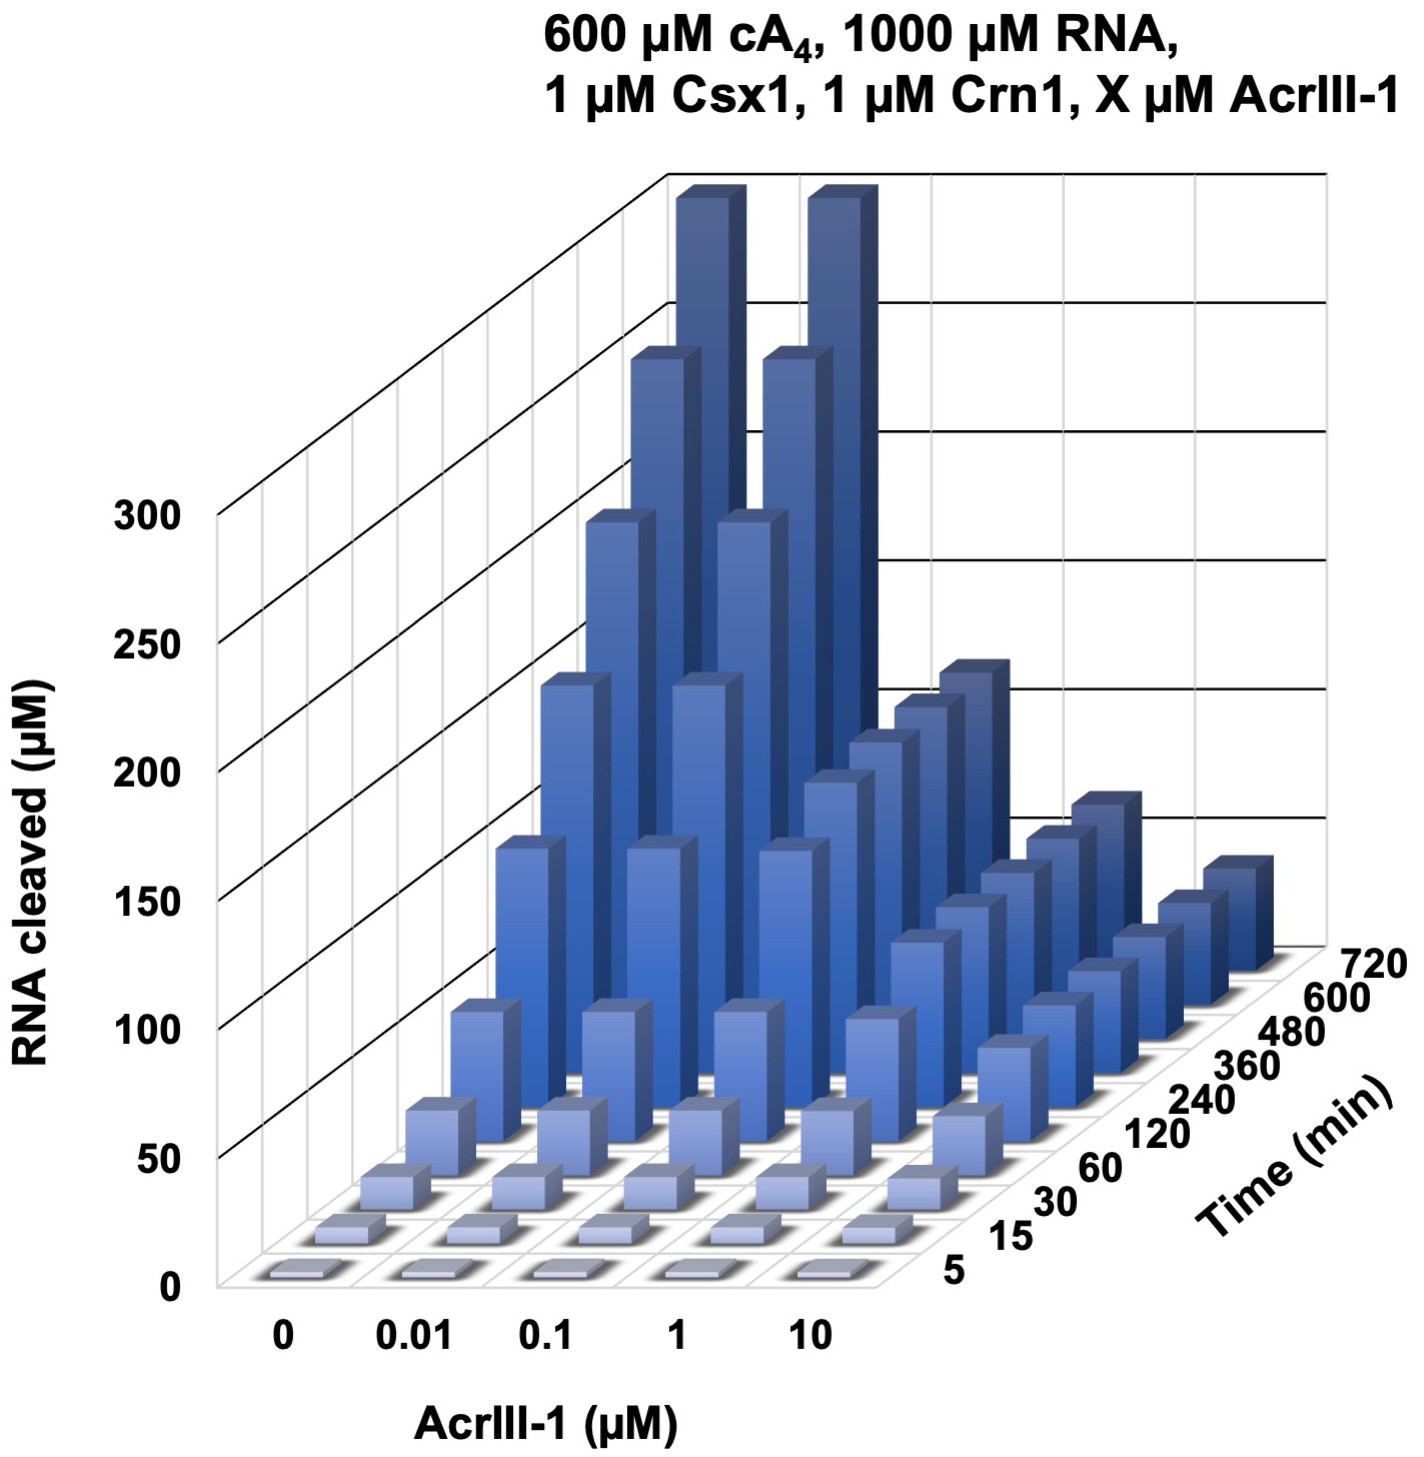
Modelling of the effect of varying AcrIII-1 concentration on RNA cleaved by Csx1 in response to cA4 generated by 600 µM target RNA.
3D plot visualising concentration of RNA (1000 µM at start) cleaved by Csx1 in the presence of 600 µM cA4, 1 µM Crn1 and varying amounts of AcrIII-1 over time. Maximal RNA cleavage negatively correlates with AcrIII-1 concentration.
Author response image 1
Author response image 2
Tables
Key resources table
| Reagent type (species) or resource | Designation | Source or reference | Identifiers | Additional information |
|---|---|---|---|---|
| Gene (Sulfolobus solfataricus) | Csm complex (eight subunits) | PMID:24119402 | virus expression construct | |
| Gene (Sulfolobus solfataricus) | Csx1 | PMID:29963983 | UniProtKB - Q97YD5 | plasmid expression construct |
| Gene (Sulfolobus solfataricus) | Crn1 | PMID:30232454 | UniProtKB - Q7LYJ6 | plasmid expression construct |
| Gene (Sulfolobus islandicus rod-shaped virus 1) | AcrIII-1 | PMID:31942067 | UniProtKB - Q8QL27 | plasmid expression construct |
| Software, algorithm | KinTek Kinetic Explorer | PMID:19897109 | model constructed for this paper |
Table 1
Oligonucleotides.
CRISPR RNA A26 is shown 3’ to 5’. Phosphorothioate linkages are indicated with an asterisk. Regions complementary to CRISPR RNA A26 are italicized.
| Crispr rna a26 | 3’-GCAACAATTCTTGCTGCAACAATCTTCAACCCATACCAGAAAGUUA |
| Name | Sequence (5’−3’) |
|---|---|
| Target RNA A26 | AGGGUCGUUGUUAAGAACGACGUUGUUAGAAGUUGGGUAUGGUGGAGA |
| Phosphorothioate target RNA A26 | AGGGUCGUUGUUAAGAACGACGUUGU*U*A*GAAGUUGGGU*A*U*GGUGGAGA |
| A1 substrate RNA | AGGGUAUUAUUUGUUUGUUUCUUCUAAACUAUAAGCUAGUUCUGGAGA |
Additional files
Download links
A two-part list of links to download the article, or parts of the article, in various formats.
Downloads (link to download the article as PDF)
Open citations (links to open the citations from this article in various online reference manager services)
Cite this article (links to download the citations from this article in formats compatible with various reference manager tools)
The dynamic interplay of host and viral enzymes in type III CRISPR-mediated cyclic nucleotide signalling
eLife 9:e55852.
https://doi.org/10.7554/eLife.55852


