Cryo-EM structures and functional properties of CALHM channels of the human placenta
- Department of Biochemistry, University of Zurich, Switzerland
- Institute of Biochemistry and Molecular Medicine, University of Bern, Switzerland
Figures
Figure 1 with 1 supplement
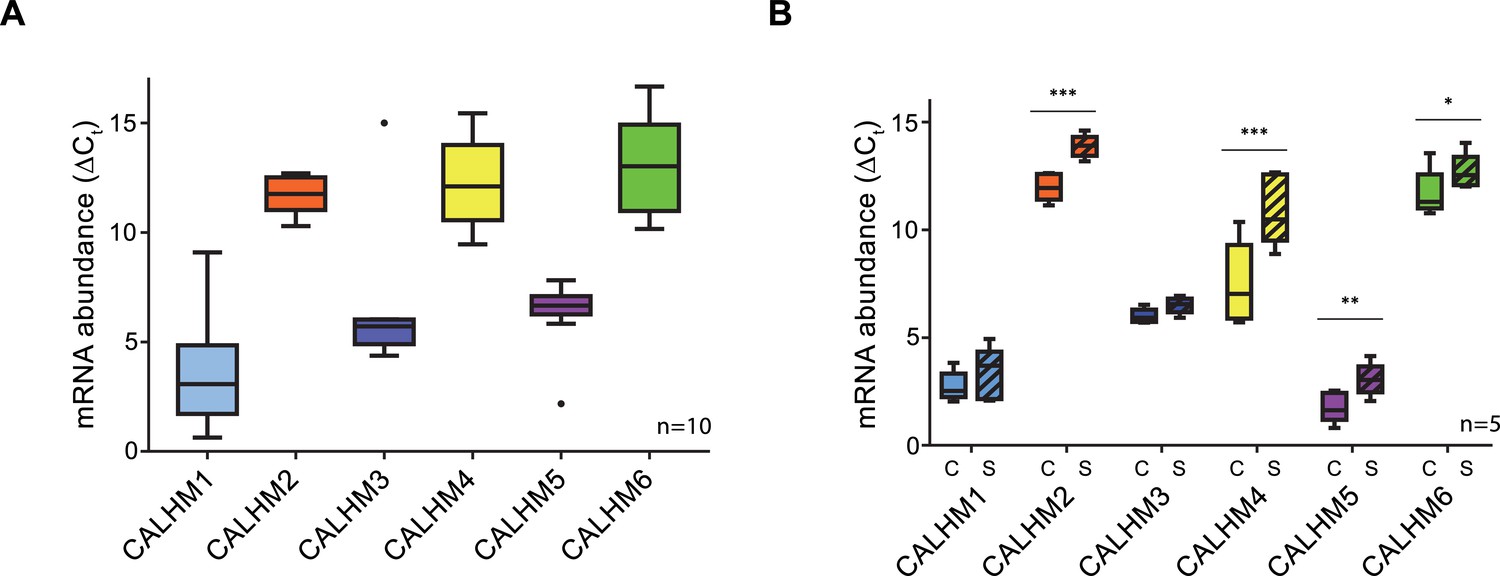
Expression analysis of CALHM genes in the human placenta.
mRNA abundances of different CALMH paralogs in (A), human placental tissues (n = 10) and (B), human trophoblasts isolated from healthy term placentae (n = 5) was assessed by quantitative RT PCR and normalized to the reference gene YWHAZ. The relative amounts of the different CALHM genes are shown as ΔCt values (ΔCt = Ct value of YWHAZ – Ct value of CALHM gene). Comparative transcript data are presented as mRNA abundance (ΔCt = Ctreference gene – Cttraget gene) between undifferentiated cytotrophoblasts (C) and differentiated syncytiotrophoblast (S) cells. Data analysis and statistical evaluations were performed using paired 2-way ANOVA with Sidak’s multiple comparisons test; *p<0.05; **p<0.01; ***p<0.001.
Figure 1—figure supplement 1
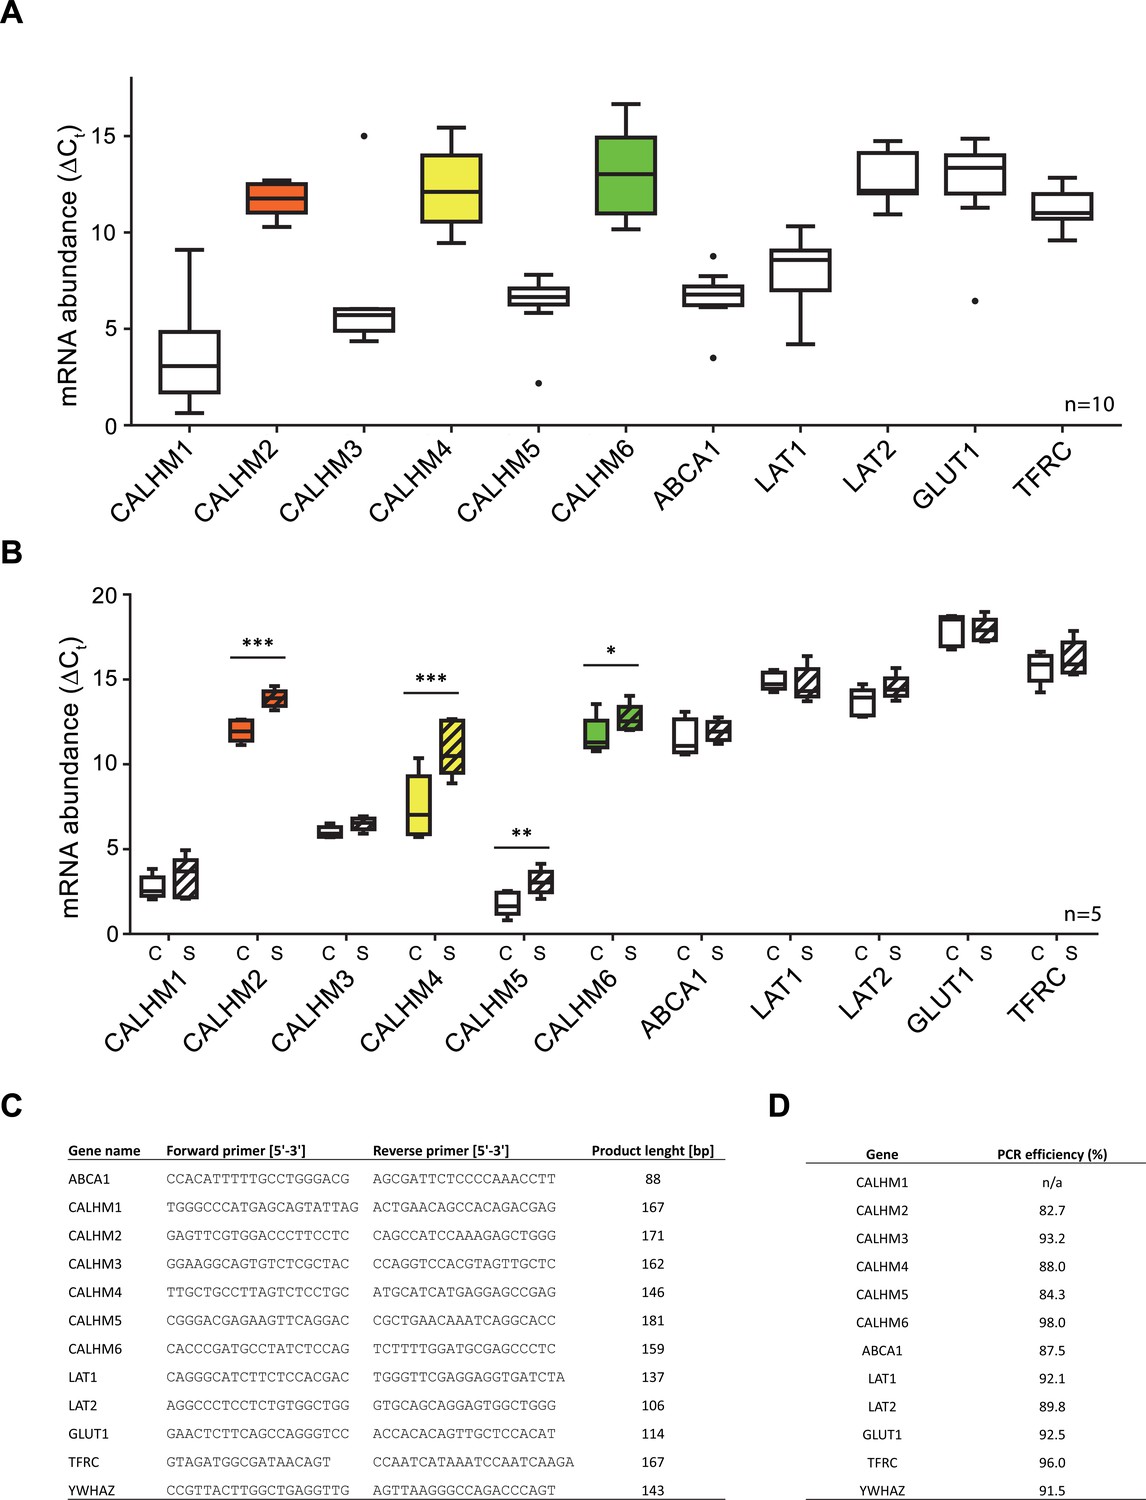
Comparative mRNA expression data for other physiologically relevant transporters/receptors in the human placenta.
Y-axis and statistical analysis are according to Figure 1. mRNA concentrations of different CALMH paralogs and of other transport proteins in (A), human placental tissues (n = 10) and (B), human trophoblasts isolated from healthy term placentae (n = 5) were assessed by quantitative RT PCR and normalized to the reference gene YWHAZ. Abbreviations: ABCA1, ATP-binding cassette transporter A1; CALHM, calcium homeostasis modulator; LAT1 (SLC7A5), L-type amino acid transporter 1; LAT2 (SLC7A8), L-type amino acid transporter 2; GLUT1 (SLC2A1), Glucose transporter 1; TFRC, transferrin receptor complex 1; YWHAZ, Tyrosine 3-monooxygenase/tryptophan 5-monooxygenase activation protein, zeta polypeptide. (C) Primer sequences used for PCR amplification. (D) Calculated amplification efficiencies for the indicated genes.
Figure 2 with 1 supplement
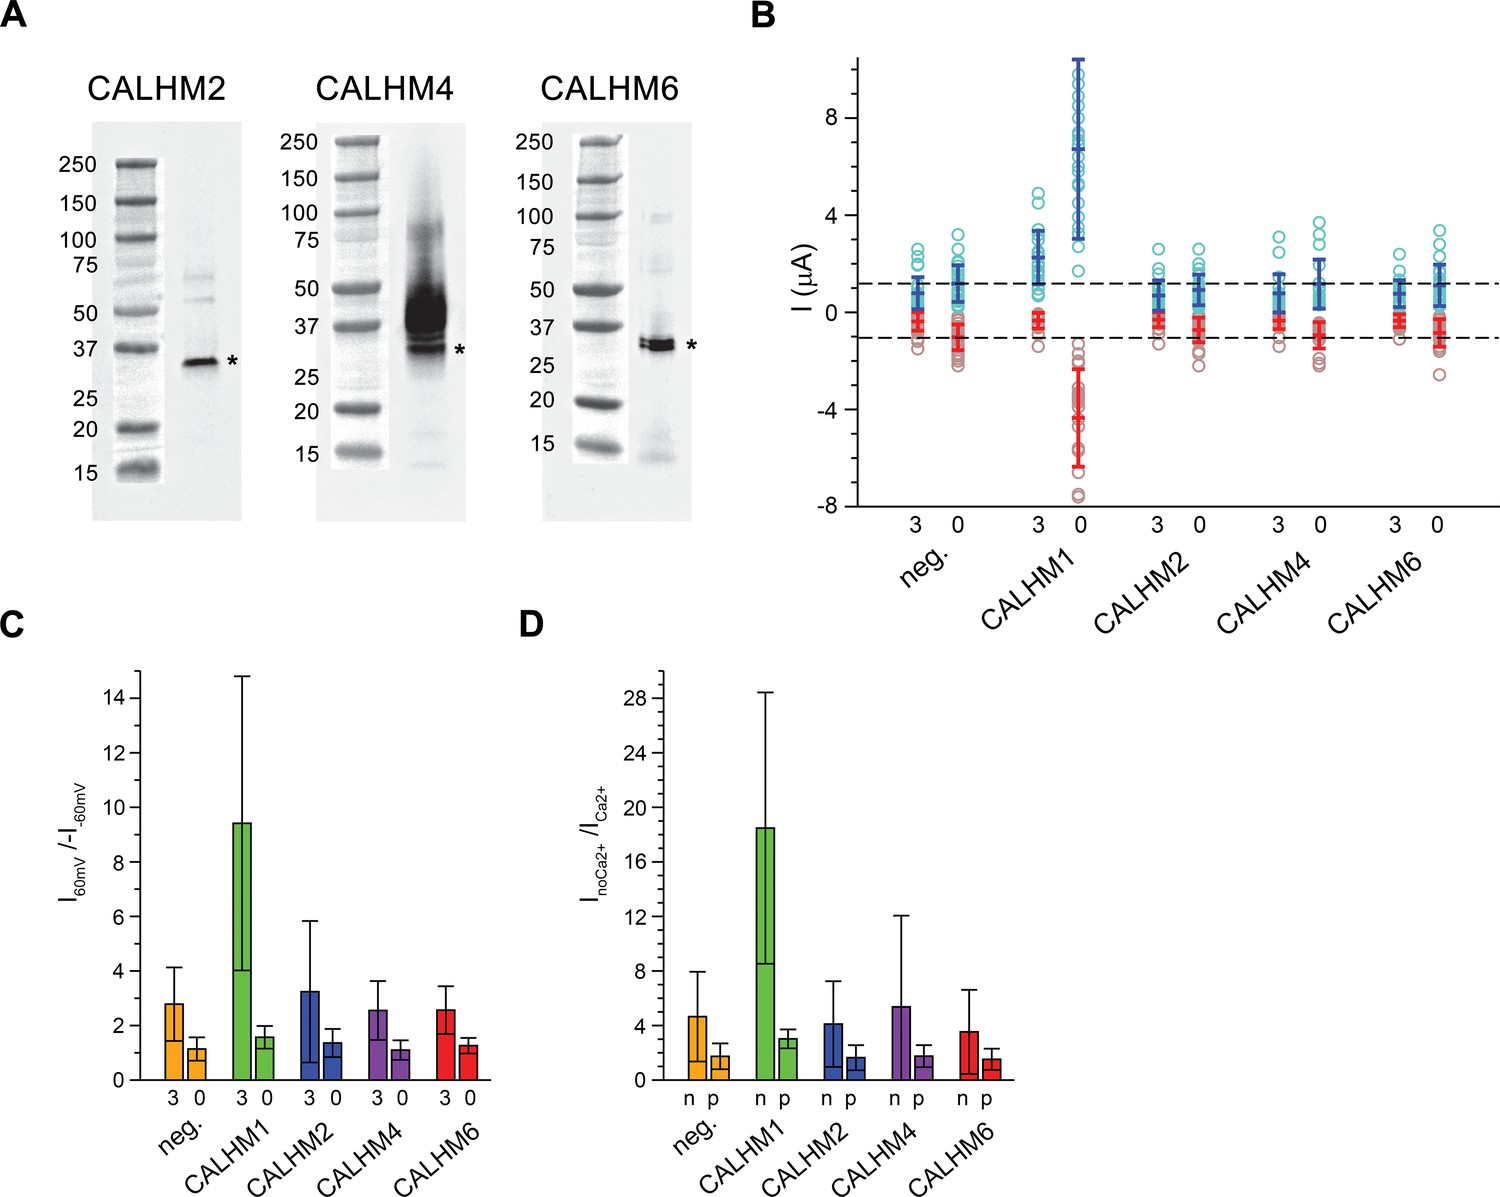
Functional characterization of CALHM channels expressed in X. laevis oocytes.
(A) Western blot of proteins located in the plasma membrane of X. laevis oocytes heterologously expressing the indicated CALHM channels. Protein was isolated after surface-biotinylation by binding to avidin-resin. The proteins are detected with specific antibodies recognizing the respective CALHM paralog. Left, CALHM2, center CALHM4, right CALHM6. The blot demonstrates the targeting of all three paralogs to the plasma membrane. Bands corresponding to the respective CALHM paralogs are indicated by asterisk. (B) Electrophysiological characterization of X. laevis oocytes heterologously expressing the paralogs CALHM1, CALHM2, CALHM4 and CALHM6 in comparison to control oocytes (neg.) recorded at extracellular solutions either containing 3 mM Ca2+ (3) or 0.5 mM EDTA and 0.5 mM EGTA (Ca2+-free, 0). Data show currents of individual oocytes (circle) recorded by two-electrode voltage-clamp (TEVC) at 60 (light blue) and −60 mV (light red). In each case, currents were tabulated at the end of a 5 s voltage step. Averages are shown as bars in red (−60 mV) and blue (60 mV), respectively. Dashed lines indicate mean current levels of control oocytes (neg.) recorded in Ca2+-free extracellular solutions at 60 and −60 mV. Currents measured for all investigated channels, except CALHM1, are not significantly different from control oocytes (as judged by a Student t-test). (C), Rectification of steady-state currents of oocytes displayed in (B) expressed as I60mV/I-60mV calculated for individual oocytes at 3 mM Ca2+ (3) and in Ca2+-free solutions (0) and averaged. The large value of CALHM1 reflects the activation of the protein at positive voltage in presence of Ca2+. (D) Ca2+-dependence of activation. Change of steady-state currents of oocytes displayed in (B) after Ca2+-removal expressed as InoCa2+/ICa2+ calculated from individual oocytes at −60 mV (n) and 60 mV (p) and averaged. The large value of CALHM1 at −60 mV reflects the strong activation of currents at negative voltages upon Ca2+-depletion. C, D, The difference between the corresponding values of the CALHM paralogs 2, 4, and 6 and neg. are statistically insignificant (as judged by a Student t-test). B-D, Data show averages of 27 (neg.), 21 (CALHM1), 26 (CALHM2), 19 (CALHM4) and 21 (CALHM6) oocytes respectively. Errors are standard deviations.
Figure 2—figure supplement 1
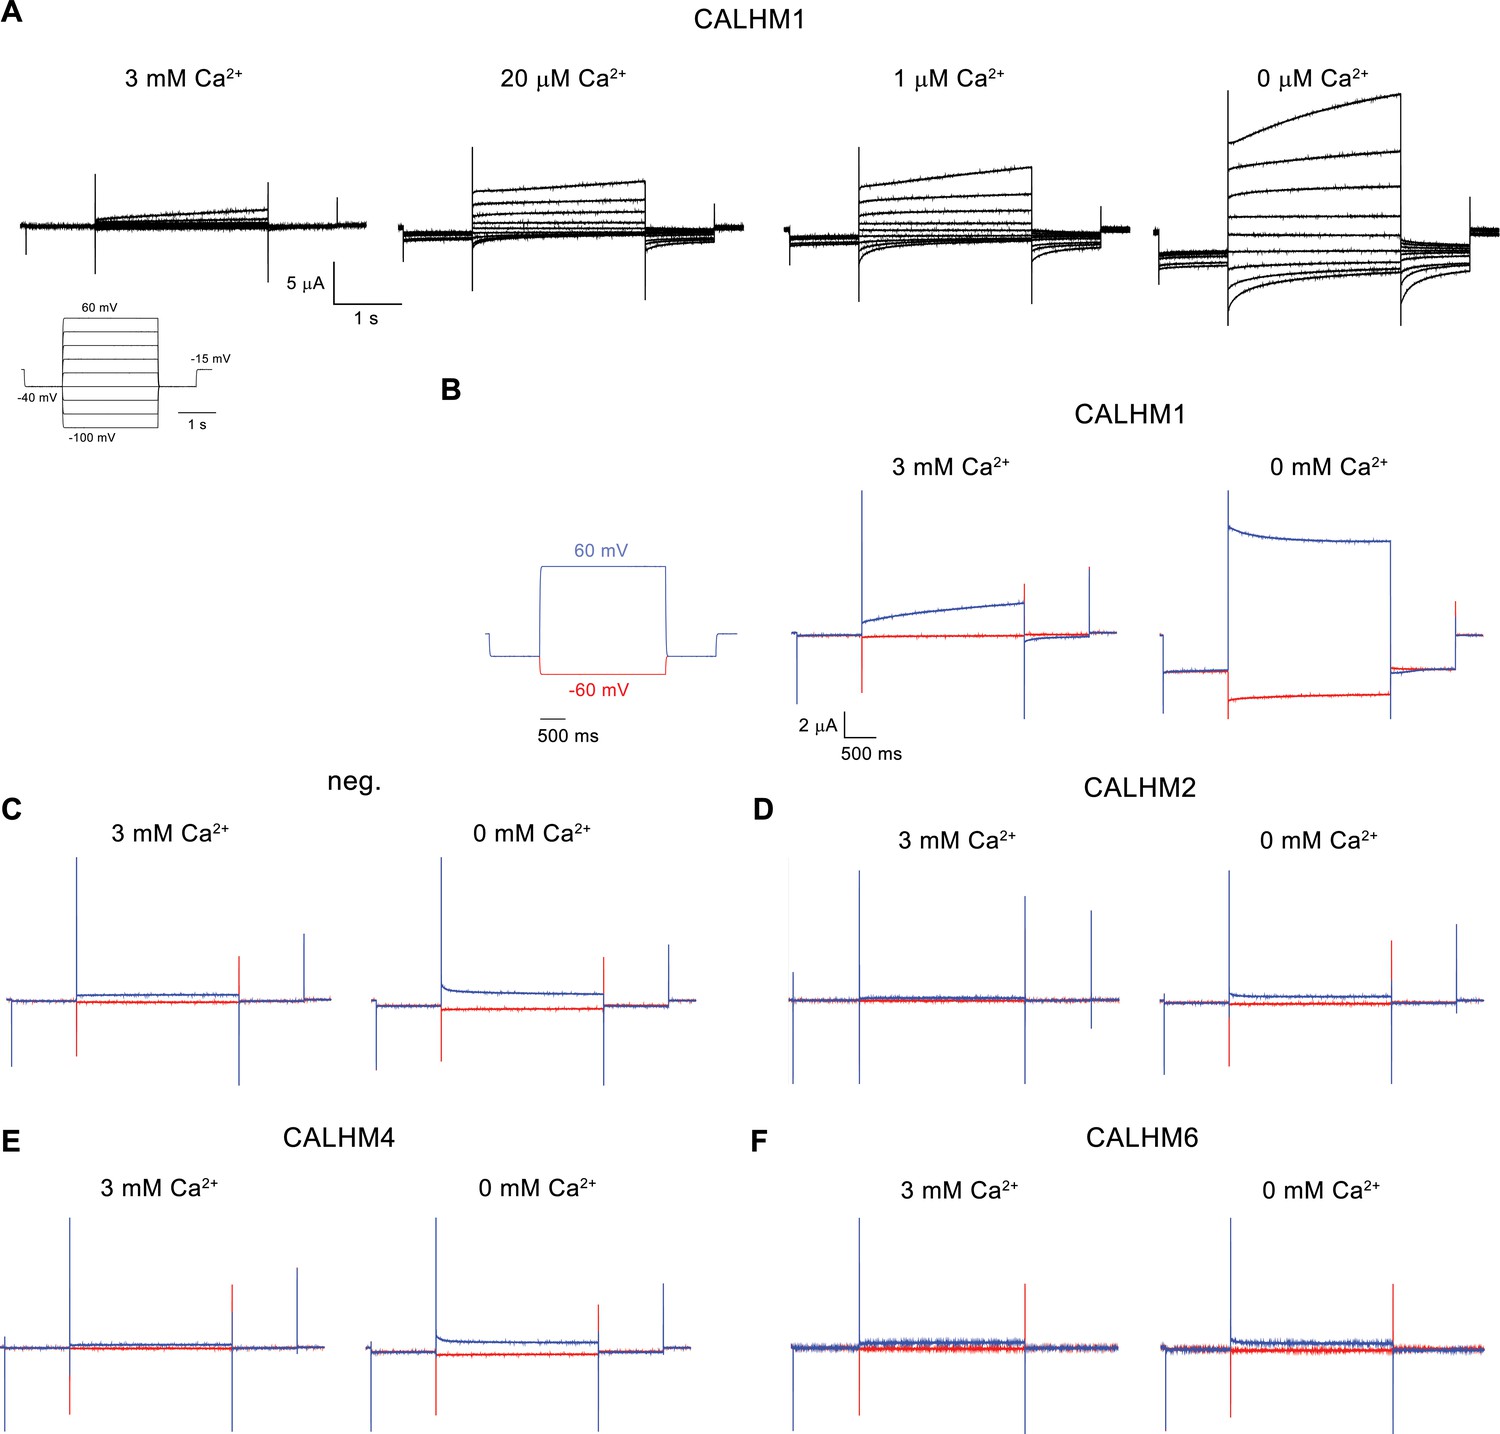
Electrophysiology traces.
(A) Representative current traces of CALHM1 recorded at indicated extracellular Ca2+ concentrations. The voltage protocol is shown as inset (left). (B–F) Representative currents of CALHM paralogs (B), CALHM1, (D), CALHM2, (E), CALHM4 and (F), CALHM6 in comparison to (C), control oocytes (neg.). The current protocol is shown left. Traces including a step to −60 mV are colored in red, traces including a step to 60 mV in blue. A-F, Data were recorded 40–60 hr after injection of cRNA.
Figure 3 with 6 supplements
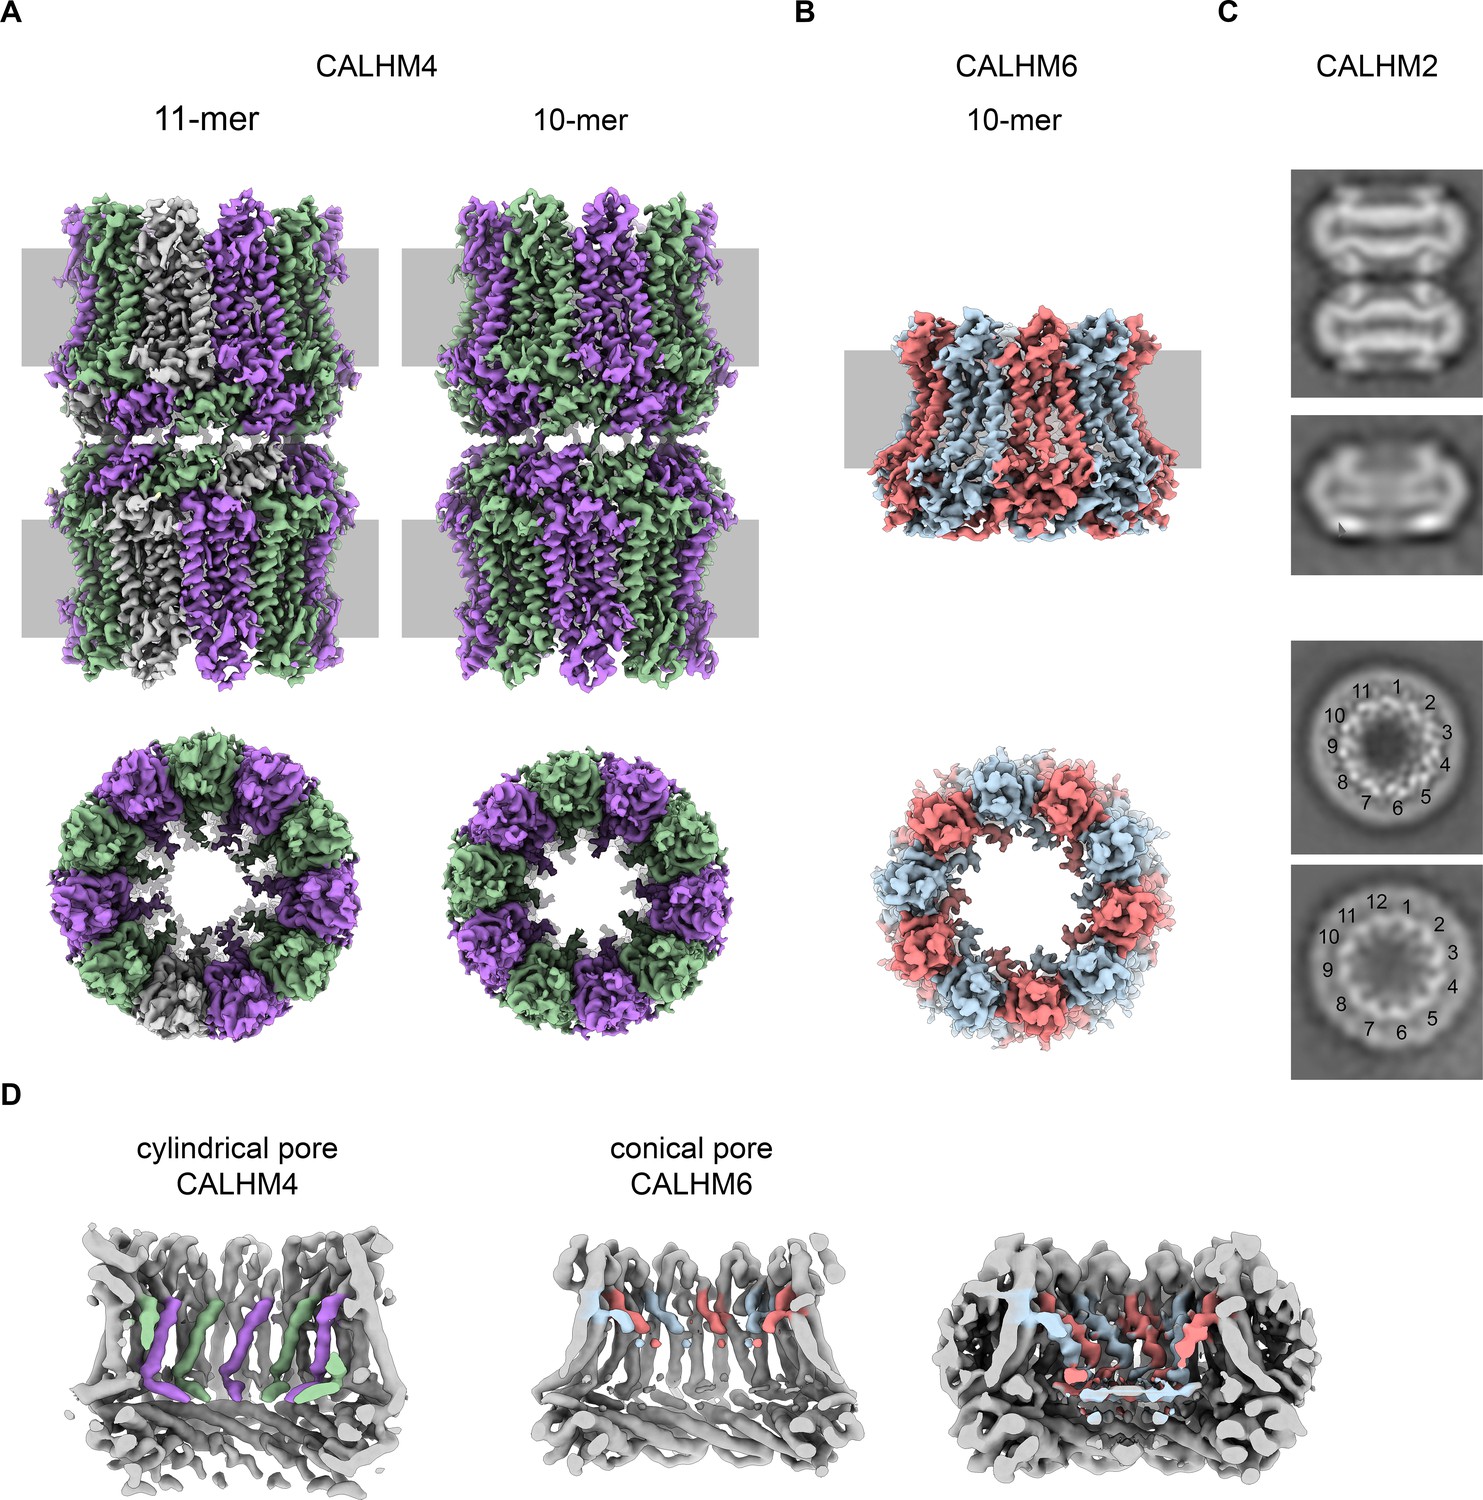
Cryo-EM analysis.
(A) Cryo-EM density of undecameric (11-mer) and decameric (10-mer) pairs of CALHM4 channels at 3.8 and 4.1 Å respectively. Data were recorded from a Ca2+-free sample. Subunits are colored in lilac and green, respectively. (B) Cryo-EM density of decameric CALHM6 channels at 4.4 Å. Subunits are colored in red and light-blue, respectively. A, B, Views are from within the membrane with membrane indicated as grey rectangle (top) and from the outside (bottom). (C) Selected 2D classes of the CALHM2 data showing interacting channel pairs and single channels viewed from within the membrane (top) and views of undecameric and dodecameric channels with subunits numbered (bottom). (D) Slices through the CALHM4 (left) and the CALHM6 (right) channels illustrating the distinct features of the cylindrical and conical pore conformations. View of CALHM6 at lower contour (right) shows extended density for the mobile TM1. Maps are low-pass filtered at 6 Å. Colored features refer to density corresponding to TM1 and NH.
Figure 3—figure supplement 1

Biochemical characterization.
(A) Size-exclusion chromatograms recorded from fluorescently tagged CALHM subunits from a whole-cell extract in the detergent GDN on a Superose 6 5/150 column at a flow rate of 0.2 ml/min. Asterisks indicate elution times for each paralog. (B) Overlay of size-exclusion chromatograms recorded from purified CALHM paralogs after cleavage of the fusion peptide used for cryo-EM analysis on a Superose 6 10/300 column. Inset shows magnified peak region with respective elution volumes indicated.
Figure 3—figure supplement 2
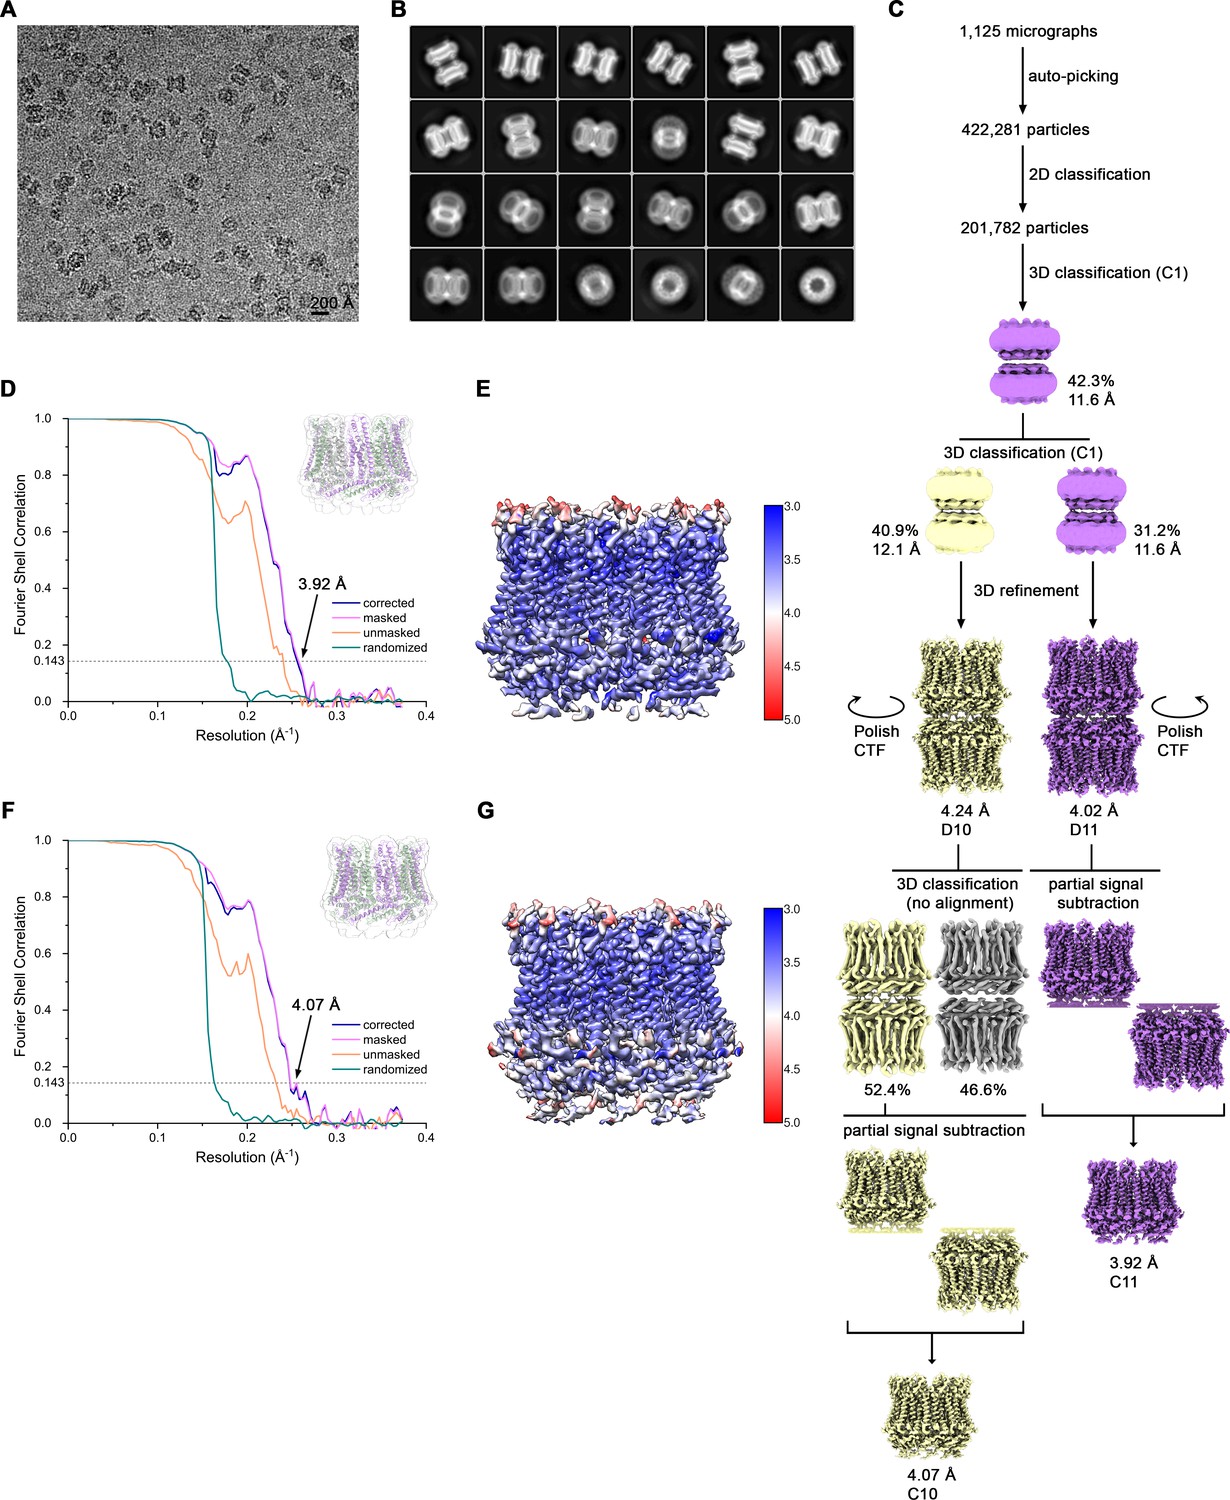
Cryo-EM reconstruction of CALHM4 in presence of Ca2+.
(A) Representative cryo-EM micrograph acquired with a Tecnai G2 Polara microscope. (B) 2D class averages of CALHM4 in presence of Ca2+. (C) Data processing workflow. Two rounds of non-symmetrized 3D classification allowed to isolate two populations representing decameric and undecameric assemblies. The particles were further refined with either D10 or D11 symmetry imposed. After performing per-particle CTF refinement and Bayesian polishing, the remaining structural heterogeneity in decamers was segregated by performing the final 3D classification, where the orientations were kept fixed as in the consensus model. To further improve the resolution of each reconstruction, partial signal subtraction followed by 3D refinement was applied. Particles with the symmetry relaxed to either C10 or C11 were merged and subjected to a final round of auto-refinement. The distribution of all particles (%) and the resolution of each class is indicated. (D) FSC plot of the final refined undecameric unmasked (orange), masked (pink), phase-randomized (green) and corrected for mask convolution effects (blue) cryo-EM density map of CALHM4. The resolution at which the FSC curve drops below the 0.143 threshold is indicated. The inset shows the atomic model within the mask that was applied for calculations of the resolution estimates. (E) Final 3D reconstruction of undecameric CALHM4 colored according to local resolution. (F) FSC plot of the final refined decameric unmasked (orange), masked (pink), phase-randomized (green) and corrected for mask convolution effects (blue) cryo-EM density map of CALHM4. The resolution at which the FSC curve drops below the 0.143 threshold is indicated. The inset shows the atomic model within the mask that was applied for calculations of the resolution estimates. (G) Final 3D reconstruction of decameric CALHM4 colored according to local resolution.
Figure 3—figure supplement 3

Cryo-EM reconstruction of CALHM4 in absence of Ca2+.
(A) Representative cryo-EM micrograph acquired with a Tecnai G2 Polara microscope. (B) 2D class averages of CALHM4 in absence of Ca2+. (C) Data processing workflow. Two rounds of non-symmetrized 3D classification allowed to isolate two populations representing decameric and undecameric assemblies. The particles were further refined with either D10 or D11 symmetry imposed and iterative per-particle CTF refinement and Bayesian polishing. The resolution of the undecameric assembly was further improved by partial signal subtraction followed by 3D refinement with C11 symmetry applied. The distribution of all particles (%) and the resolution of each class is indicated. (D) FSC plot of the final refined undecameric unmasked (orange), masked (pink), phase-randomized (green) and corrected for mask convolution effects (blue) cryo-EM density map of CALHM4. The resolution at which the FSC curve drops below the 0.143 threshold is indicated. The inset shows the atomic model within the mask that was applied for calculations of the resolution estimates. (E) Final 3D reconstruction of undecameric CALHM4 colored according to local resolution. (F) FSC plot of the final refined decameric unmasked (orange), masked (pink), phase-randomized (green) and corrected for mask convolution effects (blue) cryo-EM density map of CALHM4. The resolution at which the FSC curve drops below the 0.143 threshold is indicated. The inset shows the atomic model within the mask that was applied for calculations of the resolution estimates. (G) Final 3D reconstruction of decameric CALHM4 colored according to local resolution.
Figure 3—figure supplement 4

Cryo-EM reconstruction of CALHM6 in presence of Ca2+.
(A) Representative cryo-EM micrograph acquired with a Tecnai G2 Polara microscope. (B) 2D class averages of CALHM6 in presence of Ca2+. (C) Data processing workflow. Non-symmetrized 3D classification allowed to isolate two populations representing decameric and undecameric assemblies. The particles were further refined with either C10 or C11 symmetry imposed and iterative per-particle CTF refinement and Bayesian polishing. The distribution of all particles (%) and the resolution of each class is indicated. (D) FSC plot of the final refined decameric unmasked (orange), masked (pink), phase-randomized (green) and corrected for mask convolution effects (blue) cryo-EM density map of CALHM6. The resolution at which the FSC curve drops below the 0.143 threshold is indicated. The inset shows the atomic model within the mask that was applied for calculations of the resolution estimates. (E) Final 3D reconstruction of decameric CALHM6 colored according to local resolution. (F) FSC plot of the final refined undecameric unmasked (orange), masked (pink), phase-randomized (green) and corrected for mask convolution effects (blue) cryo-EM density map of CALHM6. The resolution at which the FSC curve drops below the 0.143 threshold is indicated. The inset shows the atomic model within the mask that was applied for calculations of the resolution estimates. (G) Final 3D reconstruction of undecameric CALHM6 colored according to local resolution.
Figure 3—figure supplement 5

Cryo-EM density of CALHM4 and CALHM6.
(A) Cryo-EM density at 3.7 Å of selected regions of the undecameric CALHM4 structure recorded from a sample obtained in the absence of Ca2+ superimposed on the model. Structural elements are indicated, ‘6 Å’ marks cryo-EM density low-pass filtered to 6 Å superimposed on a Cα trace of NH and TM1, which illustrates the helicity of the entire NH region that is partly not defined in the density at higher resolution due to its intrinsic mobility. (B) Cryo-EM density at 4.4 Å of selected regions of the decameric CALHM6 structure superimposed on the model. Structural elements are indicated. ‘6 Å’ marks cryo-EM density low-pass filtered to 6 Å superimposed on a ribbon of TM1 and parts of TM2, which displays extended density for the entire TM1 region that is partly not defined in the density at higher resolution due to its intrinsic mobility. Density is shown from two different views with indicated relationship. Large side chains that are recognizable in the low-pass filtered map are displayed as sticks.
Figure 3—figure supplement 6

Cryo-EM reconstruction of CALHM2 in presence of Ca2+.
(A) Representative cryo-EM micrograph acquired with a Tecnai G2 Polara microscope. (B) Data processing workflow. Non-symmetrized 3D classification with two reference models representing monomeric and dihedrally-related dimeric architectures as observed for CALHM6 and CALHM4, respectively, allowed to separate CALHM2 particles into two respective subsets. However, preferential orientation of the particles on a grid together with the presence of compositional heterogeneity in form of undecameric and dodecameric assemblies within each subset hindered generation of a high-resolution 3D reconstruction. 2D class averages calculated separately from monomeric and dimeric subsets highlight the predominance of views from the extracellular side. Green boxes and ‘+’ mark representative views of undecameric and yellow boxes and ‘*’ of dodecameric assemblies.
Figure 4 with 1 supplement
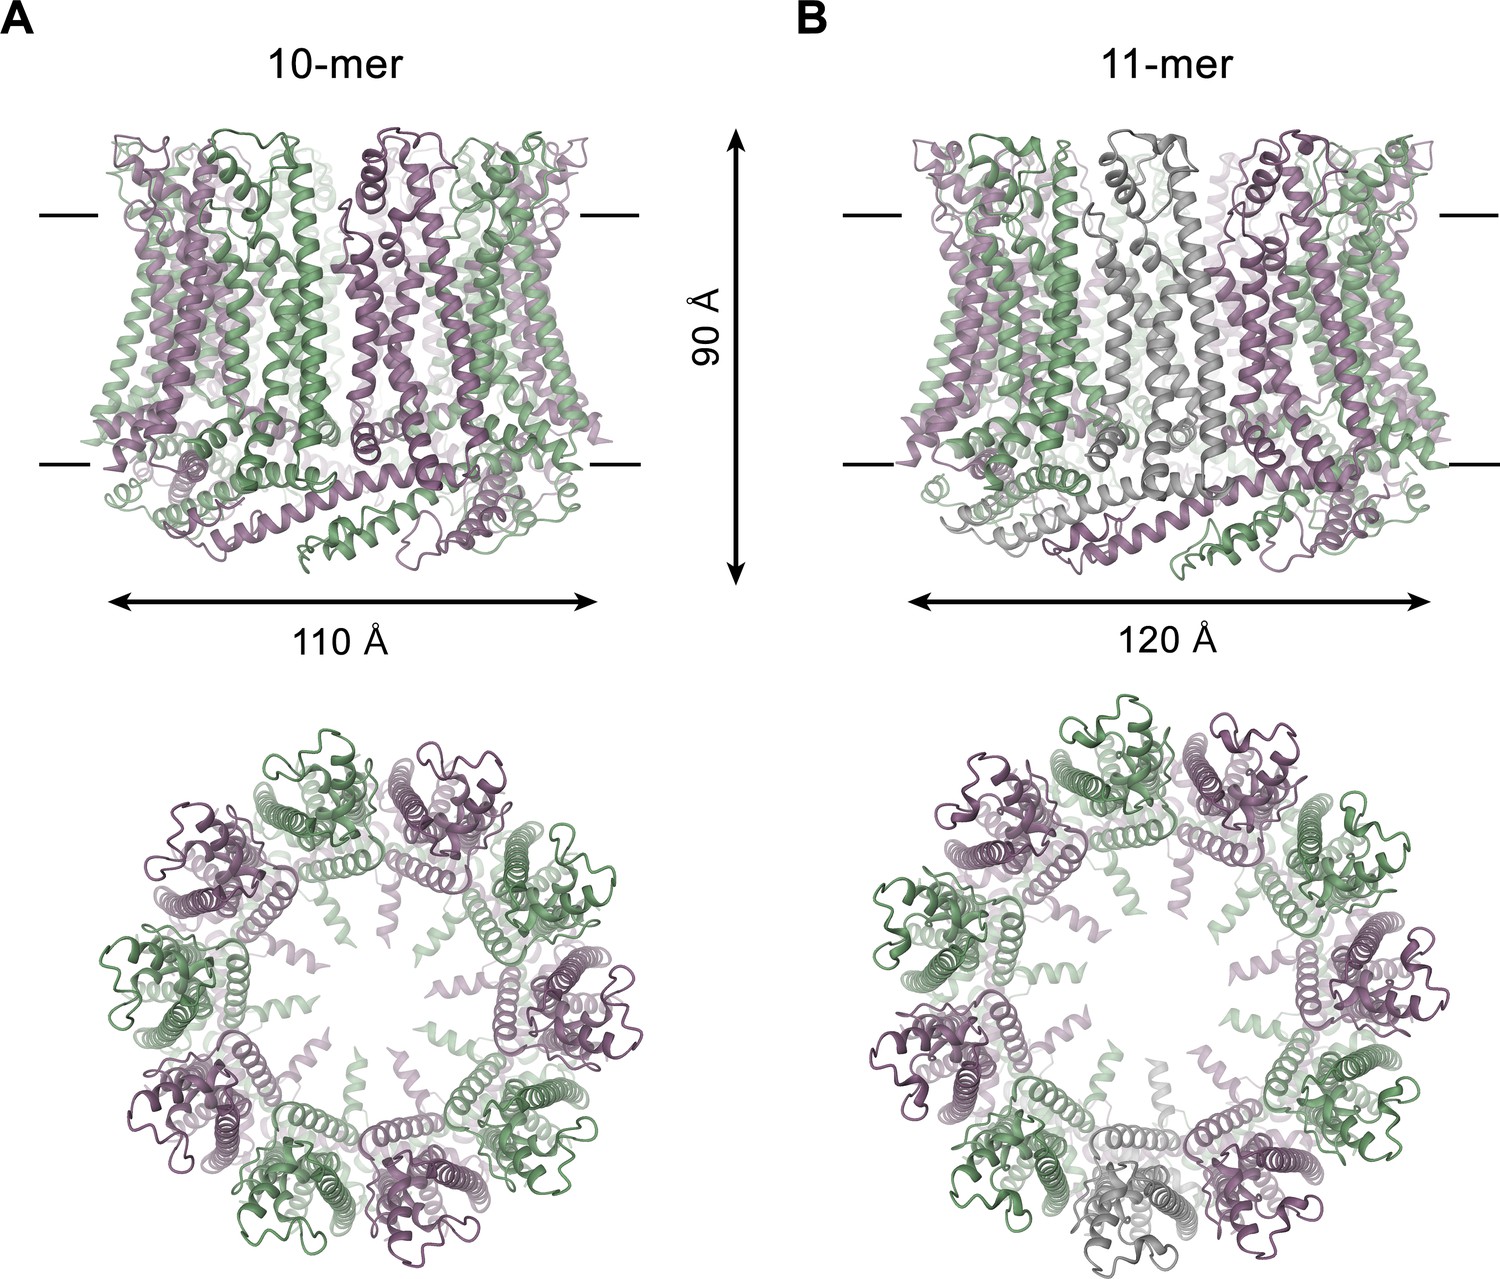
CALHM4 structure.
Ribbon representation of (A), decameric and (B), undecameric CALHM4 channels. Top views are from within the membrane with membrane boundaries indicated, bottom views are from the extracellular side. The approximate dimensions are indicated. Subunits are colored in lilac and green.
Figure 4—figure supplement 1
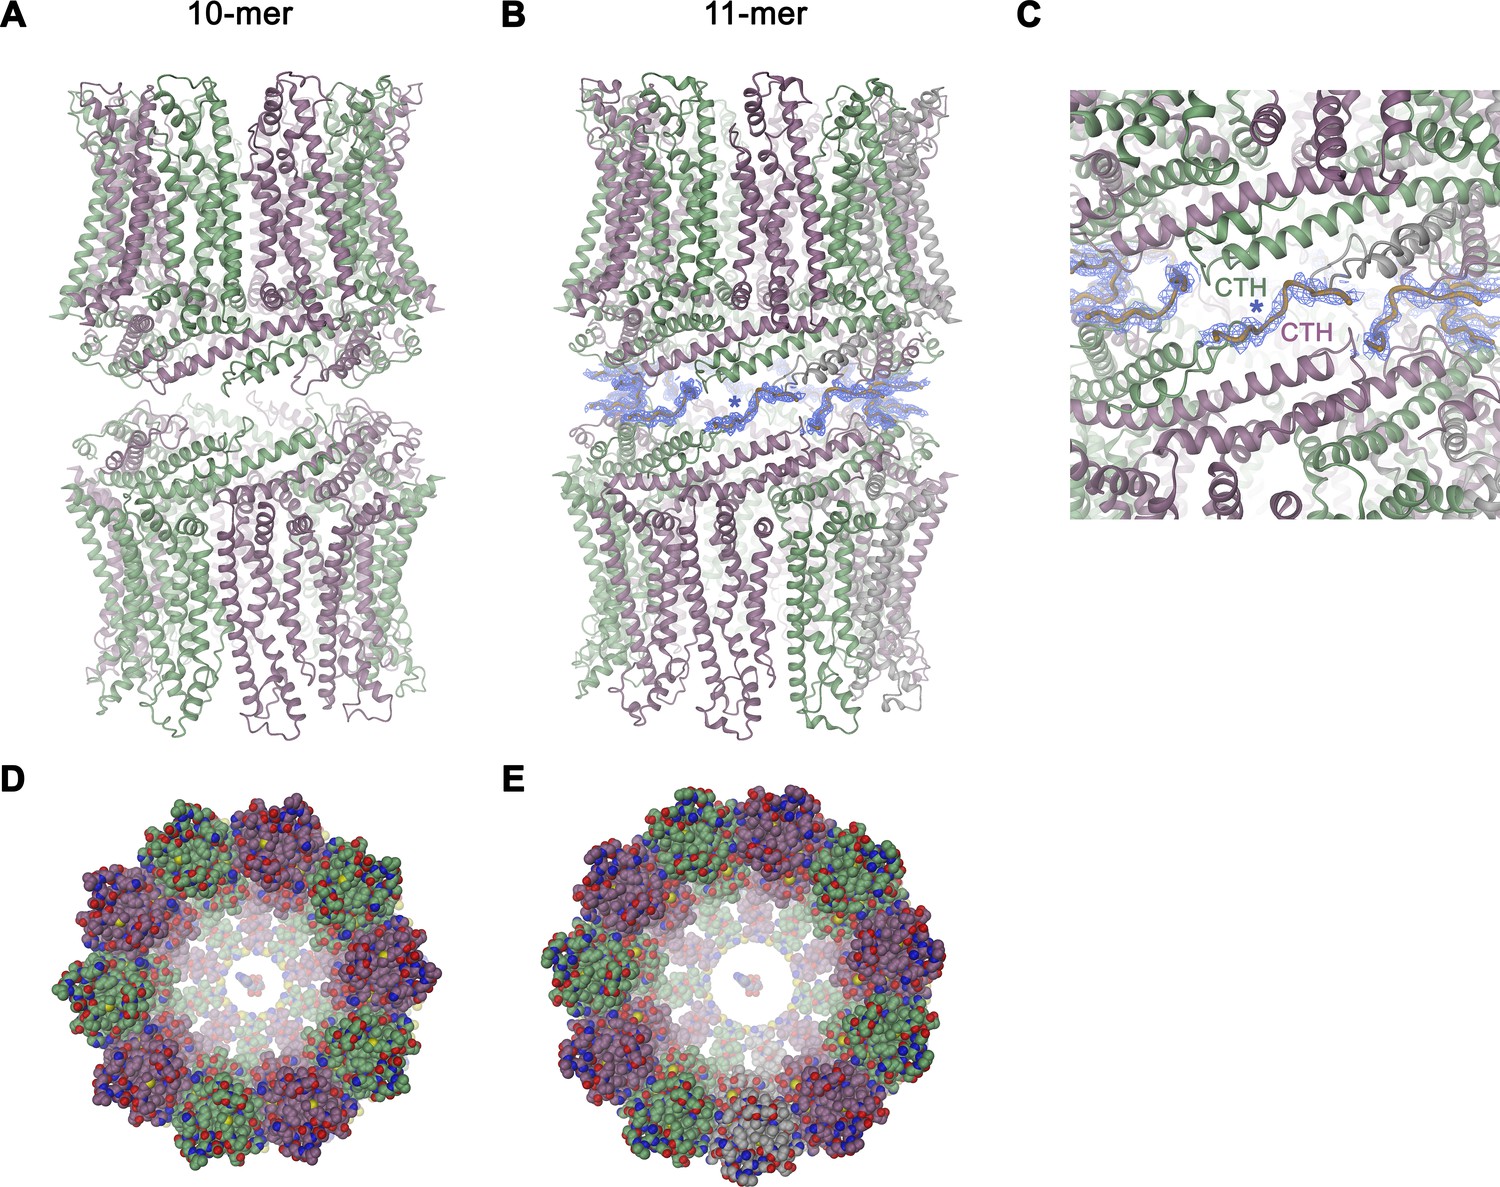
Features of the CALHM4 structure.
Ribbon representation of (A), decameric and (B), undecameric channel pairs as observed in the CALHM4 dataset. In both cases, the proteins interact via their intracellular regions. Residual density at the C-terminus connecting both channels is shown as blue mesh and modeled as a poly-glycine chain. (C) Close-up of the interface between channel pairs shown in B. Space-filling models of the decameric (D), and undecameric (E) CALHM4 channel viewed from the extracellular side with ATP molecules shown a space-filling models for reference. Subunits are colored in lilac and green.
Figure 5 with 2 supplements
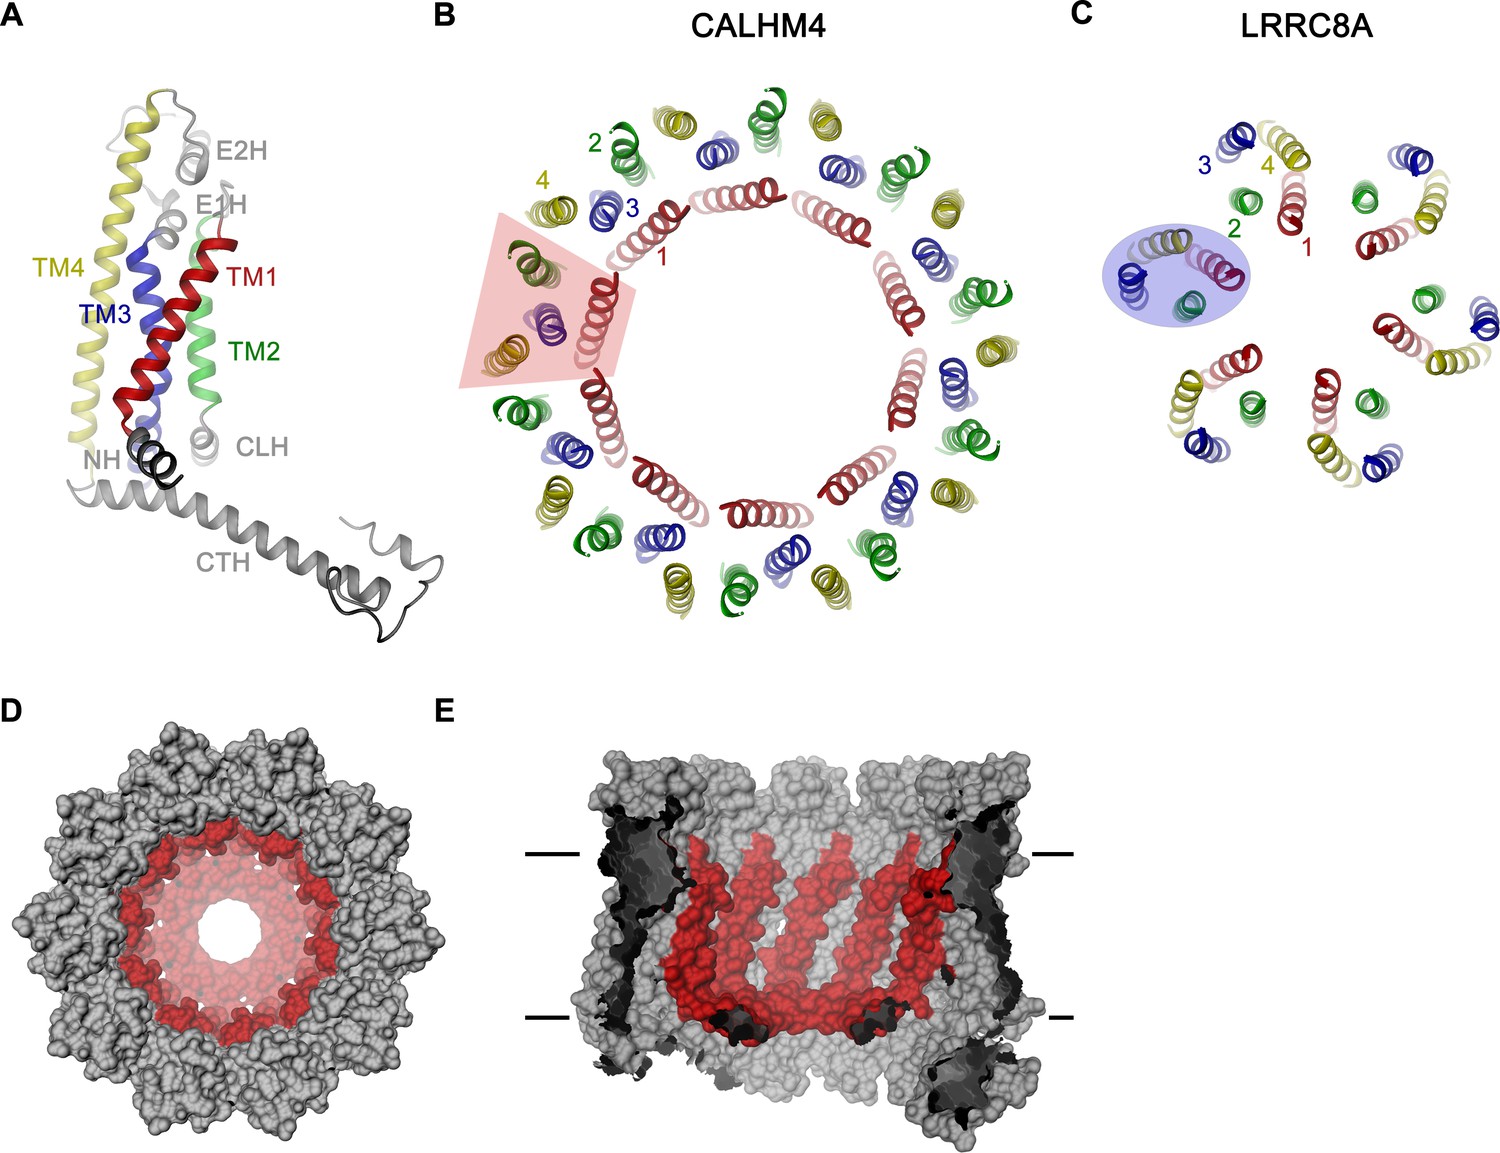
CALHM4 subunit and oligomeric arrangement.
(A) Ribbon representation of the CALHM4 subunit. Secondary structure elements are labeled and transmembrane α-helices are shown in unique colors. View of the transmembrane α-helices of (B), the CALHM4 decamer and (C), the volume regulated anion channel LRRC8A from the extracellular side. B-C, color code is as in A, transmembrane segments of one subunit are numbered. The general shape of a single subunit is indicated (B, trapezoid, C, oval). (D) Surface representation of the CALHM4 decamer. The view is from the outside. (E), Slice through the CALHM4 pore viewed from within the membrane. D, E, TM1 and the N-terminal α-helix NH are colored in red.
Figure 5—figure supplement 1
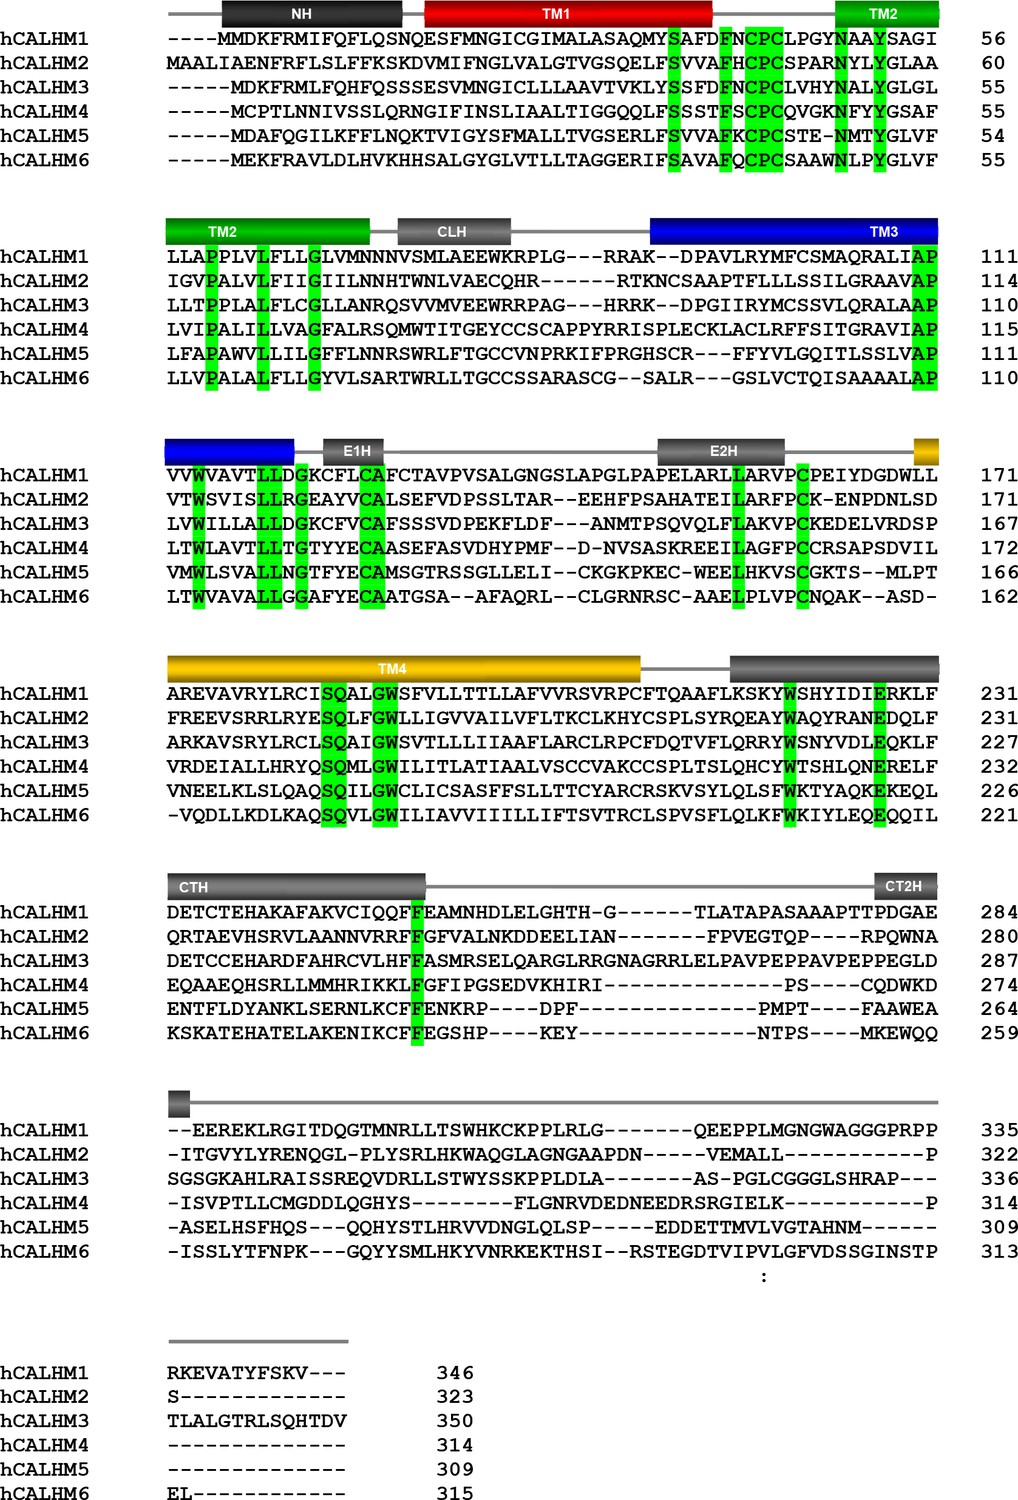
Sequence and topology.
Sequence alignment of the human CALHM paralogs CALHM1 (NP_001001412.3), CALHM2 (NP_057000.2), CALHM3 (NP_001123214.1), CALHM4 (NP_001353007.1), CALHM5 (NP_714922.1) and CALHM6 (NP_001010919.1). Identical residues are highlighted in green, secondary structure elements of CALHM4 are indicated above.
Figure 5—figure supplement 2
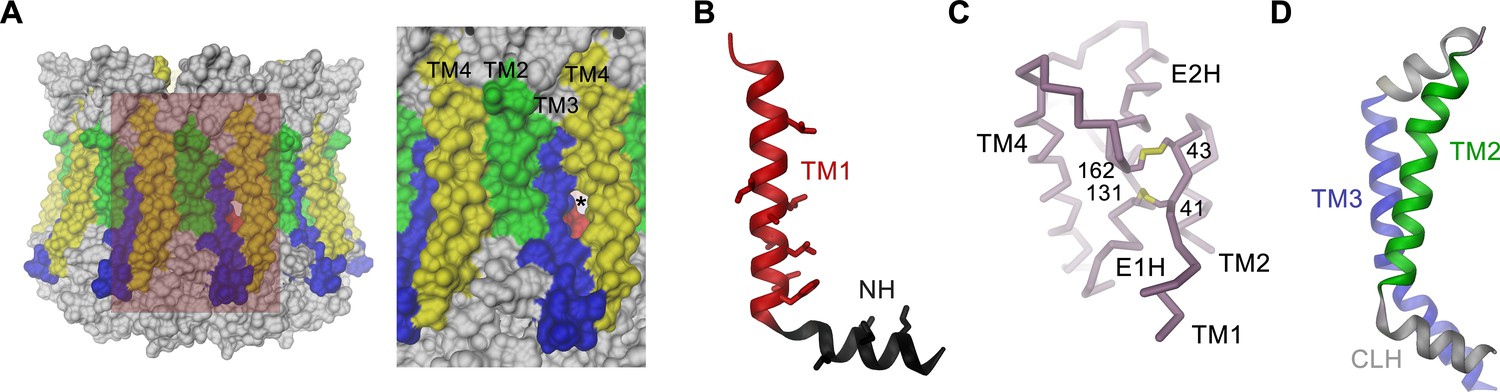
Features of the CALHM4 structure.
(A) Molecular surface of the CALHM4 decamer viewed from within the membrane (left) and zoom into the highlighted region showing the interface between two subunits (right). Asterisk indicates location of a small fenestration on the surface between TM3 and TM4 of the same subunit. (B) Ribbon representation of TM1 and the N-terminal α-helix NH with side chains of hydrophobic residues facing the pore displayed as sticks. (C) Cα-trace of the extracellular region of CALHM4 with disulfide bridges shown as sticks and labeled. (D) Ribbon representation of TM2, the intracellular α-helix CLH and TM3. A, B, D, Transmembrane segments are colored as in Figure 5A and labeled.
Figure 6 with 2 supplements
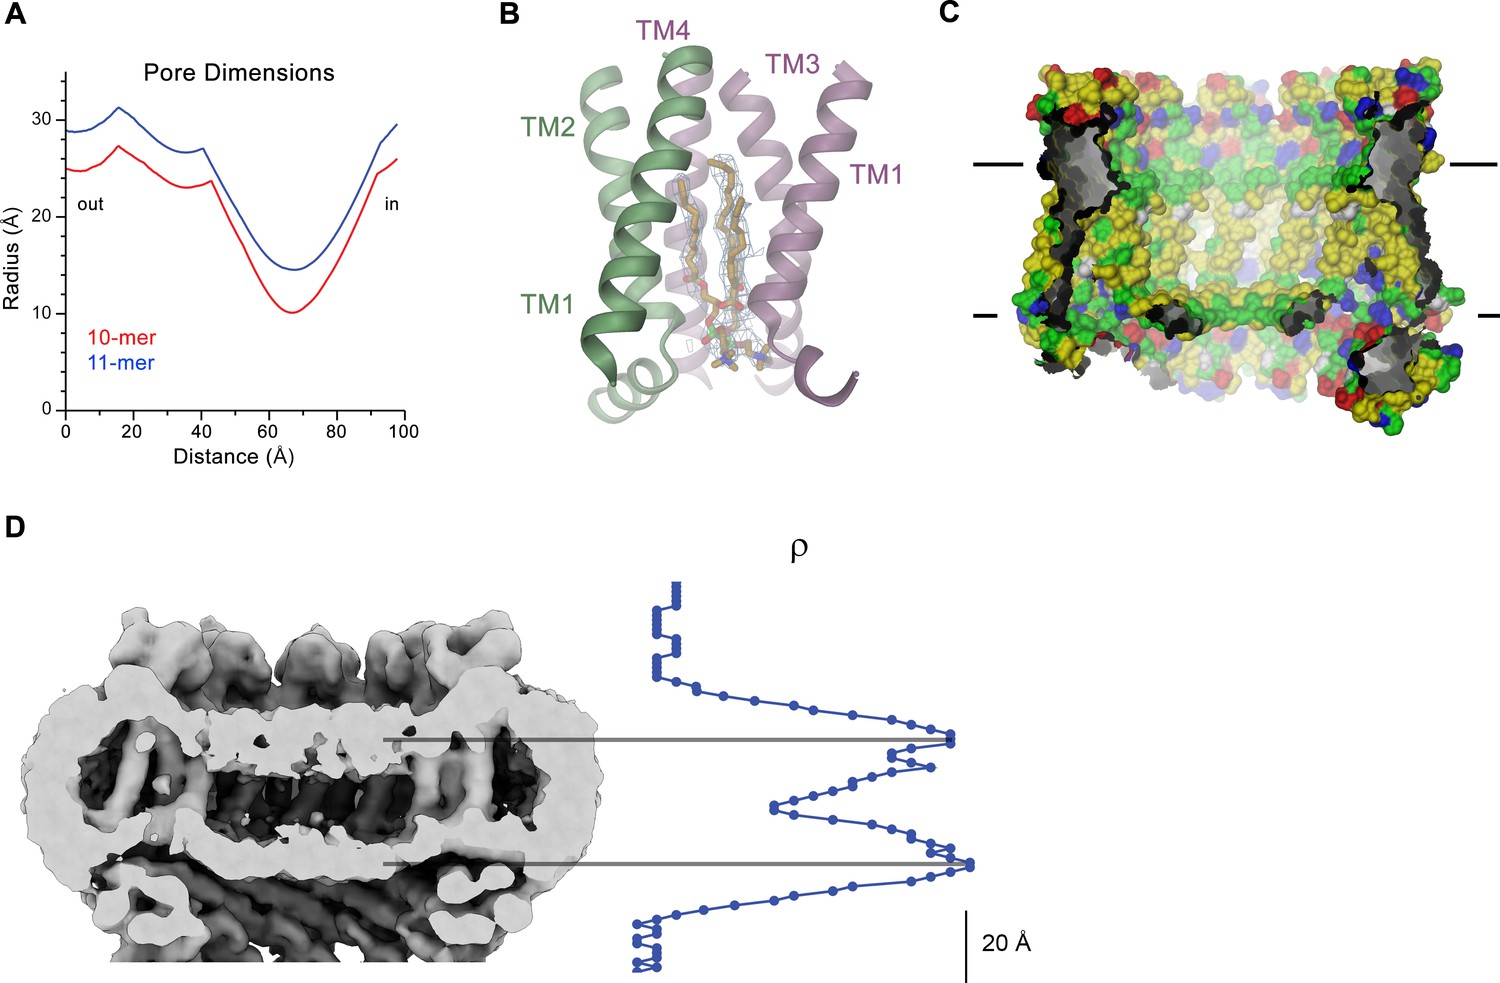
CALHM4 pore properties and lipid interactions.
(A), Pore radius of the CALHM4 decamer (red) and undecamer (blue) as calculated in HOLE (Smart et al., 1996). (B) Two phosphatidylcholine molecules modeled into residual cryo-EM density (blue mesh) in a cavity at the interface between neighboring α-helices TM1. Secondary structure elements are indicated. (C) Chemical properties of residues lining the pore of the CALHM4 channel. Shown is a slice through the pore viewed from within the membrane. The protein is displayed as molecular surface. Hydrophobic residues are colored in yellow, polar residues in green, acidic residues in red and basic residues in blue. (D) Slice through the pore region of the CALHM4 undecamer viewed from within the membrane. Shown is non-averaged density in a single copy of the undecameric CALHM4 channel pair at low contour to highlight the location of increased density within the pore corresponding to a bilayer of either phospholipids or detergents. A plot of the density along the pore axis showing two maxima that are separated by the expected distance between the headgroup regions of a lipid bilayer is shown right. B, D, Displayed cryo-EM density refers to data from the undecameric channel in presence of Ca2+.
Figure 6—figure supplement 1
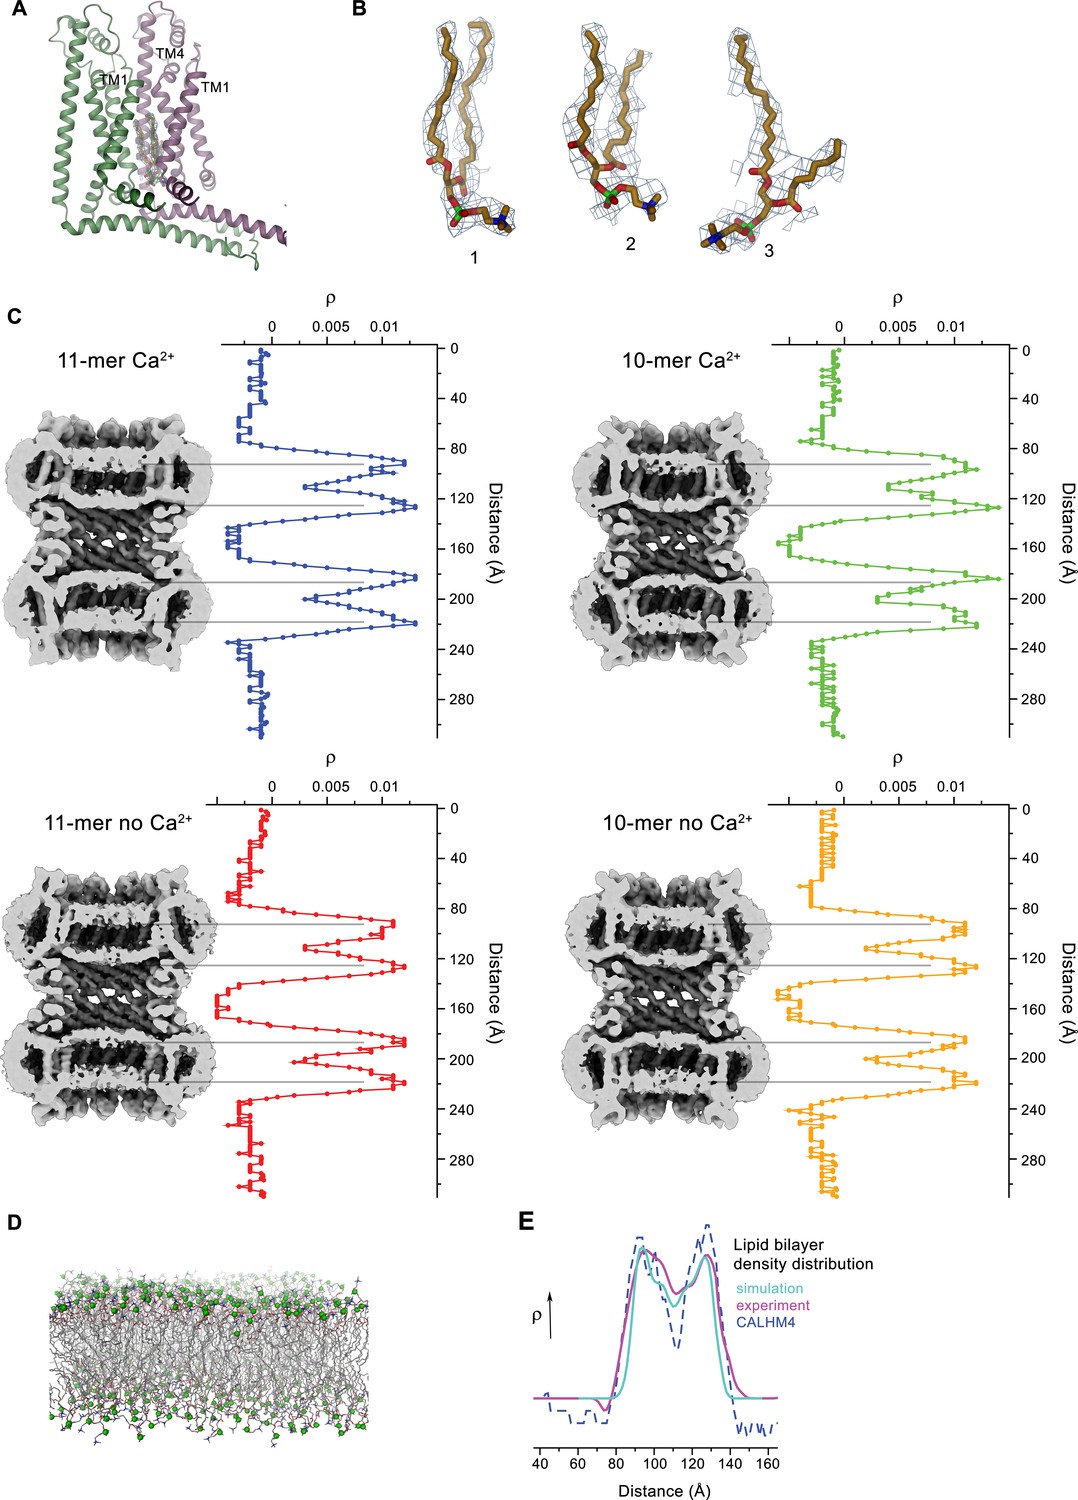
Lipid interactions in the pore of CALHM4.
(A) Interface between α-helices TM1 of two neighboring subunits with two bound lipid molecules. View is similar as in Figure 6A. (B) Lipids modeled into residual electron density at the interface displayed in A. Lipids 2 and 3 could occupy the cavity at the same time. 1 shows alternative interpretation of the density with a single lipid. A, B, Displayed cryo-EM density refers to data from the undecameric channel in presence of Ca2+. (C) Slices through the pore regions of interacting CALHM4 channel pairs as observed in different datasets. Proteins are viewed from within the membrane. Shown is non-averaged density at low contour (left). The distribution (right) shows two equivalent regions of increased density corresponding to bilayers of either phospholipids or detergents residing in each channel. The pore-density displays very similar features in CALHM4 decamers and undecamers irrespective of the presence or absence of Ca2+. (D) Model membrane obtained from MD simulations shown as stick models with the phosphate atoms highlighted as green spheres. (E) Comparison of the observed pore density distribution (dashed blue line, CALHM4) to equivalent distributions obtained from membrane simulations (cyan, simulation) and cryo-EM data of liposomes (magenta, experiment). All distributions display equivalent features.
Figure 6—figure supplement 2
LC-MS analysis of co-purified lipids.
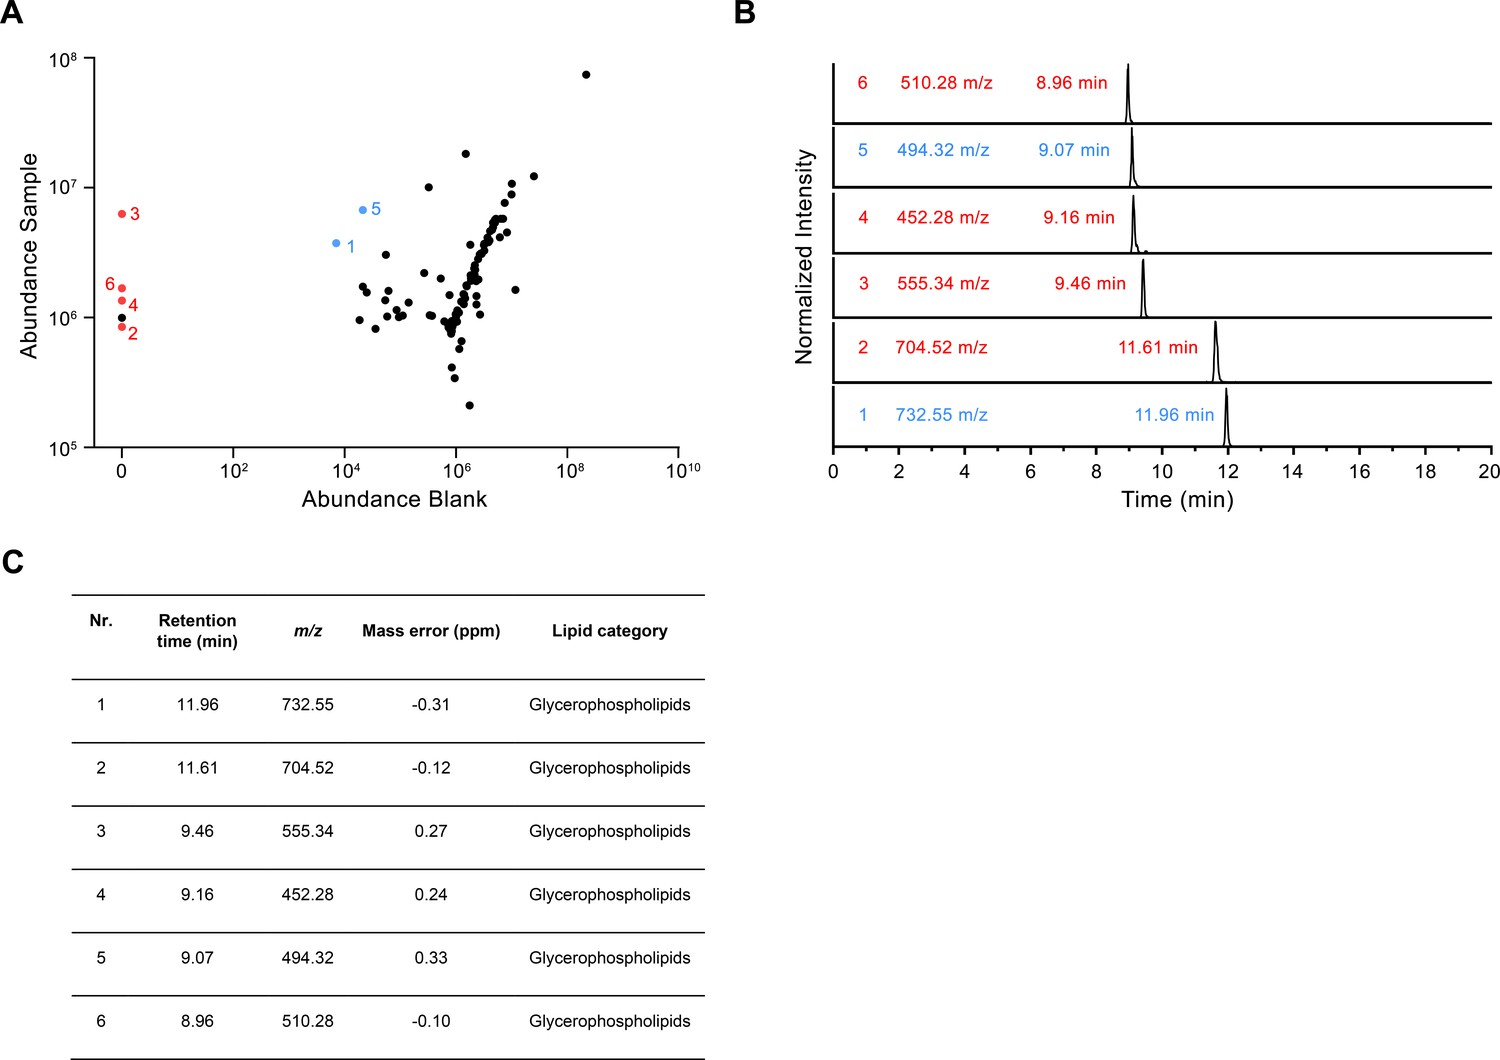
(A) Scatter plot depicting the relative amounts of the 100 most abundant hydrophobic compounds detected in the LC-MS analysis of the CALHM4 sample compared to the blank. Red dots represent compounds that are detected in the CALHM4 sample only and blue dots represent compounds that are highly enriched in the CALHM4 sample compared to the blank (fold change >100). (B) TIC chromatograms of compounds indicated in A, with assigned mass to charge ratio (m/z) and retention time. (C) Table summarizing the properties of compounds isolated from the CALHM4 sample. The chemical identity was identified in a search against the LipidMaps (LM) library with matching tolerances of 1 ppm in mass accuracy and >90% in isotope similarity.
Figure 7 with 1 supplement
CALHM6 structure.
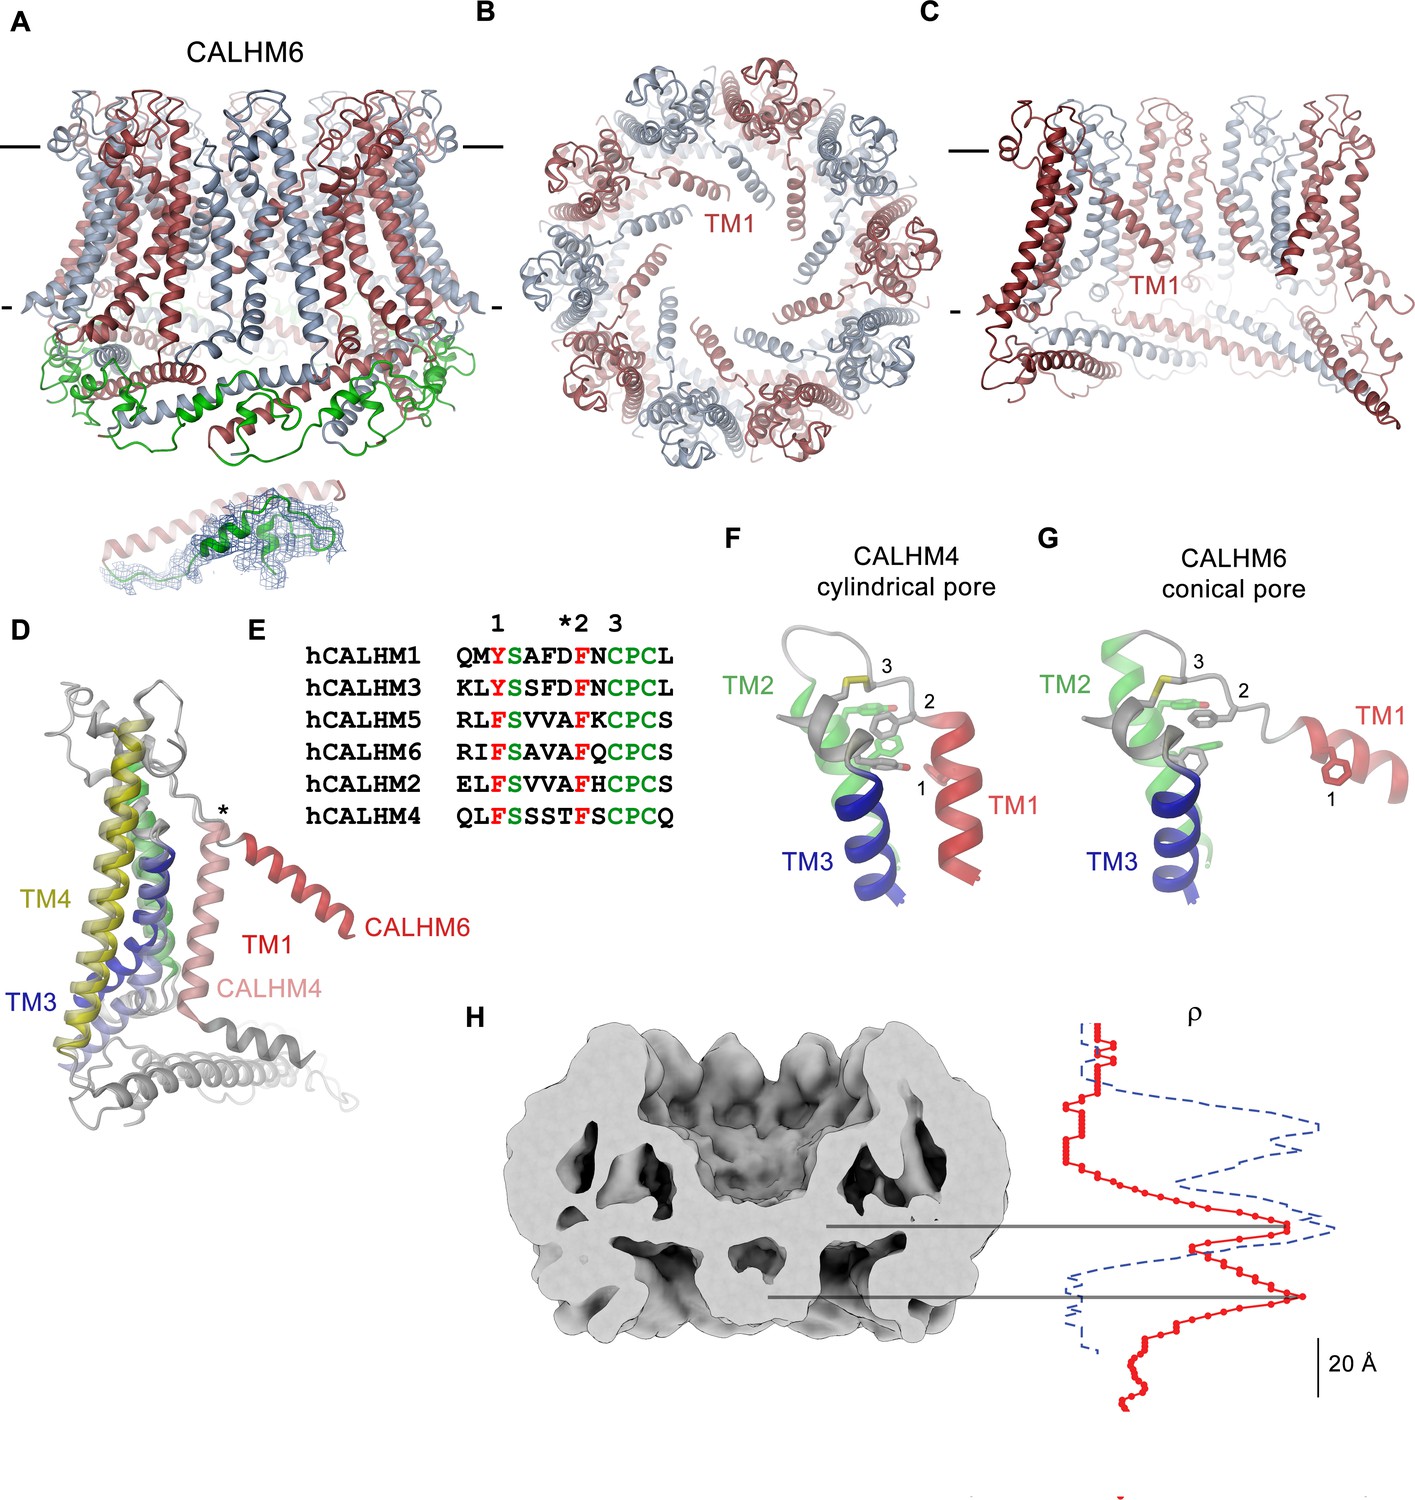
(A) Ribbon representation of the decameric CALHM6 structure viewed from within the membrane. Subunits are colored in red and light blue. The C-terminus following CTH is colored in green. Inset (below) shows a close-up of this region with cryo-EM density superimposed. (B) View of the CALHM structure from the extracellular side. (C) Slice through the pore of the CALHM6 structure. B, C, TM1, which has moved towards the pore axis is labeled. A, C, the membrane boundary is indicated. (D) Superposition of single subunits of the CALHM4 and CALHM6 structures illustrating conformational changes. Coloring is as in Figure 5A with CALHM4 shown in brighter shades of the same color. Secondary structure elements are labeled and the hinge for the movement of TM1 is indicated by an asterisk. (E) Sequence alignment of the end of TM1 and the following loop of CALHM paralogs. Selected conserved residues are colored in green and red. Numbering corresponds to residues indicated in panels F and G. Asterisk marks the hinge region displayed in D. Close-up of the extracellular region involved in conformational changes in (F), the cylindrical conformation displayed in CALHM4 and (G), the conical conformation displayed in CALHM6. Residues contributing to a cluster of aromatic residues on TM1-3 and a conserved disulfide bridge are shown as sticks. Selected positions highlighted in E are labeled. F, G, Coloring is as in Figure 5A. (H) Slice through the pore region of the CALHM6 decamer viewed from within the membrane. Shown is non-averaged density at low contour to highlight the location of diffuse density within the pore. A plot of the density along the pore axis of CALHM6 is shown in red, the corresponding density in CALHM4 is shown as a dashed blue line for comparison. The two maxima in the CALHM6 density are shifted towards the intracellular side. The density corresponding to the headgroups of the outer leaflet of the bilayer in CALHM4 is absent. Density at the location of the headgroup region at the inner leaflet of the bilayer and further towards the intracellular side could correspond to either lipids or to the poorly ordered N-terminus.
Figure 7—figure supplement 1
Features of the CALHM6 structure.
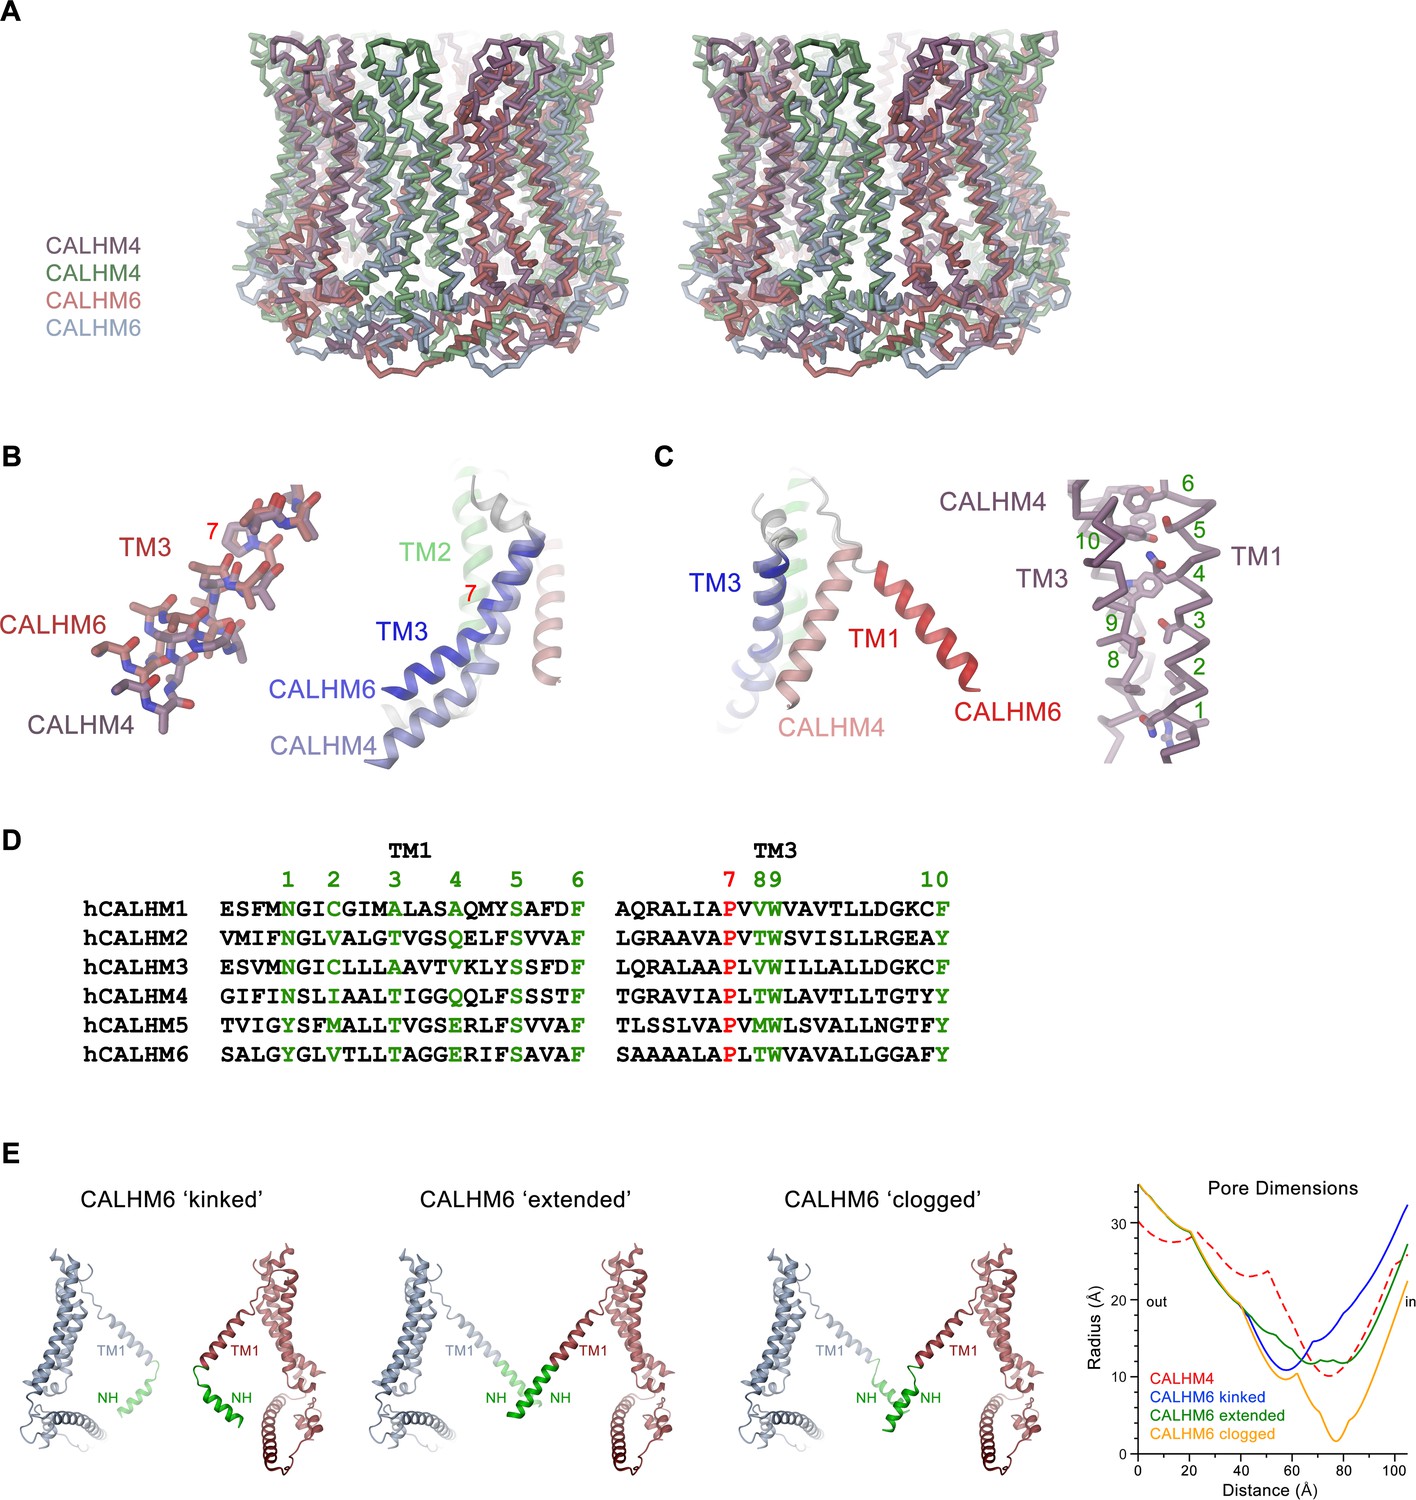
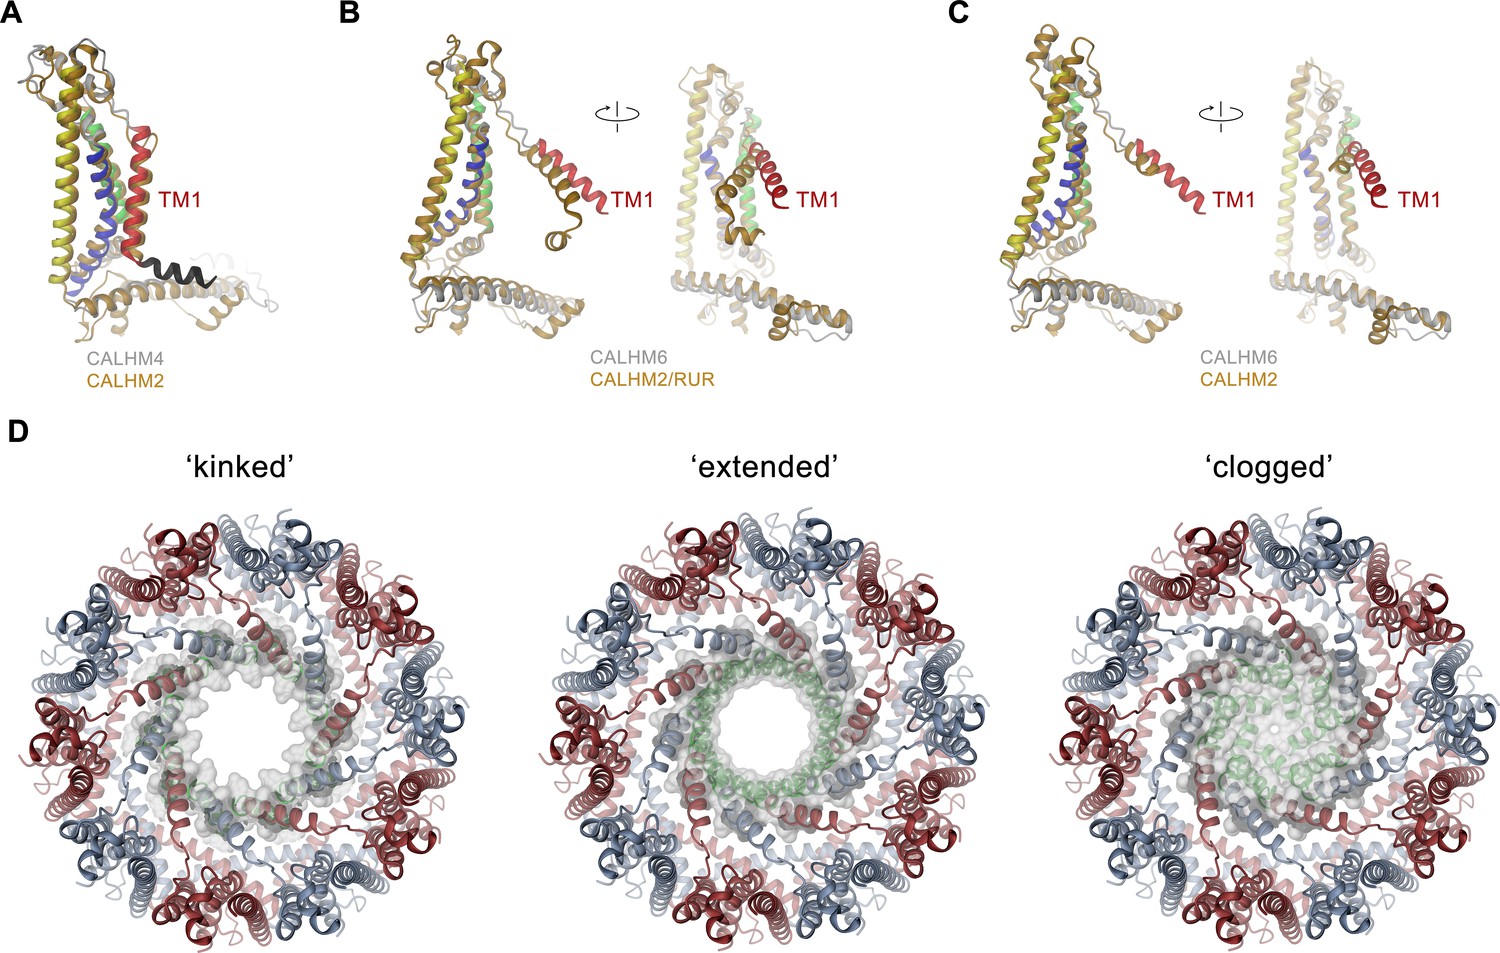
(A) Stereo view of a superposition of the CALHM4 and CALHM6 decamers. The proteins are shown as Cα-traces. Coloring is as in Figures 4 and 6. (B) Close-up of the conformational change in TM3 from the cylindrical conformation displayed in CALHM4 to the conical conformation displayed in CALHM6. Right panel shows ribbon, left panel a stick model of TM3 with side chains truncated to their Cβ position except for a conserved proline at the site of conformational changes where the entire side chain is displayed. (C) Close-up of the conformational change of TM1 with molecules displayed as ribbons (left) and interaction region of TM1 and TM3 in the CALHM4 structure with the protein shown as Cα trace and side chains of interacting residues as sticks (right). B and C, coloring of ribbons is as in Figure 7D with secondary structure elements in CALHM4 shown in brighter shades of the same color. (D) Sequence alignments of TM1 and TM3 of different CALHM paralogs. The conserved proline displayed in B is colored in red, selected residues at the TM1 TM3 interaction interface displayed in C are colored in green. B, C, Numbering corresponds to positions labeled in D. (E) Hypothetical pore shapes of the conical conformation displayed in the CALHM6 structure. The disordered N-terminal helix NH (green) was modeled in different conformations. Left, ‘kinked’ conformation where the mutual relationship between TM1 and NH is as in CALHM4, center left, ‘extended’ conformation where NH has changed its conformation to extend the TM1 helix. Center right, ‘clogged’ conformation where the mobile NH helix has moved towards the pore axis. The 10-fold symmetry is maintained in the ‘kinked’ and ‘extended’ conformations and broken for NH in the ‘clogged’ conformation to improve protein interactions. Opposite subunits of the decameric structures are displayed. Right, pore dimensions of the different modeled conformations of CALHM6 calculated with HOLE (Smart et al., 1996) compared to the CALHM4 decamer (red dashed) display similar constricting pore radius as for CALHM4 for ‘kinked’ and ‘extended’ conformations and an occluded pore in case of the ‘clogged’ conformation.
Figure 8 with 1 supplement

Hypothetical gating mechanisms.
Schematic illustration of hypothetical gating mechanisms of large CALHM channels. Left, ‘protein gate’. The gate impeding ion conduction of large CALHM channels (i.e. CALHM2, 4, 6) in the closed state is formed by the N-terminus of the protein, which closes the pore as observed in the modeled ‘clogged’ conformation of CALHM6 (top). In this case the conical conformation of CALHM6 would display a closed pore and the cylindrical conformation (bottom) an open pore. Right, ‘lipid gate’. The gate impeding ion conduction of large CALHM channels in the closed state is formed by lipids assembling as a bilayer within the protein, which impedes ion conduction. Since bilayer formation is facilitated in the cylindrical conformation of CALHM4, this structure represents a closed pore (top) whereas the structure of the bilayer would be disturbed in the conical conformation of CALHM6 (bottom). Since both the ‘kinked’ and ‘extended’ pore conformations of CALHM6 show a large opening, these conformations could represent open pores.
Figure 8—figure supplement 1
Comparison of pore conformations.
(A) Comparison of the structures of subunits determined in this study to recent structures of CALHM2. Left, structure of the cylindrical conformation of CALHM4 superimposed on the equivalent conformation of CALHM2 (PDBID 6UIV). Superposition of the conical CALHM6 conformation with (B), the CALHM2 structure in complex with the putative inhibitor ruthenium red (RUR) (PDBID 6UIW) and (C), an equivalent conformation in the absence of RUR (PDBID 6UIX), both showing a different orientation of TM1. A-C, CALHM4 and 6 structures are colored as in Figure 5A, CALHM2 structures are colored in beige. B and C show two views of the subunit with indicated mutual relationship. (D) View of the three potential conformations of CALHM6 with modeled N-termini (green) as defined in Figure 7—figure supplement 1E. The molecular surface at the pore constriction is shown superimposed on the structure. A-D, proteins are displayed as ribbons.
Videos
Video 1
Cryo-EM density map of a single subunit of CALHM4 obtained in absence of Ca2+.
Shown is the cryo-EM map of the protein in detergent with the atomic model superimposed.
Video 2
Cryo-EM density map of a single subunit of CALHM6.
Shown is the cryo-EM map of the protein in detergent with the atomic model superimposed.
Video 3
Morph between the cylindrical pore conformation of CALHM4 and the conical pore conformation displayed in the ‘extended’ model of CALHM6.
In the latter the N-terminal α-helix NH is modeled in continuation of TM1 resulting in a constricting pore diameter similar to CALHM4.
Video 4
Morph of the extracellular region of a single CALHM subunit involved in conformational changes between the cylindrical conformation displayed in CALHM4 and the conical conformation displayed in CALHM6.
Residues contributing to a cluster of aromatic residues on TM1-2 and a conserved disulfide bridge are shown as sticks. Coloring is as in Figure 5A.
Tables
Table 1
Cryo-EM data collection, refinement and validation statistics of CALHM4.
| Dataset 1 | Dataset 2 | ||||||
|---|---|---|---|---|---|---|---|
| CALHM4_Ca2+ | CALHM4_Ca2+_free | ||||||
| 10-mer | 11-mer | 10-mer | 11-mer | ||||
| Data collection and processing | |||||||
| Microscope | FEI Tecnai G2 Polara | FEI Tecnai G2 Polara | |||||
| Camera | Gatan K2 Summit + GIF | Gatan K2 Summit + GIF | |||||
| Magnification | 37,313 | 37,313 | |||||
| Voltage (kV) | 300 | 300 | |||||
| Electron exposure (e–/Å2) | 40 | 32 | |||||
| Defocus range (μm) | -0.8 to -3.0 | -0.8 to -3.0 | |||||
| Pixel size (Å) | 1.34 | 1.34 | |||||
| Initial particle images (no.) | 422,281 | 576,841 | |||||
| Final particle images (no.) | 35,229 | 70,4581* | 27,094 | 54,1881* | 21,264 | 25,703 | 51,4061* |
| Reconstruction strategy2† | Std | Loc | Std | Loc | Std | Std | Loc |
| Symmetry imposed | D10 | C10 | D11 | C11 | D10 | D11 | C11 |
| Global map resolution (Å) FSC threshold 0.143 | 4.24 | 4.07 | 4.02 | 3.92 | 4.07 | 3.82 | 3.69 |
| Map resolution range (Å) | 4.0-5.1 | 3.8-5.0 | 3.8-5.0 | 3.8-5.0 | 3.8-5.0 | 3.6-4.4 | 3.5-4.3 |
| Map sharpening B factor (Å2) | -200 | -200 | -185 | -177 | -169 | -145 | -126 |
| EMDB identifier | 10920 | 10920*‡ | 10921 | 10921*‡ | 10917 | 10919 | 10919*‡ |
| Refinement | N/A | N/A | N/A | ||||
| Model resolution (Å) FSC threshold 0.5 | 4.2 | 4.0 | 4.0 | 3.7 | |||
| Model composition Non-hydrogen atoms Protein residues | 41,620 5,340 | 45,782 5,874 | 41,620 5,340 | 45,782 5,874 | |||
| B factors (Å2) Protein | 62 | 61 | 34 | 51 | |||
| R.m.s. deviations Bond lengths (Å) Bond angles (°) | 0.005 0.694 | 0.005 0.672 | 0.003 0.550 | 0.005 0.754 | |||
| Validation MolProbity score Clash score Poor rotamers (%) | 1.53 10.19 0 | 1.57 6.50 0 | 1.48 7.59 0 | 1.73 9.79 0 | |||
| Ramachandran plot Favored (%) Allowed (%) Disallowed (%) | 98.10 1.90 0 | 96.66 3.34 0 | 97.72 2.28 0 | 96.65 3.35 0 | |||
| PDB identifier | 6YTO | 6YTQ | 6YTK | 6YTL | |||
-
*Subparticles from localized reconstruction.
†Std – standard reconstruction; Loc – localized reconstruction.
-
‡Higher-resolution map from localized reconstruction submitted as an additional map under the same entry as the main map.
Table 2
Cryo-EM data collection, refinement and validation statistics of CALHM6 and CALHM2.
| Dataset 3 CALHM6_Ca2+ | Dataset 4 CALHM2_Ca2+ | ||
|---|---|---|---|
| 10-mer | 11-mer | ||
| Data collection and processing | |||
| Microscope | FEI Tecnai G2 Polara | FEI Tecnai G2 Polara | |
| Camera | Gatan K2 Summit + GIF | Gatan K2 Summit + GIF | |
| Magnification | 37,313 | 37,313 | |
| Voltage (kV) | 300 | 300 | |
| Electron exposure (e–/Å2) | 40 | 55 | |
| Defocus range (μm) | -0.8 to -3.0 | -0.8 to -3.0 | |
| Pixel size (Å) | 1.34 | 1.34 | |
| Initial particle images (no.) | 216,859 | 417,612 | |
| Final particle images (no.) | 98,104 | 63,310 | N/A |
| Reconstruction strategy1* | Std | Std | Std |
| Symmetry imposed | C10 | C11 | C1 |
| Global map resolution (Å) FSC threshold 0.143 | 4.39 | 6.23 | N/A |
| Map resolution range (Å) | 4.3-5.1 | 5.0-7.0 | N/A |
| Map sharpening B factor (Å2) | -259 | -435 | N/A |
| EMDB identifier | 10924 | 10925 | N/A |
| Refinement | N/A | ||
| Model resolution (Å) FSC threshold 0.5 | 4.4 | 6.6 | |
| Model composition Non-hydrogen atoms Protein residues | 19,560 2,520 | 21,516 2,772 | |
| B factors (Å2) Protein | 85 | 86 | |
| R.m.s. deviations Bond lengths (Å) Bond angles (°) | 0.004 0.773 | 0.004 0.822 | |
| Validation MolProbity score Clash score Poor rotamers (%) | 2.14 16.18 0 | 2.15 17.75 0 | |
| Ramachandran plot Favored (%) Allowed (%) Disallowed (%) | 93.55 6.05 0.40 | 93.95 5.65 0.40 | |
| PDB identifier | 6YTV | 6YTX | |
-
*Std – standard reconstruction; Loc – localized reconstruction.
Additional files
-
Supplementary file 1
Key resources table.
- https://cdn.elifesciences.org/articles/55853/elife-55853-supp1-v2.docx
-
Transparent reporting form
- https://cdn.elifesciences.org/articles/55853/elife-55853-transrepform-v2.pdf
Download links
A two-part list of links to download the article, or parts of the article, in various formats.
Downloads (link to download the article as PDF)
Open citations (links to open the citations from this article in various online reference manager services)
Cite this article (links to download the citations from this article in formats compatible with various reference manager tools)
Cryo-EM structures and functional properties of CALHM channels of the human placenta
eLife 9:e55853.
https://doi.org/10.7554/eLife.55853


